A Methodology for Assessing the Sustainability of Hydrogen Production from Solid Fuels


Abstract
:1. Introduction
2. Background: Methodologies for Assessing Sustainability of Energy Systems
3. Sustainability Assessment Methodology and Indicators
3.1. Sustainability Assessment Methodology
3.2. Sustainability Indicators
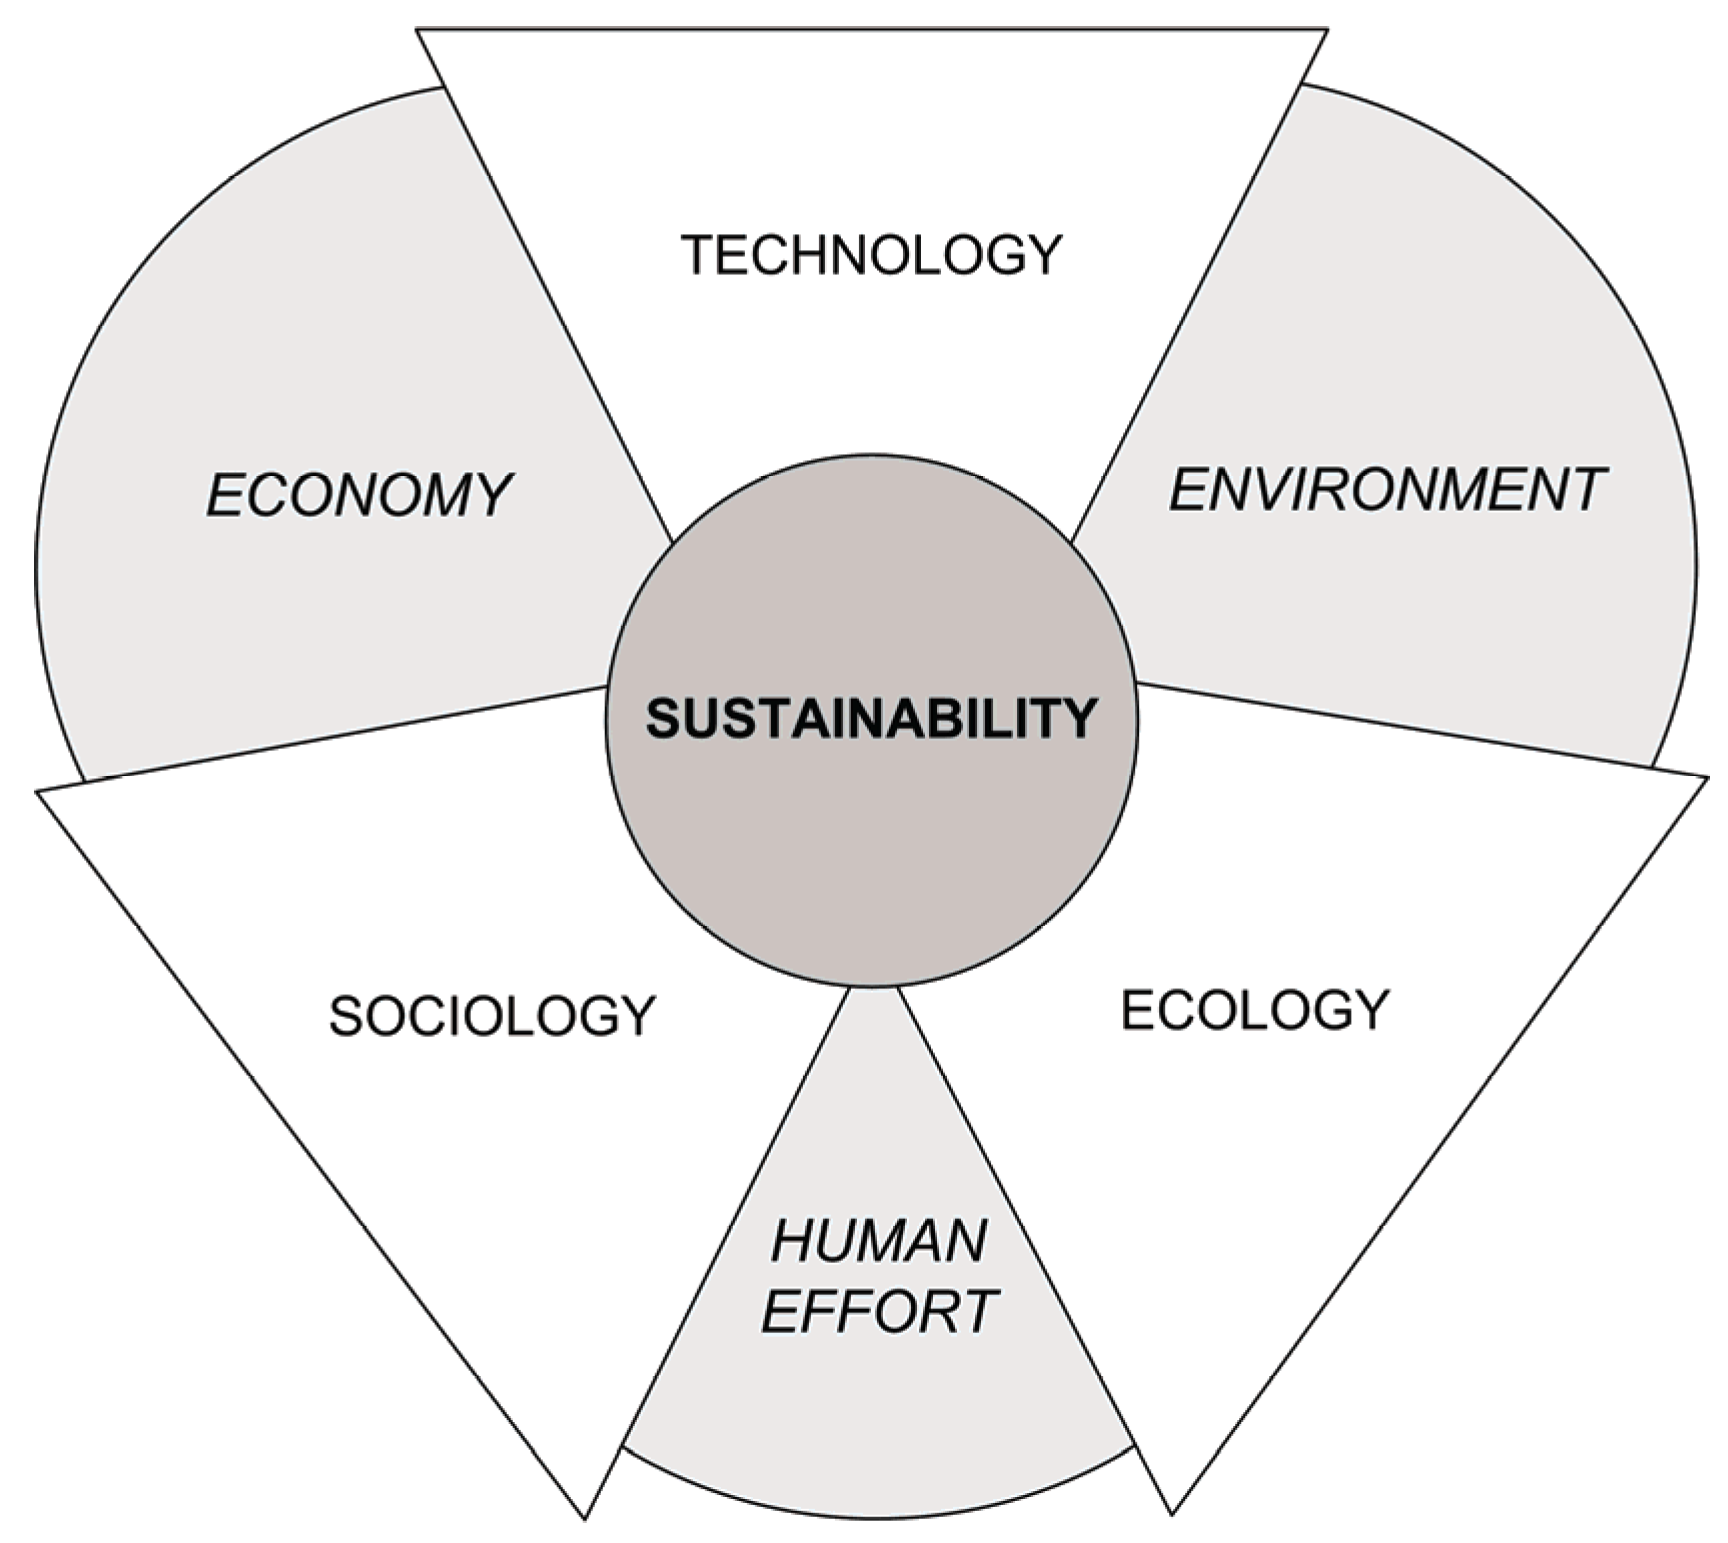
3.3. Linking of Sustainability Dimensions

4. Ecological Indicators
- Availability: Sustainable availability of the element within the relevant energy market [1,2,3,4,5,6,7,29,30]. The highest value of 1 is assigned for such elements or processes that are available in the local market at competitive price and the lowest value of 0 is assigned for lack of availability. For example, coals are abundant in Canada, the USA, Poland and other countries [4], providing ample supplies for longer periods of time at low costs. The sustainability index is higher for any commercially available process.
- Adaptability: Requiring fewer processes to acquire and process the element, minimizing waste generation [1,3,31,32,33,34]. A value of 1 is assigned if an element or process is highly adaptable and 0 for the least adaptable item in a system. For example, ecological sustainability is higher for solids handling processes than for gasification process, since the former is already an established industry serving the coal power plants [1,35].
- Environmental capacity: Length of time the global ecosystem can supply and support the element or process, without creating significant imbalances within the global ecosystem [4,6,35,36,37,38,39]. A value of 1 is assigned if an element or process can be sustained for a long time even with an increase in demand for it in the market place. A value of 0 is assigned if little of the resource is available in the local market and it impacts the ecosystem significantly. For example, a process which is capable of recycling is assigned a higher index than a process that has less probability for reusing some of its wastes or by-products.
- Timeline: Newness or maturity of the element or process, weighted by its evolution [5,29,40,41] within the market place. A value of 1 denotes that a well established process that has greatly evolved since its creation, while a value of 0 denotes that the element is “fossilized” and has little chance for further improvement. For example, commercial gasification is a mature technology with less opportunity for major improvements or evolution.
- Material rate: Rate at which the element/process or products for and from the element/process can be procured [4,30,37,38,42,43,44], accounting for the effectiveness of raw material and product distribution networks. A value of 1 is assigned to the best network and 0 for the worst. For example, coals have higher material rate sustainability index (up to 0.9) than biomasses (up to 0.5), due to the well established network of mining and distribution.
- Energy rate: Rate at which energy can be supplied by the element or process [4,30,45,46]. A value of 1 denotes a high energy supply rate and 0 a low energy supply rate. This indicator measures the ecological energy density for an element or process, the amount of energy available per unit volume of space per time period. For example, combustion processes have a very high energy rate compared to other process due to higher rate of chemical reaction. Coals have a high energy rate in that they can deliver more energy per unit mass and time than biomasses. Although this indicator value implies that combustion is advantageous based on this individual index—in terms of delivering a high energy rate, the value does not imply that combustion is more sustainable overall, as the other indicators need to be evaluated and combined to make that determination.
- Pollution rate: Rate of pollution or emissions associated with the element or process [1,2,3,4,24,37,47,48,49,50]. A value of 1 is assigned if there is a low pollution rate and a value of 0 if there is high pollution rate. For coal combustion, for example, technologies for removal of sulphur compounds (SO2, H2S, COS) are well evolved (suggesting that they help in reducing the rate of pollution), so they merit a higher index value than CO2 separation and storage, which is not yet commercialized.
- Location: Nearness of the element/process from the point of use [13,33,36,51]. A value of 1 is assigned if the source is near to the point of use and 0 if it is far. The system can be placed near to the main solid fuel source. If the other elements and processes are to be moved to the system location, its operating and maintenance costs increase. Thus for coals and other mine-based solid fuels, low values are assigned here.
- Ecological balance: Element or process that creates an imbalance in the local ecosystem. This measure also indicates the level of recyclability or reuse of the element or process [46,52,53]. A value of 1 is assigned if most of the element or process is recyclable or reusable and a value of 0 is assigned if recycling is not achievable. For example, coal scores a 0 in this regard whereas renewable biomass scores a higher value, which also depends on availability.
- Endurance: Element work load or demand factor and a process requiring equipment maintenance [1,2,3,4,46,52,53]. A value of 1 is assigned if the element or process has a high load and demand with lower maintenance and a value of 0 is assigned when there is high maintenance irrespective of high or low load. For elements such as fuels that require high equipment maintenance, a lower index value is assigned for this sustainability indicator.
5. Sociological Indicators
- Economics: Economic and financial benefits from the element or process [5,12,13,23,29,31,33,45,54,55,56,57]. A value of 1 is assigned if maximum net economic benefit derived from the final product (hydrogen) and a value of 0 is assigned when there is a net economic loss from transforming solid fuels to hydrogen. For example, commercial gasification provides more overall economic benefit due to its higher volume of hydrogen production in less time, than solar thermal gasification.
- Policy: Government policies and implementation trends [1,5,7,31,32,35,36,38,39] that affect the availability of an element or development of a process. A value of 1 is assigned if the policies and implementation strategies support the sustainability of an element or process and a value of 0 is assigned if they act as hindrances. Values are chosen based on advancements in technology in dealing with energy, environment and economics of processes and ecological sustainability of solid fuels for hydrogen production. For example, a government initiative to increase funding for biomass research helps in improving the sustainability of such hydrogen production processes.
- Human resources: Level of direct human work input in procuring, manufacturing, installing and operating an element or process [5,44,46,50,52,53]. A value of 1 is assigned if more human work is involved, owing to the job creation and resulting economic benefit for society. A value of 0 is assigned if no direct human work is involved with an element or process. For example, solids handling and waste disposal involve more human labour than gasification or combustion (except during installation and maintenance).
- Public opinion: Public opinion regarding the nature and operation/behaviour of an element or process [15,18,22,44]. A value of 1 is assigned if the majority of the population have a positive opinion relating to an element or process and a value of 0 is assigned if there is a negative opinion. For example, CO2 emissions from fossil fuels have been highlighted by the media and government bodies as the main cause of climate change [6], so any element or process which does not emit CO2 or reduces its concentration in the atmosphere is assigned a higher value since it generates positive public opinion. Public opinion often transforms into government policies, which can lead to support for measures that curb harmful emissions.
- Environmental obligation: Social expectations regarding the environmental obligation of an element or a process and its by-products to be benign to the environment in which society functions [6,29,33,37,47]. A value of 1 is assigned if the operation and by-products of the element/process are environmentally benign and a value of 0 is assigned if a process or element is necessary to the system’s operation but harmful to the environment. This indicator encourages the elimination of process that requires additional measures to protect the environment. For example, converting CO2 to biodiesel using sunlight or nutrients from the biogas by-product associated with using algae is environmentally benign in that it not only consumes CO2 but also provides an alternate fuel. So, converting CO2 to algae is assigned a higher social index value than other CO2 sequestration methods like underground CO2 storage that require further processes.
- Living standards: Impact of an element or process on human living standards, focusing on basic requirements such as food, clothing and shelter [29,58]. A value of 1 is assigned if an element or process within the system improves human living standards indirectly. A value of 0 is assigned if an element or process does not improve basic living standards. For example, coals are assigned a higher index than biomass due to their higher energy densities, which helps in producing more hydrogen; this in turn can provide additional goods and services compared to biomass, thereby improving basic human living standards. Even with high energy and economic penalties for pollution control measures, coal can still produce more hydrogen than biomass [29].
- Human convenience: Impact of an element or process on human convenience (higher living standards and comforts beyond the necessity for basic living standards) [29,58]. A value of 1 is assigned if an element or process within the system helps in providing human comforts and a value of 0 is assigned if an element or process does not provide human comfort, through additional hydrogen production. The index values for solid fuels are similar to those for the previous indicator (#6). But for some processes, the index value may be lower, e.g., if more fuel is used due to increased secondary and environmental protection in producing hydrogen.
- Future development: Possibilities for future economic and social growth based on the nature of an element or process [1,2,3,4,5,6,45,54,55,56,57]. A value of 1 is assigned if using the element or process increases the possibility for societal development. A value of 0 is assigned if using the element or process within the proposed system does not provide such opportunities, even in the local community.
- Per capita demand: Impact of population/customer demand on producing hydrogen with the element or process, affecting its sustainably [6,29,58]. A value of 1 is assigned if fewer industries use the element or process, thereby increasing market availability and, possibly, price competitiveness. A value of 0 is assigned when the element or process is used by many industries, which hinders availability and sustainability. For example, coals are mostly used for power generation and in steel industries and, based on its per capita availability, are assigned high values. But biomass per capita availability is small and is mostly used in co-combustion processes or as manure, reducing the per capita demand sustainability index.
- Lobbying: External influences on the impact of an element or process, through political and economic lobbies that can affect government sustainability policies [29,32,37,38,41,43,59]. A value of 1 is assigned if the process or element has effective lobbying and a value of 0 is assigned if no lobbying is attempted. For example, the coal industry is established and is engaged in many markets in political lobbying to maintain its use and to promote supportive government policies [59]. In recent years, green energy programs have received extensive lobbying due to their potential long-term contributions in mitigating climate change, processes associated with green energy policies are assigned higher index values.
6. Technological Indicators
- Net energy consumption: Energy requirement of the element to transport it to the point of use and utilize it in the operation of processes [12,29,34,40,46,54,56,58,60,61,62,63]. A value of 1 is assigned if the element or process requires little energy and a value of 0 if it requires much energy. For example, processes that generate energy (e.g., electricity generation) have higher index values than those that consume energy.
- Exergy: Relative exergy of the element or process with respect to the system and the environment [29,30]. A value of 1 is assigned for an element with high exergy or for a process that has lower exergy destruction and a value of 0 is assigned for an element with low exergy or for a process with high exergy destruction. For example, combustion has higher exergy destruction than gasification, so combustion processes are assigned lower index values for exergy.
- Efficiency: Efficiency (ratio of desired output to input, considering both energy and exergy) of element or process and related technology in hydrogen production [46,52,53]. A value of 1 is assigned for processes having high efficiencies (above 0.9) and a value of 0 is assigned for processes with very low efficiencies (below 0.1). For example, commercial electrolysers have energy efficiencies ranging typically from 0.5 to 0.7 [29].
- Design: Impact of design of a process or an element on sustainable operation of the system [7,28,31,32,33,63]. A value of 1 is assigned for the best design, taken to be a design that, among other factors, improves the overall performance of the system and minimizes waste generation. A value of 0 is assigned for the worst design. For example, a low index value (0.3) is assigned for ultra superheated steam (USS) gasification since it is still in the research phase but has significant future potential.
- Research: Impact of research on future developments of a process or an element that affect the ability of a system to produce hydrogen sustainably [7,28,29,31,32,33,35,63]. A value of 1 is assigned for an element or process with high probability for successful research and a value of 0 is assigned when there is a low probability for research advances. For example, the amount of research for plasma gasification and CO2-to-algae conversion processes, due to technology prospects and incentives, is sufficient to merit higher index values.
- Demonstration: Capacity for demonstration of the impact of an element or a process in contributing to hydrogen production in the system [3,29,54,64,65,66,67,68]. A value of 1 is assigned if the process or element has already been demonstrated, while a value of 0 is assigned if there is a need for demonstration to establish the capability of the technology. For example, commercial gasification and solids handling processes have high index values, since they are commercially established processes in terms of operation and performance, compared to the ones undergoing research like CO2-to-algae conversion or USS gasification.
- Commercialization: Potential for process or element technology to become commercially viable, enabling sustainable operation within a system [1,2,3,4,5,23,29,34,35,40,69]. A value of 1 is assigned for processes or elements with high potential for commercialization and a value of 0 is assigned for processes with little commercialization potential. For example, USS gasification is assigned a low value (0.4) since it has limited potential for commercial development due to size constraints (i.e., large-scale operation has low efficiencies which increase operating costs). Conventional gasification is assigned a high value (0.9) since it operates commercially on a large-scale and is the fastest growing segment within the coal industry due to its ability to produce synthetic gases [34].
- Impact: Impact of actual process or element on sustainability of the system for producing hydrogen [12,23,29,35,45,46,62,69,70,71,72]. A value of 1 is assigned to processes or elements that have a high impact on the system’s performance and a value of 0 is assigned to those that have low impact. For example, within the commercial gasification process, the air separation unit (ASU) is assigned a higher value than the ash handling system because it is crucial to a high-efficiency solid-to-gas conversion as well as effective downstream CO2 capture. The ASU therefore has a significant impact on improving the overall efficiency of the system for producing hydrogen, whereas the ash handling system, although essential, does not impact the system efficiency as much as the ASU.
- Evolution: Capacity for process technology to improve, adapt and grow in the market place [4,5,7,29,31,35,38,50,59]. A value of 1 is assigned to processes that have high opportunities for evolving to increase efficiency and decrease operating and maintenance costs, while a value of 0 is assigned to processes with little opportunity for such development. For example, commercial gasification has little chance for evolution, whereas supercritical water gasification is expected to evolve into an efficient process for large-scale hydrogen production that is useful for effective disposal of sewage water [71].
- Environmental limitations: Limitations of process technology arising from harmful impact on the environment while operating within the system [6,32,33,36,47,66,73,74]. A value of 1 is assigned to processes with few limitations in operation due to environmental damage, while a value of 0 is assigned to the processes with high limitations in operation due to their environment impacts. For example, devices that contribute to pollution control within the system, such as the ash collector, syngas cleaner and membrane separator, have high index values since they are subject to few environmental limitations and they contribute to environmental preservation.
7. Advantages and Disadvantages of the Methodology
8. Illustrative Example: Hydrogen Production from Coal and Biomass

| ECOLOGICAL INDICATORS | |||||||||||
|---|---|---|---|---|---|---|---|---|---|---|---|
| 1 | 2 | 3 | 4 | 5 | 6 | 7 | 8 | 9 | 10 | Total | |
| SOLID FUELS | Availability | Adaptability | Environmental capacity | Timeline | Material rate | Energy rate | Pollution rate | Location | Ecological balance | Endurance | ECO-CENTRIC |
| COALS | 0.80 | 0.15 | 0.20 | 0.13 | 0.78 | 0.63 | 0.10 | 0.35 | 0.00 | 0.75 | 0.39 |
| Anthracite coal | 0.5 | 0.1 | 0.2 | 0.1 | 0.7 | 0.8 | 0.1 | 0.2 | 0 | 0.5 | 0.32 |
| Bituminous coal | 0.8 | 0.1 | 0.2 | 0.1 | 0.7 | 0.7 | 0.1 | 0.3 | 0 | 0.8 | 0.38 |
| Sub-bituminous coal | 1 | 0.2 | 0.2 | 0.1 | 0.9 | 0.5 | 0.1 | 0.5 | 0 | 0.9 | 0.44 |
| Lignite or brown coal | 0.9 | 0.2 | 0.2 | 0.2 | 0.8 | 0.5 | 0.1 | 0.4 | 0 | 0.8 | 0.41 |
| BIOMASSES | 0.43 | 0.47 | 0.50 | 0.70 | 0.50 | 0.43 | 0.53 | 0.47 | 0.20 | 0.40 | 0.46 |
| Forest biomass | 0.5 | 0.5 | 0.5 | 0.6 | 0.5 | 0.4 | 0.5 | 0.4 | 0.1 | 0.3 | 0.43 |
| Farm biomass | 0.6 | 0.6 | 0.6 | 0.7 | 0.5 | 0.5 | 0.5 | 0.4 | 0.2 | 0.2 | 0.48 |
| Energy crops | 0.2 | 0.3 | 0.4 | 0.8 | 0.5 | 0.4 | 0.6 | 0.6 | 0.3 | 0.7 | 0.48 |
| SOCIOLOGICAL INDICATORS | |||||||||||
|---|---|---|---|---|---|---|---|---|---|---|---|
| 1 | 2 | 3 | 4 | 5 | 6 | 7 | 8 | 9 | 10 | Total | |
| SOLID FUELS | Economics | Policy | Human resource | Public opinion | Environmental obligation | Living standards | Human convenience | Future development | Per capita demand | Lobbying | SOCIO-CENTRIC |
| COALS | 0.60 | 0.50 | 0.70 | 0.10 | 0.10 | 0.70 | 0.70 | 0.50 | 0.80 | 0.80 | 0.55 |
| Anthracite coal | 0.6 | 0.5 | 0.7 | 0.1 | 0.1 | 0.7 | 0.7 | 0.5 | 0.8 | 0.8 | 0.55 |
| Bituminous coal | 0.6 | 0.5 | 0.7 | 0.1 | 0.1 | 0.7 | 0.7 | 0.5 | 0.8 | 0.8 | 0.55 |
| Sub-bituminous coal | 0.6 | 0.5 | 0.7 | 0.1 | 0.1 | 0.7 | 0.7 | 0.5 | 0.8 | 0.8 | 0.55 |
| Lignite or brown coal | 0.6 | 0.5 | 0.7 | 0.1 | 0.1 | 0.7 | 0.7 | 0.5 | 0.8 | 0.8 | 0.55 |
| BIOMASSES | 0.53 | 0.73 | 0.63 | 0.70 | 0.70 | 0.33 | 0.40 | 0.77 | 0.33 | 0.63 | 0.58 |
| Forest biomass | 0.7 | 0.8 | 0.6 | 0.8 | 0.7 | 0.3 | 0.3 | 0.8 | 0.4 | 0.6 | 0.60 |
| Farm biomass | 0.8 | 0.8 | 0.6 | 0.8 | 0.7 | 0.4 | 0.4 | 0.8 | 0.4 | 0.6 | 0.63 |
| Energy crops | 0.1 | 0.6 | 0.7 | 0.5 | 0.7 | 0.3 | 0.5 | 0.7 | 0.2 | 0.7 | 0.50 |
| TECHNOLOGICAL INDICATORS | |||||||||||
|---|---|---|---|---|---|---|---|---|---|---|---|
| 1 | 2 | 3 | 4 | 5 | 6 | 7 | 8 | 9 | 10 | Total | |
| SOLID FUELS | Energy consumption | Exergy | Efficiency | Design | Research | Demonstration | Commercialization | Impact | Evolution | Environmental limitations | TECHNO-CENTRIC |
| COALS | 0.55 | 0.75 | 0.60 | 0.60 | 0.60 | 0.60 | 0.60 | 0.70 | 0.70 | 0.53 | 0.62 |
| Anthracite coal | 0.5 | 0.9 | 0.6 | 0.6 | 0.6 | 0.6 | 0.6 | 0.7 | 0.7 | 0.4 | 0.62 |
| Bituminous coal | 0.6 | 0.8 | 0.6 | 0.6 | 0.6 | 0.6 | 0.6 | 0.7 | 0.7 | 0.5 | 0.63 |
| Sub-bituminous coal | 0.6 | 0.7 | 0.6 | 0.6 | 0.6 | 0.6 | 0.6 | 0.7 | 0.7 | 0.6 | 0.63 |
| Lignite or brown coal | 0.5 | 0.6 | 0.6 | 0.6 | 0.6 | 0.6 | 0.6 | 0.7 | 0.7 | 0.6 | 0.61 |
| BIOMASSES | 0.60 | 0.53 | 0.57 | 0.57 | 0.73 | 0.60 | 0.77 | 0.60 | 0.70 | 0.80 | 0.65 |
| Forest biomass | 0.6 | 0.5 | 0.5 | 0.5 | 0.7 | 0.5 | 0.7 | 0.6 | 0.5 | 0.7 | 0.58 |
| Farm biomass | 0.7 | 0.5 | 0.5 | 0.5 | 0.7 | 0.6 | 0.8 | 0.7 | 0.8 | 0.8 | 0.66 |
| Energy crops | 0.5 | 0.6 | 0.7 | 0.7 | 0.8 | 0.7 | 0.8 | 0.5 | 0.8 | 0.9 | 0.70 |


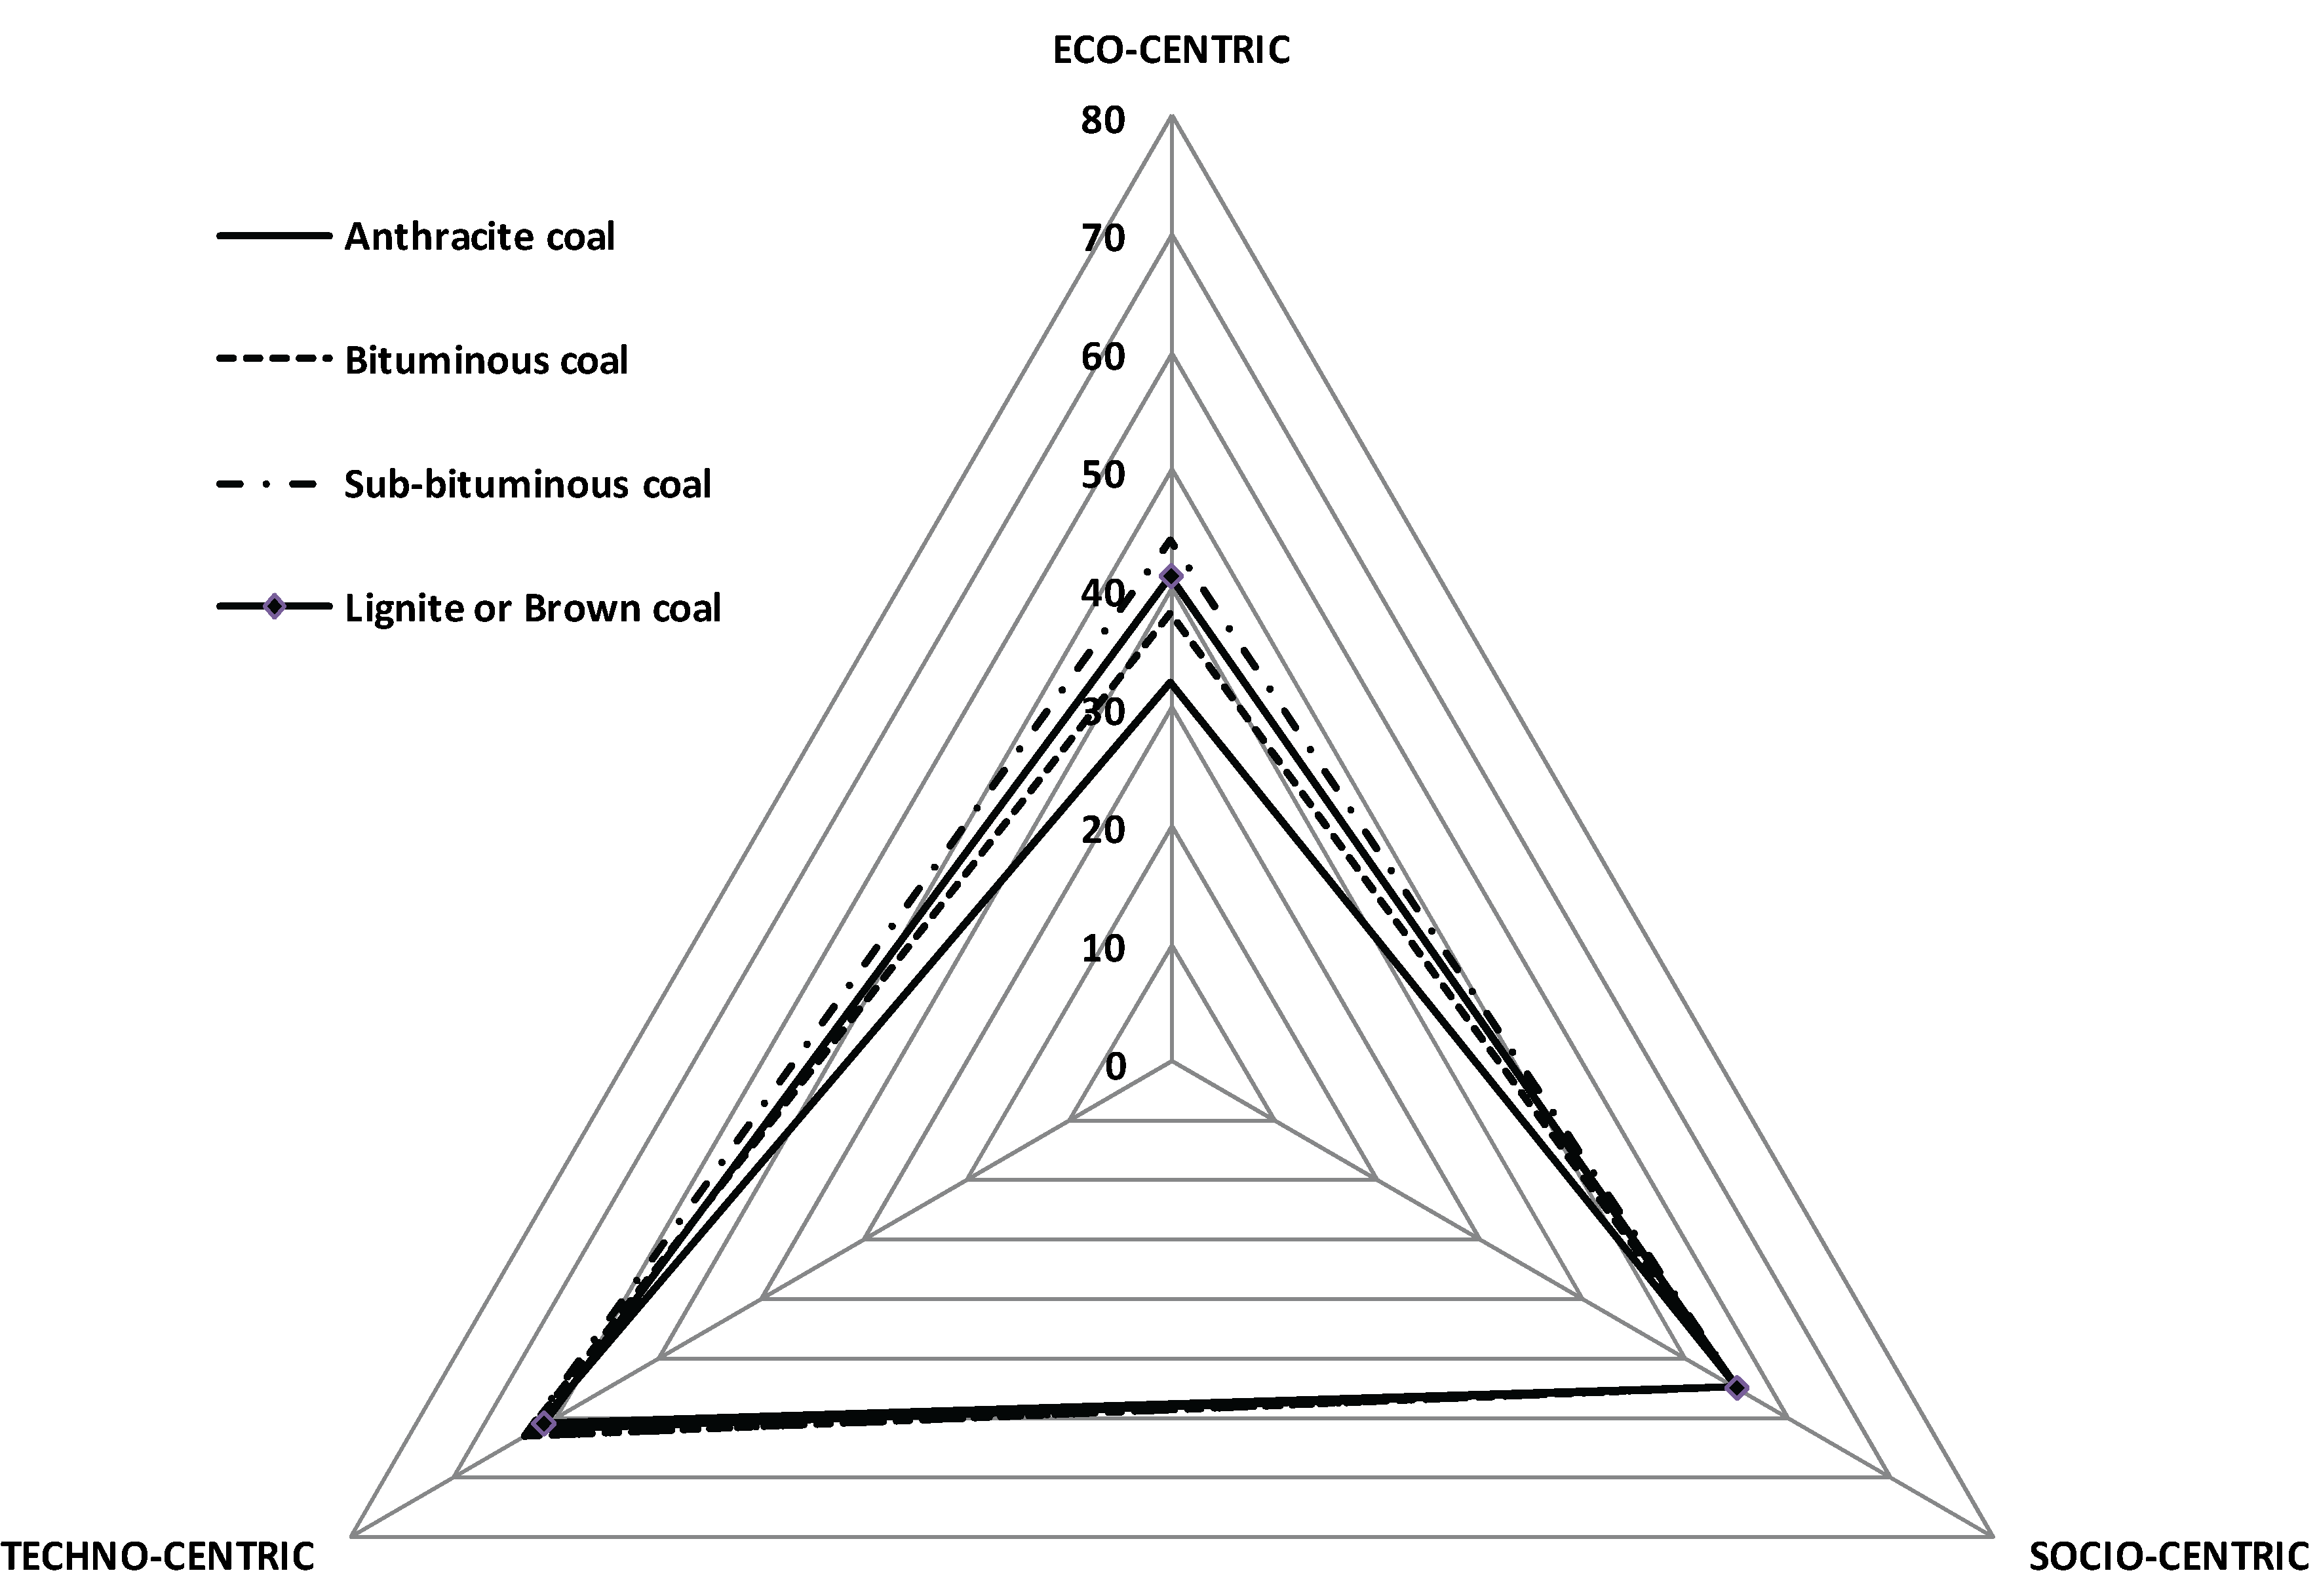
8.1. Sustainability of Coals
- Ecological: Coals score high (about 70%) in availability, material rate and endurance and low (less than 20%) in adaptability, pollution rate and ecological balance.
- Sociological: Coals are assigned high scores for per capita demand and lobbying and low scores for public opinion and environmental obligation.
- Technological: Coals score high on exergy and technology impact, and are assigned for all indicators reasonably high index values (above 50%). This result demonstrates the characteristics of industries associated with coals: power generation, steel and petrochemical.
8.2. Sustainability of Biomass
- Ecological: Farm biomass and energy crops have the same average index values.
- Sociological: Biomasses have high values (over 70%) for economics, public opinion and lobbying.
- Technological: Most biomasses are similar and are assigned the high values. This is due to the above-average values scored by biomasses and energy crops. Energy crops are assigned the highest value (90%) for environmental limitations in the use of technology relating to its processing.
9. Conclusions
Acknowledgements
References and Notes
- Canada’s Clean Coal Technology Roadmap; CANMET Energy Technology Center, Natural Resources Canada: Ottawa, ON, Canada, 2005.
- Clean Coal Technologies in Japan: Technological Innovation in the Coal Industry; Technical Report; New Energy and Industrial Technology Development Organization (NEDO): Kanagawa, Japan, 2004.
- Hydrogen from Coal Program: Research, Development and Demonstration Plan for the Period 2008 through 2016; External Report; US Department of Energy: Dallas, TX, USA, September 2008.
- Energy Statistics Handbook, Third Quarter; Catalogue No. 57-601-X; Statistics Canada: Winnipeg, MB, Canada, 2008.
- Bowman, C.W.; Griesbach, R.C. Energy Pathways Task Force Phase I Final Report; Canadian Academy of Engineering: Ottawa, ON, Canada, 2007. [Google Scholar]
- Climate Change and Water; Bates, B.C.; Kundzewicz, Z.W.; Wu, S.; Palutikof, J.P. (Eds.) Technical Paper; Intergovernmental Panel on Climate Change (IPCC) Secretariat: Geneva, Switzerland, 2008.
- Charting the Course: A Program Roadmap for Canada’s Transition to a Hydrogen Economy; Government of Canada’s Hydrogen and Fuel Cell Committee: Ottawa, ON, Canada, August 2005.
- Overview of the American Recovery and Reinvestment Act of 2009; US Department of Energy: Washington, DC, USA, 2009.
- Canada’s Economic Action Plan; Budget; Government of Canada: Ottawa, ON, Canada, 2009.
- Evans, A.; Strezov, V.; Evans, T.J. Assessment of sustainability indicators for renewable energy technologies. Renew. Sustain. Energy Rev. 2009, 13, 1082–1088. [Google Scholar] [CrossRef]
- Afgan, N.H.; Carvalho, M.G. Sustainability assessment of hydrogen energy systems. Int. J. Hydrogen Energ. 2004, 29, 1327–1342. [Google Scholar] [CrossRef]
- Krajnc, D.; Glavic, P. How to compare companies on relevant dimensions of sustainability. Ecol. Econ. 2005, 55, 551–563. [Google Scholar] [CrossRef]
- Nessa, B.; Urbel-Piirsalua, E.; Anderbergd, S.; Olsson, L. Categorising tools for sustainability assessment. Ecol. Econ. 2007, 60, 498–508. [Google Scholar]
- Singh, R.K.; Murty, H.R.; Gupta, S.K.; Dikshit, A.K. An overview of sustainability assessment methodologies. Ecol. Indi. 2009, 9, 189–212. [Google Scholar] [CrossRef]
- Brown, M.T.; Cohen, M.J.; Sweeney, S. Predicting national sustainability: The convergence of energetic, economic and environmental realities. Ecol. Model. 2009, 220, 3424–3438. [Google Scholar] [CrossRef]
- Graedel, T.E.; Allenby, B.R. Industrial Ecology and Sustainable Engineering; Prentice Hall: New York, NY, USA, 2010. [Google Scholar]
- Ayres, R.U.; Turton, H.; Casten, T. Energy efficiency, sustainability and economic growth. Energy 2007, 32, 634–648. [Google Scholar] [CrossRef]
- Hammond, G.P. Towards sustainability: Energy efficiency, thermodynamic analysis, and the “two cultures”. Energ. Policy 2004, 32, 1789–1798. [Google Scholar] [CrossRef]
- Dincer, I.; Rosen, M.A. Exergy: Energy, Environment and Sustainable Development; Elsevier: Oxford, UK, 2007. [Google Scholar]
- Rosen, M.A. Towards energy sustainability: A quest of global proportions. In Forum Public Policy: J. Oxford Round Table; 2008 June; pp. 1–20. [Google Scholar]
- Rosen, M.A. Energy efficiency and sustainable development. Int. J. Global Energy Issues 2002, 17, 23–34. [Google Scholar]
- Haas, R.; Nakicenovic, N.; Ajanovic, A.; Faber, T.; Kranzl, L.; Muller, A.; Resch, G. Towards sustainability of energy systems: A primer on how to apply the concept of energy services to identify necessary trends and policies. Energ. Policy 2008, 36, 4012–4021. [Google Scholar] [CrossRef]
- Uhrig, R.E.; Schultz, K.R.; Bogart, S.L. Hydrogen economy implementation with synfuels. Encycl. Energy Eng. Technol. 2008. [Google Scholar] [CrossRef]
- Zhou, Z.; Jiang, H.; Qin, L. Life cycle sustainability assessment of fuels. Fuel 2007, 86, 256–263. [Google Scholar] [CrossRef]
- Zvolinschi, A.; Kjelstrup, S.; Bolland, O.; van der Kooi, H.J. Exergy sustainability indicators as a tool in industrial ecology. J. Ind. Ecol. 2007, 11, 85–98. [Google Scholar] [CrossRef]
- Hennicke, P.; Fischedick, M. Towards sustainable energy systems: The related role of hydrogen. Energ. Policy 2006, 34, 1260–1270. [Google Scholar] [CrossRef]
- Dunn, S. Hydrogen futures: Toward a sustainable energy system. Int. J. Hydrogen Energ. 2002, 27, 235–264. [Google Scholar] [CrossRef]
- Midilli, A.; Dincer, I. Key strategies of hydrogen energy systems for sustainability. Int. J. Hydrogen Energ. 2007, 32, 511–524. [Google Scholar] [CrossRef]
- Energy Technology Perspectives 2008: Scenarios and Strategies to 2050; International Energy Agency: Beaumont, TX, USA, 2008.
- Energy Supply and Demand in Canada 2007; Catalogue No. 57-003-X; Statistics Canada: Winnipeg, MB, Canada, 2007.
- Committee on Alternatives and Strategies for Future Hydrogen Production and Use; Board on Energy and Environmental Systems; Division on Engineering and Physical Sciences; National Research Council and National Academy of Engineering of the National Academies. The Hydrogen Economy: Opportunities, Costs, Barriers, and R&D Needs; National Academies Press: Washington, DC, USA, August 2004. [Google Scholar]
- Hydrogen Systems: The Canadian Opportunity for Greenhouse Gas Reduction and Economic Growth through the Deployment of Hydrogen Technologies and Infrastructures; Canadian Hydrogen Association: Trois Rivieres, QC, Canada, 2005.
- Muradov, N.Z.; Veziroglu, T.N. “Green” path from fossil-based to hydrogen economy: An overview of carbon-neutral technologies. Int. J. Hydrogen Energ. 2008, 33, 6804–6839. [Google Scholar] [CrossRef]
- Industrial Size Gasification for Syngas, Substitute Natural Gas and Power Production; Report No. DOE/NETL-401/040607; National Energy Technology Laboratory, US Department of Energy: Washington, DC, USA, April 2007.
- Alternative Fuels in Canada; Catalogue No. M144-180/2008E-PDF; Office of Energy Efficiency, Natural Resources Canada: Ottawa, ON, Canada, 2008.
- Canada’s Carbon-Dioxide Capture and Storage Roadmap; CANMET Energy Technology Centre, Natural Resources Canada: Ottawa, ON, Canada, 2006.
- Canada’s Fossil Energy Future: The Way Forward on Carbon Capture and Storage; Ecoenergy Carbon Capture and Storage Task Force, Government of Alberta: Ottawa, ON, Canada, 9 January 2008.
- Energy Policies of IEA Countries: Canada 2004 Review; International Energy Agency: Beaumont, TX, USA, 2004.
- Hydrogen and Fuel Cells—Canadian Governments: Partners for the Hydrogen Future; Industry Canada: Ottawa, ON, Canada, 2009.
- Higman, C.; van der Burgt, M. Gasification, 2nd ed.; Elsevier Science: New York, NY, USA, 2008. [Google Scholar]
- The National Energy Modeling System: An Overview 2003; Energy Information Administration, US Department of Energy: Washington, DC, USA, 2003.
- Government of Canada; Hydrogen and Fuel Cells Canada; PricewaterhouseCoopers. Canadian Hydrogen and Fuel Cell Sector Profile 2007; Industry Canada: Ottawa, ON, Canada, 2007. [Google Scholar]
- Energy Policies of IEA Countries 2006; International Energy Agency: Beaumont, TX, USA, 2006.
- Human Activity and the Environment—Energy in Canada; Catalogue No. 16-201-XIE; Statistics Canada: Winnipeg, MB, Canada, 2004.
- World Energy Outlook 2008; International Energy Agency: Washington, DC, USA, 2008.
- Thumann, A.; Mehta, P.D. Handbook of Energy Engineering, 6th ed.; Fairmont Press: New York, NY, USA, 2008. [Google Scholar]
- Mozaffarian, M.; Zwart, R.W.R.; Boerrigter, H.; Deurwaarder, E.P.; Kersten, S.R.A. “Green gas” as SNG (synthetic natural gas): A renewable fuel with conventional quality. In Proceedings of Science in Thermal and Chemical Biomass Conversion Conference, Victoria, BC, Canada, 30 August–2 September 2004. Paper No. ECN-RX-04-085.
- Shackley, S.; Gough, C. Carbon Capture and Its Storage: An Integrated Assessment, Illustrated edition; Ashgate Publishing: Burlington, VT, USA, 2006. [Google Scholar]
- Greenhouse Gas Impacts of Expanded Renewable and Alternative Fuels Use; Report No. EPA420-F-07-035; US Environmental Protection Agency: Anchorage, AK, USA, 2007.
- Human Activity and the Environment—Solid Waste in Canada; Catalogue No. 16-201-XIE; Statistics Canada: Winnipeg, MB, Canada, 2005.
- Transport Gasifier IGCC Base Cases; Report No. PED-IGCC-98-006; Process Engineering Division, National Energy Technology Laboratory, US Department of Energy: Washington, DC, USA, June 2000.
- Cheremisinoff, N.P. Handbook of Chemical Processing Equipment; Butterworth-Heinemann Elsevier: Oxford, UK, 2000. [Google Scholar]
- Tchobanoglous, G.; Kreith, F. Handbook of Solid Waste Management, 2nd ed.; McGraw-Hill: Columbus, OH, USA, 2002. [Google Scholar]
- Dalcor Consultants; Intuit Strategy. Canadian Hydrogen; Current Status and Future Prospects; Natural Resources Canada: Ottawa, ON, Canada, 2004. [Google Scholar]
- Canadian Natural Gas: Review of 2006 and Outlook to 2020; Natural Gas Division, Natural Resources Canada: Ottawa, ON, Canada, December 2007.
- Canada’s Hydrogen and Fuel Cell Industry: Capabilities Guide 2008; Hydrogen & Fuel Cells Canada (H2FCC): Vancouver, BC, Canada, 2008.
- Climate Technology Sheet No. 9: Hydrogen Production; CAN-Europe Tech Sheet 09. Climate Action Network Europe: Brussels, Belgium, 2003. Available online: http://www.climnet.org/ (accessed on 26 May 2010).
- Index of Consumer Attitudes; Database; Conference Board of Canada: Ottawa, ON, Canada, 2009.
- Fitzgibbons, K. Future prospects and public policy implications for hydrogen and fuel-cell technologies in Canada. In Making Choices about Hydrogen: Transport Issues for Developing Countries; Mytelka, L.K., Boyle, G., Eds.; United Nations University Press: Tokyo, Japan; International Development Research Centre: Ottawa, ON, Canada, 2008. [Google Scholar]
- Mountouris, A.; Voutsas, E.; Tassios, E. Plasma gasification of sewage sludge: Process development and energy optimization. Energ. Conv. Manage. 2008, 49, 2264–2271. [Google Scholar] [CrossRef]
- Lewis, F.M. Generation of an Ultra-Superheated Steam Composition and Gasification Therewith. US Patent No. US 7,229,483 B2, 12 June 2007. [Google Scholar]
- Weimer, A.W.; Perkins, C.; Mejic, D.; Lichty, P. Rapid Solar Thermal Conversion of Biomass to Syngas. US Patent Application No. US 2008/0086946 A1, 17 April 2008. [Google Scholar]
- Stiegel, G.J.; Ramezan, M. Hydrogen from coal gasification: An economical pathway to a sustainable energy future. Int. J. Coal Geol. 2006, 65, 173–190. [Google Scholar] [CrossRef]
- Recovering Maximum Value from Ottawa’s Waste; Plasco Energy Group: Ottawa, ON, Canada, 2008.
- UK Biomass Strategy 2007; UK Department for Environment, Food and Rural Affairs: London, UK, 2007.
- Market Opportunities for Biogas Recovery Systems; Report No. 430-8-06-004; US Environmental Protection Agency: Anchorage, AK, USA, 2006.
- Weersink, A.; Mallon, S. The Financial Feasibility of Anaerobic Digestion for Ontario’s Livestock Industries; Department of Food, Agricultural and Resource Economics, University of Guelph: Guelph, ON, Canada, 2007. [Google Scholar]
- Electricity Market Module; Report No. DOR/EIA-0554; Energy Information Administration, US Department of Energy: Washington, DC, USA, 2007.
- Yoshida, Y.; Dowaki, K.; Matsumura, Y.; Matsuhashi, R.; Li, D.; Ishitani, H.; Komiyama, H. Comprehensive comparison of efficiency and CO2 emissions between biomass energy conversion technologies—position of supercritical water gasification in biomass technologies. Biomass Bioenerg. 2003, 25, 257–272. [Google Scholar] [CrossRef]
- Jin, H.; Ishida, M. A new type of coal gas fueled chemical-looping combustion. Fuel 2004, 83, 2411–2417. [Google Scholar] [CrossRef]
- Duerr, M.; Gair, S.; Cruden, A. Hydrogen and electrical energy from organic waste treatment. Int. J. Hydrogen Energ. 2007, 32, 705–709. [Google Scholar] [CrossRef]
- The Elorin Bioenergy Feasibility Study: Anaerobic Digestion for Bioelectricity Production; Goodfellow Agricola Consultant: Dunrobin, ON, Canada, 2007.
- Zedtwitz, P.V.; Steinfeld, A. The solar thermal gasification of coal: Energy conversion efficiency and CO2 mitigation potential. Energy 2003, 28, 441–456. [Google Scholar] [CrossRef]
- Cormos, C.C.; Starr, F.; Tzimas, E.; Peteves, S. Innovative concepts for hydrogen production processes based on coal gasification with CO2 capture. Int. J. Hydrogen Energ. 2008, 33, 1286–1294. [Google Scholar]
© 2010 by the authors; licensee MDPI, Basel, Switzerland. This article is an Oopen Access article distributed under the terms and conditions of the Creative Commons Attribution license (http://creativecommons.org/licenses/by/3.0/).
Share and Cite
Gnanapragasam, N.V.; Reddy, B.V.; Rosen, M.A. A Methodology for Assessing the Sustainability of Hydrogen Production from Solid Fuels. Sustainability 2010, 2, 1472-1491. https://doi.org/10.3390/su2061472
Gnanapragasam NV, Reddy BV, Rosen MA. A Methodology for Assessing the Sustainability of Hydrogen Production from Solid Fuels. Sustainability. 2010; 2(6):1472-1491. https://doi.org/10.3390/su2061472
Chicago/Turabian StyleGnanapragasam, Nirmal V., Bale V. Reddy, and Marc A. Rosen. 2010. "A Methodology for Assessing the Sustainability of Hydrogen Production from Solid Fuels" Sustainability 2, no. 6: 1472-1491. https://doi.org/10.3390/su2061472