A Review of the Ecological Footprint Indicator—Perceptions and Methods

Abstract
:
1. Introduction
2. Results
2.1. Key Results from the Expert Survey
2.2. Key Results from the Review of EF Methodologies

| Key Issues | NFA (National Footprint Accounts) | Land disturbance | Emergy | EF-NPP (Net Primary Production) | Dynamic EF | Further extensions (several approaches) |
|---|---|---|---|---|---|---|
| Takes into account: | ||||||
| Ecological limits | indirectly | accounts directly for biodiversity of vascular plants | indirectly | indirectly | accounts directly for threatened species | |
| Depicts overshoot | yes | yes | yes | yes | no | |
| Crop productivity | yes | yes | yes | yes | yes | |
| Overgrazing | no | indirectly | no | no | indirectly | |
| Desertification | no | indirectly | no | no | indirectly | |
| Land erosion | no | indirectly | no | no | indirectly | |
| Eutrophication | no | no | no | no | no | Acidification by [5] |
| Deforestation ofprimary forests | indirectly | indirectly | no | indirectly | indirectly | |
| Threat to species (reproductive rates) | no | no | no | no | no | |
| Biodiversity (number of species) | no | partly | no | possible | yes | |
| Overfishing | indirectly | no | no | indirectly | no | |
| Impacts of fish farming/aquaculture | no | no | no | no | no | |
| Ecosystem services | no | partly | no | possible | yes | |
| Water shortages | no | no | no | no | no | |
| Ecotoxicity | no | no | no | no | no | Toxicity by [6] |
| Impacts of non-biological resources | no | no | no | no | no | Included by [7] |
| Climate change | indirectly | indirectly | no | indirectly | yes | Methane included by some authors |
| Technical features: | ||||||
| Endogenous modeling of future impacts | no | no | no | no | yes | |
| Compatibility with SEEA | low | high | no | low | high | |
| Unit used (per year) | global ha | disturbed ha | global ha or ha | global ha | ha or t | |
| State & scope of implementation (availability of method) | high | high | low | high | low | |
| Availability and reliability of data (e.g., from official data sources) | high | medium | low | high | medium | |
| Specific applications: | ||||||
| Identifies the risks and opportunities for a country in a resource-constrained world | yes | yes | yes | yes | yes | |
| Identifies what natural assets a country has and whether these are in decline | partly (via biocapacity) | partly (via biocapacity) | no | partly (via biocapacity) | partly (via biocapacity) | |
| Identifies whether technological changes have helped to compensate for increases in resource demand | no | no | no | no | yes | |
| Key references: | [8] | [9] | [10,11] | [12] | [13] |
3. Discussion
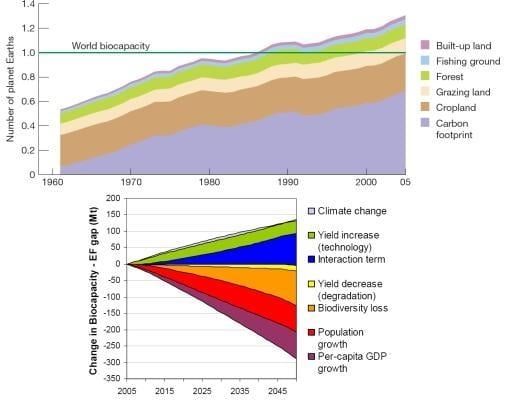
| Carbon | Crop-land | Grazing land | Forest | Fishing ground | Built-up land | Total | |
|---|---|---|---|---|---|---|---|
| World Total Ecological Footprint 2005 | 1.41 | 0.64 | 0.26 | 0.23 | 0.09 | 0.07 | 2.7 |
| World Total Biocapacity 2005 | 0.64 | 0.37 | 0.81 | 0.17 | 0.07 | 2.1 | |
| Ecological deficit | –0.6 | ||||||
4. Conclusions
Acknowledgements
References
- Fiala, N. Measuring sustainability: Why the ecological footprint is bad economics and bad environmental science. Ecol. Econ. 2008, 67, 519–525. [Google Scholar] [CrossRef]
- Stoeglehner, G.; Narodoslawsky, M. Implementing ecological footprinting in decision-making processes. Land Use Policy 2008, 25, 421–431. [Google Scholar] [CrossRef]
- Kitzes, J.; Moran, D.; Galli, A.; Wada, Y.; Wackernagel, M. Interpretation and application of the ecological footprint: A reply to fiala (2008). Ecol. Econ. 2009, 68, 929–930. [Google Scholar] [CrossRef]
- Kitzes, J.; Wackernagel, M. Answers to common questions in ecological footprint accounting. Ecol. Ind. 2009, 9, 812–817. [Google Scholar] [CrossRef]
- Holden, E.; Hoyer, K.G. The ecological footprints of fuels. Transp. Res PT D: Transp. Environ. 2005, 10, 395–403. [Google Scholar] [CrossRef]
- Peters, G.; Sack, F.; Lenzen, M.; Lundie, S.; Gallego, B. A new ecological footprint calculation for the australian water industry: Regionalisation and inclusion of downstream impacts. J. Appl. Input-Output Analysis 2006, 12, 73–90. [Google Scholar]
- Nguyen, H.X.; Yamamoto, R. Modification of ecological footprint evaluation method to include non-renewable resource consumption using thermodynamic approach. Ressources Conserv. Recycl. 2007, 51, 870–884. [Google Scholar] [CrossRef]
- Ewing, B.; Goldfinger, S.; Wackernagel, M.; Stechbart, M.; Rizk, S.; Reed, A.; Kitzes, J. The Ecological Footprint Atlas 2008, Version 1.0; Global Footprint Network: Oakland, CA, USA, 2008. [Google Scholar]
- Lenzen, M.; Murray, S.A. A modified ecological footprint method and its application to Australia. Ecol. Econ. 2001, 37, 229–255. [Google Scholar] [CrossRef]
- Chen, B.; Chen, G.Q. Ecological footprint accounting based on emergy—A case study of the chinese society. Ecol. Model. 2006, 198, 101–114. [Google Scholar] [CrossRef]
- Siche, J.R.; Agostinho, F.; Ortega, E. Emergy Net Primary Production as Basis for Calculation of Ecological Footprint. In Proceedings of the International Ecological Footprint Conference, Cardiff, Wales, UK, 8–10 May 2007; BRASS Research Centre, Cardiff University: Wales, UK, 2007. [Google Scholar]
- Venetoulis, J.; Talberth, J. Refining the ecological footprint. Environ. Devel. Sustain. 2008, 10, 441–469. [Google Scholar] [CrossRef]
- Lenzen, M.; Wiedmann, T.; Foran, B.; Dey, C.; Widmer-Cooper, A.; Williams, M.; Ohlemüller, R. Forecasting the Ecological Footprint of Nations: A Blueprint for a Dynamic Approach; ISA Research Report 07-01; The University of Sydney: Darlington, NSW, Australia; Stockholm Environment Institute, University of York: York, UK, 2007. [Google Scholar]
- Finkbeiner, M. Carbon footprinting—opportunities and threats. Int. J. LCA 2009, 14, 91–94. [Google Scholar] [CrossRef]
- Wiedmann, T.; Minx, J. A definition of ‘carbon footprint’. In Ecological Economics Research Trends; Pertsova, C.C., Ed.; Nova Science Publishers: Hauppauge, NY, USA, 2008; Chapter 1; pp. 1–11. [Google Scholar]
- Carbon Footprints in the Supply Chain: The Next Step for Business; Report No. CTC616; The Carbon Trust: London, UK, 2006.
- Matthews, H.S.; Weber, C.L.; Hendrickson, C.T. Estimating Carbon Footprints with Input-Output Models. In Proceedings of the International Input-Output Meeting on Managing the Environment, Seville, Spain, 9–11 July 2008.
- Minx, J.; Scott, K.; Peters, G.; Barrett, J. An Analysis of Sweden’s Carbon Footprint—A Report to WWF Sweden; WWF: Stockholm, Sweden, 2008. [Google Scholar]
- Weber, C.L.; Matthews, H.S. Quantifying the global and distributional aspects of American household carbon footprint. Ecol. Econ. 2008, 66, 379–391. [Google Scholar] [CrossRef]
- Wiedmann, T.; Wood, R.; Lenzen, M.; Minx, J.; Guan, D.; Barrett, J. Development of an Embedded Carbon Emissions Indicator—Producing a Time Series of Input-Output Tables and Embedded Carbon Dioxide Emissions for the UK by Using a MRIO Data Optimisation System. Final Report to the Department for Environment, Food and Rural Affairs by Stockholm Environment Institute at the University of York and Centre for Integrated Sustainability Analysis at the University of Sydney; Project Ref. EV02033; Defra: London, UK, 2008. [Google Scholar]
- Matthews, H.S.; Hendrickson, C.T.; Weber, C.L. The importance of carbon footprint estimation boundaries. Environ. Sci. Technol. 2008, 42, 5839–5842. [Google Scholar] [CrossRef] [PubMed]
- Minx, J.; Wiedmann, T.; Barrett, J.; Suh, S. Methods Review to Support the PAS Process for the Calculation of Greenhouse Gas Emissions Embodied in Goods and Services. Report to the UK Department for Environment, Food and Rural Affairs by Stockholm Environment Institute at the University Of York and Department for Bio-Based Products at the University of Minnesota; Project Ref. EV2074; Defra: London, UK, 2008. [Google Scholar]
- Weidema, B.P.; Thrane, M.; Christensen, P.; Schmidt, J.; Løkke, S. Carbon footprint. A catalyst for life cycle assessment? J. Ind. Ecol. 2008, 12, 3–6. [Google Scholar] [CrossRef]
- Lenzen, M. Double-counting in life cycle calculations. J. Ind. Ecol. 2008, 12, 583–599. [Google Scholar] [CrossRef]
- Chapagain, A.K.; Hoekstra, A.Y. Water Footprints of Nations; Value of Water Research Report Series 16; UNESCO-IHE: Delft, The Netherlands, 2004. [Google Scholar]
- Hoekstra, A.Y.; Chapagain, A.K. Water footprints of nations: Water use by people as a function of their consumption pattern. Water Resour. Manage. 2007, 21, 35–48. [Google Scholar] [CrossRef]
- Hoekstra, A.Y. Human appropriation of natural capital: A comparison of ecological footprint and water footprint analysis. Ecol. Econ. 2009, 68, 1963–1974. [Google Scholar] [CrossRef]
- Erb, K.H.; Krausmann, F.; Lucht, W.; Haberl, H. Embodied HANPP: Mapping the spatial disconnect between global biomass production and consumption. Ecol. Econ. 2009, 69, 328–334. [Google Scholar] [CrossRef]
- Haberl, H.; Erb, K.H.; Krausmann, F.; Berecz, S.; Ludwiczek, N.; Martínez-Alier, J.; Musel, A.; Schaffartzik, A. Using embodied HANPP to analyze teleconnections in the global land system: Conceptual considerations. Geografisk Tidsskrift—Danish J. Geogr. 2009, 109, 119–130. [Google Scholar] [CrossRef]
- Kitzes, J.; Galli, A.; Bagliani, M.; Barrett, J.; Dige, G.; Ede, S.; Erb, K.; Giljum, S.; Haberl, H.; Hails, C.; Jolia-Ferrier, L.; Jungwirth, S.; Lenzen, M.; Lewis, K.; Loh, J.; Marchettini, N.; Messinger, H.; Milne, K.; Moles, R.; Monfreda, C.; Moran, D.; Nakano, K.; Pyhälä, A.; Rees, W.; Simmons, C.; Wackernagel, M.; Wada, Y.; Walsh, C.; Wiedmann, T. A research agenda for improving national ecological footprint accounts. Ecol. Econ. 2009, 68, 1991–2007. [Google Scholar] [CrossRef]
- Ferng, J.J. Local sustainable yield and embodied resources in ecological footprint analysis—A case study on the required paddy field in Taiwan. Ecol. Econ. 2005, 53, 415–430. [Google Scholar] [CrossRef]
- Ferng, J.J. Resource-to-land conversions in ecological footprint analysis: The significance of appropriate yield data. Ecol. Econ. 2007, 62, 379–382. [Google Scholar] [CrossRef]
- Lenzen, M.; Hansson, C.B.; Bond, S. On the bioproductivity and land-disturbance metrics of the ecological footprint. Ecol. Econ. 2007, 61, 6–10. [Google Scholar] [CrossRef]
- WWF; Zoological Society of London; Global Footprint Network; Twente Water Centre. Living Planet Report 2008; World-Wide Fund for Nature International (WWF): Gland, Switzerland, 2008. [Google Scholar]
- Pillarisetti, J.R.; van den Bergh, J.C.J.M. Sustainable nations: What do aggregate indexes tell us? Environ. Dev. Sustain. 2010, 12, 49–62. [Google Scholar] [CrossRef]
- Wiedmann, T. A first empirical comparison of energy footprints embodied in trade—MRIO versus plum. Ecol. Econ. 2009, 68, 1975–1990. [Google Scholar] [CrossRef]
- Wiedmann, T. A review of recent multi-region input-output models used for consumption-based emission and resource accounting. Ecol. Econ. 2009, 69, 211–222. [Google Scholar] [CrossRef]
- Best, A.; Giljum, S.; Simmons, C.; Blobel, D.; Lewis, K.; Hammer, M.; Cavalieri, S.; Lutter, S.; Maguire, C. Potential of the Ecological Footprint for Monitoring Environmental Impacts from Natural Resource Use: Analysis of the Potential of the Ecological Footprint and Related Assessment Tools for Use in the EU’s Thematic Strategy on the Sustainable Use Of Natural Resources; Report to the European Commission, DG Environment; Brussels, Belgium, 2008. [Google Scholar]
- Rapport, D.J. Ecological footprints and ecosystem health: Complementary approaches to a sustainable future. Ecol. Econ. 2000, 32, 367–383. [Google Scholar] [CrossRef]
- Wackernagel, M.; Rees, W.E. Our Ecological Footprint—Reducing Human Impact on the Earth; New Society Publishers: Gabriola Island, Canada, 1996. [Google Scholar]
- Fisher, B.; Turner, R.K.; Morling, P. Defining and classifying ecosystem services for decision making. Ecol. Econ. 2009, 68, 643–653. [Google Scholar] [CrossRef]
- Rees, W.E. Human nature, eco-footprints and environmental injustice. Local Environ. 2008, 13, 685–701. [Google Scholar] [CrossRef]
- Handbook of National Accounting: Integrated Environmental and Economic Accounting 2003; United Nations: New York, NY, USA; European Commission: Brussels, Belgium; International Monetary Fund: Washington, DC, USA; Organisation for Economic Co-operation and Development: Paris, France; World Bank: Washington, DC, USA, 2003.
- GFN Footprint Term Glossary. Available online: http://www.footprintnetwork.org/gfn_sub.php?content=glossary (accessed on 3 February 2010).
- Kitzes, J.; Peller, A.; Goldfinger, S.; Wackernagel, M. Current method for calculating national ecological footprint accounts. Sci. Environ. Sust. Society 2007, 4, 1–9. [Google Scholar]
- Wiedmann, T.; Lenzen, M. On the conversion between local and global hectares in ecological footprint analysis. Ecol. Econ. 2007, 60, 673–677. [Google Scholar] [CrossRef]
- Rees, W.E. Ecological footprints and appropriated carrying capacity: What urban economics leaves out. Environ. Urban. 1992, 4, 121–130. [Google Scholar] [CrossRef]
- Rees, W.; Wackernagel, M. Urban ecological footprints: Why cities cannot be sustainable—And why they are a key to sustainability. Environ. Impact Assess. Rev. 1996, 16, 223–248. [Google Scholar] [CrossRef]
- Chambers, N.; Simmons, C.; Wackernagel, M. Sharing Nature’s Interest: Ecological Footprints as an Indicator of Sustainability; Earthscan: London, UK, 2000. [Google Scholar]
- Monfreda, C.; Wackernagel, M.; Deumling, D. Establishing national natural capital accounts based on detailed ecological footprint and biological capacity assessments. Land Use Policy 2004, 21, 231–246. [Google Scholar] [CrossRef]
- Moran, D.D.; Wackernagel, M.; Kitzes, J.A.; Goldfinger, S.H.; Boutaud, A. Measuring sustainable development—Nation by nation. Ecol. Econ. 2008, 64, 470–474. [Google Scholar] [CrossRef]
- Rees, W. Eco-footprint analysis: Merits and brickbats. Ecol. Econ. 2000, 32, 371–374. [Google Scholar] [CrossRef]
- Wackernagel, M.; Lewan, L.; Hansson, C.B. Evaluating the use of natural capital with the ecological footprint. Ambio 1999, 28, 604–612. [Google Scholar]
- Wackernagel, M.; Onisto, L.; Bello, P.; Callejas Linares, A.; Susana Lopez Falfan, I.; Mendez Garcia, J.; Isabel Suarez Guerrero, A.; Guadalupe Suarez Guerrero, M. National natural capital accounting with the ecological footprint concept. Ecol. Econ. 1999, 29, 375–390. [Google Scholar] [CrossRef]
- Wackernagel, M.; Schulz, N.B.; Deumling, D.; Linares, A.C.; Jenkins, M.; Kapos, V.; Monfreda, C.; Loh, J.; Myers, N.; Norgaard, R.; Randers, J. Tracking the ecological overshoot of the human economy. Proc. Nat. Acad. Sci. USA (PNAS) 2002, 99, 9266–9271. [Google Scholar] [CrossRef]
- Wackernagel, M.; Monfreda, C.; Schulz, N.B.; Erb, K.H.; Haberl, H.; Krausmann, F. Calculating national and global ecological footprint time series: Resolving conceptual challenges. Land Use Policy 2004, 21, 271–278. [Google Scholar] [CrossRef]
- Wackernagel, M.; Monfreda, C.; Moran, D.; Wermer, P.; Goldfinger, S.; Deumling, D.; Murray, M. National Footprint and Biocapacity Accounts 2005: The Underlying Calculation Method; Global Footprint Network: Oakland, CA, USA, 2005. [Google Scholar]
- Wackernagel, M.; Moran, D.; Goldfinger, S. Ecological Footprint Accounting: Comparing Resource Availability with an Economy’s Resource Demand; Global Footprint Network: Oakland, CA, USA, 2005. [Google Scholar]
- Kitzes, J.; Galli, A.; Rizk, S.; Reed, A.; Wackernagel, M. Guidebook to the National Footprint Accounts 2008 Edition; Global Footprint Network: Oakland, CA, USA, 2008; Version 1.01. [Google Scholar]
- Zoological Society of London; Global Footprint Network 2010 and Beyond—Rising to the Biodiversity Challenge; World-Wide Fund for Nature International (WWF): Gland, Switzerland, 2008.
- Aall, C.; Norland, I.T. The use of the ecological footprint in local politics and administration: Results and implications from Norway. Local Environ. 2005, 10, 159–172. [Google Scholar] [CrossRef]
- Andersson, J.O.; Lindroth, M. Ecologically unsustainable trade. Ecol. Econ. 2001, 37, 113–122. [Google Scholar] [CrossRef]
- Barrett, J. Component ecological footprint: Developing sustainable scenarios. Impact Assess. Proj. Apprais. 2001, 19, 107–118. [Google Scholar] [CrossRef]
- Barrett, J.; Scott, A. The ecological footprint: A metric for corporate sustainability. Corp. Environ. Strategy 2001, 8, 316–325. [Google Scholar] [CrossRef]
- Barrett, J.; Scott, A. The application of the ecological footprint: A case of passenger transport in Merseyside. Local Environ. 2003, 8, 167–183. [Google Scholar] [CrossRef]
- Barrett, J.; Birch, R.; Cherrett, N.; Wiedmann, T. Exploring the application of the ecological footprint to sustainable consumption policy. J. Environ. Policy Plann. 2005, 7, 303–316. [Google Scholar] [CrossRef]
- Browne, D.; O’Regan, B.; Moles, R. Use of ecological footprinting to explore alternative transport policy scenarios in an Irish city-region. Transp. Res.: Part D: Transport Environ. 2008, 13, 315–322. [Google Scholar] [CrossRef]
- Chen, C.Z.; Lin, Z.S. Multiple timescale analysis and factor analysis of energy ecological footprint growth in China 1953–2006. Energ. Policy 2008, 36, 1666–1678. [Google Scholar] [CrossRef]
- Collins, A.; Fairchild, R. Sustainable food consumption at a sub-national level: An ecological footprint, nutritional and economic analysis. J. Environ. Policy Plann. 2007, 9, 5–30. [Google Scholar] [CrossRef]
- Collins, A.; Flynn, A. Engaging with the ecological footprint as a decision-making tool: Process and responses. Local Environ. 2007, 12, 295–312. [Google Scholar] [CrossRef]
- Frey, S.D.; Harrison, D.J.; Billett, E.H. Ecological footprint analysis applied to mobile phones. J. Ind. Ecol. 2006, 10, 199–216. [Google Scholar] [CrossRef]
- Gössling, S.; Hansson, C.B.; Horstmeier, O.; Saggel, S. Ecological footprint analysis as a tool to assess tourism sustainability. Ecol. Econ. 2002, 43, 199–211. [Google Scholar] [CrossRef]
- Kissinger, M.; Haim, A. Urban hinterlands—The case of an Israeli town ecological footprint. Environ. Dev. Sustain. 2008, 10, 391–405. [Google Scholar] [CrossRef]
- Kissinger, M.; Gottlieb, D. Place oriented ecological footprint analysis—The case of Israel’s grain supply. Ecol. Econ. 2010, 69, 1639–1645. [Google Scholar] [CrossRef]
- Knaus, M.; Lohr, D.; O’Regan, B. Valuation of ecological impacts—A regional approach using the ecological footprint concept. Environ. Impact Assess. Rev. 2006, 26, 156–169. [Google Scholar] [CrossRef]
- Lammers, A.; Moles, R.; Walsh, C.; Huijbregts, M.A.J. Ireland’s footprint: A time series for 1983–2001. Land Use Policy 2008, 25, 53–59. [Google Scholar] [CrossRef]
- Lewan, L.; Simmons, C. The Use of Ecological Footprint and Biocapacity Analyses as Sustainability Indicators for Sub-National Geographical Areas: A Recommended Way Forward; Final Report Prepared in the European Common Indicators Project (ECIP) for Ambiente Italia; Milan, Italy, 2001. [Google Scholar]
- Niccolucci, V.; Galli, A.; Kitzes, J.; Pulselli, R.M.; Borsa, S.; Marchettini, N. Ecological footprint analysis applied to the production of two Italian wines. Agr. Ecosyst. Environ. 2008, 128, 162–166. [Google Scholar] [CrossRef]
- Ohl, B.; Wolf, S.; Anderson, W. A modest proposal: Global rationalization of ecological footprint to eliminate ecological debt. Sustain.: Sci. Practice Policy 2008, 4(Issue 1). [Google Scholar]
- O’Regan, B.; Morrissey, J.; Foley, W.; Moles, R. The relationship between settlement population size and sustainable development measured by two sustainability metrics. Environ. Impact Assess. Rev. 2009, 29, 169–178. [Google Scholar] [CrossRef]
- Scotti, M.; Bondavalli, C.; Bodini, A. Ecological footprint as a tool for local sustainability: The municipality of Piacenza (Italy) as a case study. Environ. Impact Assess. Rev. 2009, 29, 39–50. [Google Scholar] [CrossRef]
- Stoeglehner, G. Ecological footprint—A tool for assessing sustainable energy supplies. J. Clean. Prod. 2003, 11, 267–277. [Google Scholar] [CrossRef]
- Gu, X.W.; Wang, Q.; Li, G.J.; Wang, J. Application of ecological footprint in sustainable development of universities in Shenyang. J. Northeastern Univ. 2006, 27, 823–830. [Google Scholar]
- Gu, X.W.; Wang, Q.; Wang, J. Formulation of domestic ecological footprint indicator and its application. J. Northeastern Univ. 2006, 27, 1150–1155. [Google Scholar]
- Herva, M.; Franco, A.; Ferreiro, S.; Álvarez, A.; Roca, E. An approach for the application of the ecological footprint as environmental indicator in the textile sector. J. Hazard. Mater. 2008, 156, 478–487. [Google Scholar] [CrossRef] [PubMed]
- Huijbregts, M.A.J.; Hellweg, S.; Frischknecht, R.; Hungerbühler, K.; Hendriks, A.J. Ecological footprint accounting in the life cycle assessment of products. Ecol. Econ. 2008, 64, 798–807. [Google Scholar] [CrossRef]
- Hunter, C.; Carmichael, K.; Pangbourne, K. Household ecological footprinting using a new Diary-Based Data-Gathering approach. Local Environ. 2006, 11, 307–313. [Google Scholar] [CrossRef]
- Hunter, C.; Shaw, J. Applying the ecological footprint to ecotourism scenarios. Environ. Conserv. 2005, 32, 294–304. [Google Scholar] [CrossRef]
- Hunter, C.; Shaw, J. The ecological footprint as a key indicator of sustainable tourism. Tourism Manage. 2007, 28, 46–57. [Google Scholar] [CrossRef]
- Jorgenson, A.K.; Burns, T.J. The political—economic causes of change in the ecological footprints of nations, 1991–2001: A quantitative investigation. Soc. Sci. Res. 2007, 36, 834–840. [Google Scholar] [CrossRef]
- Kissinger, M.; Fix, J.; Rees, W.E. Wood and non-wood pulp production: Comparative ecological footprinting on the Canadian prairies. Ecol. Econ. 2007, 62, 552–558. [Google Scholar] [CrossRef]
- Medved, S. Present and future ecological footprint of Slovenia—The influence of energy demand scenarios. Ecol. Model. 2006, 192, 25–30. [Google Scholar] [CrossRef]
- Muniz, I.; Galindo, A. Urban form and the ecological footprint of commuting. The case of Barcelona. Ecol. Econ. 2005, 55, 499–505. [Google Scholar] [CrossRef]
- Moles, R.; Foley, W.; Morrissey, J.; O’Regan, B. Practical appraisal of sustainable development—Methodologies for sustainability measurement at settlement level. Environ. Impact Assess. Rev. 2008, 28, 144–165. [Google Scholar] [CrossRef]
- Patterson, T.M.; Niccolucci, V.; Bastianoni, S. Beyond “more is better”: Ecological footprint accounting for tourism and consumption in Val di Merse, Italy. Ecol. Econ. 2007, 62, 747–756. [Google Scholar] [CrossRef]
- Senbel, M.; McDaniels, T.; Dowlatabadi, H. The ecological footprint: A non-monetary metric of human consumption applied to North America. Global Environ. Change 2003, 13, 83–89. [Google Scholar] [CrossRef]
- Simmons, C.; Chambers, N. Footprinting UK households: How big is your ecological garden? Local Environ. 1998, 3, 355–362. [Google Scholar] [CrossRef]
- Simmons, C.; Lewis, K.; Barrett, J. Two feet—Two approaches: A component-based model of ecological footprinting. Ecol. Econ. 2000, 32, 375–380. [Google Scholar] [CrossRef]
- Thomassen, M.A.; de Boer, I.J.M. Evaluation of indicators to assess the environmental impact of dairy production systems. Agric. Ecosys. Environ. 2005, 111, 185–191. [Google Scholar] [CrossRef]
- Torras, M. An ecological footprint approach to external debt relief. World Devel. 2003, 31, 2161–2167. [Google Scholar] [CrossRef]
- Wackernagel, M.; Rees, W.E. Perceptual and structural barriers to investing in natural capital: Economics from an ecological footprint perspective. Ecol. Econ. 1997, 20, 3–24. [Google Scholar] [CrossRef]
- Wackernagel, M.; Monfreda, C.; Erb, K.H.; Haberl, H.; Schulz, N.B.N. Ecological footprint time series of Austria, The Philippines, and South Korea for 1961–1999: Comparing the conventional approach to an “Actual Land Area” approach. Land Use Policy 2004, 21, 261–267. [Google Scholar] [CrossRef]
- Wackernagel, M.; Kitzes, J.; Moran, D.; Goldfinger, S.; Thomas, M. The ecological footprint of cities and regions: Comparing resource availability with resource demand. Environ. Urban. 2006, 18, 103–109. [Google Scholar]
- Wackernagel, M.; White, S.; Moran, D. Using ecological footprint accounts: From analysis to applications. Int. J. Environ. Sust. Dev. 2004, 3, 293–315. [Google Scholar] [CrossRef]
- White, T.J. Sharing resources: The global distribution of the ecological footprint. Ecol. Econ. 2007, 64, 402–410. [Google Scholar] [CrossRef]
- York, R.; Rosa, E.A.; Dietz, T. The ecological footprint intensity of national economies. J. Ind. Ecol. 2004, 8, 139–154. [Google Scholar] [CrossRef]
- Yue, D.; Xu, X.; Li, Z.; Hui, C.; Li, W.; Yang, H.; Ge, J. Spatiotemporal analysis of ecological footprint and biological capacity of Gansu, China 1991–2015: Down from the environmental cliff. Ecol. Econ. 2006, 58, 393–406. [Google Scholar] [CrossRef]
- Erb, K.H.K. Actual land demand of Austria 1926–2000: A variation on ecological footprint assessments. Land Use Policy 2004, 21, 247–259. [Google Scholar] [CrossRef]
- Rizk, S. Personal Communication to Wiedmann, T.; Rizk, S., Ed.; Global Footprint Network: Oakland, CA, USA, 2008. [Google Scholar]
- United Kingdom National Ecological Footprint and Biocapacity Accounts for 2005, 2008 Edition; Global Footprint Network (GFN): Oakland, CA, USA, 2008.
- Jackson, J.B.C. Ecological extinction and evolution in the brave new ocean. Proc. Nat. Acad. Sci. USA (PNAS) 2008, 105, 11458–11465. [Google Scholar] [CrossRef]
- Bicknell, K.B.; Ball, R.J.; Cullen, R.; Bigsby, H.R. New methodology for the ecological footprint with an application to the New Zealand economy. Ecol. Econ. 1998, 27, 149–160. [Google Scholar] [CrossRef]
- Gao, C.; Jiang, D.; Wang, D.; Yan, J. Calculation of ecological footprint based on modified method and quantitative analysis of its impact factors—A case study of Shanghai. Chin. Geogr. Sci. 2006, 16, 306–313. [Google Scholar] [CrossRef]
- Haberl, H.; Erb, K.H.; Krausmann, F. How to calculate and interpret ecological footprints for long periods of time: The case of Austria 1926–1995. Ecol. Econ. 2001, 38, 25–45. [Google Scholar] [CrossRef]
- Hubacek, K.; Giljum, S. Applying physical input-output analysis to estimate land appropriation (ecological footprints) of international trade activities. Ecol. Econ. 2003, 44, 137–151. [Google Scholar] [CrossRef]
- McDonald, G.W.; Patterson, M.G. Ecological footprints and interdependencies of New Zealand regions. Ecol. Econ. 2004, 50, 49–67. [Google Scholar] [CrossRef]
- Van Vuuren, D.P.; Bouwman, L.F. Exploring past and future changes in the ecological footprint for world regions. Ecol. Econ. 2005, 52, 43–62. [Google Scholar] [CrossRef]
- Van Vuuren, D.P.; Smeets, E.M.W. Ecological footprints of Benin, Bhutan, Costa Rica and The Netherlands. Ecol. Econ. 2000, 34, 115–130. [Google Scholar] [CrossRef]
- Haberl, H.; Erb, K.H.; Krausmann, F.; Gaube, V.; Bondeau, A.; Plutzar, C.; Gingrich, S.; Lucht, W.; Fischer-Kowalski, M. Quantifying and mapping the human appropriation of net primary production in earth’s terrestrial ecosystems. Proc. Nat. Acad. Sci. USA (PNAS) 2007, 104, 12942–12947. [Google Scholar] [CrossRef]
- Erb, K.H.; Krausmann, F.; Gaube, V.; Gingrich, S.; Bondeau, A.; Fischer-Kowalski, M.; Haberl, H. Analyzing the global human appropriation of net primary production—Processes, trajectories, implications. An introduction. Ecol. Econ. 2009, 69, 250–259. [Google Scholar] [CrossRef]
- Vitousek, P.M.; Ehrlich, P.R.; Ehrlich, A.H.; Matson, P.A. Human appropriation of the products of photosynthesis. Bioscience 1986, 36, 368–373. [Google Scholar] [CrossRef]
- Haberl, H.; Wackernagel, M.; Krausmann, F.; Erb, K.H.K.; Monfreda, C. Ecological footprints and human appropriation of net primary production: A comparison. Land Use Policy 2004, 21, 279–288. [Google Scholar] [CrossRef]
- Gaston, K.J. Global patterns in biodiversity. Nature 2000, 405, 220–227. [Google Scholar] [CrossRef] [PubMed]
- Haberl, H.; Plutzar, C.; Erb, K.H.; Gaube, V.; Pollheimer, M.; Schulz, N.B. Human appropriation of net primary production as determinant of avifauna diversity in Austria. Agric. Ecosyst. Environ. 2005, 110, 119–131. [Google Scholar] [CrossRef]
- Haberl, H.; Schulz, N.B.; Plutzar, C.; Erb, K.H.; Krausmann, F.; Loibl, W.; Moser, D.; Sauberer, N.; Weisz, H.; Zechmeister, H.G.; Zulka, P. Human appropriation of net primary production and species diversity in agricultural landscapes. Agric. Ecosyst. Environ. 2004, 102, 213–218. [Google Scholar] [CrossRef]
- Waide, R.B.; Willig, M.R.; Steiner, C.F.; Mittelbach, G.; Gough, L.; Dodson, S.I.; Juday, G.P.; Parmenter, R. The Relationship between productivity and species richness. Annu. Rev. Ecol. System. 1999, 30, 257–300. [Google Scholar] [CrossRef]
- Wright, D.H. Human impacts on the energy flow through natural ecosystems, and implications for species endangerment. Ambio 1990, 19, 189–194. [Google Scholar]
- Odum, H.T. Ecological and General Systems—An Introduction to Systems Ecology; University Press of Colorado: Boulder, CO, USA, 1994. [Google Scholar]
- Odum, H.T. Environmental Accounting, Emergy and Decision Making; J. Wiley: New York, NY, USA, 1996. [Google Scholar]
- Zhao, S.; Li, Z.; Li, W. A modified method of ecological footprint calculation and its application. Ecol. Model. 2005, 185, 65–75. [Google Scholar] [CrossRef]
- Chen, B.; Chen, G.Q. Modified ecological footprint accounting and analysis based on embodied exergy—A case study of the Chinese society 1981–2001. Ecol. Econ. 2007, 61, 355–376. [Google Scholar] [CrossRef]
- Liu, Q.P.; Lin, Z.S.; Feng, N.H.; Liu, Y.M. A modified model of ecological footprint accounting and its application to cropland in Jiangsu, China. Pedosphere 2008, 18, 154–162. [Google Scholar] [CrossRef]
- Cuadra, M.; Bjorklund, J. Assessment of economic and ecological carrying capacity of agricultural crops in Nicaragua. Ecol. Ind. 2007, 7, 133–140. [Google Scholar] [CrossRef]
- Pizzigallo, A.C.I.; Granai, C.; Borsa, S. The joint use of LCA and emergy evaluation for the analysis of two Italian wine farms. J. Environ. Manage. 2008, 86, 396–406. [Google Scholar] [CrossRef] [PubMed]
- Siche, J.R.; Agostinho, F.; Ortega, E.; Romeiro, A. Sustainability of nations by indices: Comparative study between Environmental Sustainability Index, Ecological Footprint and the Emergy Performance Indices. Ecol. Econ. 2008, 66, 628–637. [Google Scholar] [CrossRef]
- Agostinho, F.; Siche, J.R.; Ortega, E. True ecological footprints for small farms in Brazil. In Proceedings of the International Ecological Footprint Conference, Cardiff, Wales, UK, 8–10 May 2007.
- Siche, R.; Agostinho, F.; Ortega, E. Emergy Net Primary Production (ENPP) as basis for calculation of ecological footprint. Ecol. Ind. 2010, 10, 475–483. [Google Scholar] [CrossRef]
- Bai, Y.; Zeng, H.; Wei, J.B.; Zhang, W.J.; Zhao, H.W. Optimization of ecological footprint model based on environmental pollution accounts: A case study in Pearl River Delta urban agglomeration. China J. Appl. Ecol. 2008, 19, 1789–1796. [Google Scholar]
- Walsh, C.; O’Regan, B.; Moles, R. Incorporating methane into ecological footprint analysis: A case study of Ireland. Ecol. Econ. 2009, 68, 1952–1962. [Google Scholar] [CrossRef]
- Armsworth, P.R.; Kendall, B.E.; Davis, F.W. An introduction to biodiversity concepts for environmental economists. Resour. Energ. Econ. 2004, 26, 115–136. [Google Scholar] [CrossRef]
- Asner, G.P.; Elmore, A.J.; Olander, L.P.; Martin, R.E.; Harris, A.T. Grazing systems, ecosystem responses, and global change. Annu. Rev. Environ. Resour. 2004, 29, 261–299. [Google Scholar] [CrossRef]
- Naeem, S.; Chapin, F.S.; Costanza, R.; Ehrlich, P.R.; Golley, F.B.; Hooper, D.U.; Lawton, J.H.; O’Neill, R.V.; Mooney, H.A.; Sala, O.E.; Symstad, A.J.; Tilman, D. Biodiversity and ecosystem functioning: Maintaining natural life support processes. Issues Ecol. 1999, 4, 1–11. [Google Scholar]
- Pimentel, D.; Terhune, E.C.; Dyson-Hudson, R.; Rochereau, S.; Samis, R.; Smith, E.A.; Denman, D.; Reifschneider, D.; Shepard, M. Land degradation: Effects on food and energy resources. Science 1976, 194, 149–155. [Google Scholar] [CrossRef] [PubMed]
- Spangenberg, J.H. Biodiversity pressure and the driving forces behind. Ecol. Econ. 2007, 61, 146–158. [Google Scholar] [CrossRef]
- McBain, B.; School of Environmental and Life Sciences, University of Newcastle, Callaghan, NSW 2308, Australia. Personal Communication to Wiedmann, T., November 2008.
- Kitzes, J.; Wackernagel, M.; Loh, J.; Peller, A.; Goldfinger, S.; Cheng, D.; Tea, K. Shrink and share: Humanity’s present and future ecological footprint. Phil. Trans. Roy. Soc. London B 2008, 363, 467–475. [Google Scholar] [CrossRef] [PubMed]
- Grazi, F.; Waisman, H.; van den Bergh, J. The Geography of Sustainability: Agglomeration, Global Economy and Environment. Unpublished work. 2008. [Google Scholar]
- Grazi, F.; van den Bergh, J.; Rietveld, P. Spatial welfare economics versus ecological footprint: Modeling agglomeration, externalities and trade. Environ. Resour. Econ. 2007, 38, 135–153. [Google Scholar] [CrossRef]
- Leontief, W. Quantitative input and output relations in the economic system of the United States. Rev. Econ. Statist. 1936, 18, 105–125. [Google Scholar] [CrossRef]
- Miller, R.E.; Blair, P.D. Input-Output Analysis: Foundations and Extensions; Prentice-Hall: Englewood Cliffs, NJ, USA, 1985. [Google Scholar]
- Hoekstra, R.; van den Bergh, J.C.J.M. Constructing physical input-output tables for environmental modeling and accounting: Framework and illustrations. Ecol. Econ. 2006, 59, 375–393. [Google Scholar] [CrossRef]
- Weisz, H.; Duchin, F. Physical and monetary input-output analysis: What makes the difference? Ecol. Econ. 2006, 57, 534–541. [Google Scholar] [CrossRef]
- Carballo Penela, A.; Sebastián Villasante, C. Applying physical input-output tables of energy to estimate the Energy Ecological Footprint (EEF) of Galicia (NW Spain). Energ. Policy 2008, 36, 1148–1163. [Google Scholar] [CrossRef]
- Giljum, S.; Hubacek, K. Conceptual foundations and applications of physical input-output tables. In Handbook of Input-Output Economics in Industrial Ecology; Suh, S., Ed.; Springer: New York, NY, USA, 2009; pp. 61–76. [Google Scholar]
- Bagliani, M.; Ferlaino, F.; Procopio, S. Ecological footprint and input-output methodology: The analysis of the environmental sustainability of the economic sectors of Piedmont Region (Italy). In Proceedings of the 14th International Conference on Input-Output Techniques, Montréal, Canada, 10–15 October 2002. DOI:10.2495/ECO030571.
- Ferng, J.J. Using composition of land multiplier to estimate ecological footprints associated with production activity. Ecol. Econ. 2001, 37, 159–172. [Google Scholar] [CrossRef]
- Ferng, J.J. Toward a scenario analysis framework for energy footprints. Ecol. Econ. 2002, 40, 53–69. [Google Scholar] [CrossRef]
- Kratena, K. From ecological footprint to ecological rent: An economic indicator for resource constraints. Ecol. Econ. 2008, 64, 507–516. [Google Scholar] [CrossRef]
- Kratena, K.; Wiedmann, T. A monetary measure for ecological footprints of domestic final demand—The UK example. In Proceedings of the International Input-Output Meeting on Managing the Environment, Seville, Spain, 9–11 July 2008.
- Lenzen, M.; Murray, S.A. The Ecological Footprint—Issues and Trends; ISA Research Paper 01–03; The University of Sydney: Sydney, Australia, 2003. [Google Scholar]
- Wiedmann, T.; Minx, J.; Barrett, J.; Wackernagel, M. Allocating ecological footprints to final consumption categories with input-output analysis. Ecol. Econ. 2006, 56, 28–48. [Google Scholar] [CrossRef]
- Wood, R.; Lenzen, M. Principal methodological approaches to studying sustainable consumption: Scenario analysis. In Handbook of Input-Output Economics in Industrial Ecology; Suh, S., Ed.; Springer: New York, NY, USA, 2009; pp. 285–312. [Google Scholar]
- Li, H.; Zhang, P.D.; He, C.Y.; Wang, G. Evaluating the effects of embodied energy in international trade on ecological footprint in China. Ecol. Econ. 2007, 62, 136–148. [Google Scholar] [CrossRef]
- Barrett, J.; Birch, R.; Cherrett, N.; Wiedmann, T. Reducing Wales’ Ecological Footprint—Main Report; WWF Cymru: Cardiff, UK, 2005. [Google Scholar]
- Melbourne Atlas 2006—Sustaining the Environment: Chapter 8.2, Melbourne’s Ecological Footprint; Department of Sustainability and Environment: Victoria, Australia, 2006.
- Melbourne Atlas 2006—Sustaining the Environment: Chapter 8.3, Contributors to Our Ecological Footprint; Department of Sustainability and Environment: Victoria, Australia, 2006.
- Collins, A.; Flynn, A.; Wiedmann, T.; Barrett, J. The environmental impacts of consumption at a subnational level: The ecological footprint of Cardiff. J. Ind. Ecol. 2006, 10, 9–24. [Google Scholar] [CrossRef]
- The Ecological Footprint of Victoria—Assessing Victoria’s Demand on Nature; Prepared for EPA Victoria, Melbourne by Global Footprint Network (GFN) and Centre for Integrated Sustainability Analysis (ISA) at the University of Sydney; Sydney, Australia, 2005.
- McGregor, P.G.; Swales, J.K.; Turner, K.R. The impact of Scottish consumption on the local environment: An alternative to the ecological footprint? Quart. Econ. Commentary 2004, 29, 29–34. [Google Scholar]
- McGregor, P.G.; Swales, J.K.; Turner, K.R. An Input-output Based Alternative to “Ecological Footprints” for Tracking Pollution Generation in a Small Open Economy; Strathclyde Discussion Papers in Economics; University of Strathclyde: Glasgow, UK, 2004. [Google Scholar]
- Moore, S.; Nye, M.; Rydin, Y. Using ecological footprints as a policy driver: The case of sustainable construction planning policy in London. Local Environ. 2007, 12, 1–15. [Google Scholar] [CrossRef]
- Nye, M.; Rydin, Y. The contribution of ecological footprinting to planning policy development: Using reap to evaluate policies for sustainable housing construction. Environ. Plan. B—Plan. Design 2008, 35, 227–247. [Google Scholar] [CrossRef]
- SEI; WWF; CURE (Eds.) Counting Consumption—CO2 Emissions, Material Flows and Ecological Footprint of the UK by Region and Devolved Country; WWF-UK: Godalming, Surrey, UK, 2006.
- Turner, K. How can we measure Scotland’s footprint? (And, once we have, what do we do with it?). Fraser Econ. Commentary 2008, 32, 41–46. [Google Scholar]
- Wiedmann, T.; Wood, R.; Barrett, J.; Lenzen, M. The Ecological Footprint of Consumption in Queensland; Stockholm Environment Institute (SEI) at the University of York: York, UK; Centre for Integrated Sustainability Analysis (ISA) at the University of Sydney: Sydney, Austrilia, 2007. [Google Scholar]
- Wiedmann, T.; Wood, R.; Barrett, J.; Lenzen, M.; Clay, R. The Ecological Footprint of Consumption in Victoria; Stockholm Environment Institute (SEI) at the University of York: York, UK; Centre for Integrated Sustainability Analysis (ISA) at the University of Sydney: Sydney, Austrilia, 2007. [Google Scholar]
- Wiedmann, T.; Wood, R.; Lenzen, M.; Tovey, J.; Moloney, S. Modelling ecological footprints for sub-regional levels: A detailed footprint of consumption in local areas of Melbourne and Victoria. In Proceedings of the International Ecological Footprint Conference, Cardiff, Wales, UK, 8–10 May 2007; ESRC BRASS Research Centre, Cardiff University: Cardiff, NY, USA, 2007. [Google Scholar]
- Wood, R.; Garnett, S. An assessment of environmental sustainability in northern Australia using the ecological footprint and with reference to indigenous populations and remoteness. Ecol. Econ. 2009, 68, 1375–1384. [Google Scholar] [CrossRef]
- Birch, R.; Barrett, J.; Wiedmann, T. Exploring the consumption and related environmental impacts of socio-economic groups within the UK. In Proceedings of the International Workshop on Sustainable Consumption, University of Leeds, Leeds, UK, 5–6 March 2004.
- McDonald, G.W.; Forgie, V.E.; MacGregor, C. Treading lightly: Ecofootprints of New Zealand’s ageing population. Ecol. Econ. 2006, 56, 424–439. [Google Scholar] [CrossRef]
- Lenzen, M.; Lundie, S.; Bransgrove, G.; Charet, L.; Sack, F. Assessing the ecological footprint of a large metropolitan water supplier: Lessons for water management and planning towards sustainability. J. Environ. Plann. Manage. 2003, 46, 113–141. [Google Scholar] [CrossRef]
- Wiedmann, T.O.; Lenzen, M.; Barrett, J.R. Companies on the scale—Comparing and benchmarking the sustainability performance of businesses. J. Ind. Ecol. 2009, 13, 361–383. [Google Scholar] [CrossRef]
- Wood, R.; Lenzen, M. An application of a modified ecological footprint method and structural path analysis in a comparative institutional study. Local Environ. 2003, 8, 365–384. [Google Scholar] [CrossRef]
- A Review of Recent Developments in, and the Practical Use of, Ecological Footprinting Methodologies; A Report to the Department for Environment, Food and Rural Affairs by Risk & Policy Analysts; London, UK, 2007.
- Handbook of Input-Output Table Compilation and Analysis; Department for Economic and Social Affairs, Statistics Division, United Nations: New York, NY, USA, 1999.
- Eurostat. Eurostat Manual of Supply, Use and Input-Output Tables, 2008 ed.; Office for Official Publications of the European Communities: Luxembourg, 2008. [Google Scholar]
- Lenzen, M.; Gallego, B.; Wood, R. Matrix balancing under conflicting information. Econ. Syst. Res. 2009, 21, 23–44. [Google Scholar] [CrossRef]
- Ten Raa, T. The extraction of technical coefficients from input and output data. Econ. Syst. Res. 2007, 19, 453–459. [Google Scholar] [CrossRef]
- Ten Raa, T.; Rueda-Cantuche, J.M. A generalized expression for the commodity and the industry technology models in input-output analysis. Econ. Syst. Res. 2007, 19, 99–104. [Google Scholar] [CrossRef]
- Thage, B. Symmetric input-output tables: Compilation issues. In Proceedings of the 15th International Input-Output Conference of the International Input-Output Association (IIOA), Beijing, China, 27 June–1 July 2005.
- Turner, K.; Lenzen, M.; Wiedmann, T.; Barrett, J. Examining the global environmental impact of regional consumption activities—Part 1: A technical note on combining input-output and ecological footprint analysis. Ecol. Econ. 2007, 62, 37–44. [Google Scholar] [CrossRef]
- Leontief, W. Environmental repercussions and the economic structure: An input-output approach. Rev. Econ. Statist. 1970, 52, 262–271. [Google Scholar] [CrossRef]
- Wiedmann, T.; Lenzen, M.; Turner, K.; Barrett, J. Examining the global environmental impact of regional consumption activities—Part 2: Review of input-output models for the assessment of environmental impacts embodied in trade. Ecol. Econ. 2007, 61, 15–26. [Google Scholar] [CrossRef]
- Tukker, A.; Poliakov, E.; Heijungs, R.; Hawkins, T.; Neuwahl, F.; Rueda-Cantuche, J.M.; Giljum, S.; Moll, S.; Oosterhaven, J.; Bouwmeester, M. Towards a global multi-regional environmentally extended input-output database. Ecol. Econ. 2009, 68, 1928–1937. [Google Scholar] [CrossRef]
- Tukker, A. Towards a global regionalised environmentally extended input-output database,linked to the ecological footprint. In Proceedings of the International Ecological Footprint Conference—BRASS, Cardiff, Wales, UK, 8–10 May 2007.
- Wiedmann, T.; Lenzen, M.; Wood, R. Uncertainty Analysis of the UK-MRIO Model—Results from a Monte-Carlo Analysis of the UK Multi-Region Input-Output Model (Embedded Carbon Dioxide Emissions Indicator); Report to the UK Department for Environment Food and Rural Affairs by Stockholm Environment Institute at the University of York and Centre for Integrated Sustainability Analysis at the University of Sydney; Project Ref. EV02033; Defra: London, UK, 2008. [Google Scholar]
- Ahna, S.; Lim, S.T. Developing hybrid input-output material flow accounts using life cycle inventory database. In Proceedings of the 16th International Input-Output Conference of the International Input-Output Association (IIOA), Istanbul,Turkey, 2–6 July 2007.
- Bullard, C.W.; Penner, P.S.; Pilati, D.A. Net energy analysis: Handbook for combining process and input-output analysis. Resour. Energy 1978, 1, 267–313. [Google Scholar] [CrossRef]
- Crawford, R.H. Validation of a hybrid life-cycle inventory analysis method. J. Environ. Manage. 2008, 88, 496–506. [Google Scholar] [CrossRef] [PubMed]
- Heijungs, R.; Suh, S. The Computational Structure of Life Cycle Assessment; Kluwer Academic Publishers: Dordrecht, The Netherlands, 2002. [Google Scholar]
- Heijungs, R.; Suh, S. Reformulation of matrix-based LCI: From product balance to process balance. J. Clean. Prod. 2006, 14, 47–51. [Google Scholar] [CrossRef]
- Heijungs, R.; de Koning, A.; Suh, S.; Huppes, G. Toward an information tool for integrated product policy: Requirements for data and computation. J. Ind. Ecol. 2006, 10, 147–158. [Google Scholar] [CrossRef]
- Strømman, A.H.; Peters, G.P.; Hertwich, E.G. Approaches to correct for double counting in tiered hybrid life cycle inventories. J. Clean. Prod. 2009, 17, 248–254. [Google Scholar] [CrossRef]
- Suh, S.; Lenzen, M.; Treloar, G.J.; Hondo, H.; Horvath, A.; Huppes, G.; Jolliet, O.; Klann, U.; Krewitt, W.; Moriguchi, Y.; Munksgaard, J.; Norris, G. System boundary selection in life-cycle inventories using hybrid approaches. Environ. Sci. Technol. 2004, 38, 657–664. [Google Scholar] [CrossRef] [PubMed]
- Beynon, M.J.; Munday, M. Considering the effects of imprecision and uncertainty in ecological footprint estimation: An approach in a fuzzy environment. Ecol. Econ. 2008, 67, 373–383. [Google Scholar] [CrossRef]
- Peters, G.P.; Hertwich, E.G. CO2 embodied in international trade with implications for global climate policy. Environ. Sci. Technol. 2008, 42, 1401–1407. [Google Scholar] [CrossRef] [PubMed]
- Peters, G.P.; Hertwich, E.G. Post-Kyoto greenhouse gas inventories: Production versus consumption. Climatic Change 2008, 86, 51–66. [Google Scholar] [CrossRef]
- Kitzes, J.; Galli, A.; Bagliani, M.; Barrett, J.; Dige, G.; Ede, S.; Erb, K.; Giljum, S.; Haberl, H.; Hails, C.; et al. A research agenda for improving national ecological footprint accounts. In Proceedings of the International Ecological Footprint Conference, Cardiff, Wales, UK, 8–10 May 2007.
Appendix A1. Detailed Questions and Answers from the Expert Survey
A1.1. Scope of Survey and Questionnaire
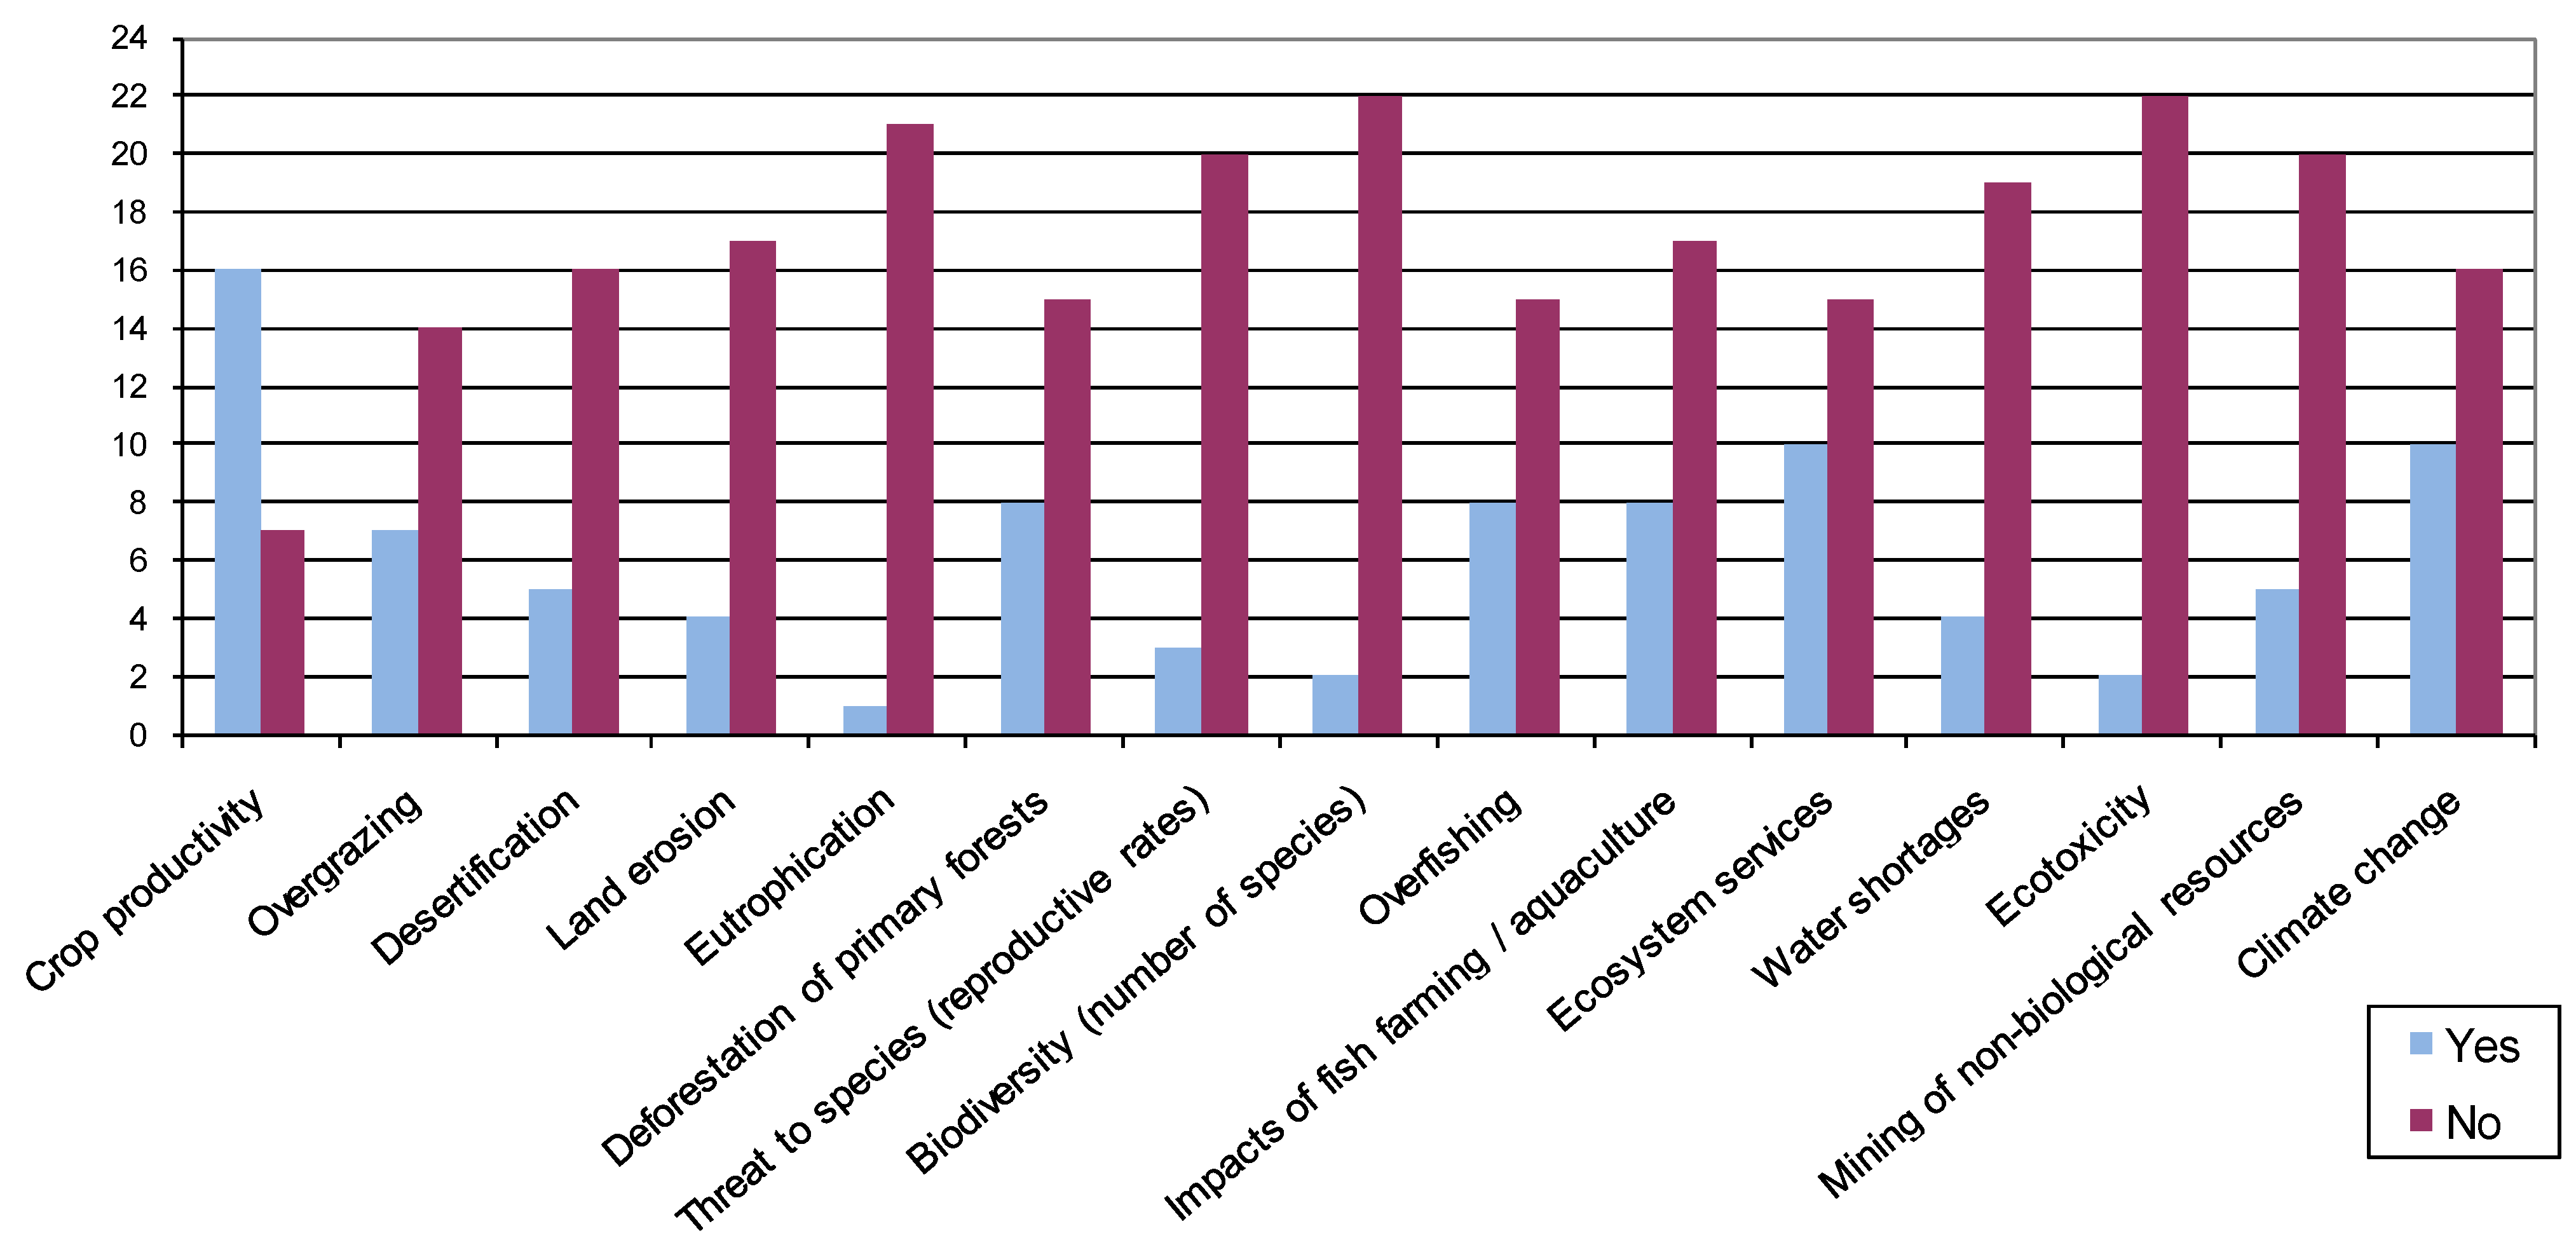
A1.2. Questions about the Existing Ecological Footprint Indicator and Methodology
- Crop productivity
- Overgrazing
- Desertification
- Land erosion
- Eutrophication
- Deforestation of primary forests
- Threat to species (reproductive rates)
- Biodiversity (number of species)
- Overfishing
- Impacts of fish farming/aquaculture
- Ecosystem services
- Water shortages
- Ecotoxicity (e.g., bioaccumulation of persistent pollutants)
- Impacts of mining of non-biological resources (e.g., open pit mining, precious metal mining, etc.)
- Climate change
- Identify the risks and opportunities for a country in a resource-constrained world
- What natural assets a country has and whether these are in decline
- Whether technology advances have helped to compensate for increases in resource demand
- Help citizens live better lives with fewer resources
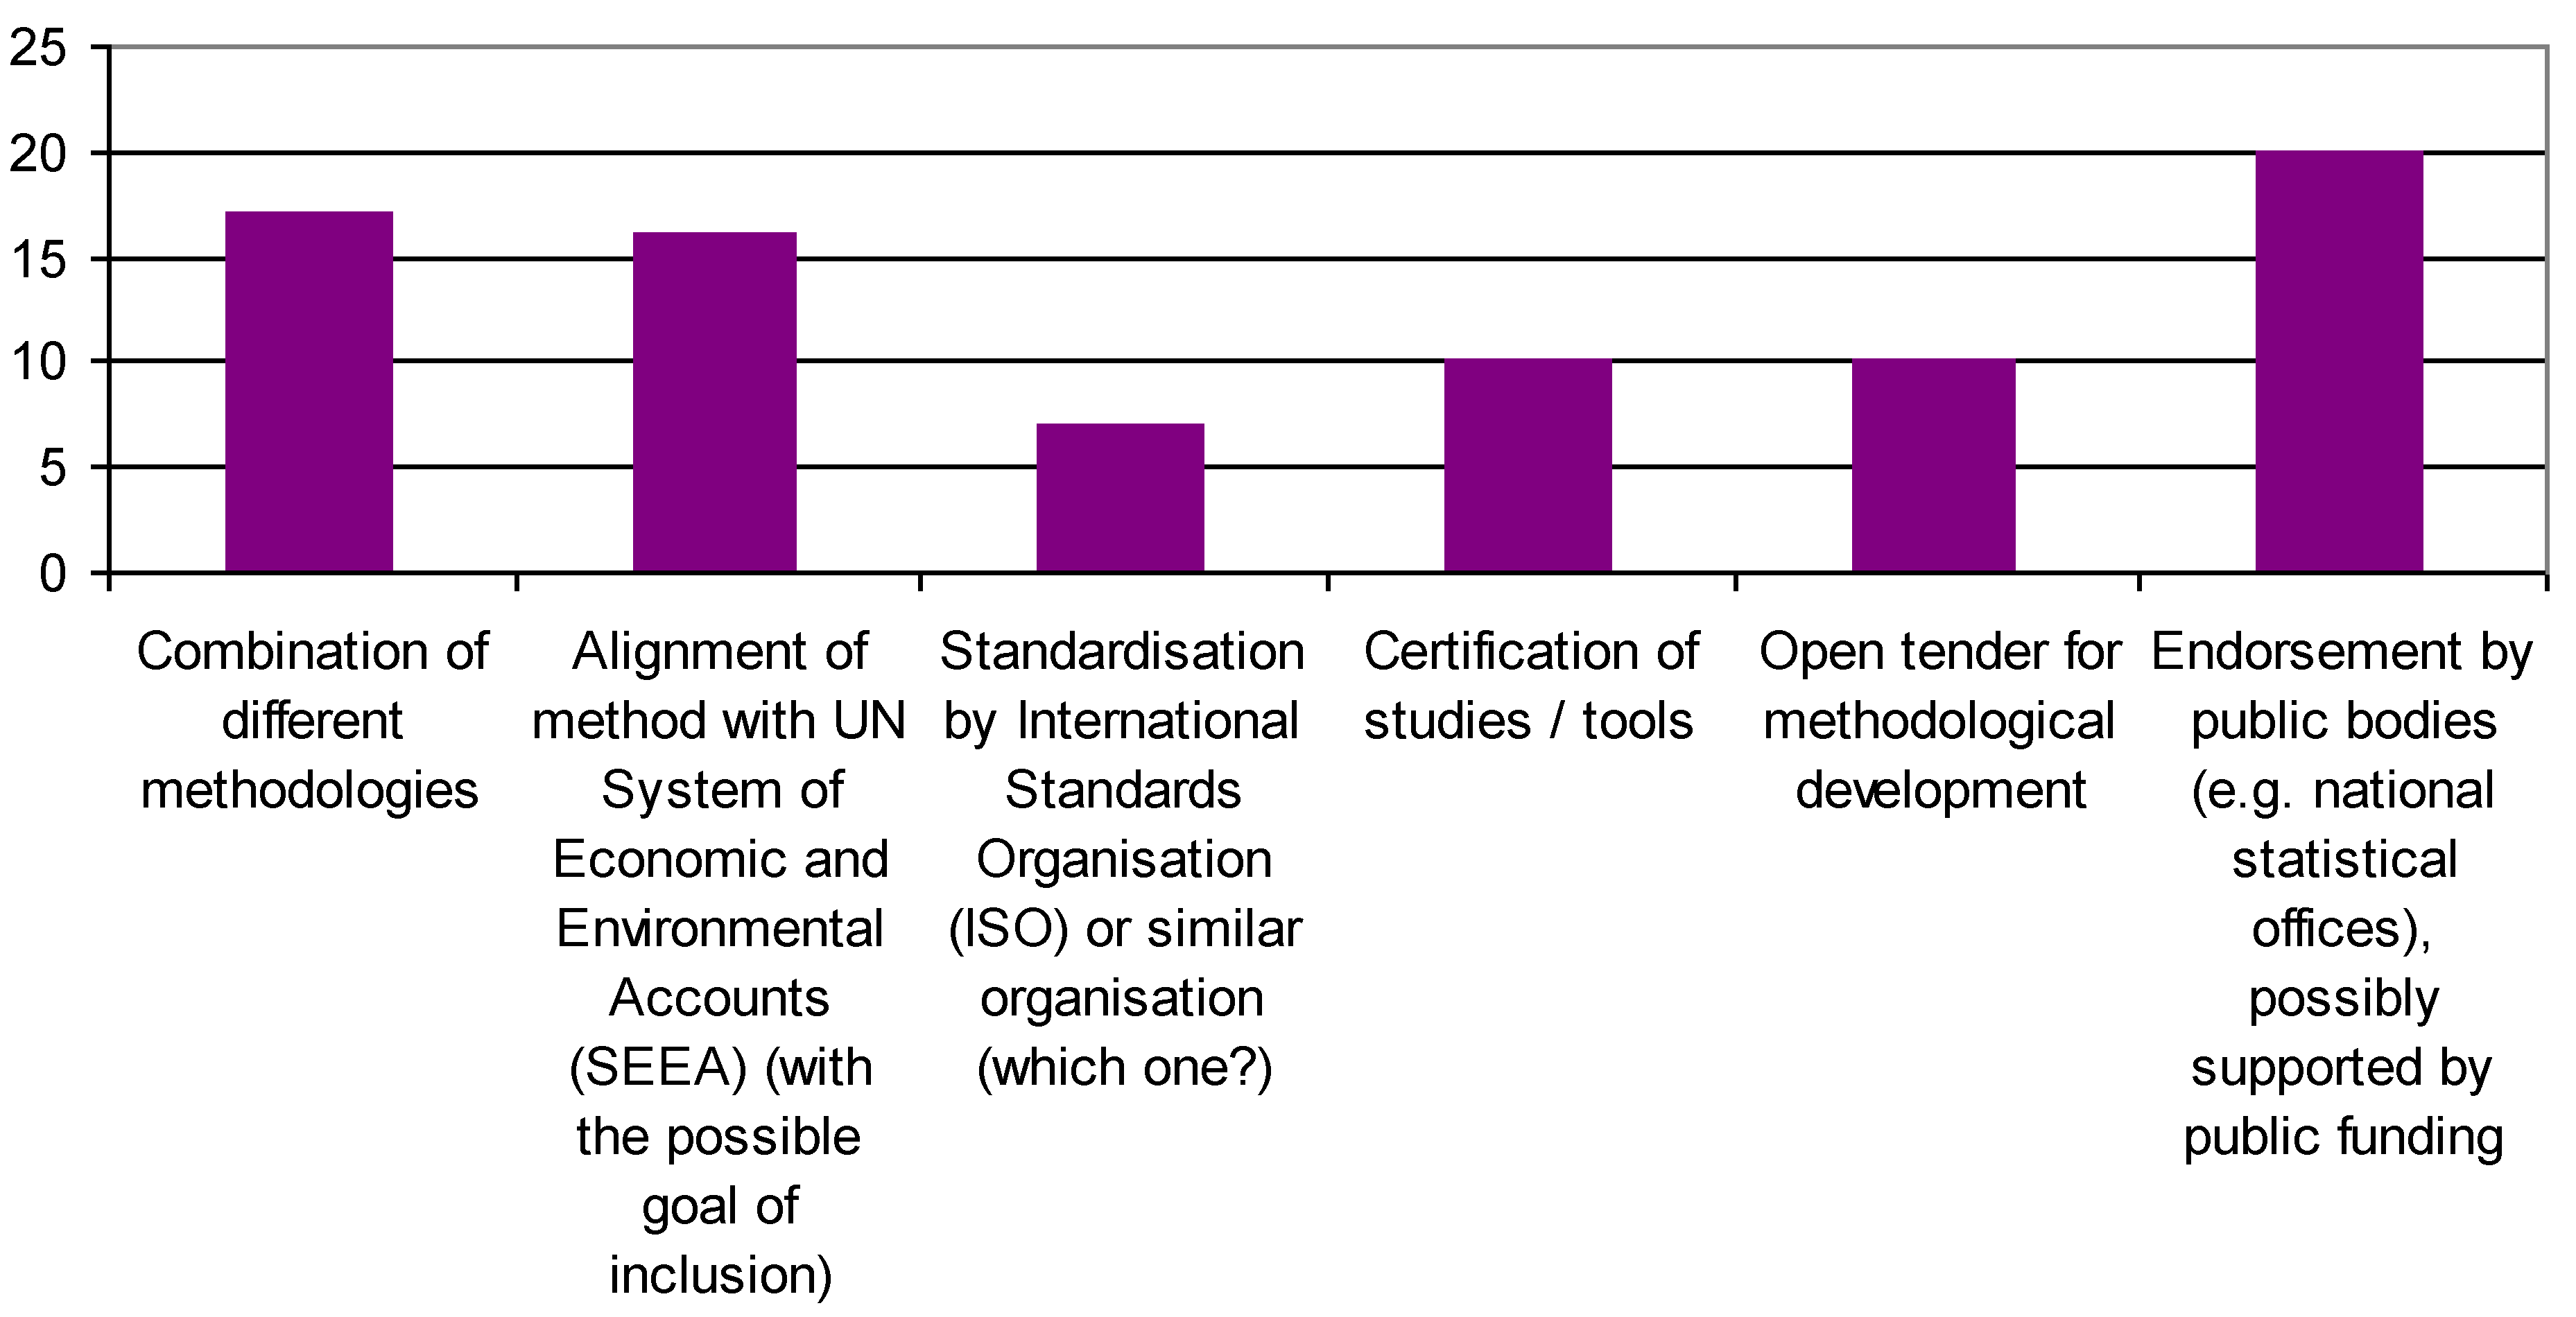
A1.3. Questions about DESIRABLE Aspects of the Ecological Footprint Indicator and Methodology
- Crop productivity
- Overgrazing
- Desertification
- Land erosion
- Eutrophication
- Deforestation of primary forests
- Threat to species (reproductive rates)
- Biodiversity (number of species)
- Overfishing
- Impacts of fish farming/aquaculture
- Ecosystem services
- Water shortages
- Ecotoxicity (e.g., bioaccumulation of persistent pollutants)
- Impacts of mining of non-biological resources (e.g., open pit mining, precious metal mining, etc.)
- Climate change
- Combination of different methodologies
- Alignment of method with UN System of Economic and Environmental Accounts (SEEA) (with the possible goal of inclusion)
- Standardization by International Standards Organization (ISO) or similar organization (which one?)
- Certification of studies/tools
- Open tender for methodological development
- Endorsement by public bodies (e.g., national statistical offices), possibly supported by public funding
A1.4. Questions about Personal Involvement with the Ecological Footprint
A1.5. Response to Question 1: Defining the Ecological Footprint
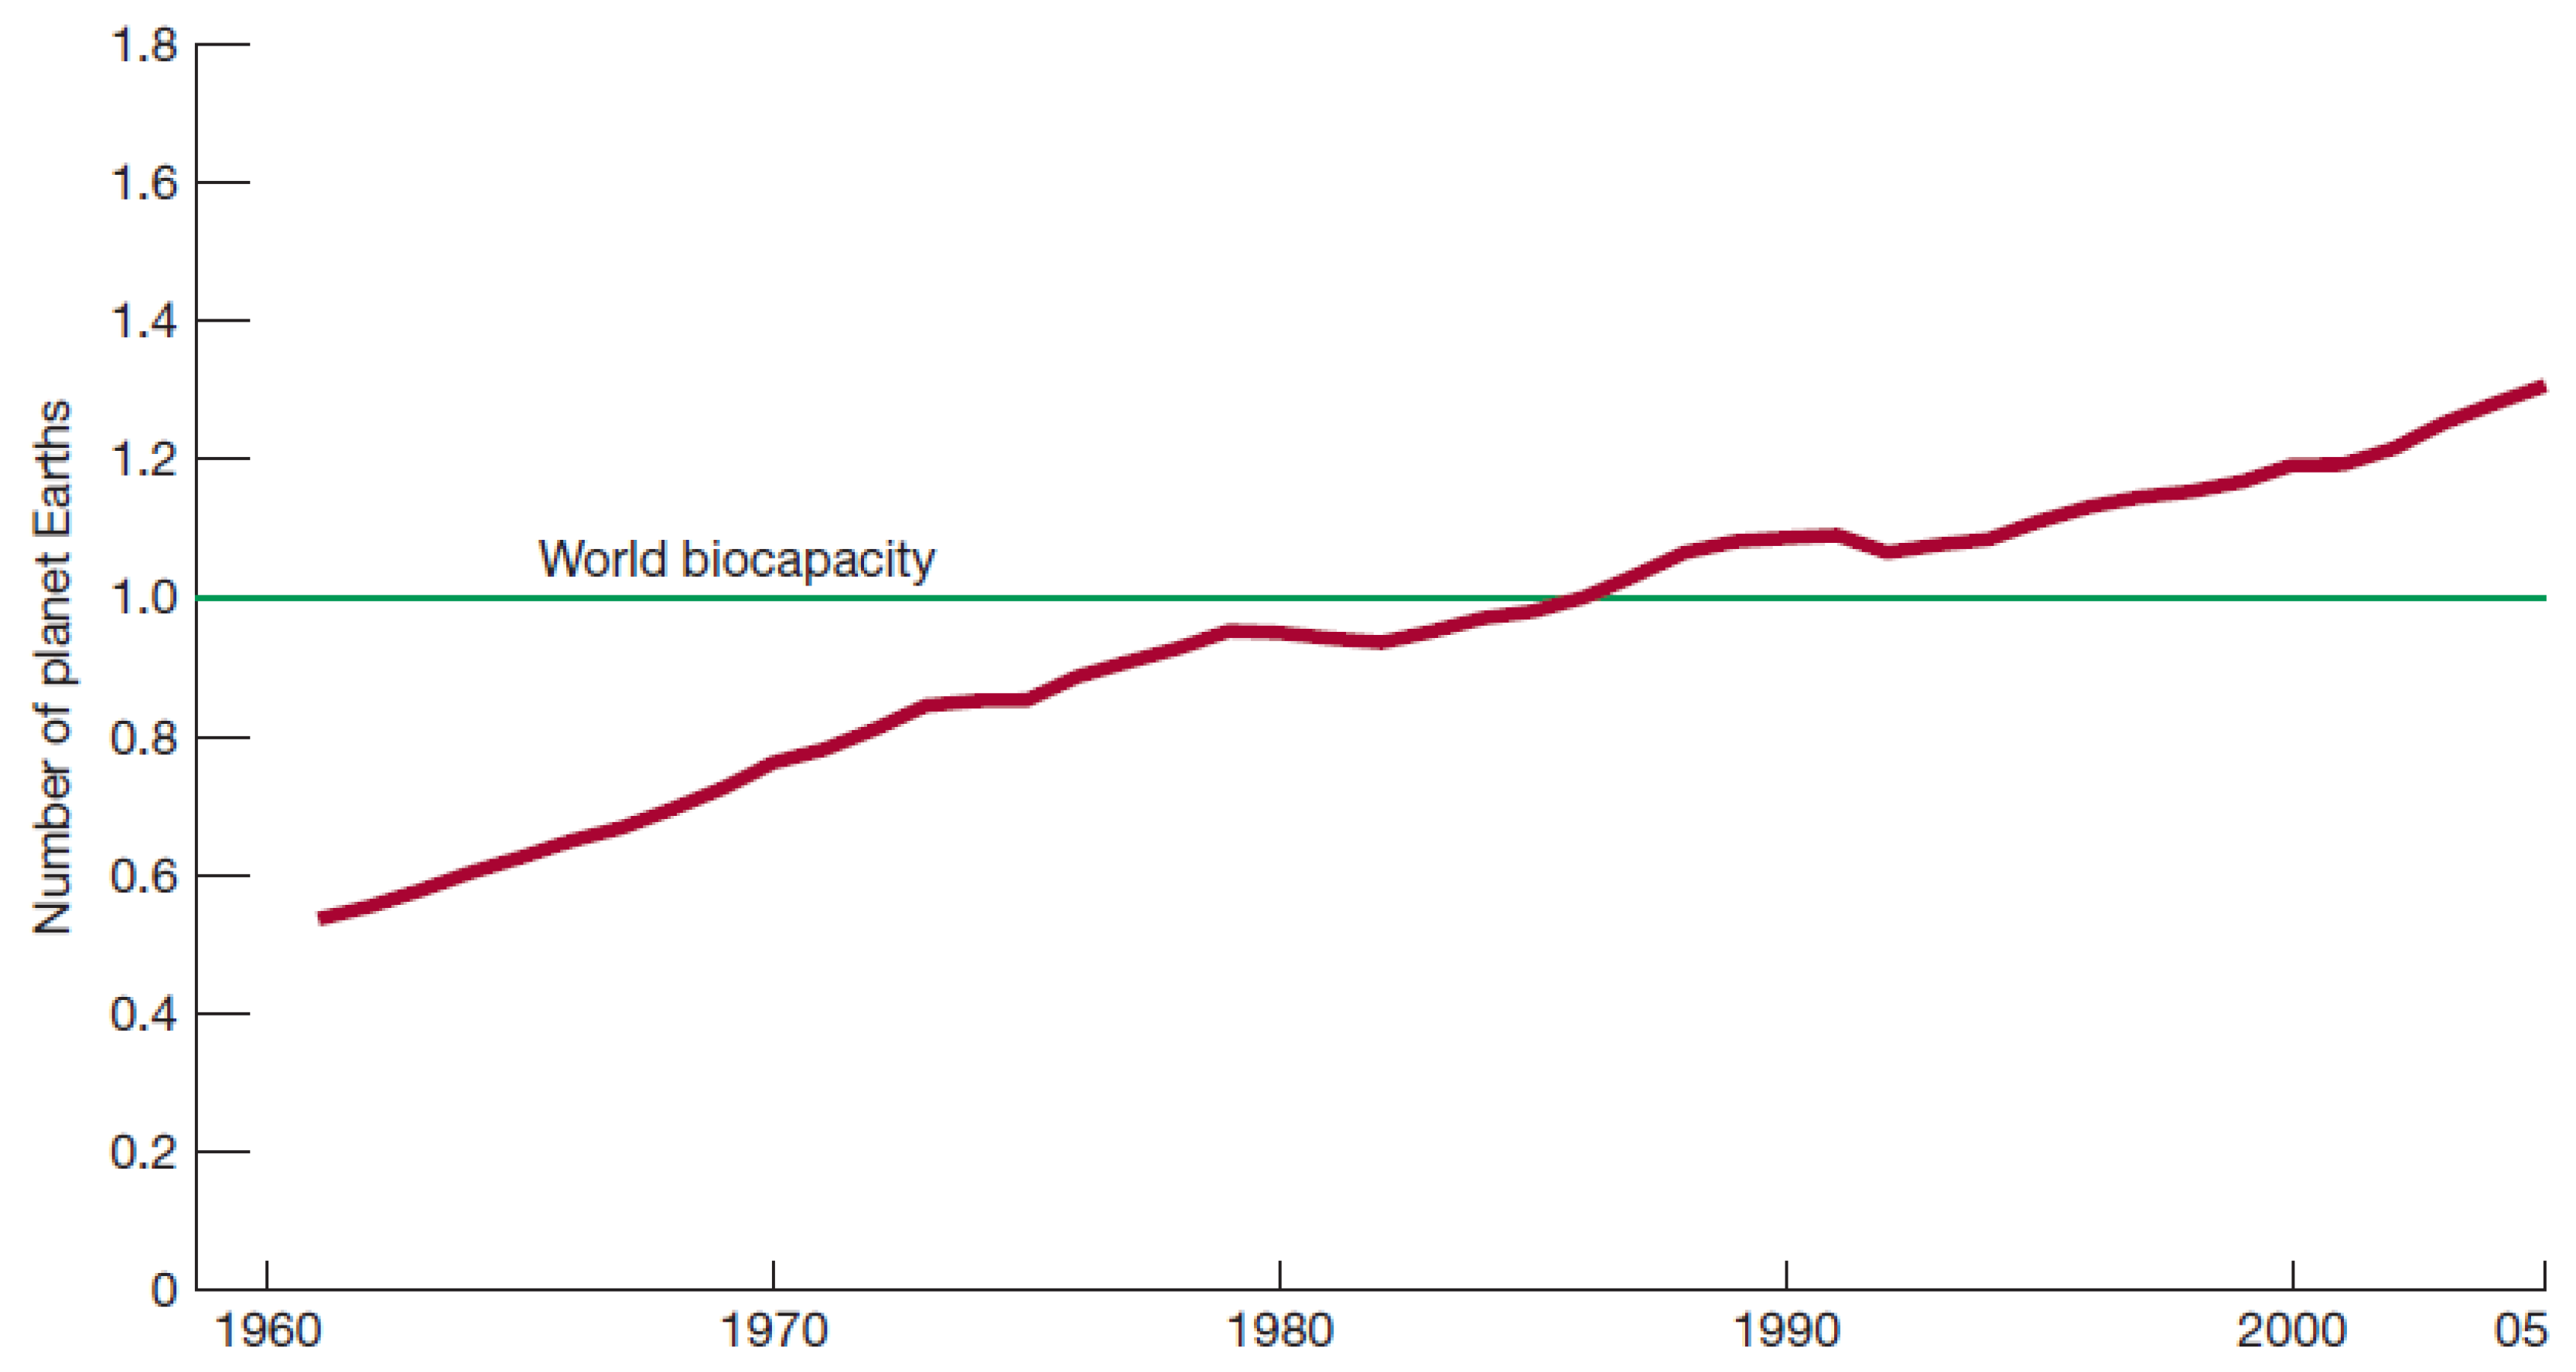
A1.6. Response to Question 2: Exceeding Ecological Limits
A1.7. Response to Question 3: Ecological Overshoot
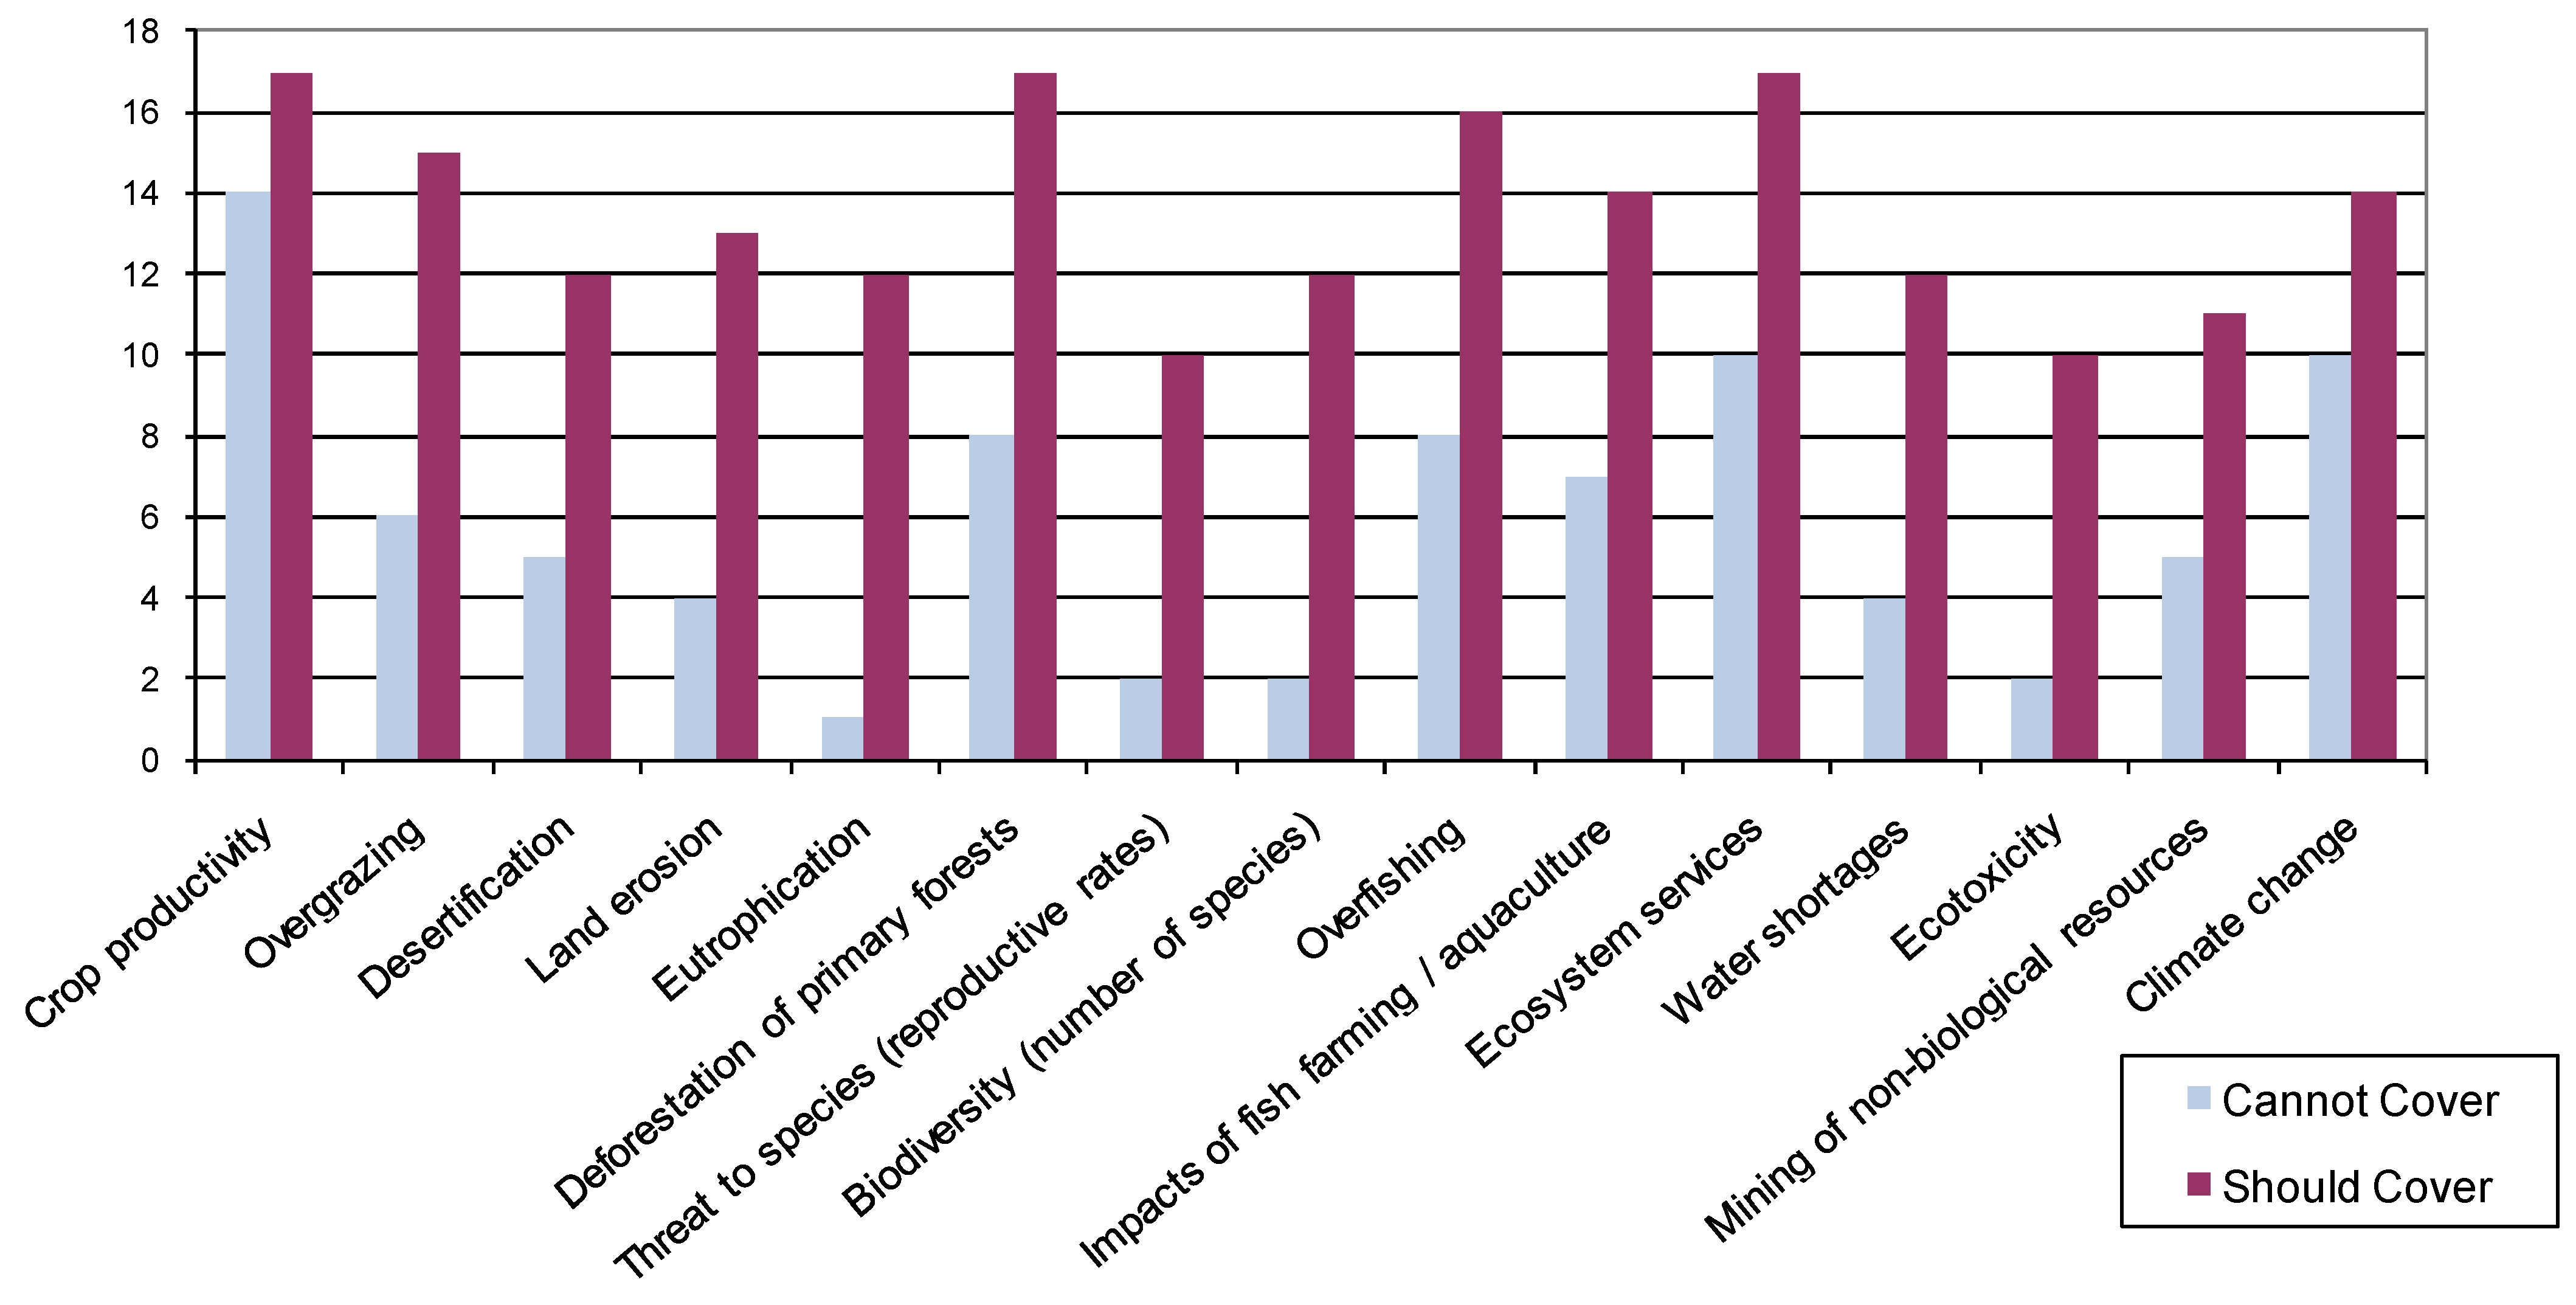
A1.8. Response to Questions 4 and 11: Ability to Inform Key Environmental Concerns

A1.9. Response to Questions 5, 10, 16 + 17: Aggregated Indicators
A1.10. Response to Question 6: Applicability of the Ecological Footprint to measure WWF’s Footprint Goal
A1.11. Response to Questions 7–9, 12–15, 18 + 19: Application to Policy Formulation

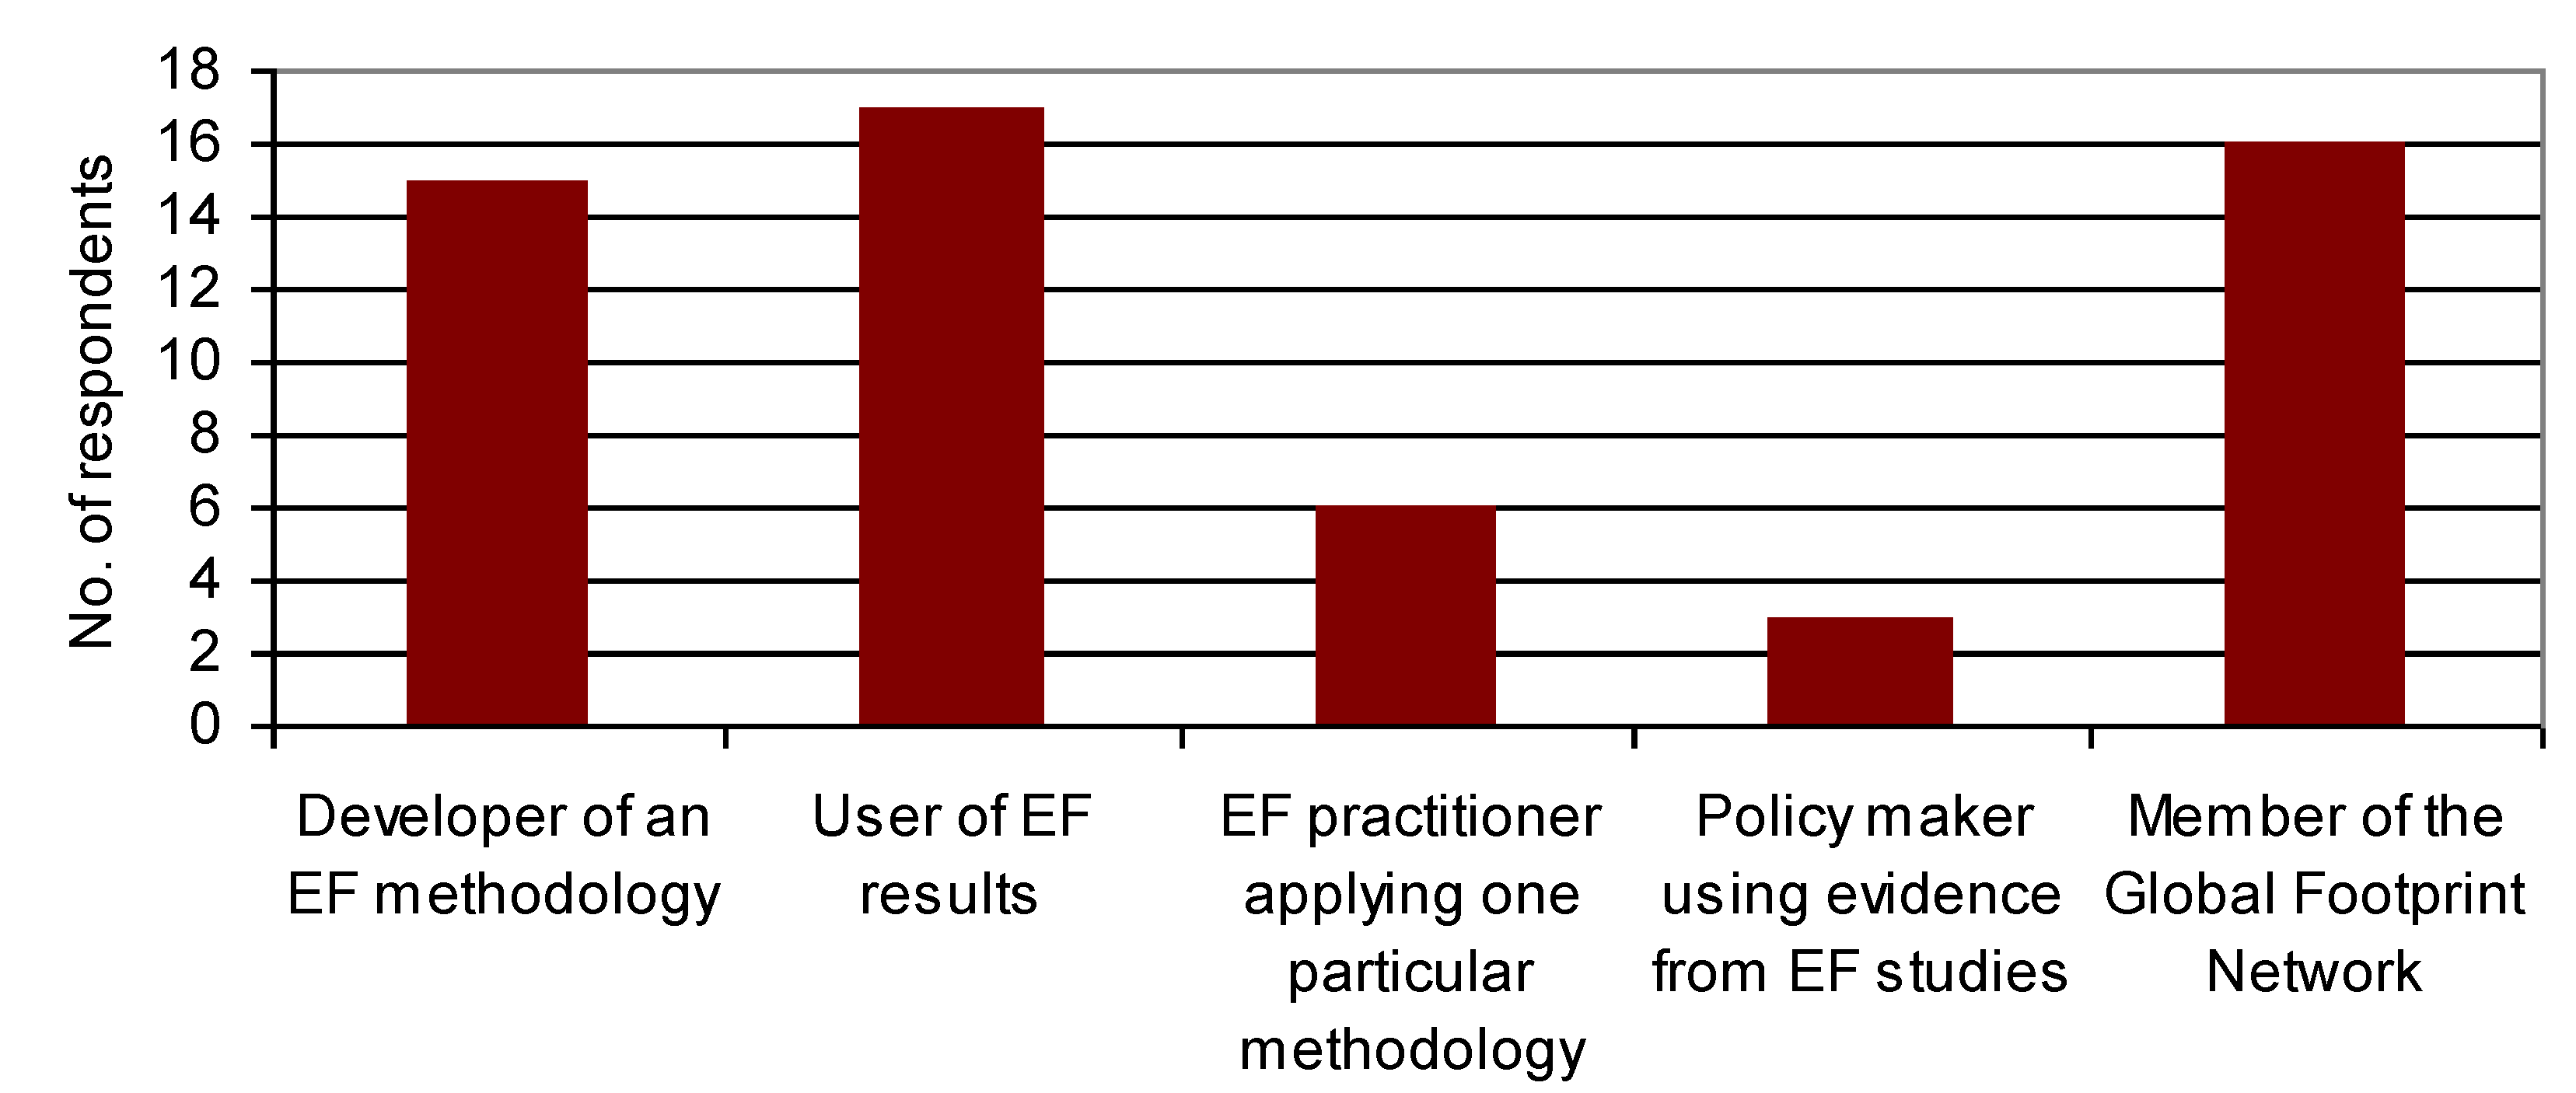
A1.12. Response to Question 20: Involvement with the Ecological Footprint
Appendix A2. Full Review of Methodological Options for the Ecological Footprint
Scope of Work
- A.
- Conventional Ecological Footprint Accounting
- B.
- Variations of the conventional method (non input-output based)
- C.
- Dynamic Ecological Footprint models
- D.
- Input-output based methods
A: Conventional Ecological Footprint Accounting
B: Variations of the Conventional Method (non input-output based)
Actual land units/local yield factors
Land disturbance
Net primary productivity (NPP)
Emergy
Including further emissions and resource uses
C: Dynamic Ecological Footprint Models

D: Input-Output Based Methods
Single-region input-output models
Multi-region input-output models
© 2010 by the authors; licensee MDPI, Basel, Switzerland. This article is an Open Access article distributed under the terms and conditions of the Creative Commons Attribution license (http://creativecommons.org/licenses/by/3.0/).
Share and Cite
Wiedmann, T.; Barrett, J. A Review of the Ecological Footprint Indicator—Perceptions and Methods. Sustainability 2010, 2, 1645-1693. https://doi.org/10.3390/su2061645
Wiedmann T, Barrett J. A Review of the Ecological Footprint Indicator—Perceptions and Methods. Sustainability. 2010; 2(6):1645-1693. https://doi.org/10.3390/su2061645
Chicago/Turabian StyleWiedmann, Thomas, and John Barrett. 2010. "A Review of the Ecological Footprint Indicator—Perceptions and Methods" Sustainability 2, no. 6: 1645-1693. https://doi.org/10.3390/su2061645