1. Introduction
The Mekong Delta of Vietnam has a long history of suffering from seawater intrusion. People of the affected area practice rice farming in the wet season but they can only fish or practice aquaculture for subsistence in the dry season. Since the booming shrimp demand in the world market in the 1990s, the government has found opportunities to develop intensive shrimp farming by constructing dams to constrain saline water to the lower delta. While farmers in the upper reach can get freshwater all year round to grow three crops of rice per year, those in the lower reach can get saline water all year round to develop aquaculture. What followed was development of pioneering farms, rapid conversion of rice lands to shrimp ponds, intensive stocking of the farms and high shrimp production.
The process of learning from pilot farms was well documented by Soo [
1] for the case of Ninh Thuan in the South Central of Vietnam. The same phenomenon was also found for the case of Mekong Delta although the two areas vary in geographical, climatic and hydrologic conditions. Almost all farmers in the study region were originally rice producers. When they observed the high profit from shrimp compared to profit from rice, and they believed they have learned enough technical skills from both neighbors and training courses, they decided to convert the paddy fields to shrimp ponds. Most farmers obtained loans from local banks or relatives and friends to cover the high investment costs. In fact, unsecured loans are offered by governmental banks to encourage conversion to aquaculture. Farmers benefited from the first few years of high yields before facing the challenge of yield declines. As the yields fell below the critical level, farming became unprofitable, and the farmers were not able to pay off their debts.
Additional problems associated with intensive shrimp farming include disease, channel contamination and an inability to return to traditional rice farming. Disease is the primary immediate cause of shrimp harvest failure. Reasons contributing to the disease outbreaks include environmental conditions, climatic factors, poor quality post larvae (fry), inappropriate feeding regime/overfeeding and inadequate channel systems [
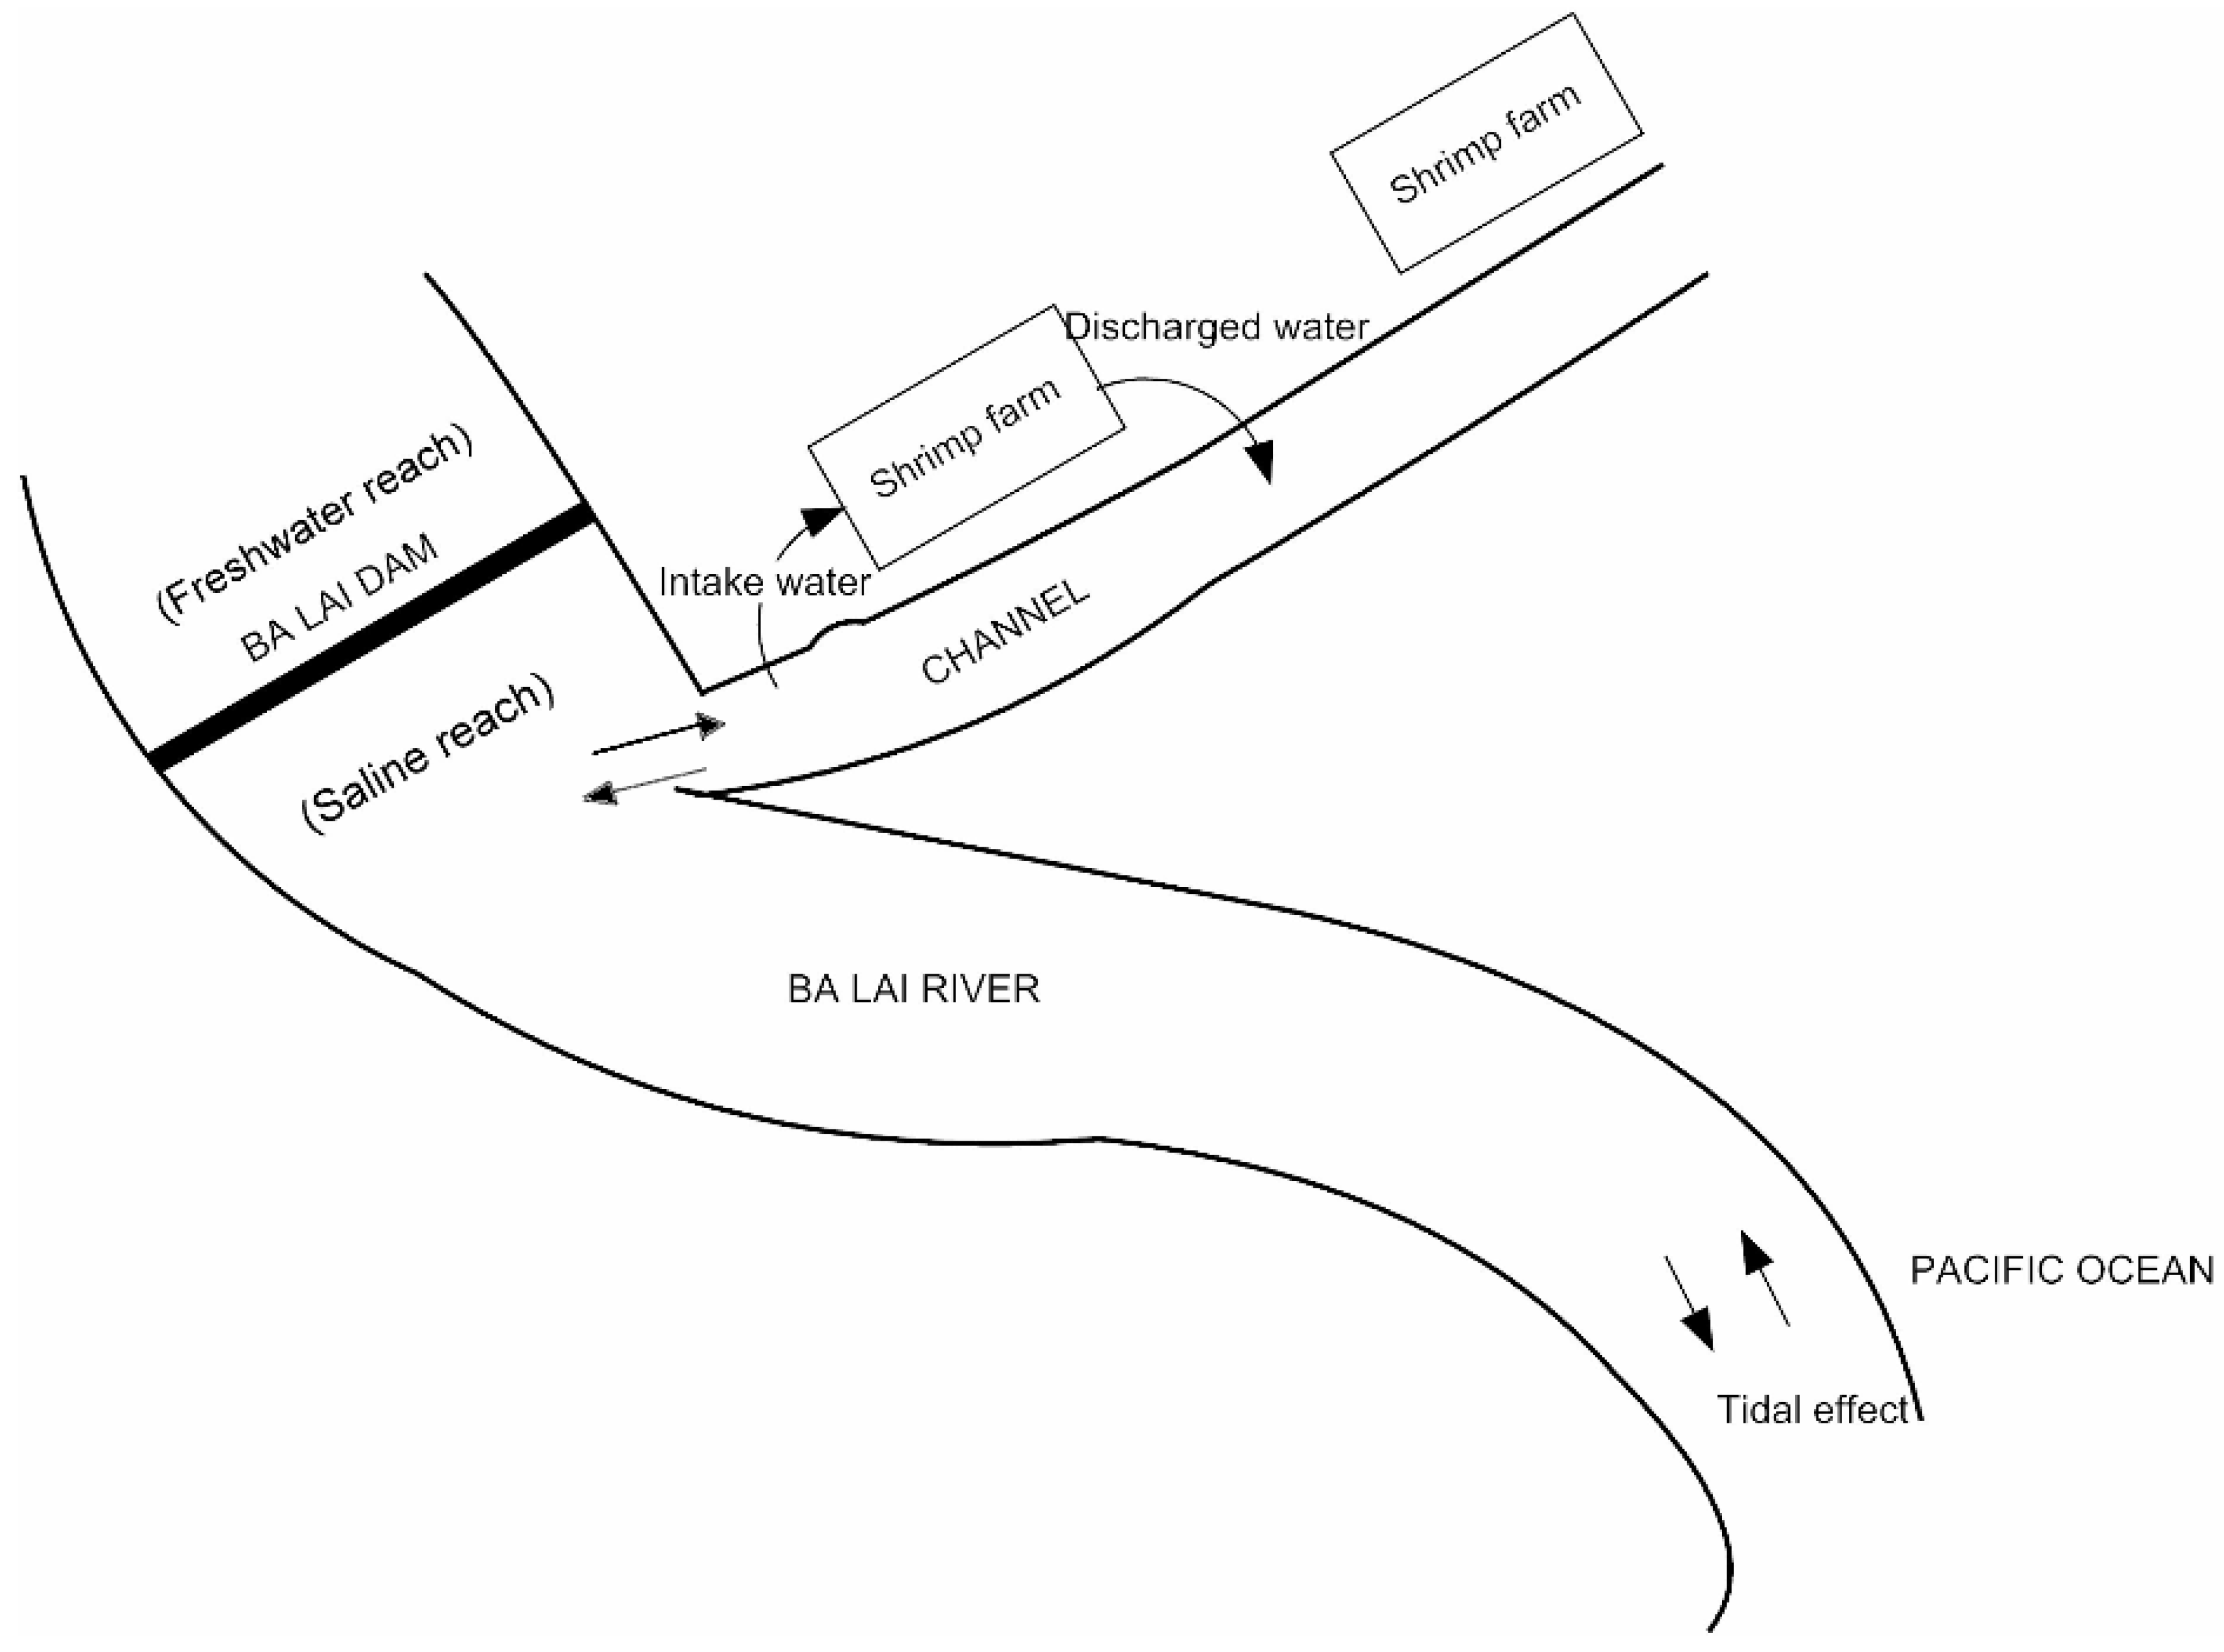
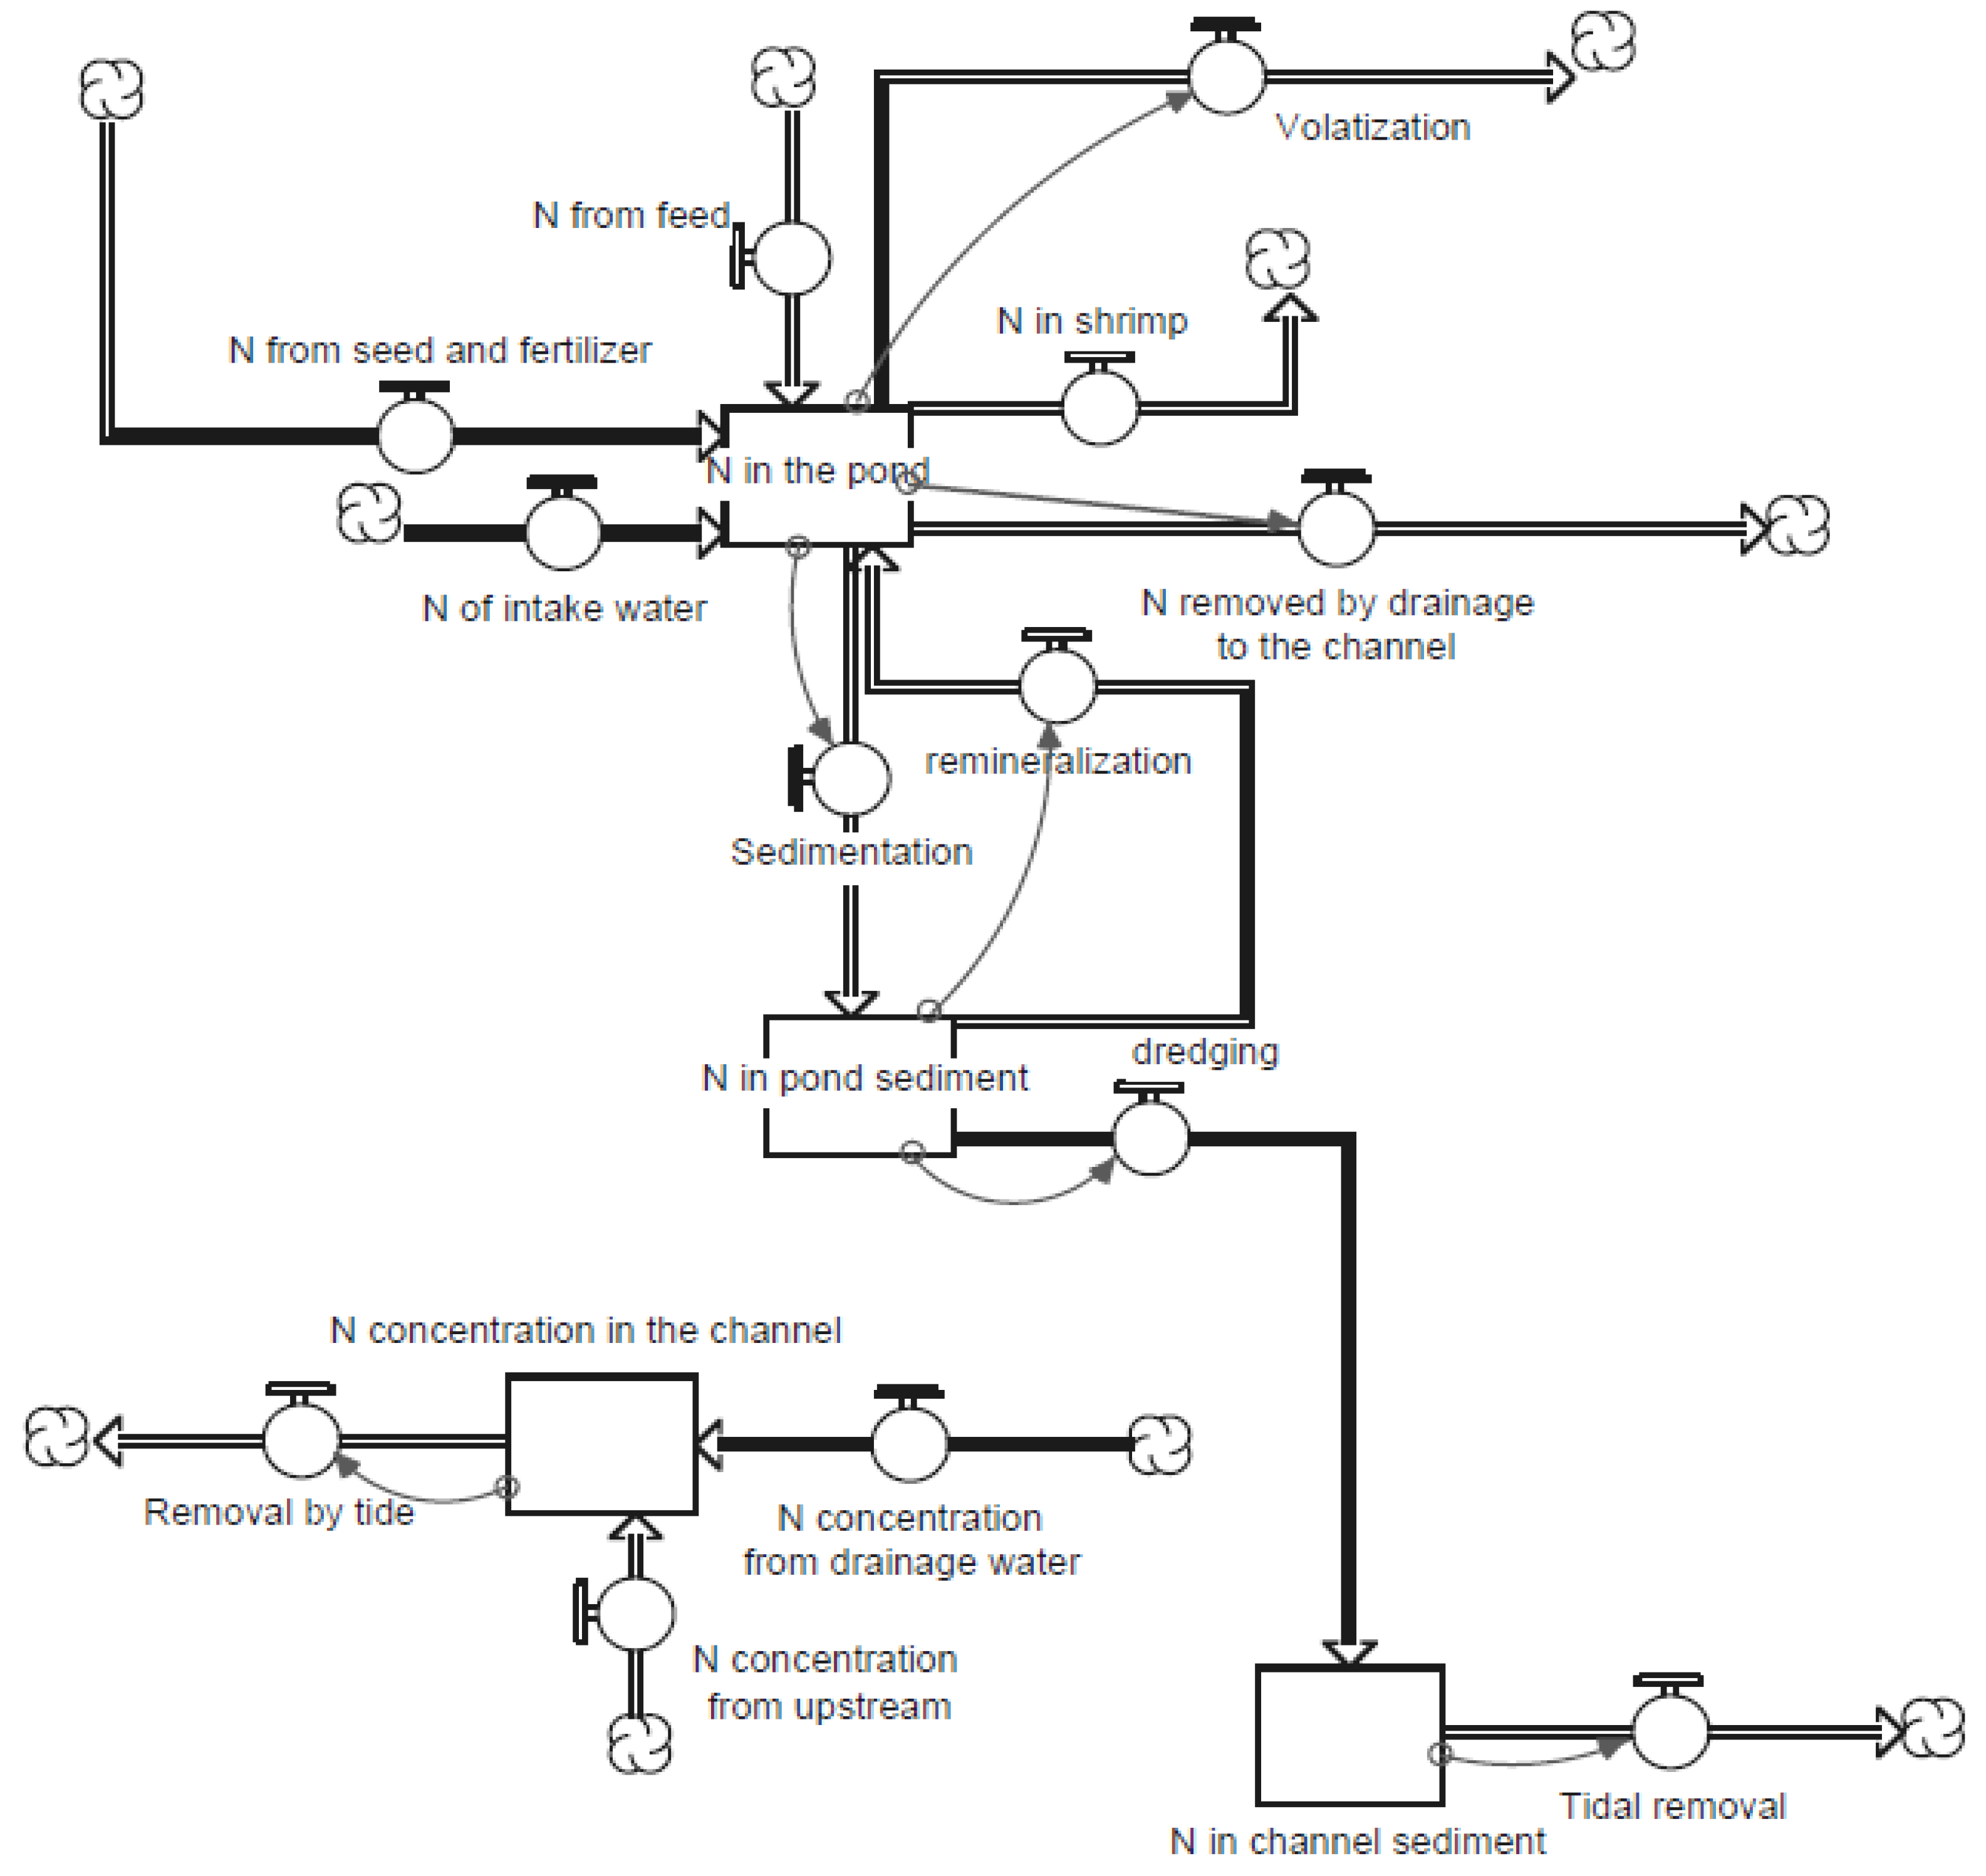
2]. The intensive use of chemicals and nutrients pollutes the water. The situation becomes worse when this water stagnates in undeveloped channel systems and subsequently enters shrimp ponds as intake water (
Figure 1). Although tidal effects help flush the water to the sea and dilute contaminants, its role fades over time as more shrimp farming is practiced. One reason for the high stock density is uneven quality of the fry. Fry cannot be produced locally. Farmers must rely on fry that are exposed to the stress of transportation to the Mekong Delta. Most farmers cannot afford to test the fry with specialized equipment before purchasing, so they attempt to compensate for uneven quality through a high stocking density (40 fry/m
2). Shrimp production carries an additional risk due to the difficulty of converting back to rice. Farmers face the high cost of converting the deep ponds to shallow fields and the challenge of flushing out the high levels of salt which have accumulated from shrimp production. The fields need to be flushed many times in order to grow rice, and the first few rice crops will have a very low yield. As a result, unsuccessful shrimp farmers tend to abandon their farms.
Figure 1.
Diagram of the water source for shrimp farms.
Figure 1.
Diagram of the water source for shrimp farms.
This paper describes a dynamic model of the learning process of farmers. The model focuses on their perceptions of the economic profits that lead to rapid conversion from rice to shrimp. The model then simulates the interplay between shrimp farming and the environment and the longer term consequences for the farmers. The model is used to test several scenarios corresponding to farmers’ possible responses to the decline in yield. The simulations lead us to the conclusions that learning from neighbors should be a selective process. The simulations help us to understand the limitations to human foresight that can lead to irreversible consequences.
2. The Study Area
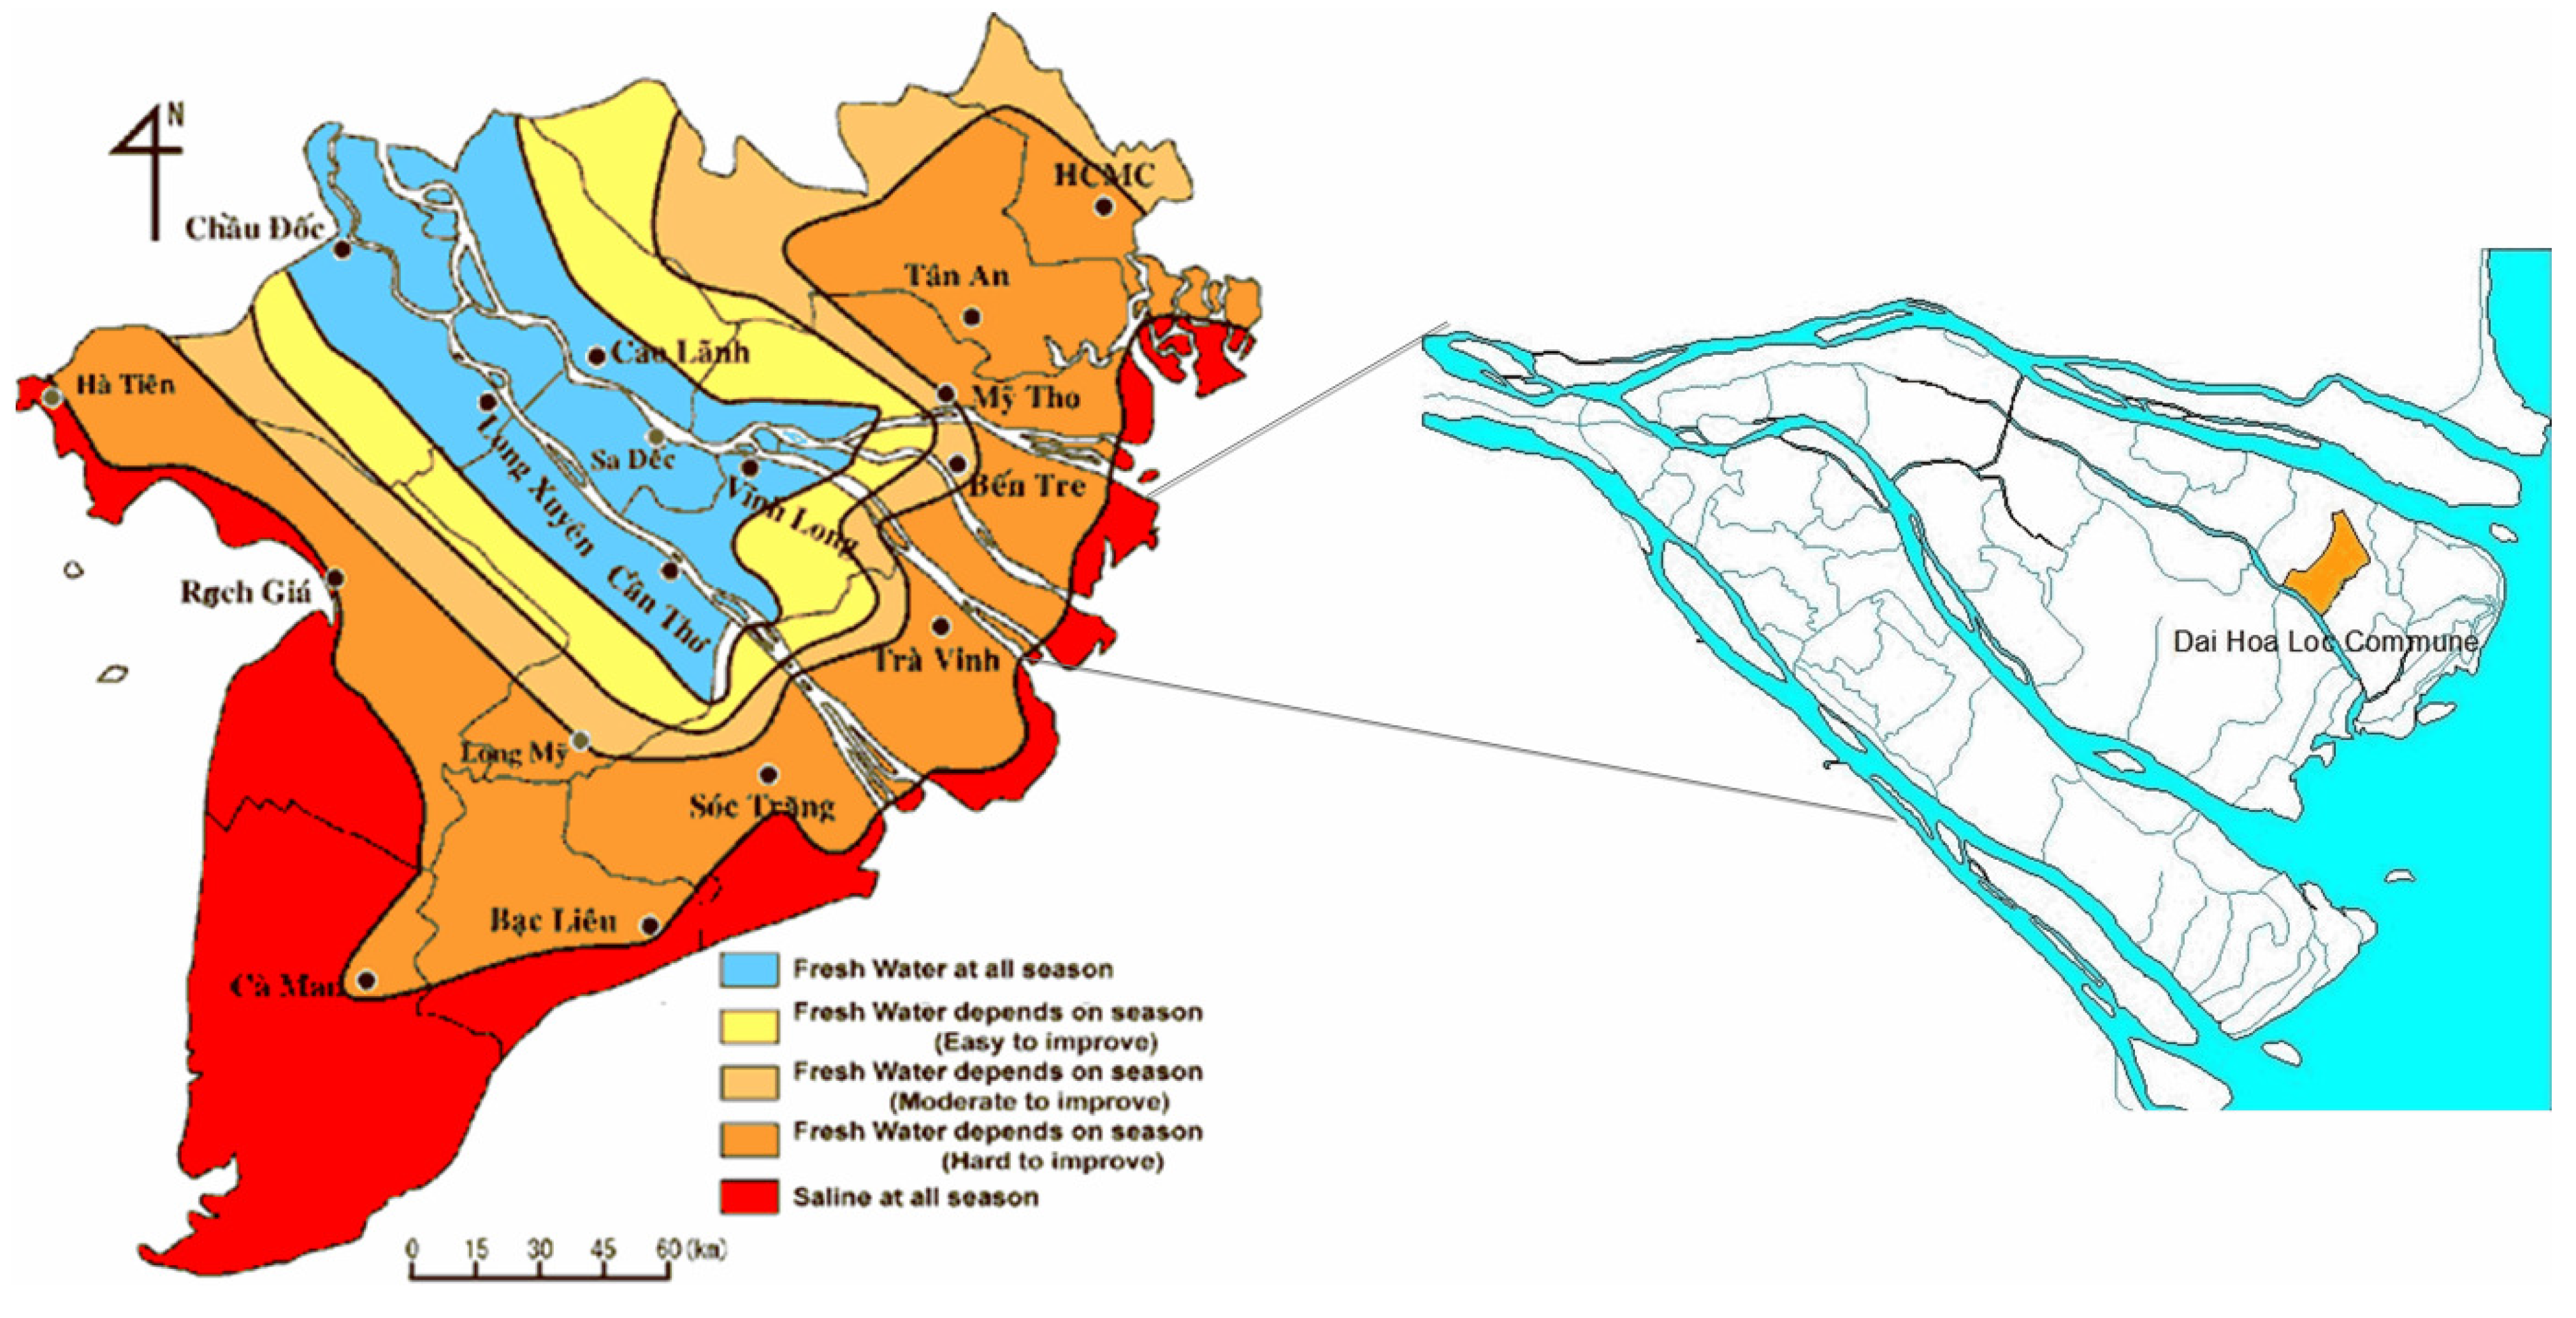
Dai Hoa Loc Commune, Ben Tre Province covering an area of 2,356 ha is the focus area of this study (
Figure 2). Its population in 2008 was 8,625 with 2,150 households, with 90% of the population engaged in farming. This area has a monsoon climate with a rainy season from May to November and a dry season from December to April. In the past, this region experienced six months of saline intrusion in the dry season. Before the year 2000, most people spent the dry season growing rice, making salt or going fishing. (Mangrove forests, common in many shrimp producing areas, are not present. Rather, the wetlands consist of water coconuts, floating grasses and shrubs.) In 2000, the government constructed Ba Lai Dam and Sluice Gate over the Ba Lai River at the upper bound of this commune to prevent salinity intrusion. Lands upstream from the dam benefit from freshwater supply all year, and it was planned to grow three rice crops per year. The lands downstream from the dam have saline water in all seasons, conditions which are suitable for aquaculture. Construction and operation of the dam has led to dynamic change of land use in this area. By 2003, for example, the area completed a mass conversion of land from rice farming to shrimp production. Salt pans no longer existed, and by 2009, shrimp land covered about 82% of the land. Rice farming, once the traditional activity in the area, was limited to only 10% of the arable land.
Figure 2.
Map of the Mekong Delta adapted from Akira Yamashita [
3] and the study area.
Figure 2.
Map of the Mekong Delta adapted from Akira Yamashita [
3] and the study area.
3. Model Description
3.1. Model Overview
We constructed a dynamic model describing the complex interactions between the processes of converting paddy fields to shrimp ponds and nitrogen cycling in the aquatic system. The model is grounded in fieldwork conducted in the summer of 2008 and benefits from the simulation study by Soo [
1]. The modeling is also supported by the general literature, especially the economic evaluation presented in the paper “Risky business: Vietnamese Shrimp Aquaculture—Impacts and Improvement” by Environmental Justice Foundation [
2].
The model follows the system dynamics approach which was first developed in the 1960s by Jay Forrester [
4] for analysis of business systems. System dynamics has been widely applied to environmental systems [
5,
6] as well as business systems [
7]. The model is implemented with Stella, an icon-based software that emphasizes the stocks and flows in the system (
http://www.iseesystems.com/).
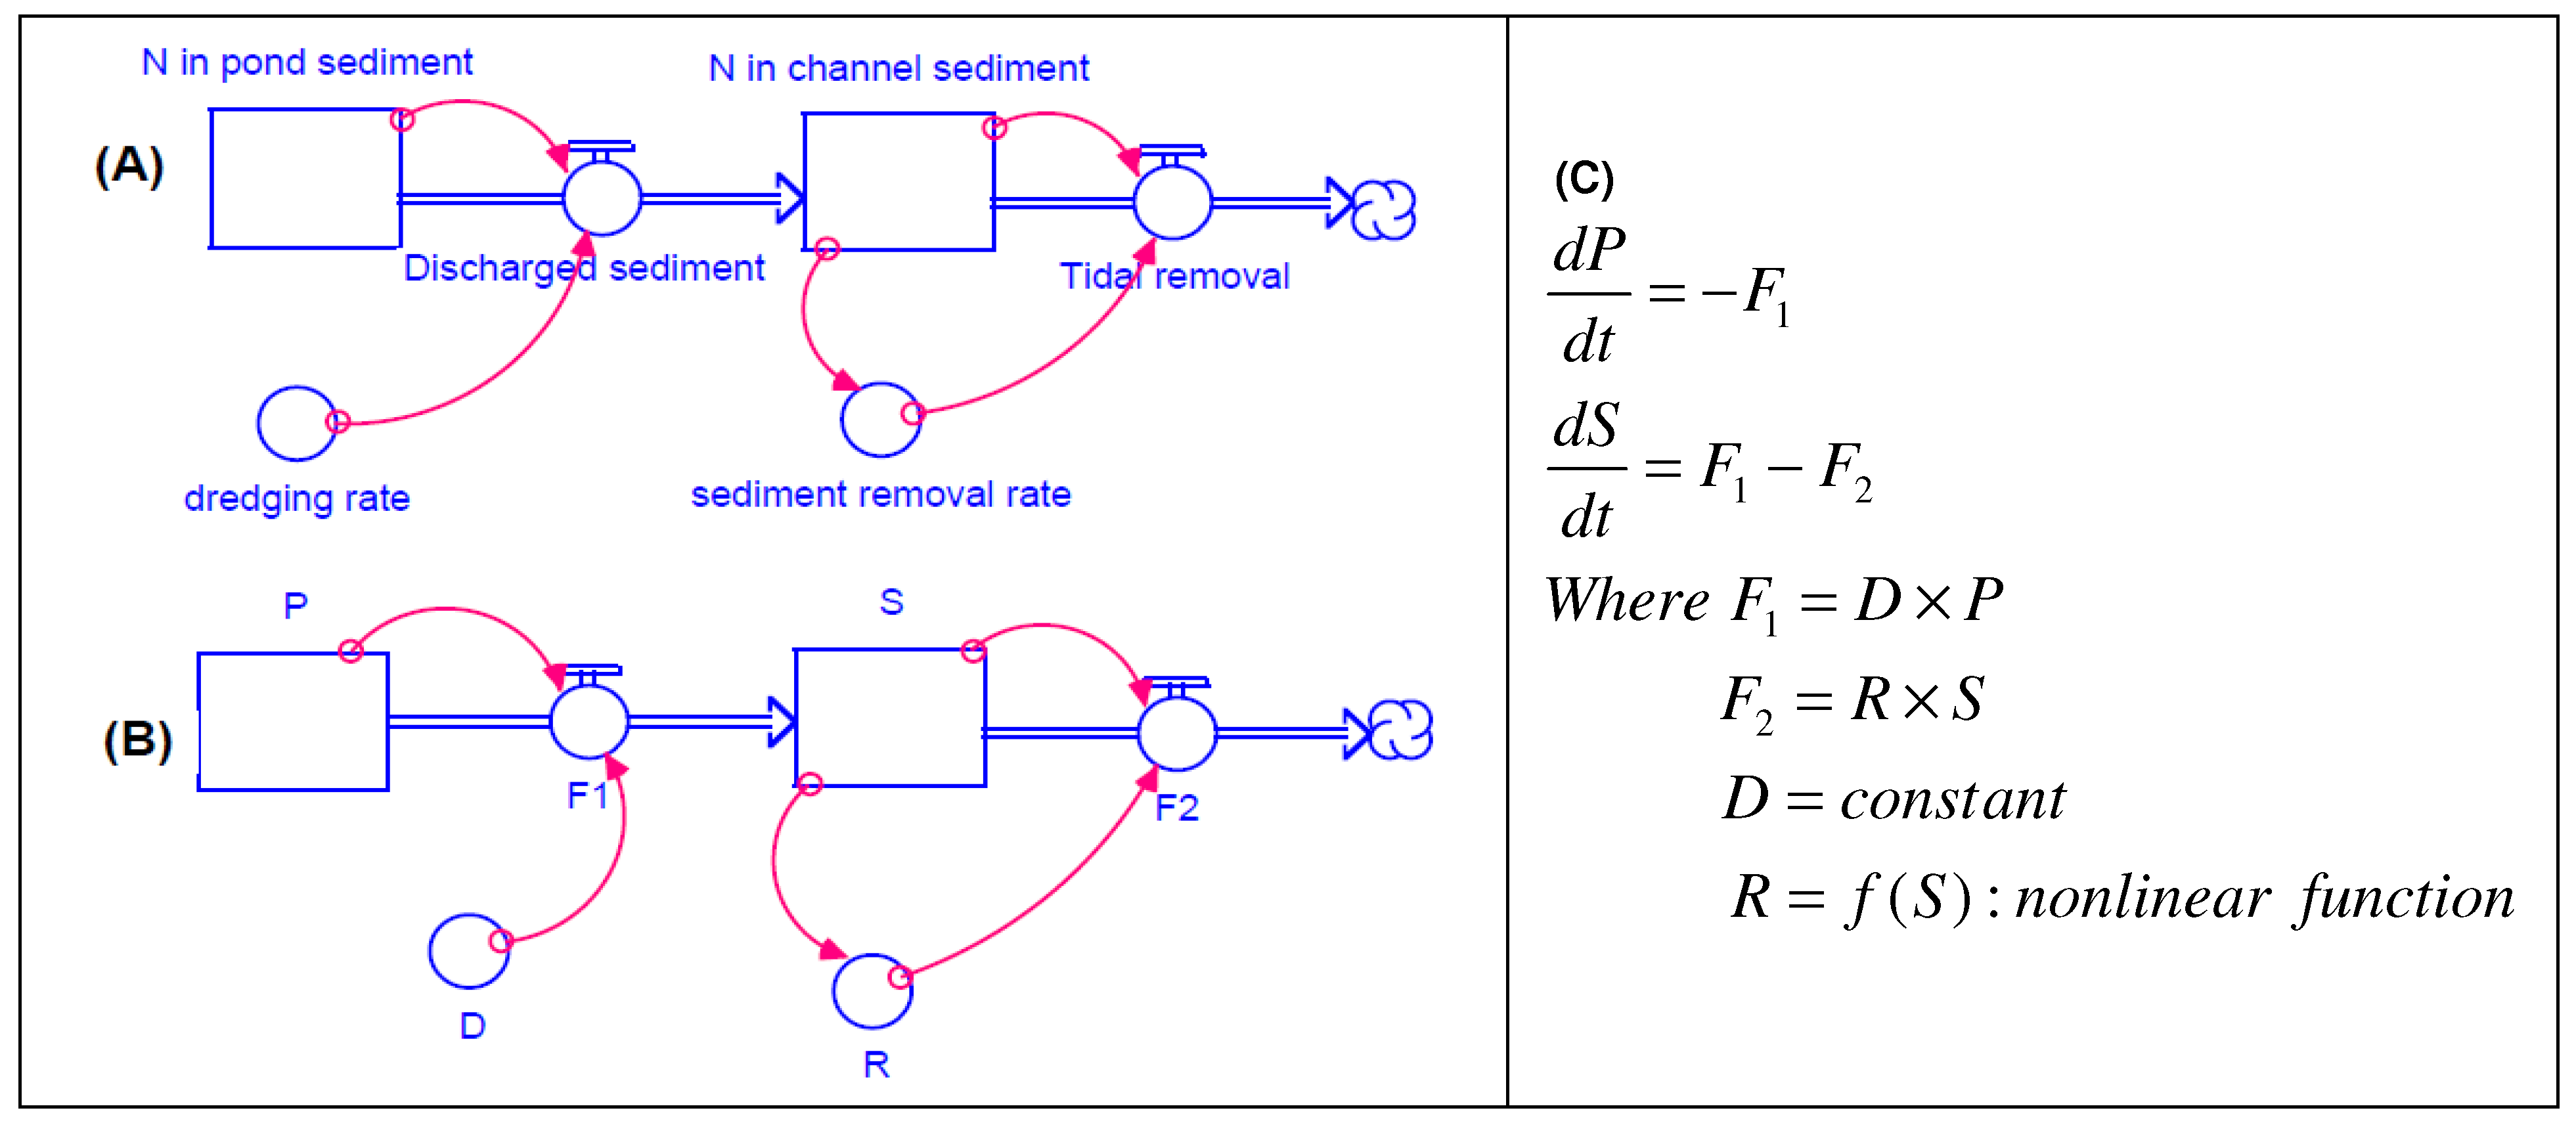
Figure 3 shows a small portion of the model where the discharged sediment from the pond is accumulated in the channel system and then removed by the tidal effect. The double lines in panel A represents the flow of nitrogen, and the rectangles represent the stock where nitrogen is accumulated. Panel B shows an equivalent model with variable names reduced to the short names that are typically used in writing differential equations. System dynamics models are a collection of first order differential equations which are solved by numerical integration. Panel C shows the differential equations corresponding to the small model of nitrogen accumulation.
Figure 3.
Stocks and flows for nitrogen accumulation along with the corresponding differential equations.
Figure 3.
Stocks and flows for nitrogen accumulation along with the corresponding differential equations.
The model includes modules for shrimp land and nitrogen accumulation. The interaction between these modules is the key to the simulation results. When more shrimp land is developed, more nitrogen is discharged into the environment. The excess nitrogen will deteriorate water quality, reduce shrimp yield, reduce shrimp profit, and slow the subsequent development of shrimp land. This is a typical pattern of development reaching the carrying capacity of the environment. The modules are described briefly below. Supporting information is provided in the appendices and by Nguyen [
8].
3.2. The Shrimp Land Module
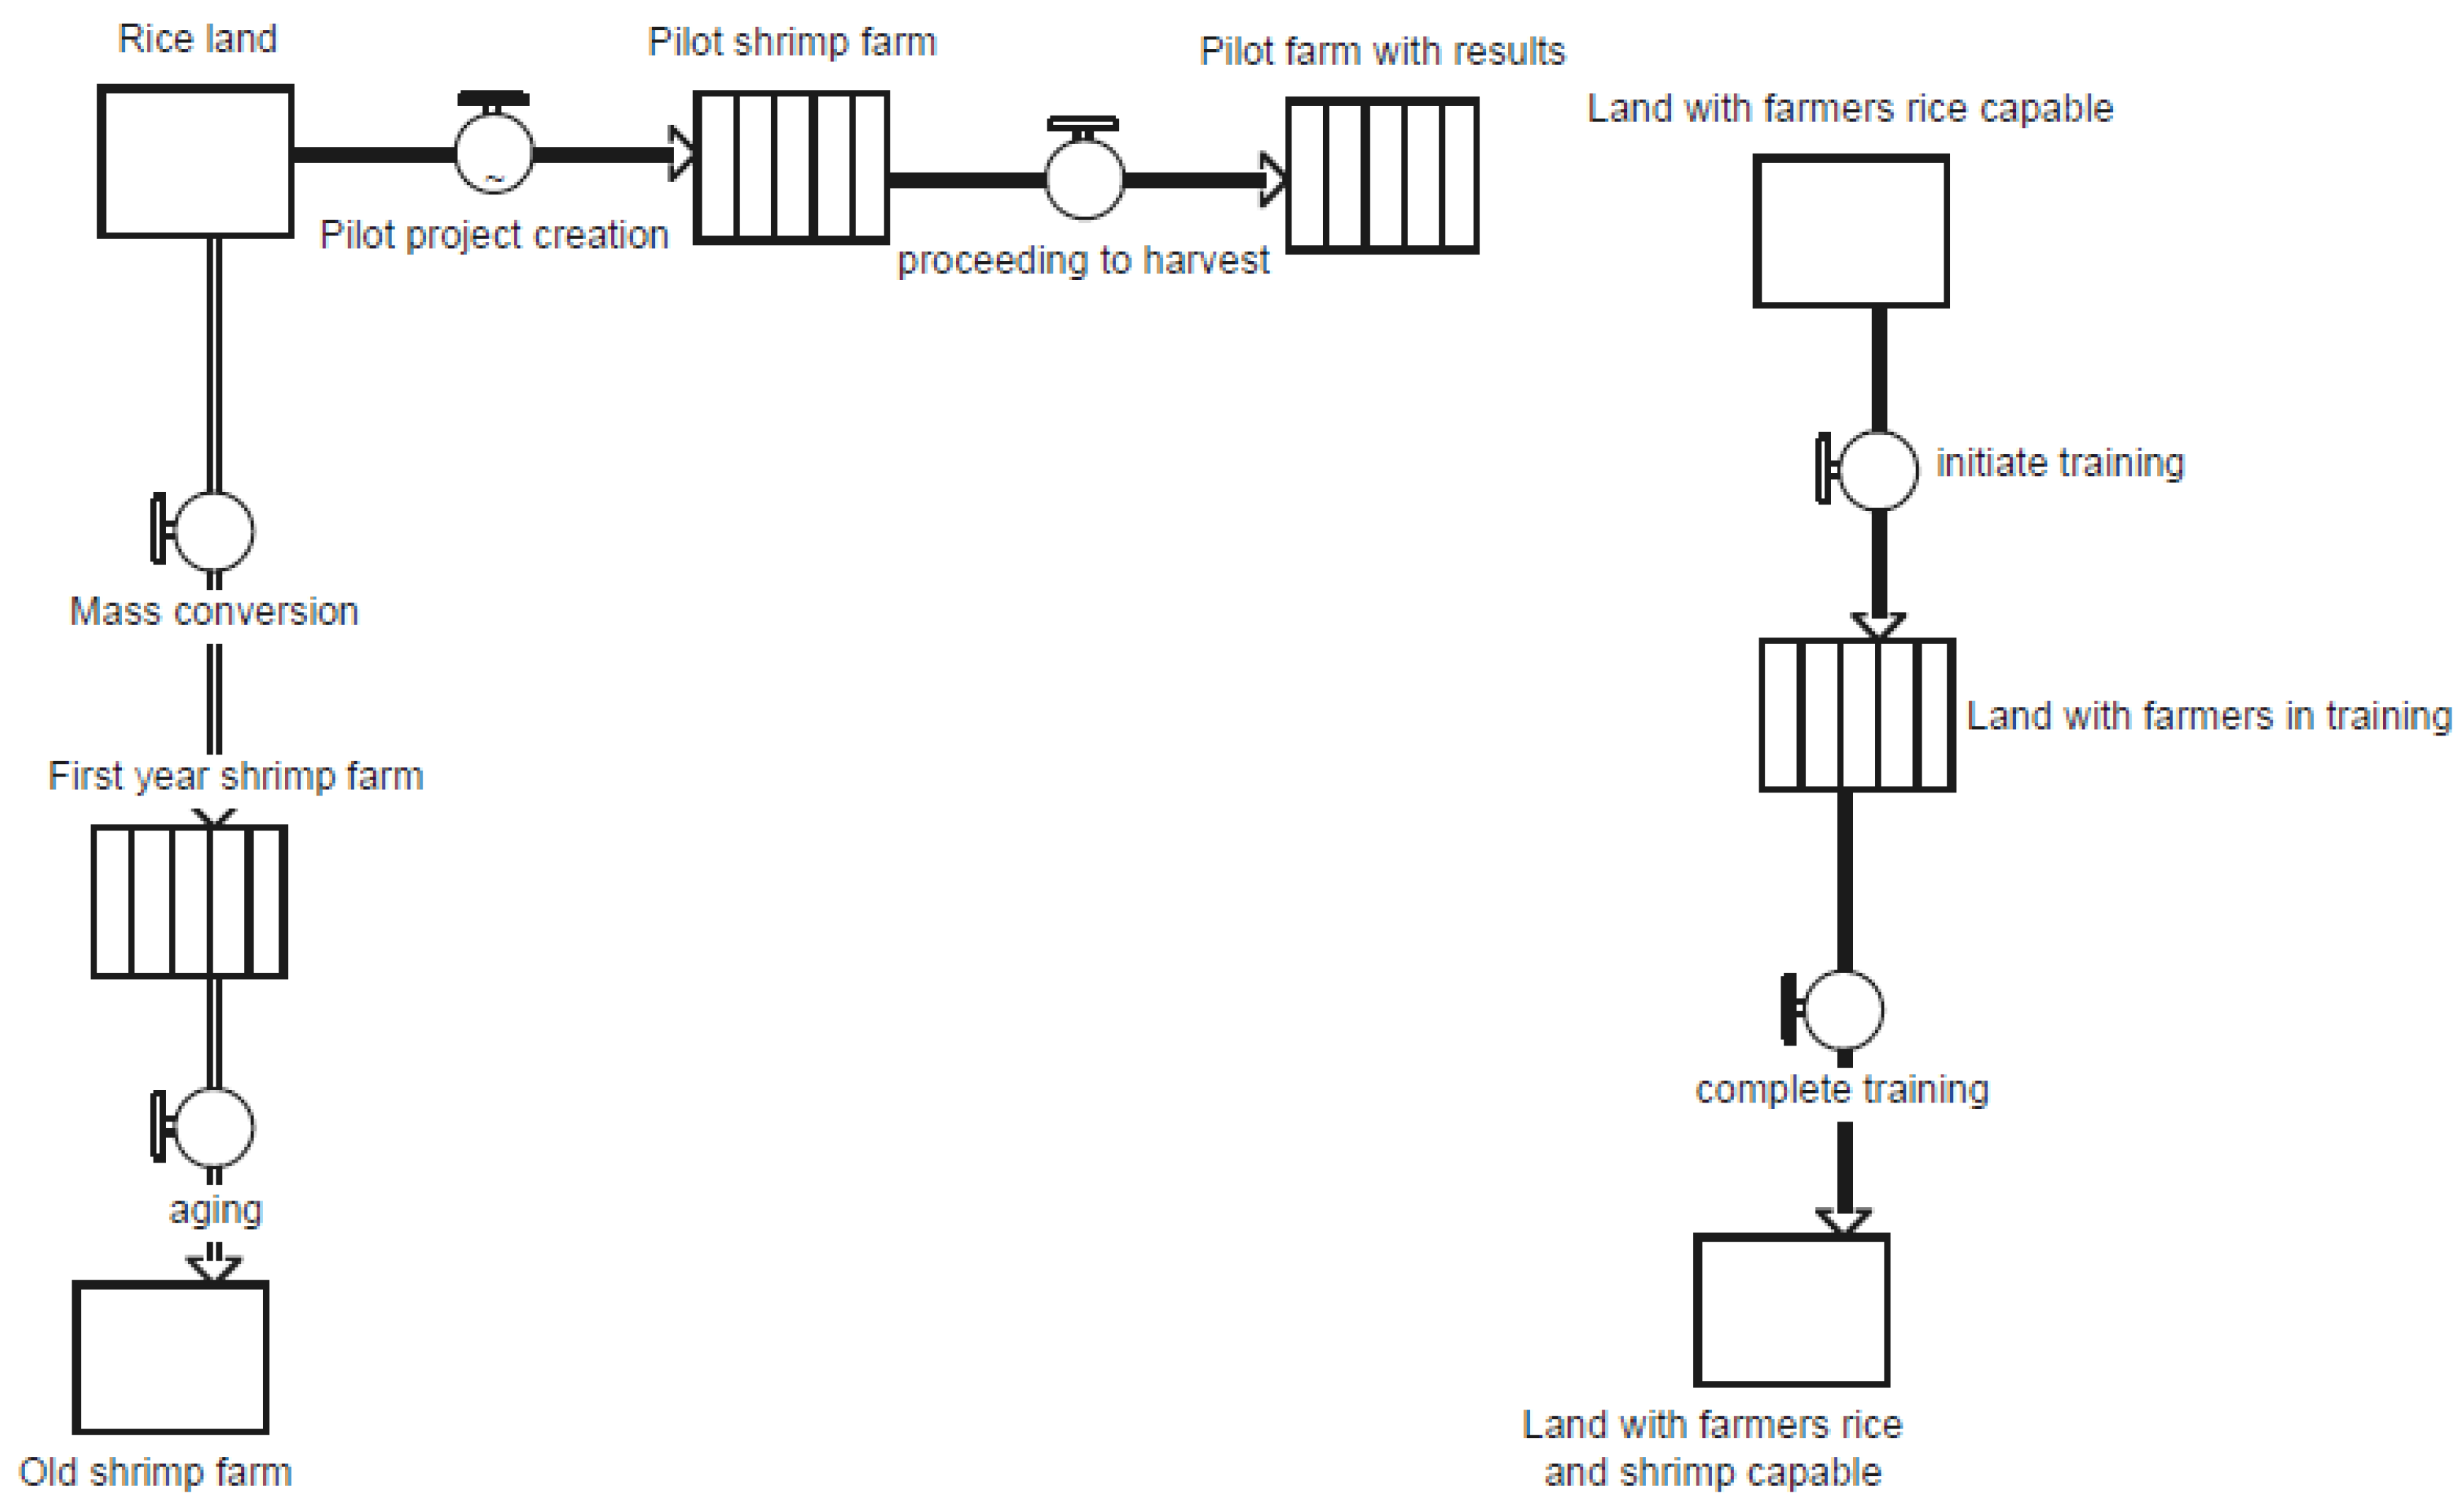
The Shrimp land module describes the conversion process from rice land to shrimp land. The process begins when some pilot farms are created. People observe the profit from these farms, compare with the profit from rice and become interested in shrimp farming. In this model, rice price is fixed for easier comparison. It takes the farmers a year or more to observe the profit, and this delay is represented by a one-year lag time in observing previous profits. When the high profit becomes well-known, rice farmers begin to learn the new farming techniques. It takes them about one year to take training courses and learn from neighbors. At the same time of observing profit, they also count the bad years when there is no net benefit or even is a net loss. After gaining the necessary technique and lessons, they make the decision to convert to shrimp, hereafter referred as the mass conversion process. The separation of first year shrimp farms from old farms serves for cost calculation purpose only. In the first year, the investment is higher than subsequent years due to the fixed cost of preparing/creating the pond. To most farmers, this cost is calculated once instead of depreciating over years and this explains why the profit from the first year is not very high. There are additional operating costs such as labor cost, equipment operation cost, seed and feed costs. Seed and feed costs are dependent on the stocking density. In addition, most farmers borrow money from the bank and they have to pay off the debt. The typical borrowing period ranges from 1–5 years. The revenue from shrimp is computed based on the shrimp yield and shrimp price which is driven by the monopsony market. In calculating the shrimp supply, only effective land is taken into account. Effective land is the actual area of the main pond without the supply reservoir. The annual average income from both rice and shrimp is also tracked to see if the community is better off or worse off when shifting to shrimp. There are four variables of this module connecting to the next module: stock density, feed applied, shrimp yield and total effective shrimp land.
3.3. The Nitrogen Module
The nitrogen module keeps track of nitrogen in both the water and sediment phase from the pond to the channel system (
Figure 4). Sources of nitrogen include fertilizer, seed, intake water and feed. While fertilizer is a fixed amount for each hectare of the shrimp pond, feed is dependent on the stock density. The amounts of feed applied and waste produced are calculated separately in a spread sheet and the amount corresponding to each stock density is an input to the model. Calculations are made for a typical grow-out period of four months. The Food conversion ratio (FCR) is 1.67 based on the average feeding regime by most farmers. In reality, farmers flexibly adjust this amount to suit shrimp growth and therefore the nutrient load is lower than our calculated amount, especially when shrimp die in their early months. Most nitrogen ends up in the pond sediment in the form of dead shrimp, feces, excess feed, plankton and bacteria. The remaining nitrogen is in the harvested shrimp, removed by drainage water when harvested or lost in the form of gases such as NH
3, N
2 or N
2O. About 90% of the sediment is dredged out of the pond after harvest and discharged into the channel. A small fraction of nitrogen in pond sediment goes back to the water phase during the remineralization process.
Nitrogen in the channel can be removed by tidal action or through biodegradation. There are two high tides and two low tides each day in the region. The frequent and continual tidal action means that tidal removal is much more important than biodegradation. The model simulates the tidal effect and ignores biodegradation. The nitrogen in the channel is supplemented by the agricultural and domestic water use upstream. The intake water is withdrawn from the channel. The nitrogen module keeps track of both nitrogen concentration and shrimp survival rate. This rate depends on not only the stock density but also other environmental factors. Johnston
et al. [
9] reported that major water quality parameters influencing shrimp yield in mixed shrimp-mangrove forestry farms include pond depth, maximum fluctuation in pond depth and ammonia concentration. In intensive shrimp farming, pond depth is quite constant and water is not exchanged. Making use of the information of ammonia toxicity [
10], we consider the nitrogen concentration in the shrimp pond as the key factor to limit shrimp growth.
Figure 4.
(a) Diagram of nitrogen sources, sinks and pathway in a pond. (b) Equivalent stocks and flows in a Stella model diagram.
Figure 4.
(a) Diagram of nitrogen sources, sinks and pathway in a pond. (b) Equivalent stocks and flows in a Stella model diagram.
4. Simulation Results and Discussion
4.1. Simulating a Business as Usual Scenario
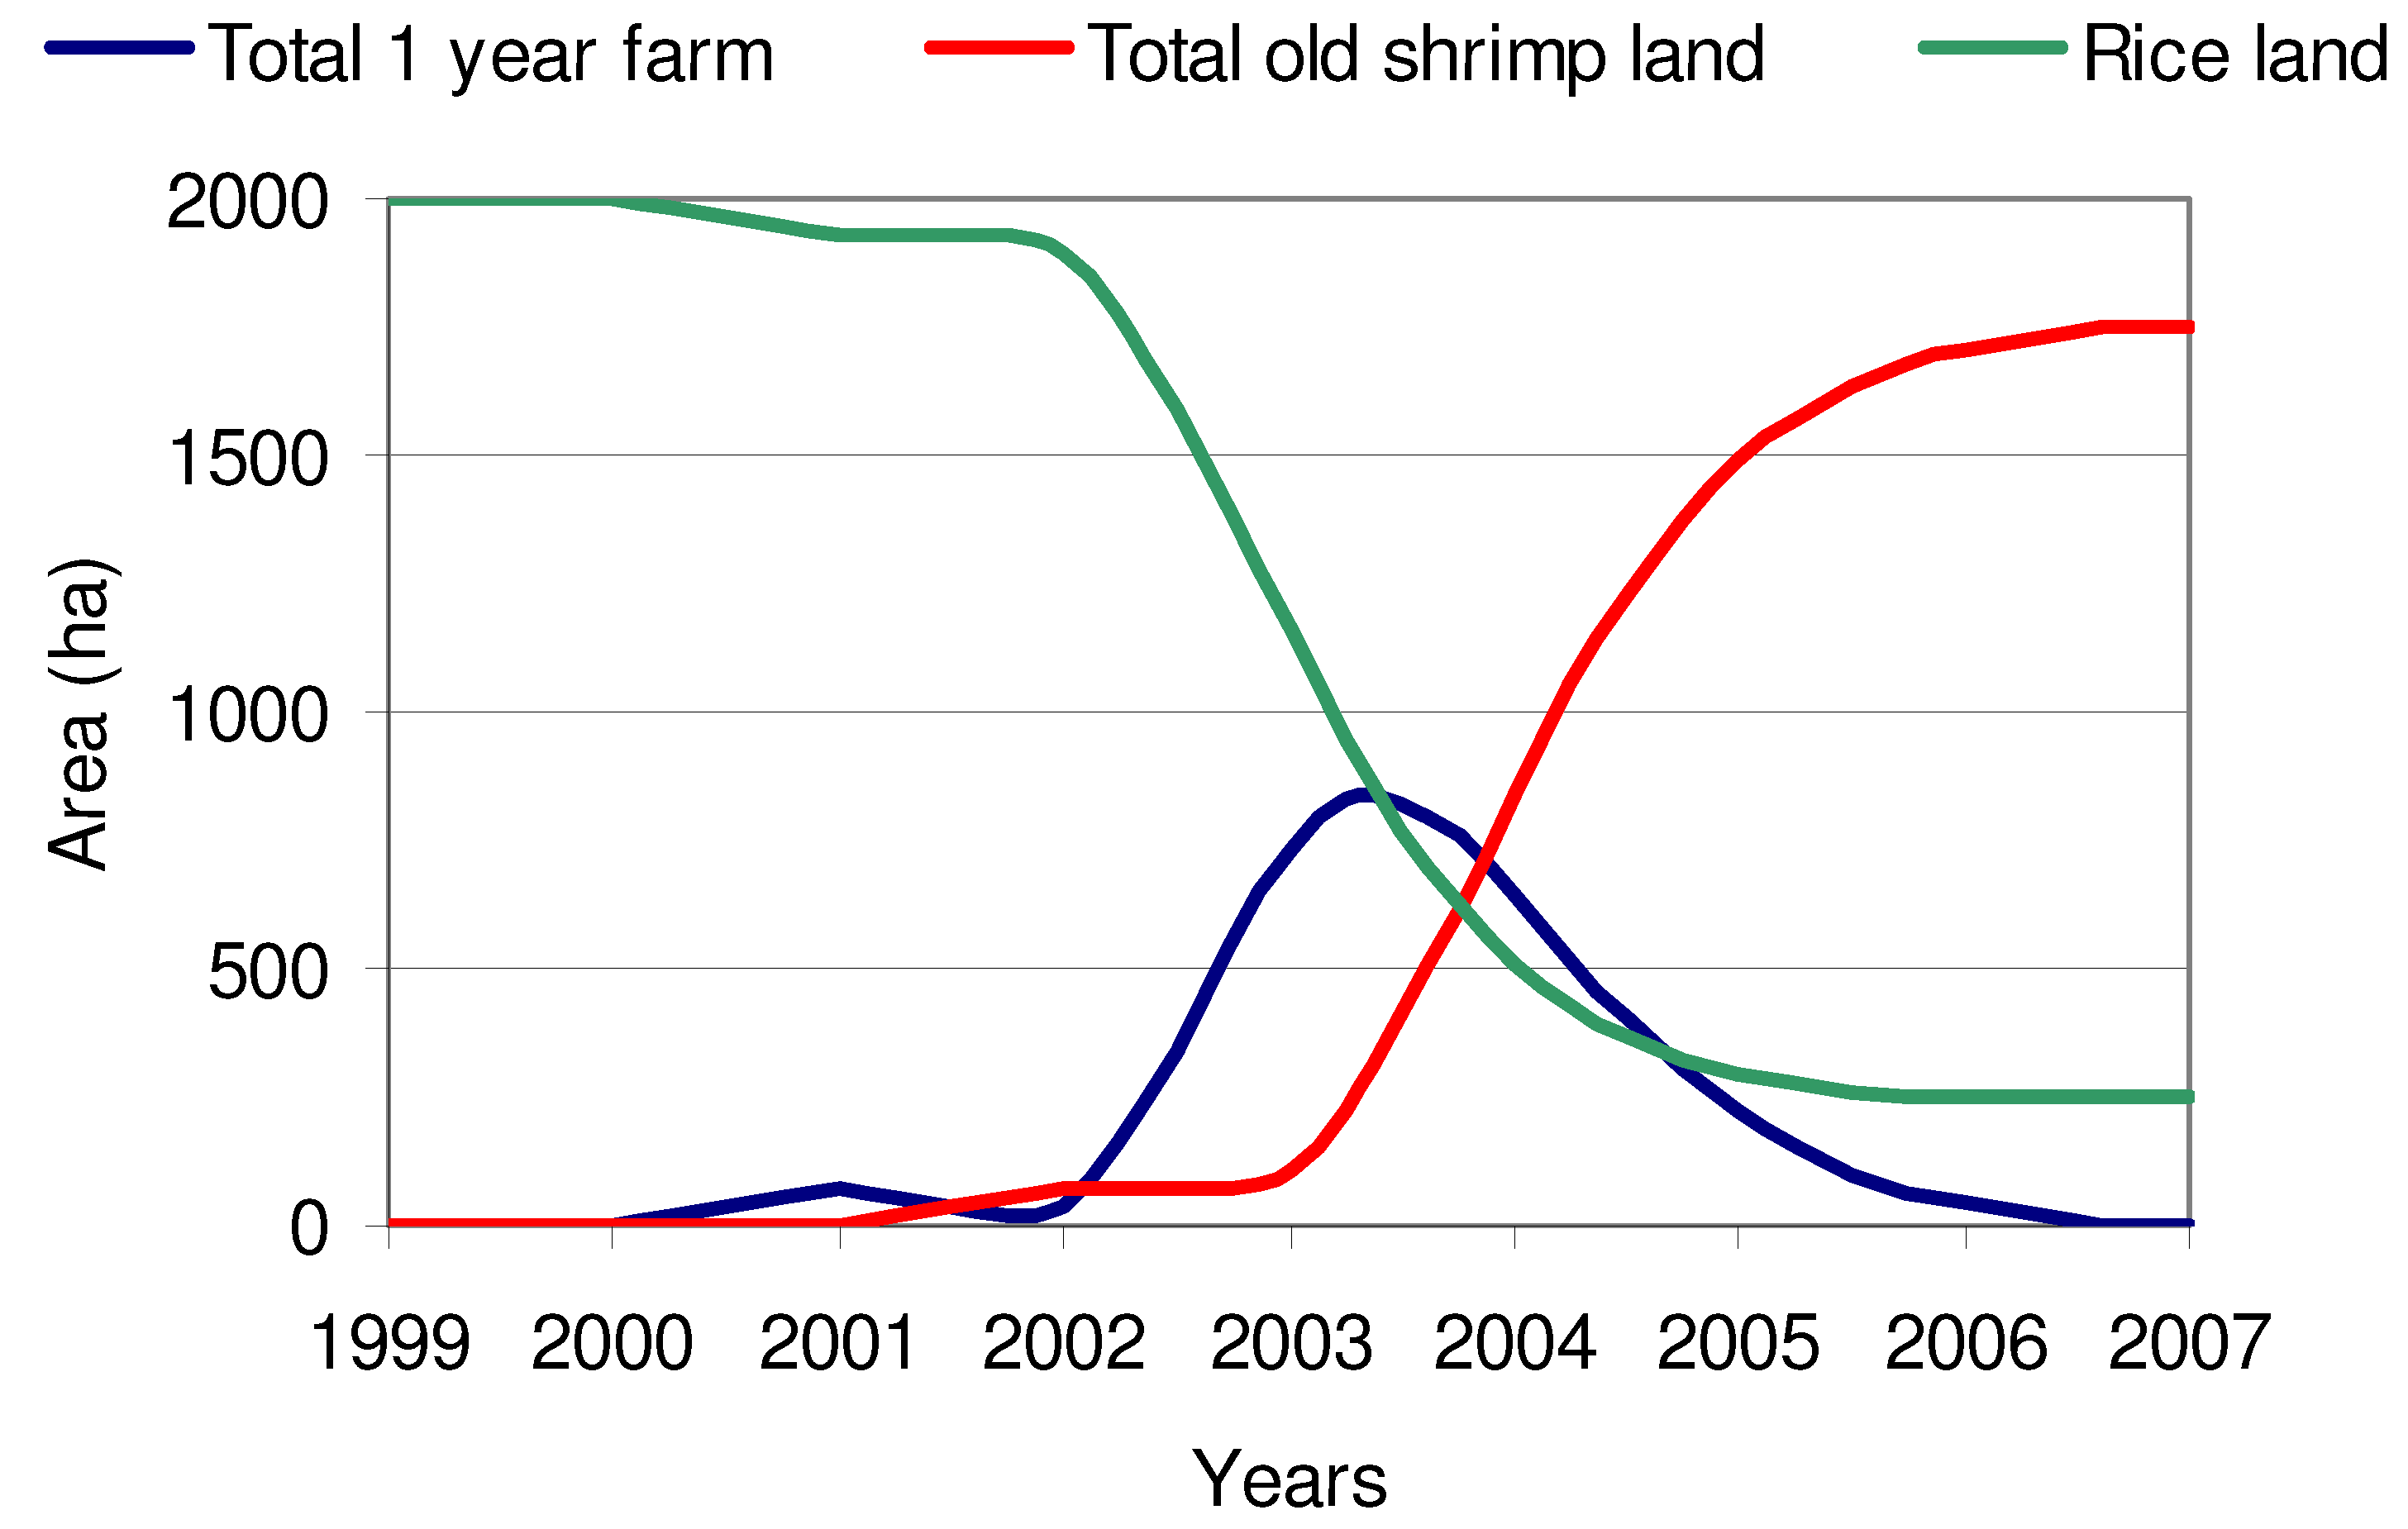
It is estimated that about 70 ha of land was converted to shrimp ponds in 2000. The mass conversion occurred very quickly in 2003 and 2004. In 2005, the conversion was almost finished and shrimp land dominated the area with 1,694 ha. Computer simulation can be used to recreate the historical scenario and to check the model results against the available record. To retell this story, we simulated the model with 70 ha of the pilot area in 2000, stock density at the commonly-used 40 fry/m
2, a debt borrowing period of 5 years, and a tidal removal rate at 0.5 per year. The simulation covers the time frame from 1999 to 2007. The simulated land use is presented in
Figure 5. It shows 1,751 ha shrimp pond out of 2,000 ha of land in 2007.
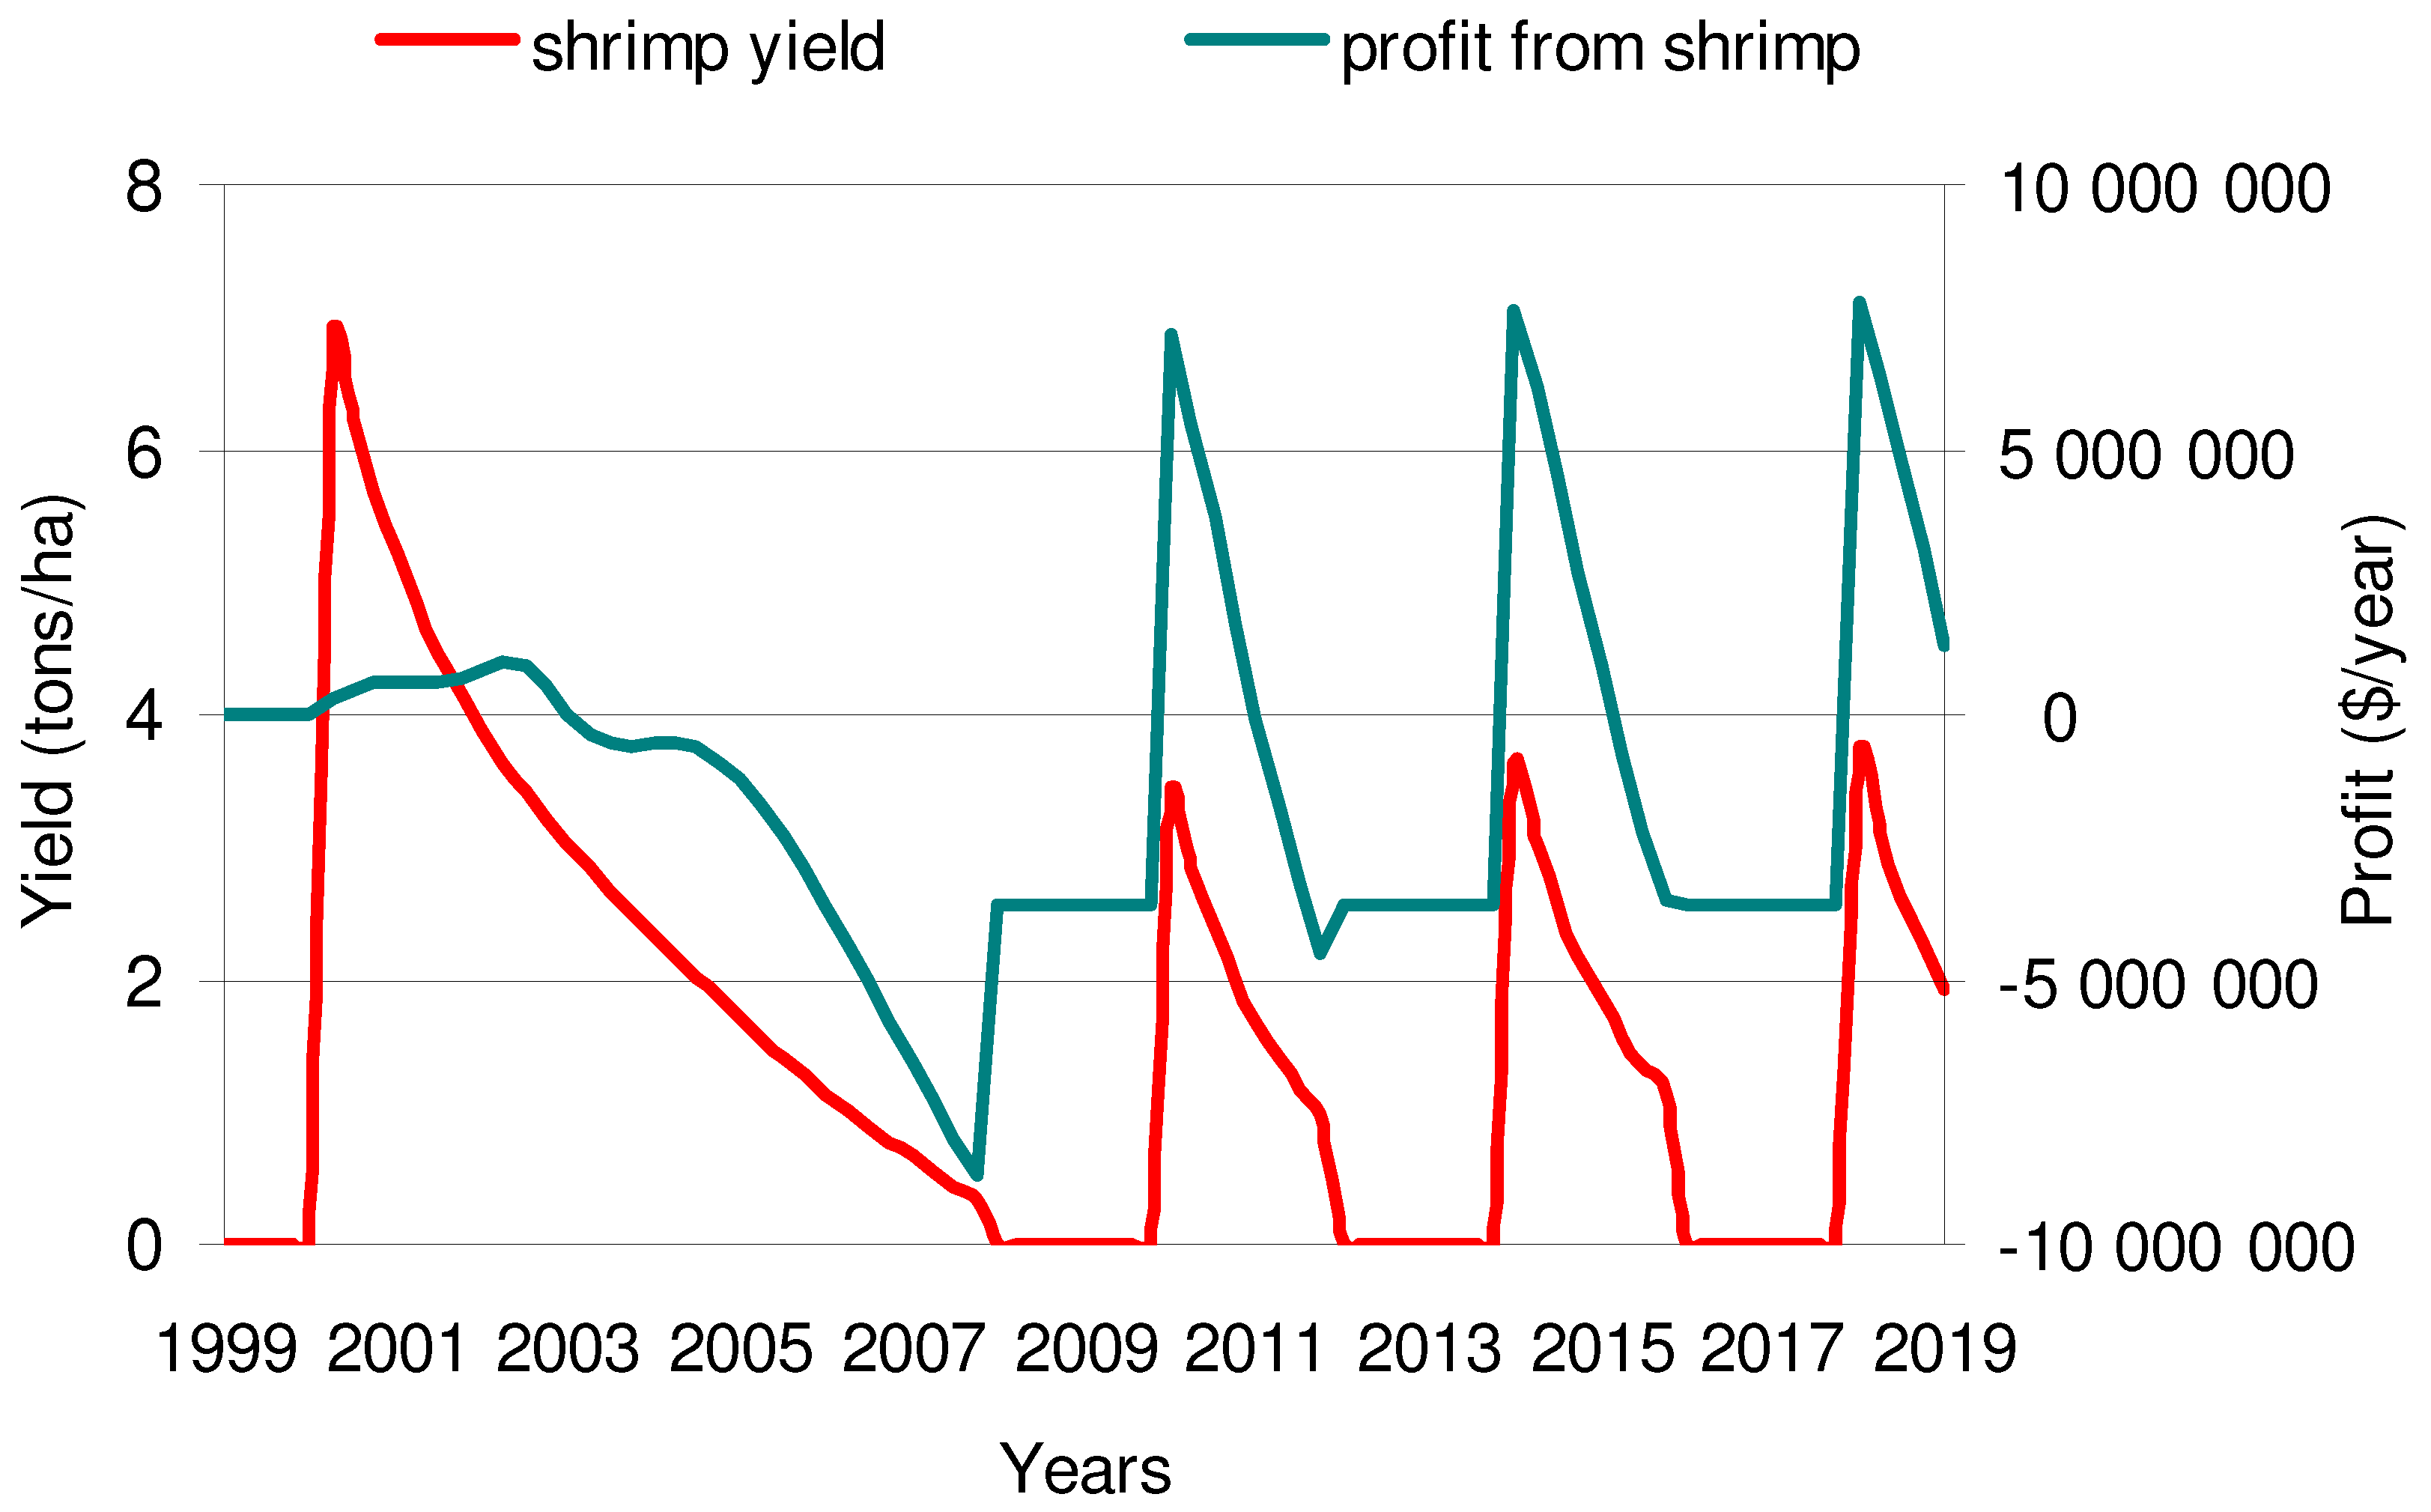
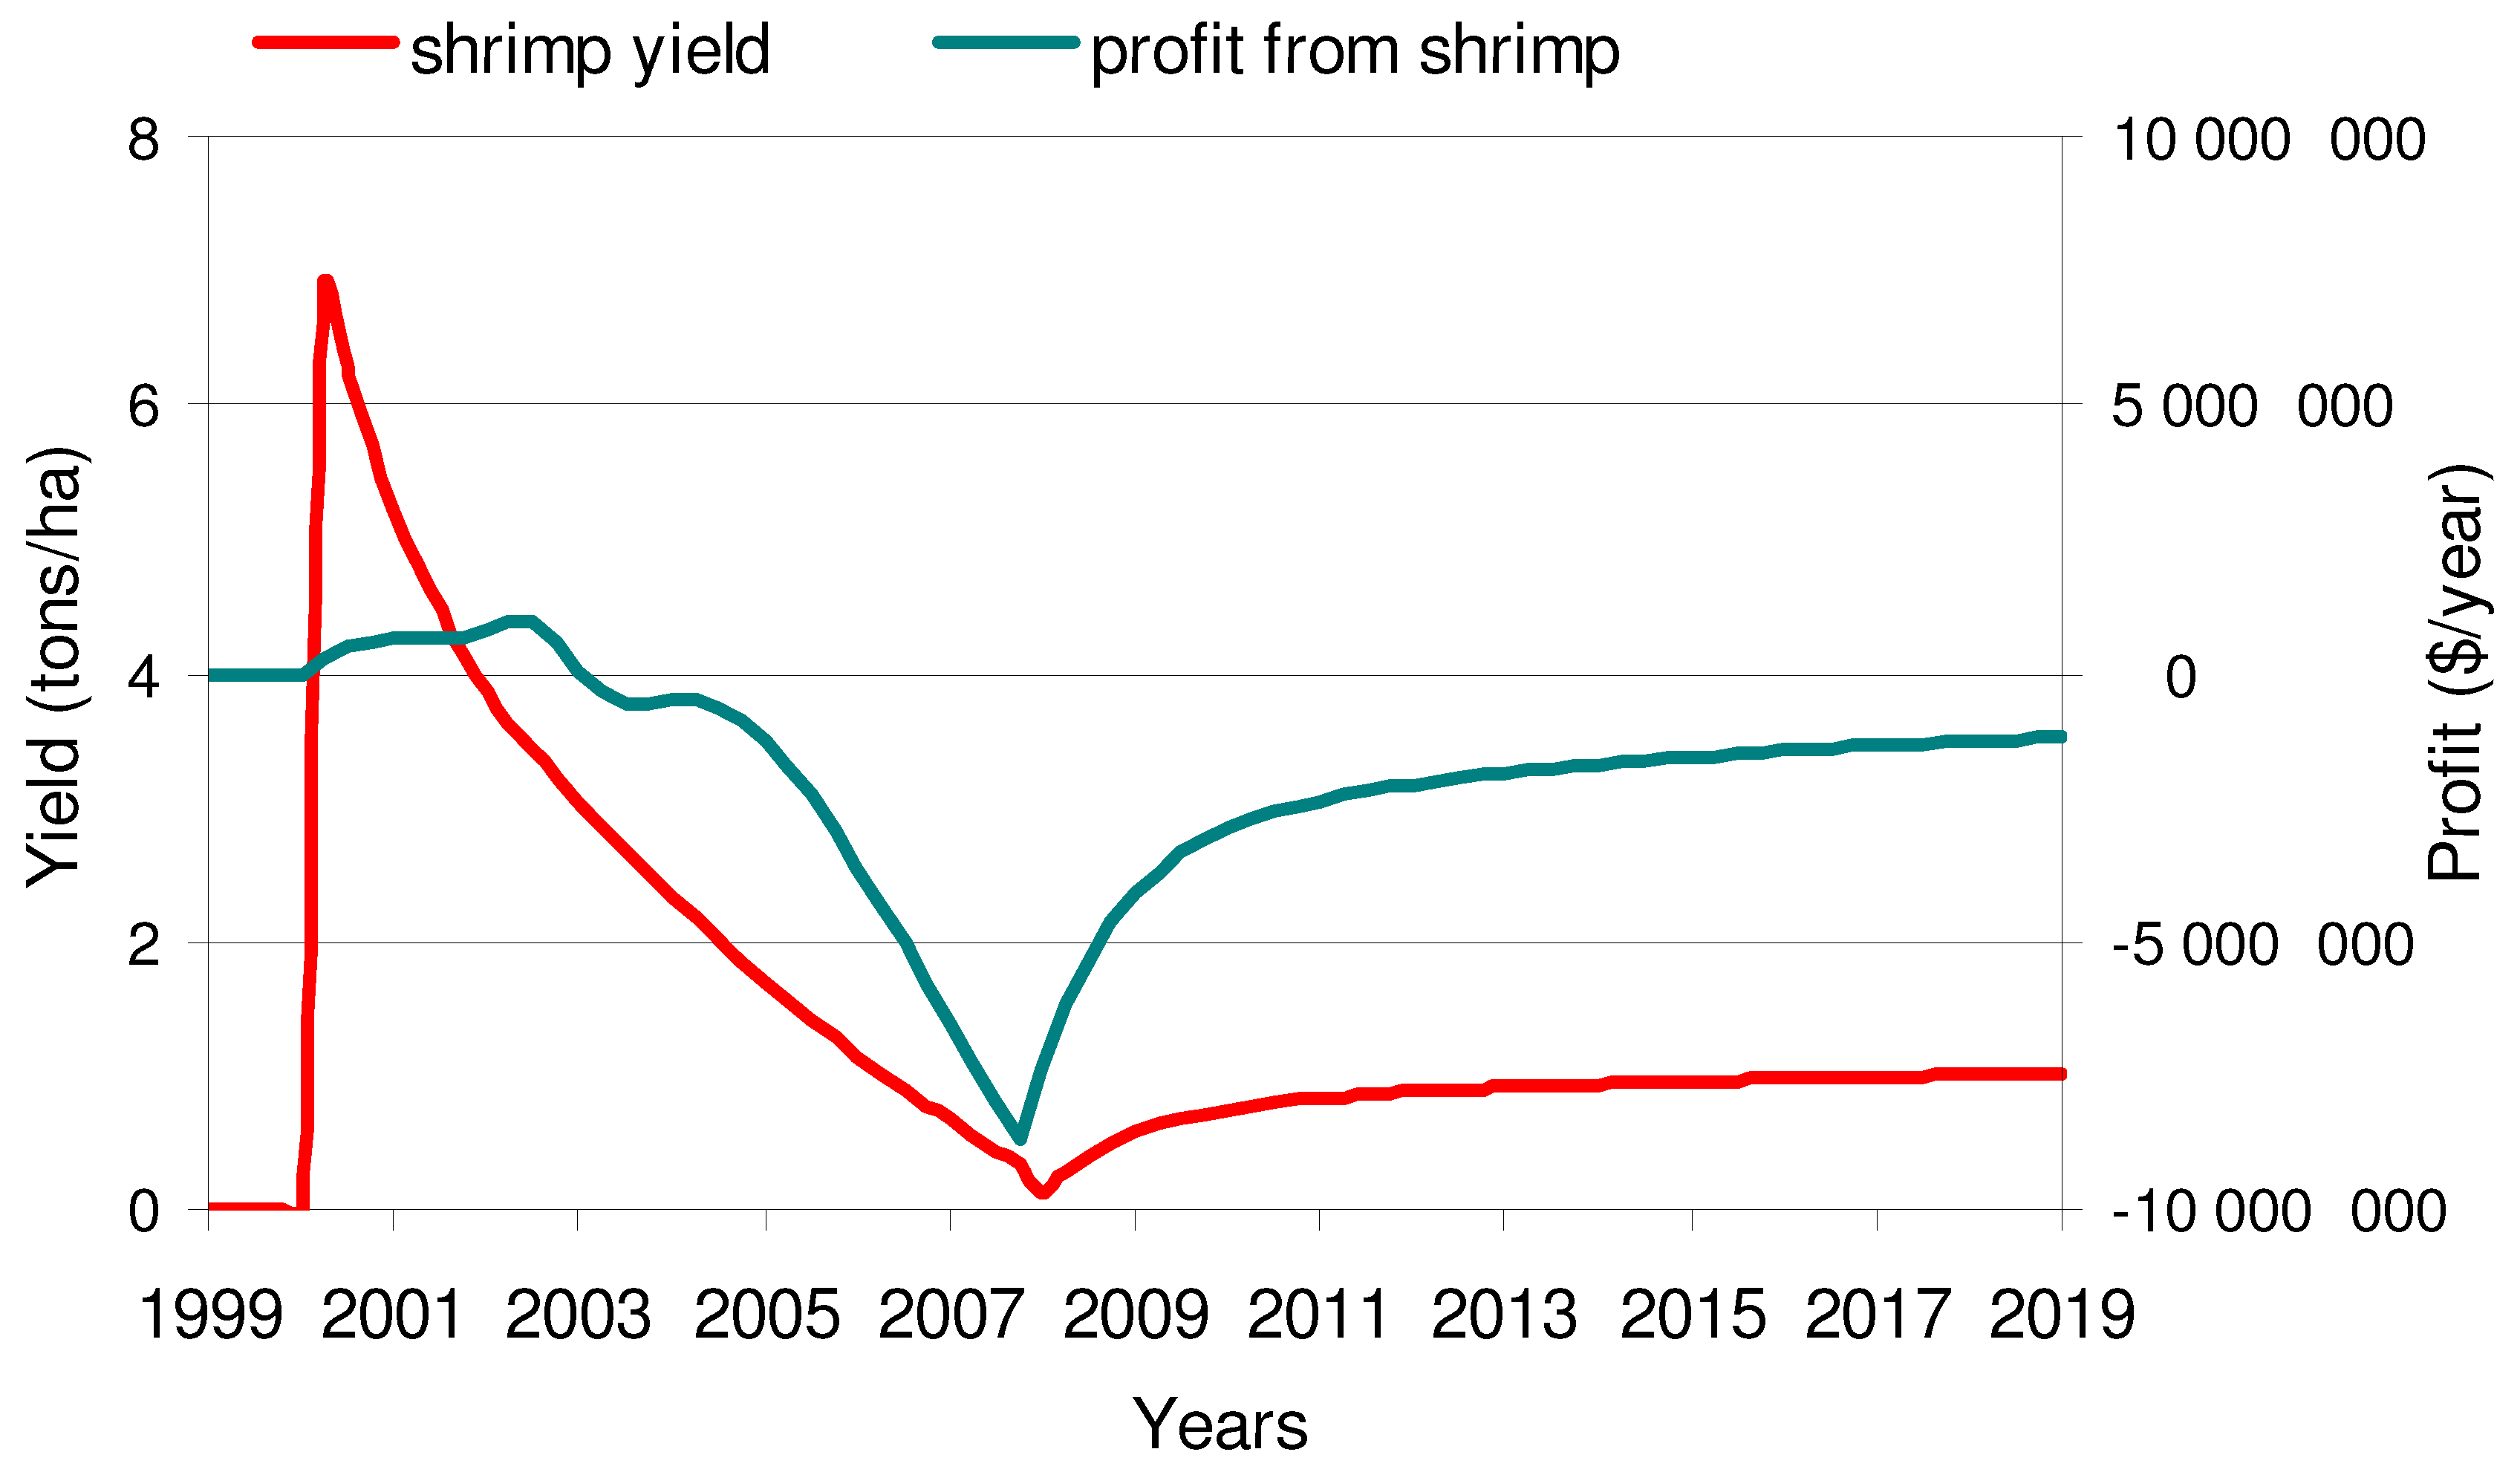
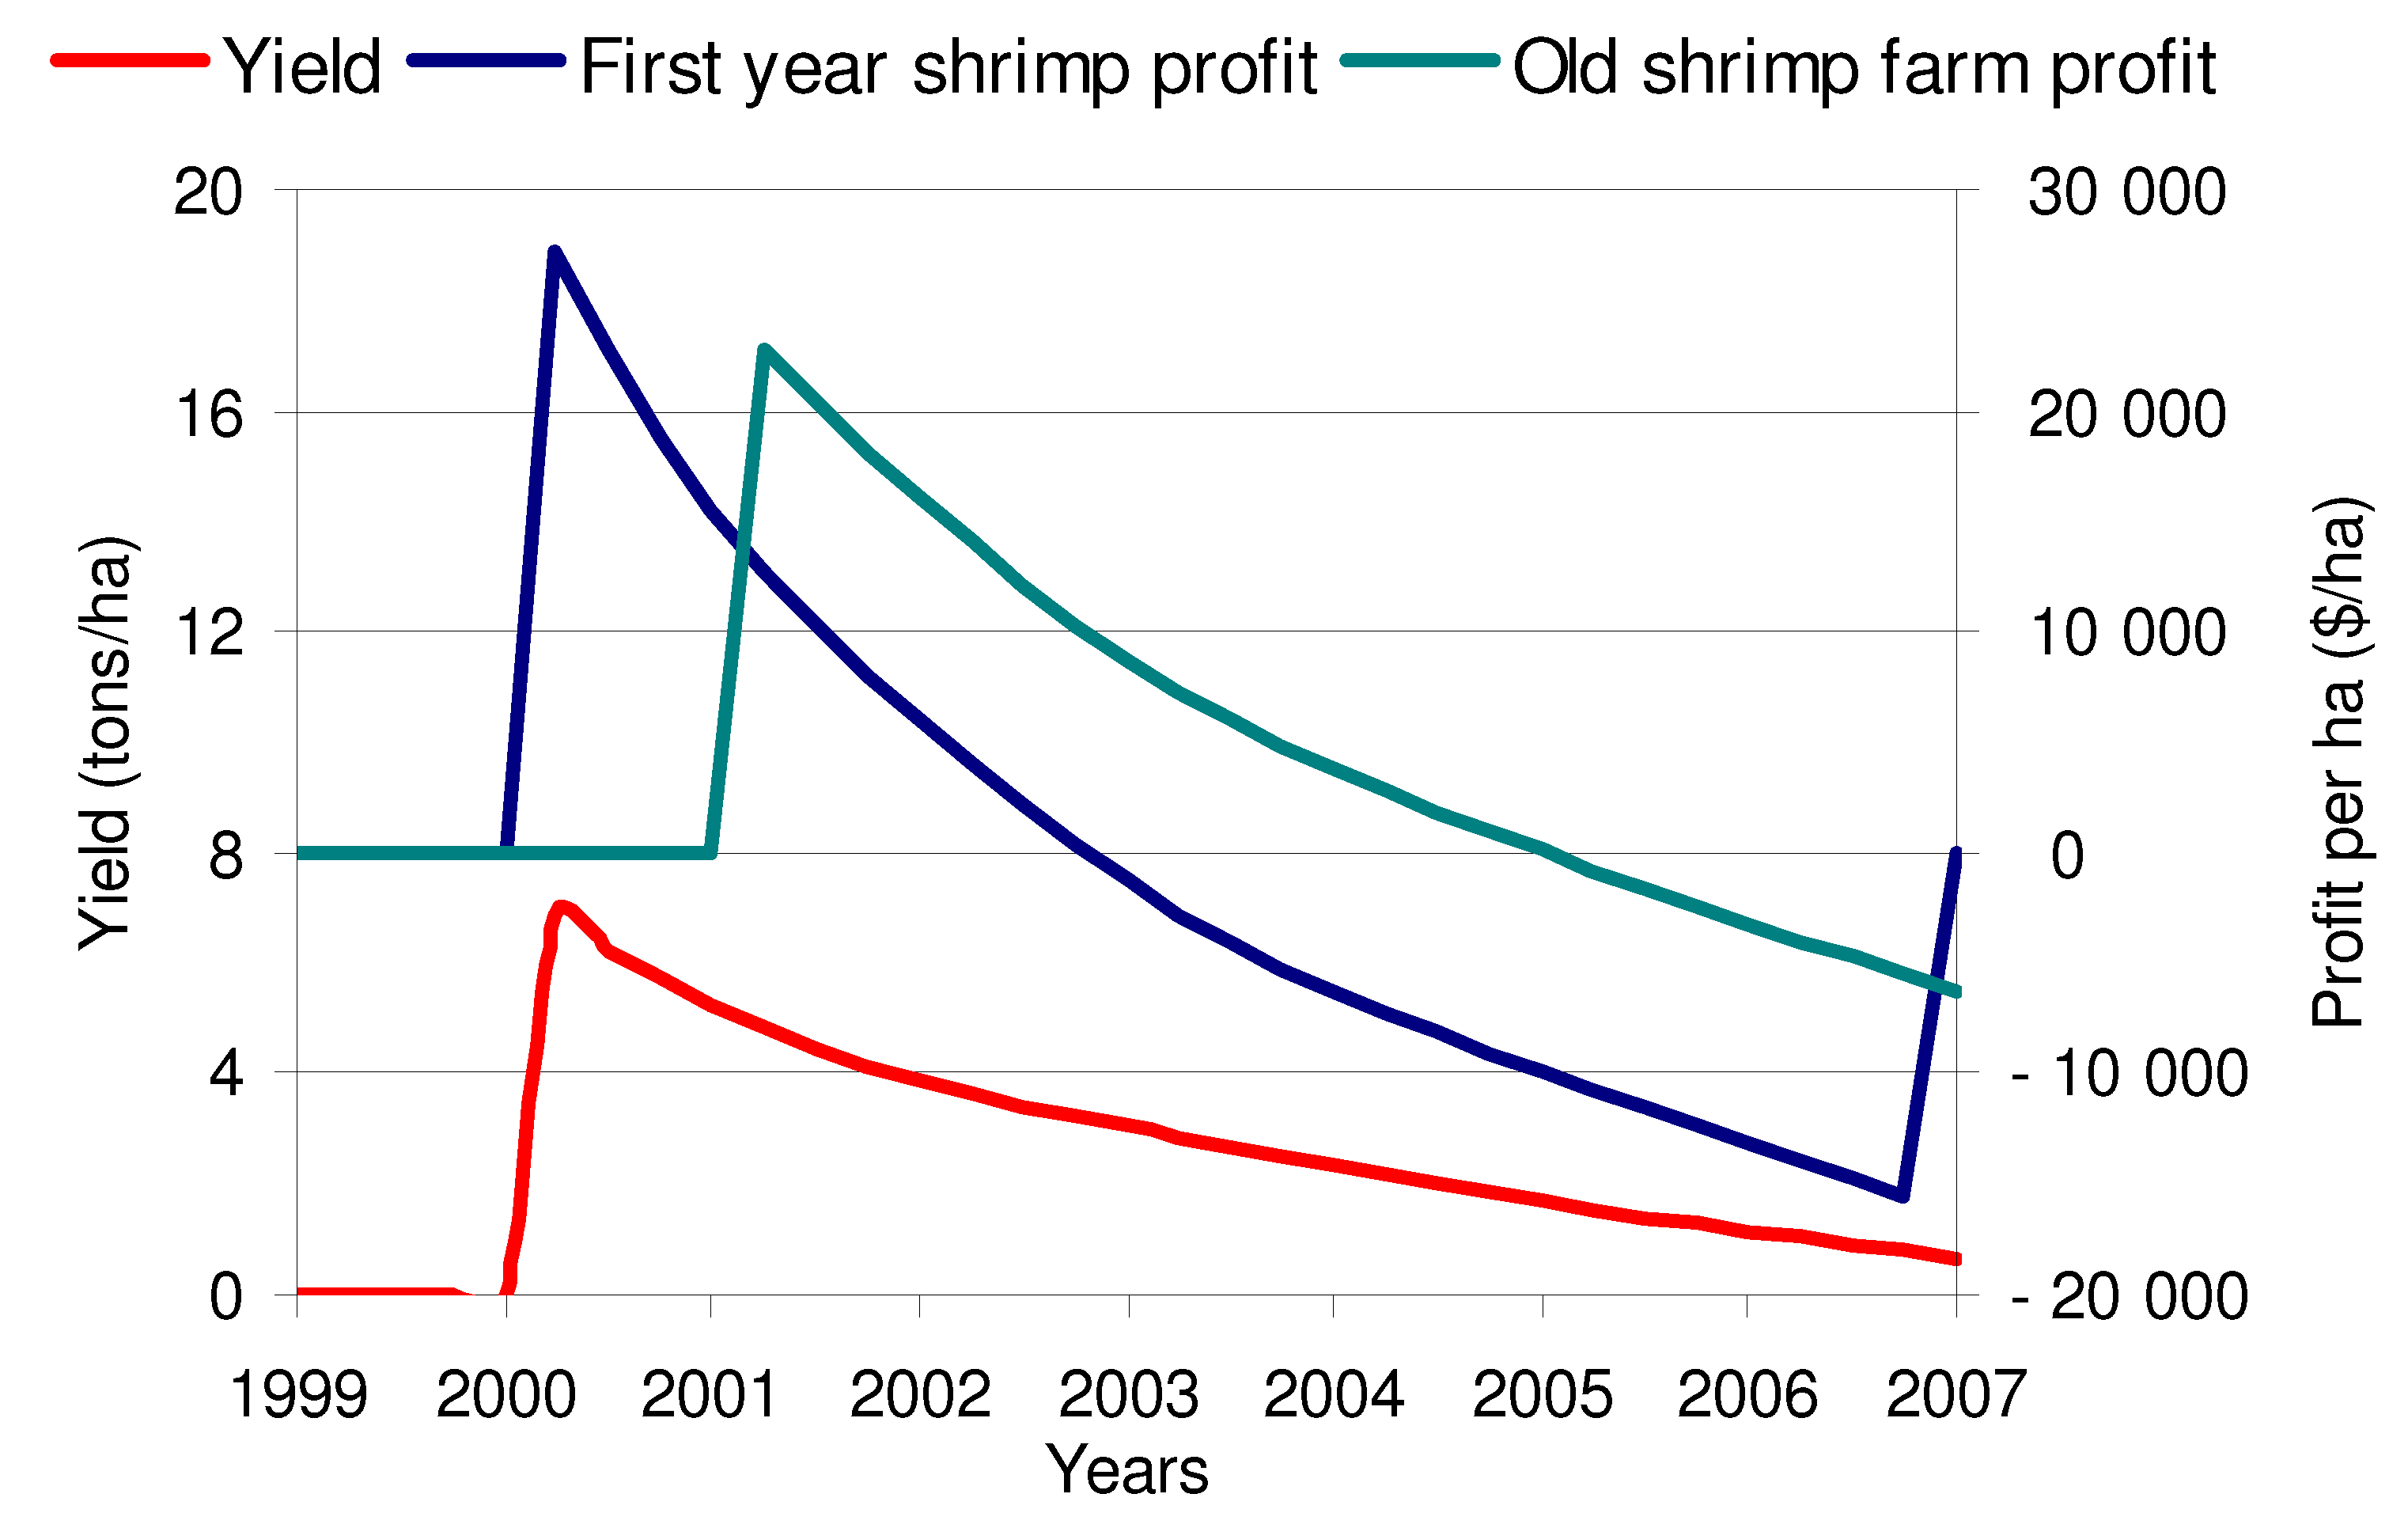
Figure 6 gives the simulated yields and profits, the factors that motivate the change in land use change. The yield is very promising at 6.9 tons/ha in the first year due to the high stock density. After two years, however, the yield is cut in half. By the end of the simulation, the yield is only 0.7 tons/ha. The high profits observed in the first few years motivate farmers to quickly convert to shrimp with a peak in 2003 at 827 ha.
Figure 5.
Simulated land use conversion from rice to shrimp in the Business as Usual Scenario.
Figure 5.
Simulated land use conversion from rice to shrimp in the Business as Usual Scenario.
Figure 6.
Simulated yields (in red) and profits (in blue and green) in the Business as Usual Scenario.
Figure 6.
Simulated yields (in red) and profits (in blue and green) in the Business as Usual Scenario.
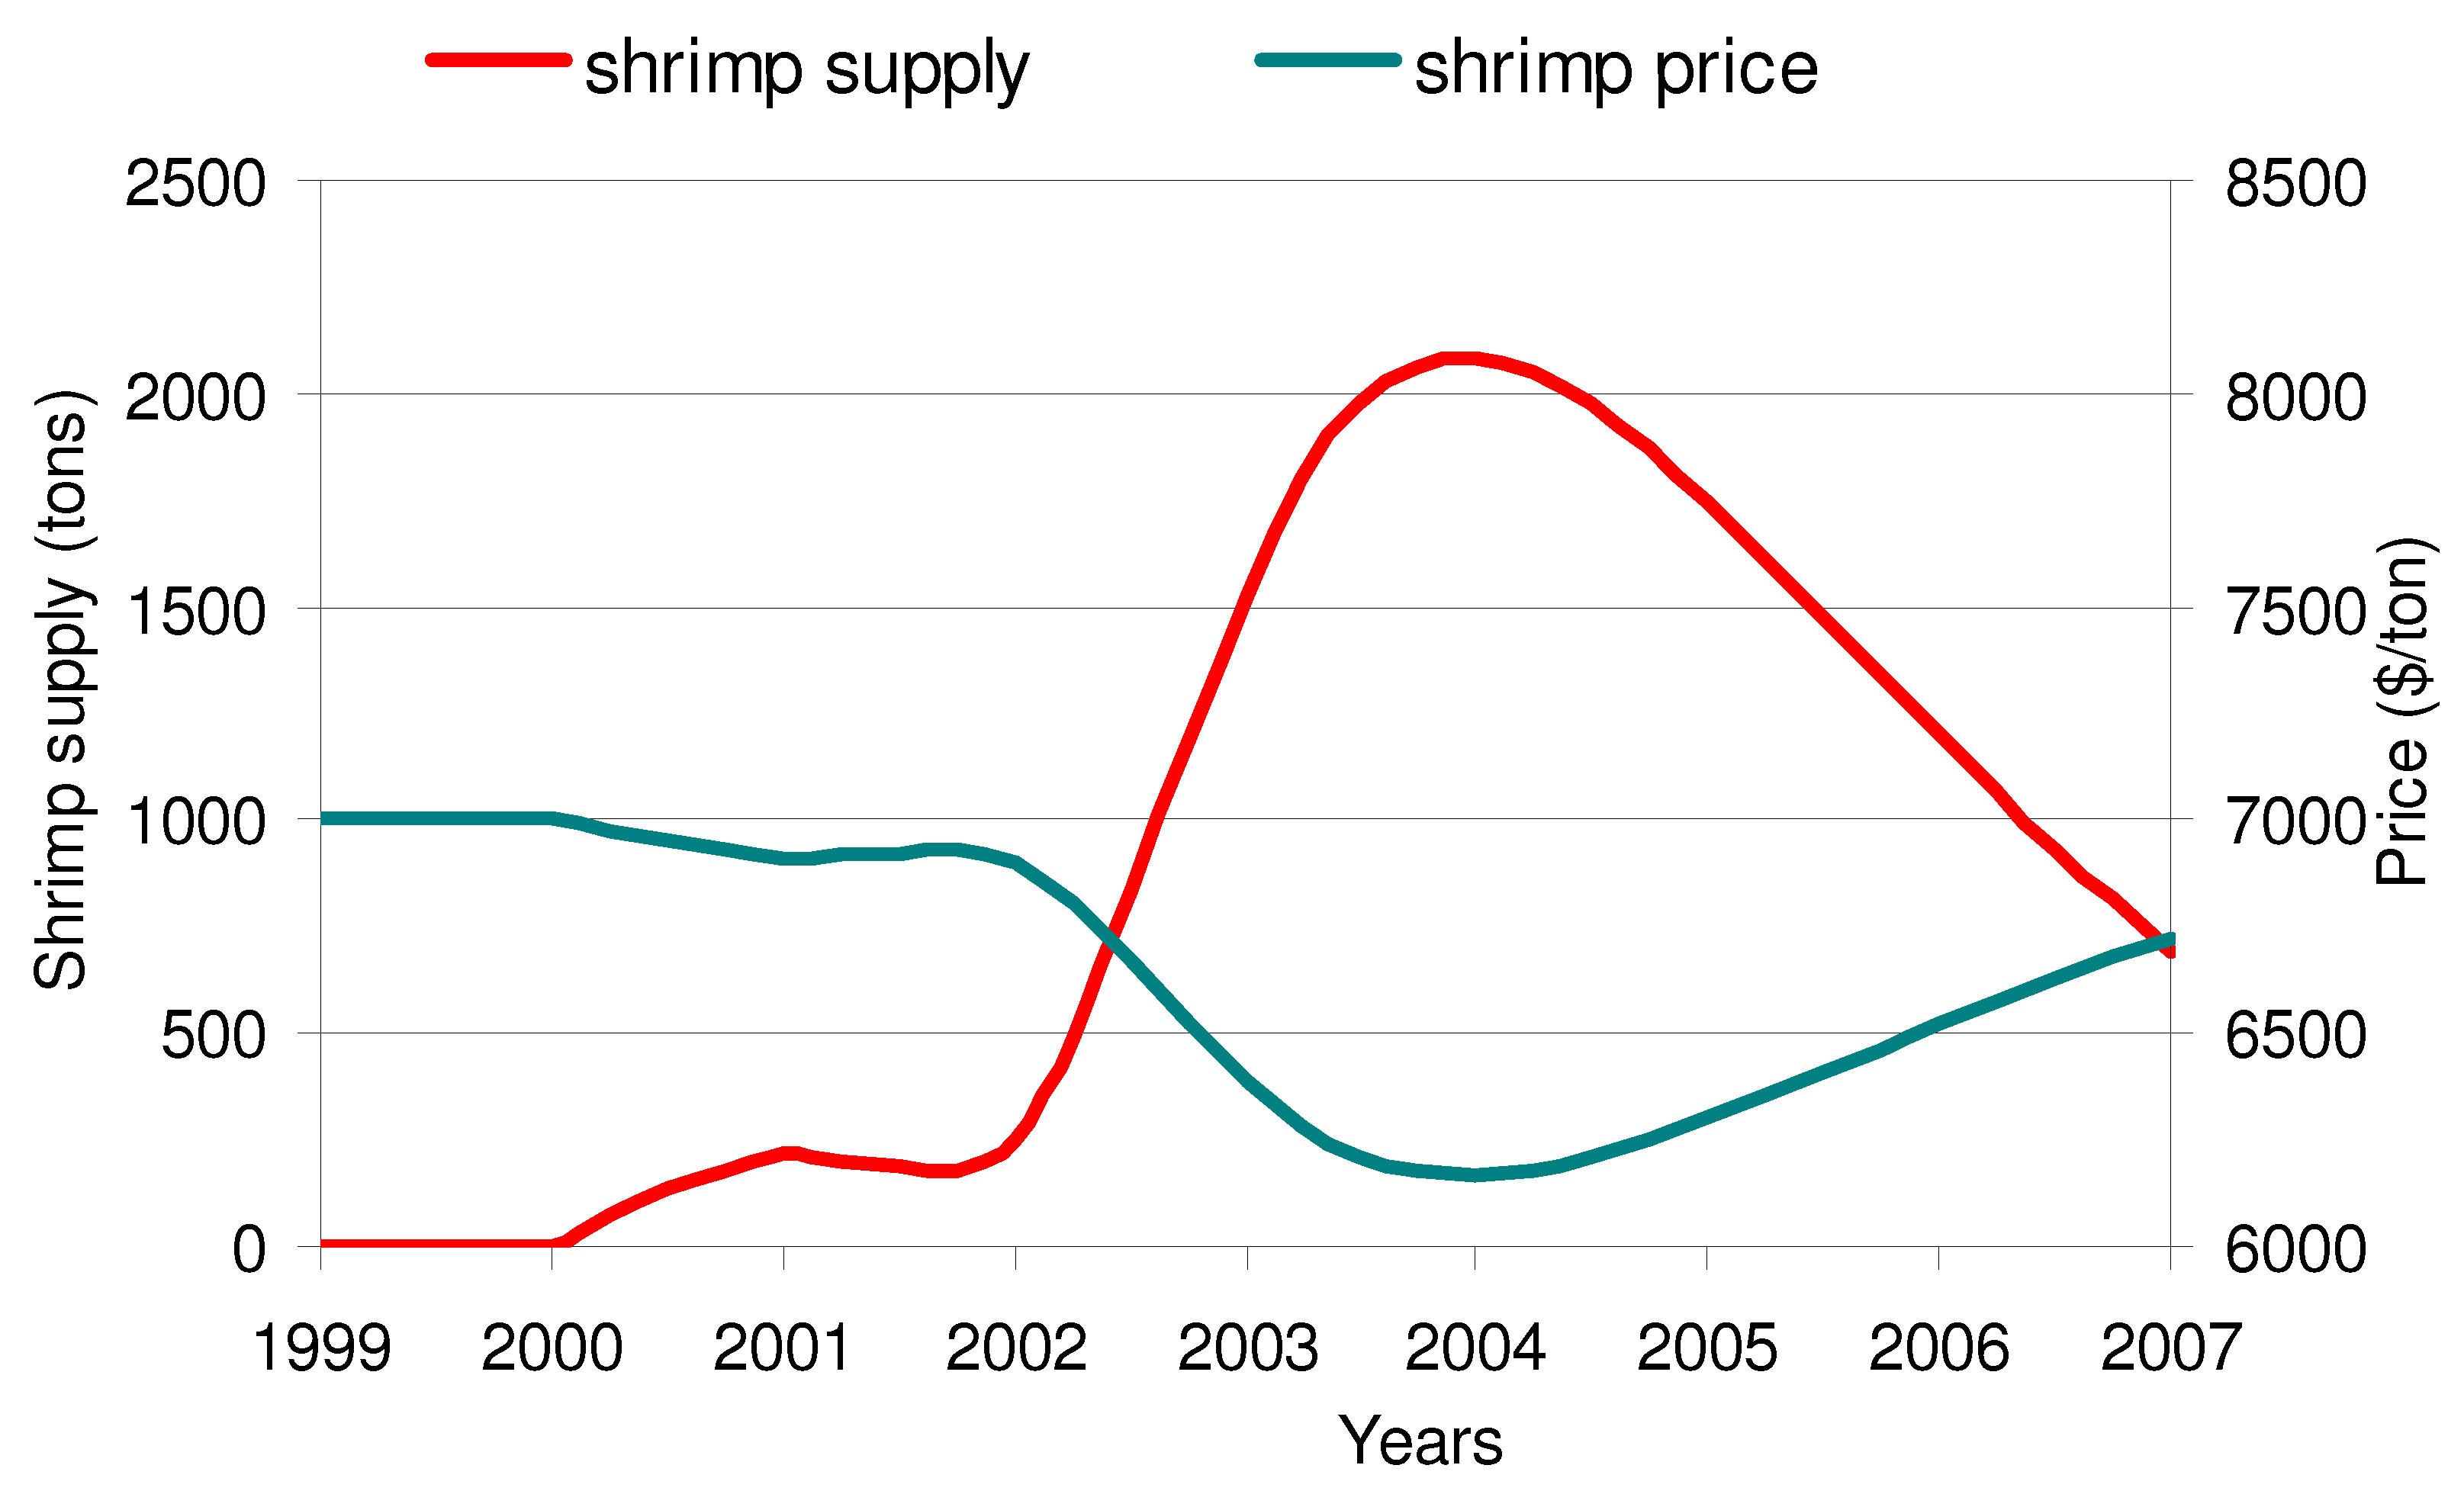
Figure 7 shows the total shrimp supply of the commune to the wholesale market. It peaks at over 2,000 tons/year in 2004. The farmers sell into a monopsony market, a market with few buyers. These middle men have a market advantage over the many sellers, and they are able to buy the shrimp at a price below the competitive market price.
Figure 7 shows a ten-fold increase in the supply of shrimp during 2002–2004. The increased supply causes the price to fall from $7,000 per ton to $6,300 per ton. This 10% decline is based on the price elasticity assumption derived from the average price history in the region [
11] and estimate of production quantity. The decline in price contributes to the declining profit from shrimp production.
Figure 7.
Simulated supply (in red) and price (in green) in the Business as Usual Scenario.
Figure 7.
Simulated supply (in red) and price (in green) in the Business as Usual Scenario.
4.2. Policy Tests: Is Recovery Possible?
At the end of 2007, most farmers shifted to shrimp experienced some bad years due to the lower yields and lower prices. These poor results cause the pioneering developers to leave the region. (They abandon the farms and move to another undeveloped region to continue their farming.) Farmers who own the land stay in the region and deal with the mounting burden of debt and the decline in yields. In an effort to maintain the business, some farmers abandon their farms after a few years and resume farming when they are able to mobilize enough capital for investment. Other farmers try to deal with the difficult situation by reducing the stock density. The switch to lower density brings the feed costs down to an affordable level and may give the ponds an opportunity to recover from excessive nitrogen accumulation. These common responses to the difficult situation are shown in
Figure 8 and
Figure 9.
Figure 8 shows the simulated effect of leaving the ponds idle for two years when the yields have fallen too low.
Figure 9 shows the effect of continued farming but at a lower stocking density. Both policies are implemented in 2008, and the simulations are extended until 2019 to see if farmers can achieve a sustainable recovery.
Figure 8.
Shrimp yield and profit in a simulation with two-year pauses in farming to allow improvement in yields.
Figure 8.
Shrimp yield and profit in a simulation with two-year pauses in farming to allow improvement in yields.
Figure 9.
Shrimp yield (in red) and profit (in green) when the stock density is lowered from 40 fry/m2 to 20 fry/m2 in 2008.
Figure 9.
Shrimp yield (in red) and profit (in green) when the stock density is lowered from 40 fry/m2 to 20 fry/m2 in 2008.
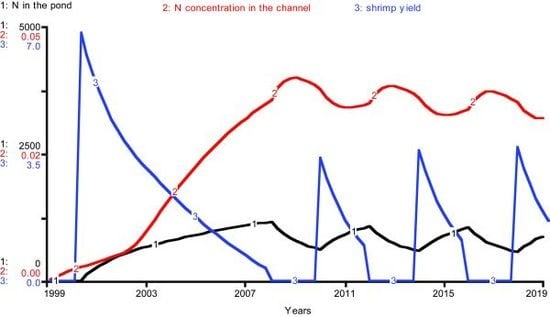
Figure 8 shows the shrimp yield and profit from shrimp when all farmers abandon the ponds for two years and restart in two years. Starting in 2008, farmers stop their activities. In 2010, they will restart cultivating and get a yield of 3.4 tons/ha. In 2011 the yield will decline to 1.7 tons/ha. Their next trial in 2014 will result in 3.6 tons/ha and the yield in 2015 will be 1.8 tons/ha. Restarting the business in 2018 gives a yield of 3.7 tons/ha and the yield in 2019 will be 1.9 tons/ha. From the test, it is obvious that pausing cultivation does make the situation better because the tidal effect helps reduce nitrogen content in the system. The profit from these recovering years is high. During the fallow period, the profit is negative because they still have to pay the bank the annual fee for a five year loan.
Figure 9 shows the simulation with an alternative recovery strategy. It demonstrates that lowering the stock density is more suitable for the farmers as they can still maintain their business over time. This simulation assumes that all farmers lower the stock density to 20 fry/m
2, a density considered the lowest end of “intensive farming”. The simulation shows that an immediate decrease in stock density does not help increase yield. Indeed, the yield continues to decline in 2008 due to high nitrogen content in the channel water. Farmers must wait until 2009 to experience the recovery in yields. By 2011, the simulated yield reaches its equilibrium value of 1 ton/ha. This constant yield is too low to be profitable.
4.3. A Brief Discussion of Results
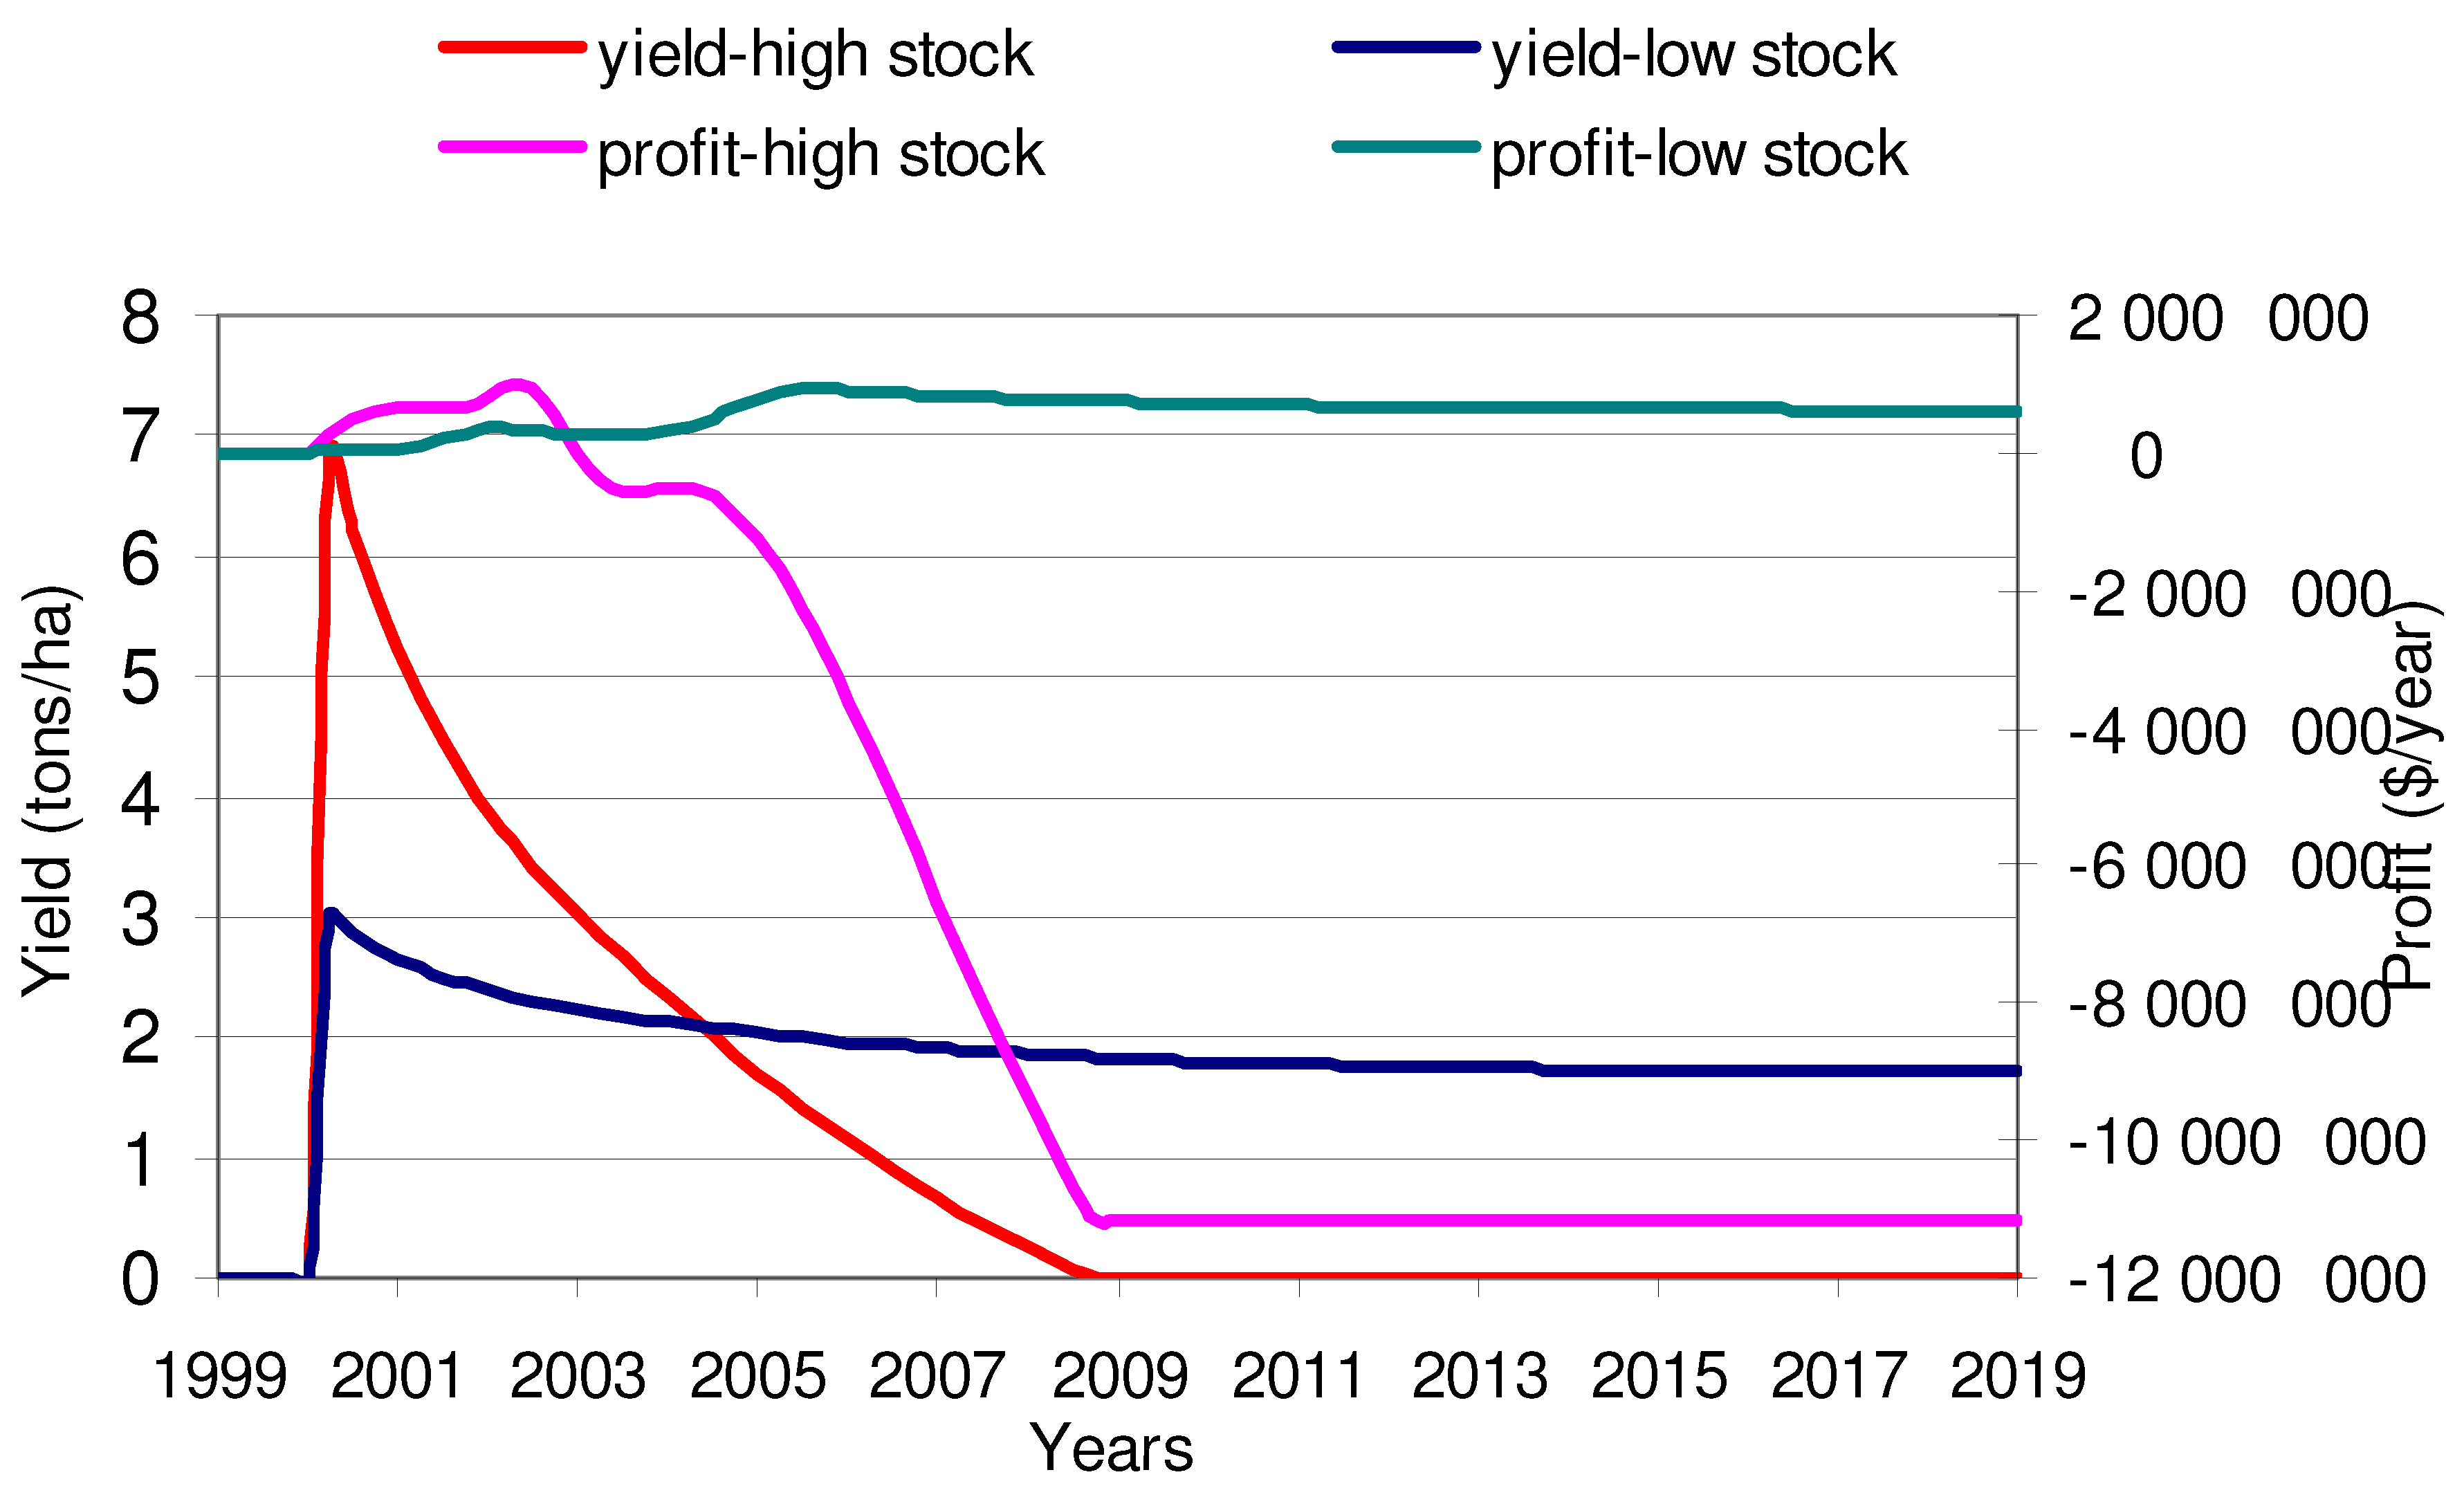
The
Figure 9 results indicate that lowering the stock density would only allow for slow recovery and unproductive yield. However, this simulation suggests that farmers might achieve higher and steadier shrimp profit if they choose the low stock density from the beginning. This scenario is simulated in and a comparison with the high-stock density results is presented in
Figure 10. The most dramatic result at the start of the simulation is a lower yield (around 3 tons/hectare
versus 7 tons/hectare). The yield declines in the simulation with lower stocking reaching around 1.7 tons/ha at the end of the simulation. Comparing yields in the two simulations reveals that the higher stocking density can deliver higher yields for around 5 years. But these high yields have direct and indirect costs. The direct cost is the cost of the extra fry; the indirect cost is the excessive accumulation of nitrogen in the ponds and the channels.
Figure 10.
Comparison of results with high and low stocking densities. The high density is 40 fry/m2. The low density is 20 fry/m2. The yield with high density is shown in red; the yield with low stocking density is in blue. The profit with high density is in purple; the profit with low stocking density is in green.
Figure 10 also provides a comparison of profits. The profit from low stock density is somewhat lower for the three years, and the lower profits are observed by the farmers making the decisions on learning from their neighbors. With lower profits, there is a slower conversion from rice to shrimp, smaller increase in shrimp supply and somewhat higher prices for shrimp sold to the middle men. The combination of higher yields, lower costs of fry, higher prices for shrimp allow positive profits to be maintained throughout the 20-year simulation. Indeed, the annual profit for the entire community is around $625,000.
Figure 10 suggests that farmers in the Mekong Delta would benefit greatly from a more gradual transition of land use and stocking of the new shrimp farms at lower density. The simulation confirms for our study area what other researchers have discovered. Indeed, the benefits of a low stock density has been documented in a variety of previous studies, including the work by Nga
et al. [
12], Soo [
1], and Kautsky
et al. [
13]. Although farmers may have been told about such studies, there are multiple reasons on why shrimp production in the Mekong Delta may turn out differently. Farmers impressed by the high profits from the pilot farm will have plenty of local factors to use as an excuse to ignore the warnings from studies conducted elsewhere.
4.4. The Stock Density Dilemma
The simulations discussed so far reveal the importance of the initial choice of a stock density. When the pilot farms start with a high stock density, the profit is attractive to the rest of the community and more farmers convert quickly to shrimp farming. However, this business is not sustainable because of rapid yield decline. In contrast, if pilot farms start with a low stock density, the profit is too low to make other people interested. As a result, most people stay in rice farming and the shrimp industry becomes sustainable. The farmers and officials face a dilemma: high stock densities create temporary profits, high risks and eventual financial failure; low stocking density does not deliver sufficient profit to motivate mass conversion from rice farming but does allow a lower level of sustainable shrimp production.
The underlying cause of this dilemma is the limiting carrying capacity of the channel system. The use of high stock density requires high inputs of feed, fertilizer and other chemicals. As more and more ponds are developed, the contaminants build up quickly to exceed the natural assimilation capacity. Contaminants accumulate in the channel water and deteriorate water quality. Shrimp farms obtain their intake water from the same channel (see
Figure 1) and nitrogen continues to cycle through the system, affecting shrimp health.
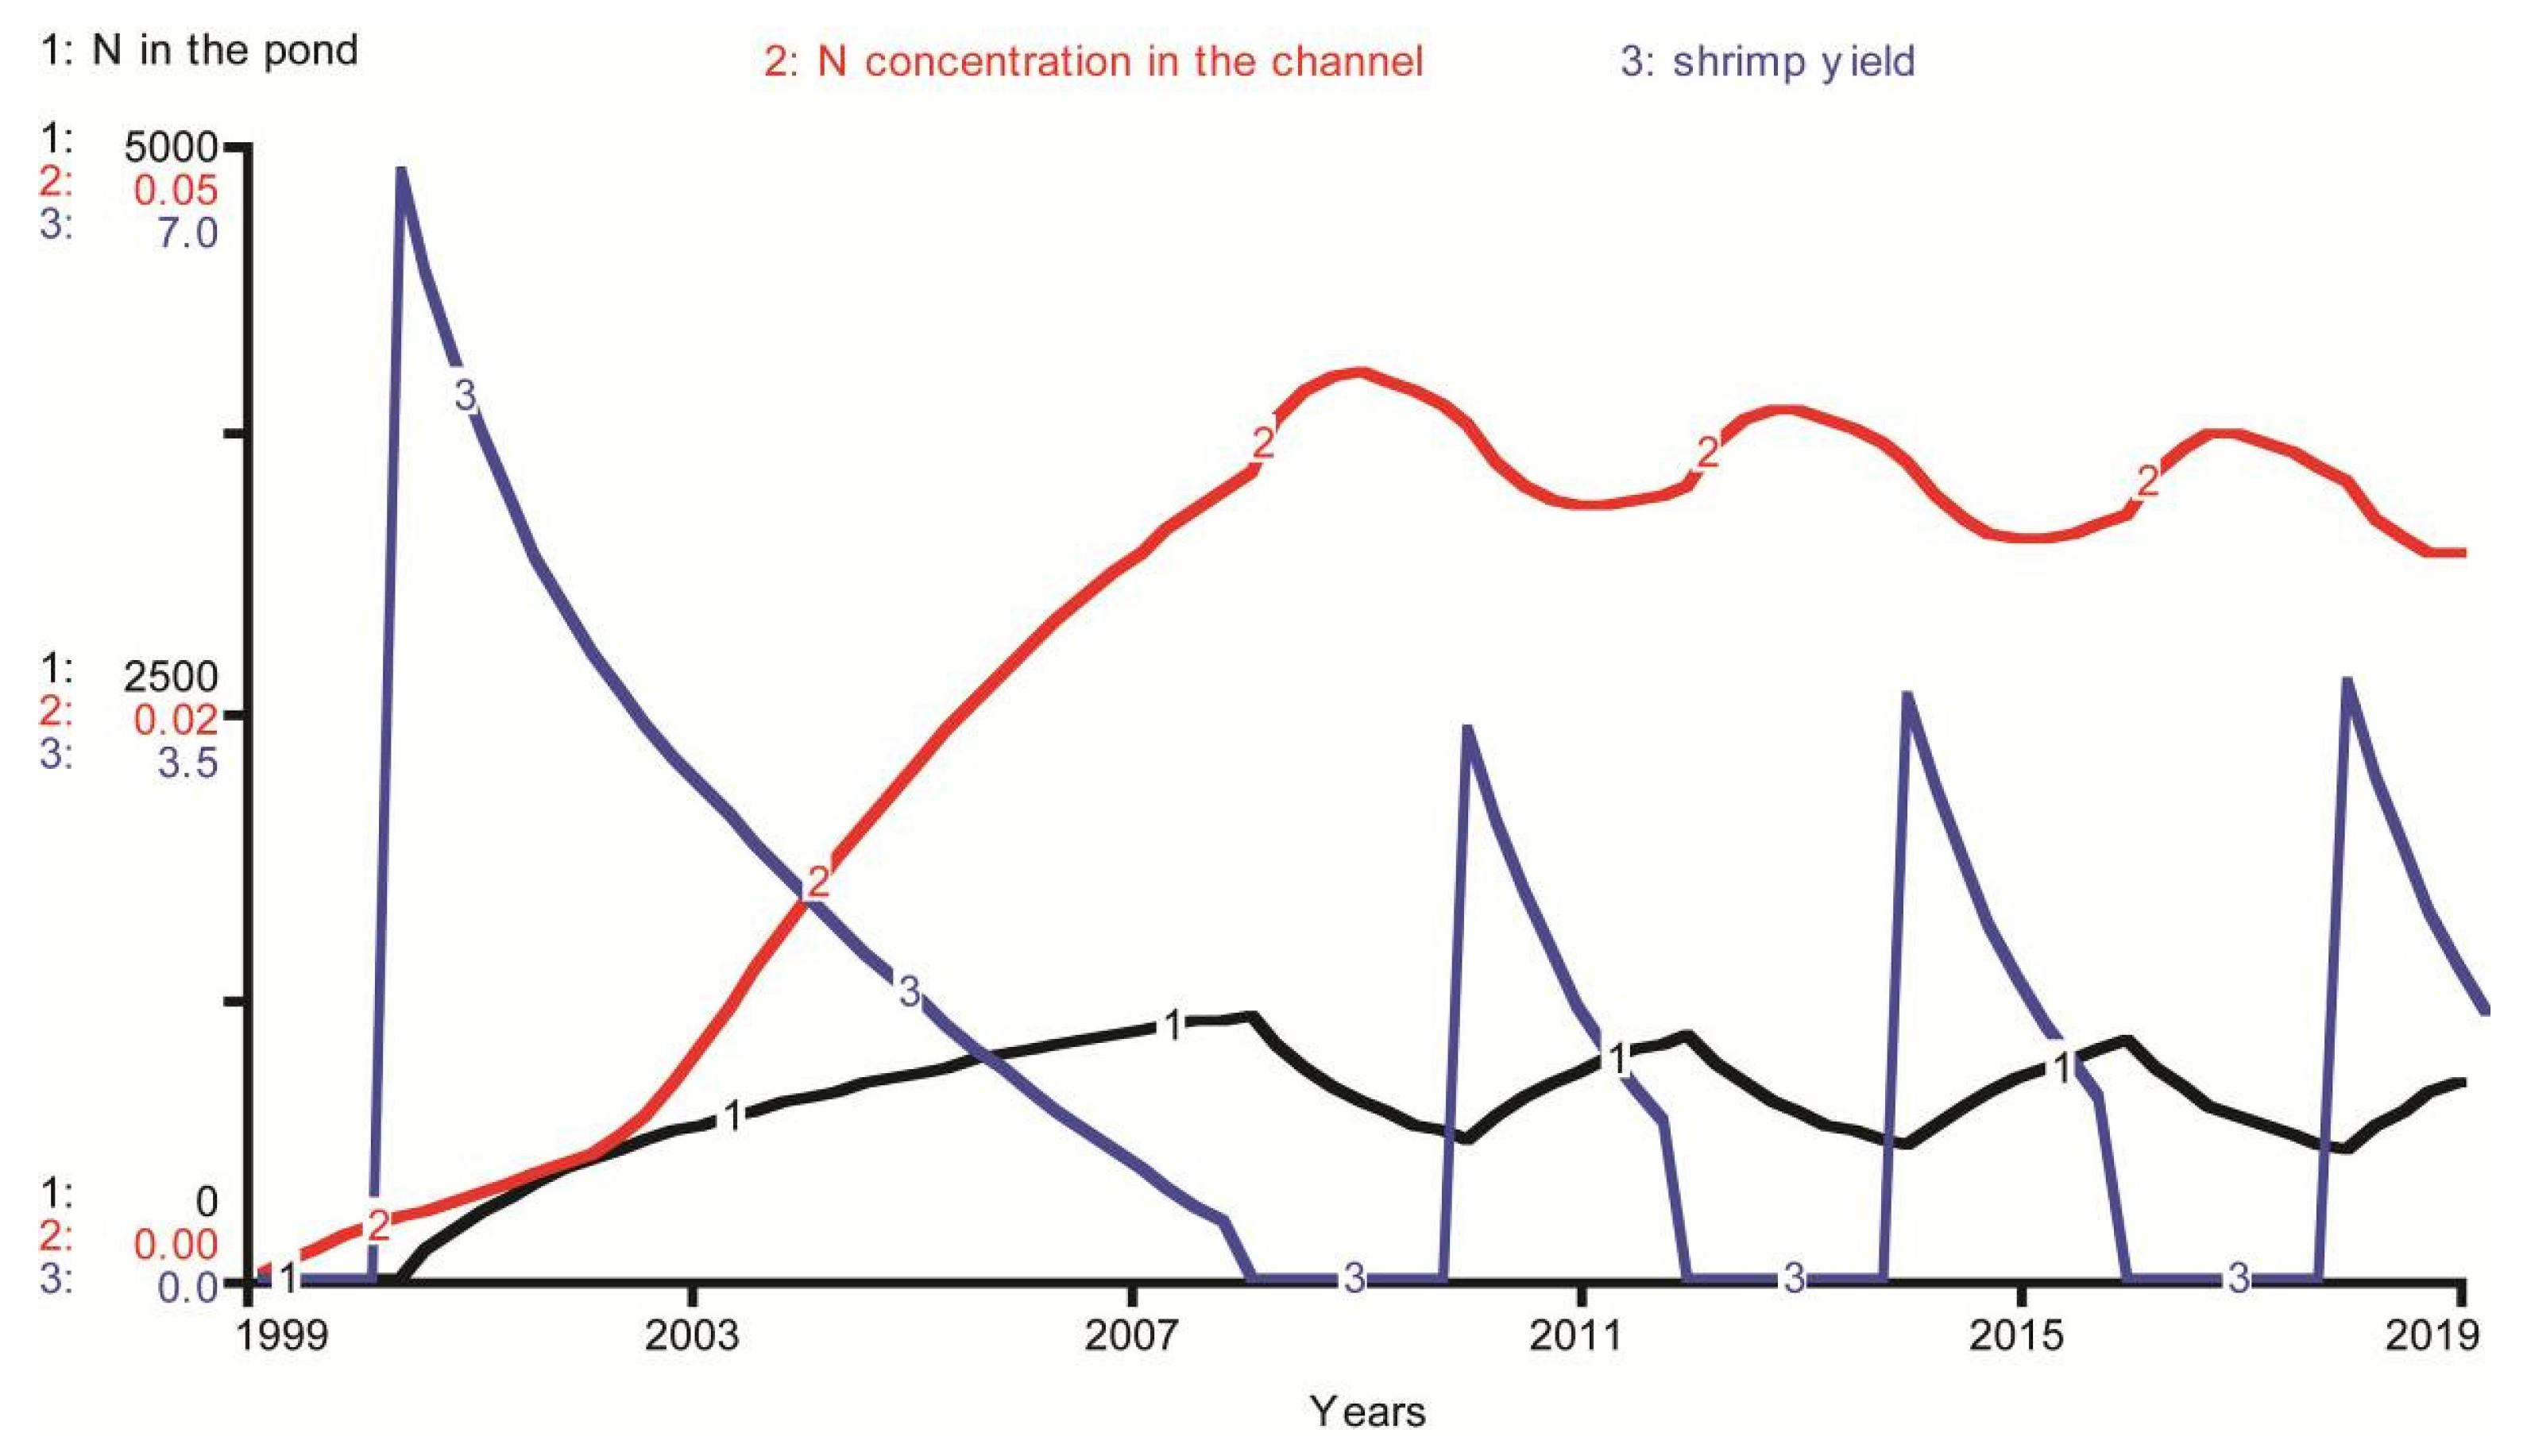
Farmers of Dai Hoa Loc Commune do know about the impact of pollution, but they do not know its magnitude. It is useful to look at the nitrogen content in the pond and its concentration in the channel to see how these two factors influence shrimp yield. Let us consider the case of high stock density and two year pausing period.
Figure 11 shows that in 2007, when the yield is as low as 0.7 tons/ha, nitrogen content in the pond is at 1085 kg/ha and nitrogen concentration in the channel is at 0.03 kg/m
3 (30 mg/L). A two-year pausing period gives the channel some time to reduce the pollution load. However, once farmers restart the business, contaminants build up almost to the same level as before. In order to improve the yield, they may give the system more time to recover or intervene to remove pollution out of the system. In this model, we assume that all farmers’ operations are uniform but in reality their actual operation varies from farmer to farmer and they are flexible in adjusting the feed amount so pollution level is not as high as simulated results. This also explains why their perception about the effect of pollution on shrimp yield requires a long time to adjust.
Figure 11.
Nitrogen in the ponds (in black) and in the channel water (in red) in a simulation with two-year pauses to allow yields to recover. The shrimp yield (in blue) varies due to nitrogen loads when the ponds are in use. The yield is zero when the ponds are idle.
Figure 11.
Nitrogen in the ponds (in black) and in the channel water (in red) in a simulation with two-year pauses to allow yields to recover. The shrimp yield (in blue) varies due to nitrogen loads when the ponds are in use. The yield is zero when the ponds are idle.
It is important to note that farmers did not expect the yield drop from the beginning. They might consider entrants as their competitors in terms of price and quantity but they would never think that they have to deal with environmental impacts from the crowding effect of suppliers. The ignorance may come from technical trainers. They tend to teach farmers the best empirical techniques to practice aquaculture which are based on ideal environmental conditions. Farmers totally trust their trainers and see the good results from pilot farms’ demonstration. The inevitable consequence is that they try to emulate the practice as much as they can.
4.5. Government Policy
The above analysis sheds more light on the risky nature of shrimp industry. The model can also be used to reveal the effectiveness of the government policies commonly proposed to reduce the risks. The first policy calls for a limit on the stock density; the second policy calls for more active efforts to remove pollutants from the ponds and channel.
The simulation with lower stock density shows encouraging results which are sustainable. This result raises the pragmatic question of how stock densities could be limited in Mekong Delta? An economic answer would call for regulatory control of the price of fry so that the high price will motivate farmers to select the lower stocking density. Fry price regulation would not be practical in the commune’s situation because the fry cannot be produced on site. Operation of monopoly or black market makes it difficult to redistribute revenue.
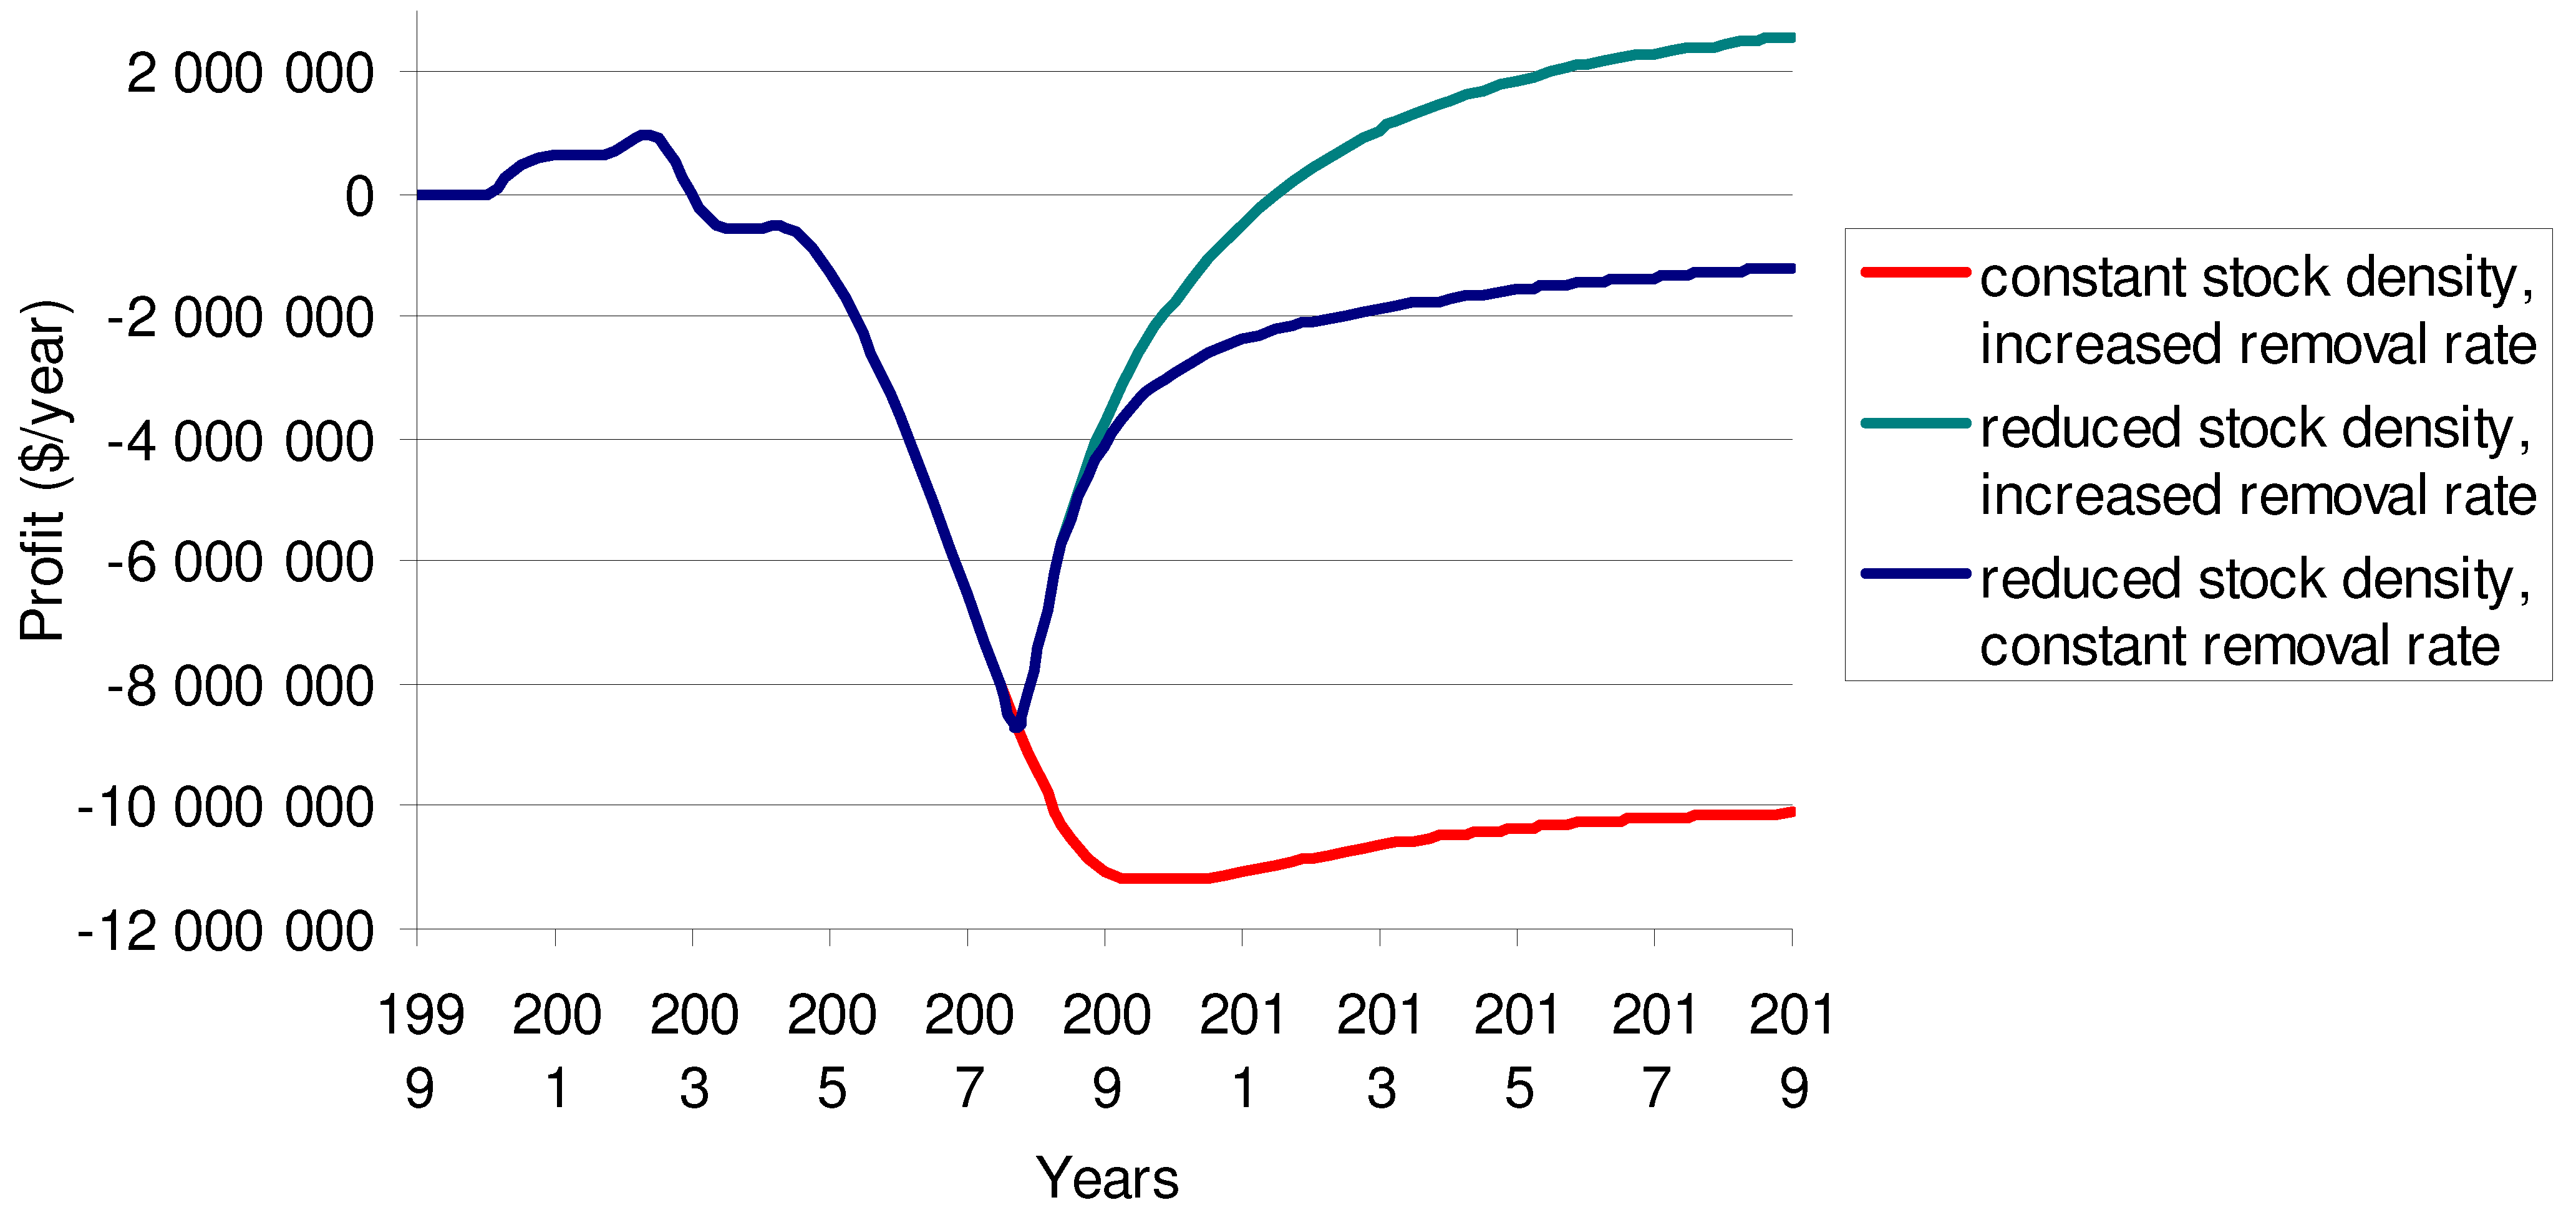
In our opinion, investments to increase nutrient removal are much more practical in the Mekong Delta.
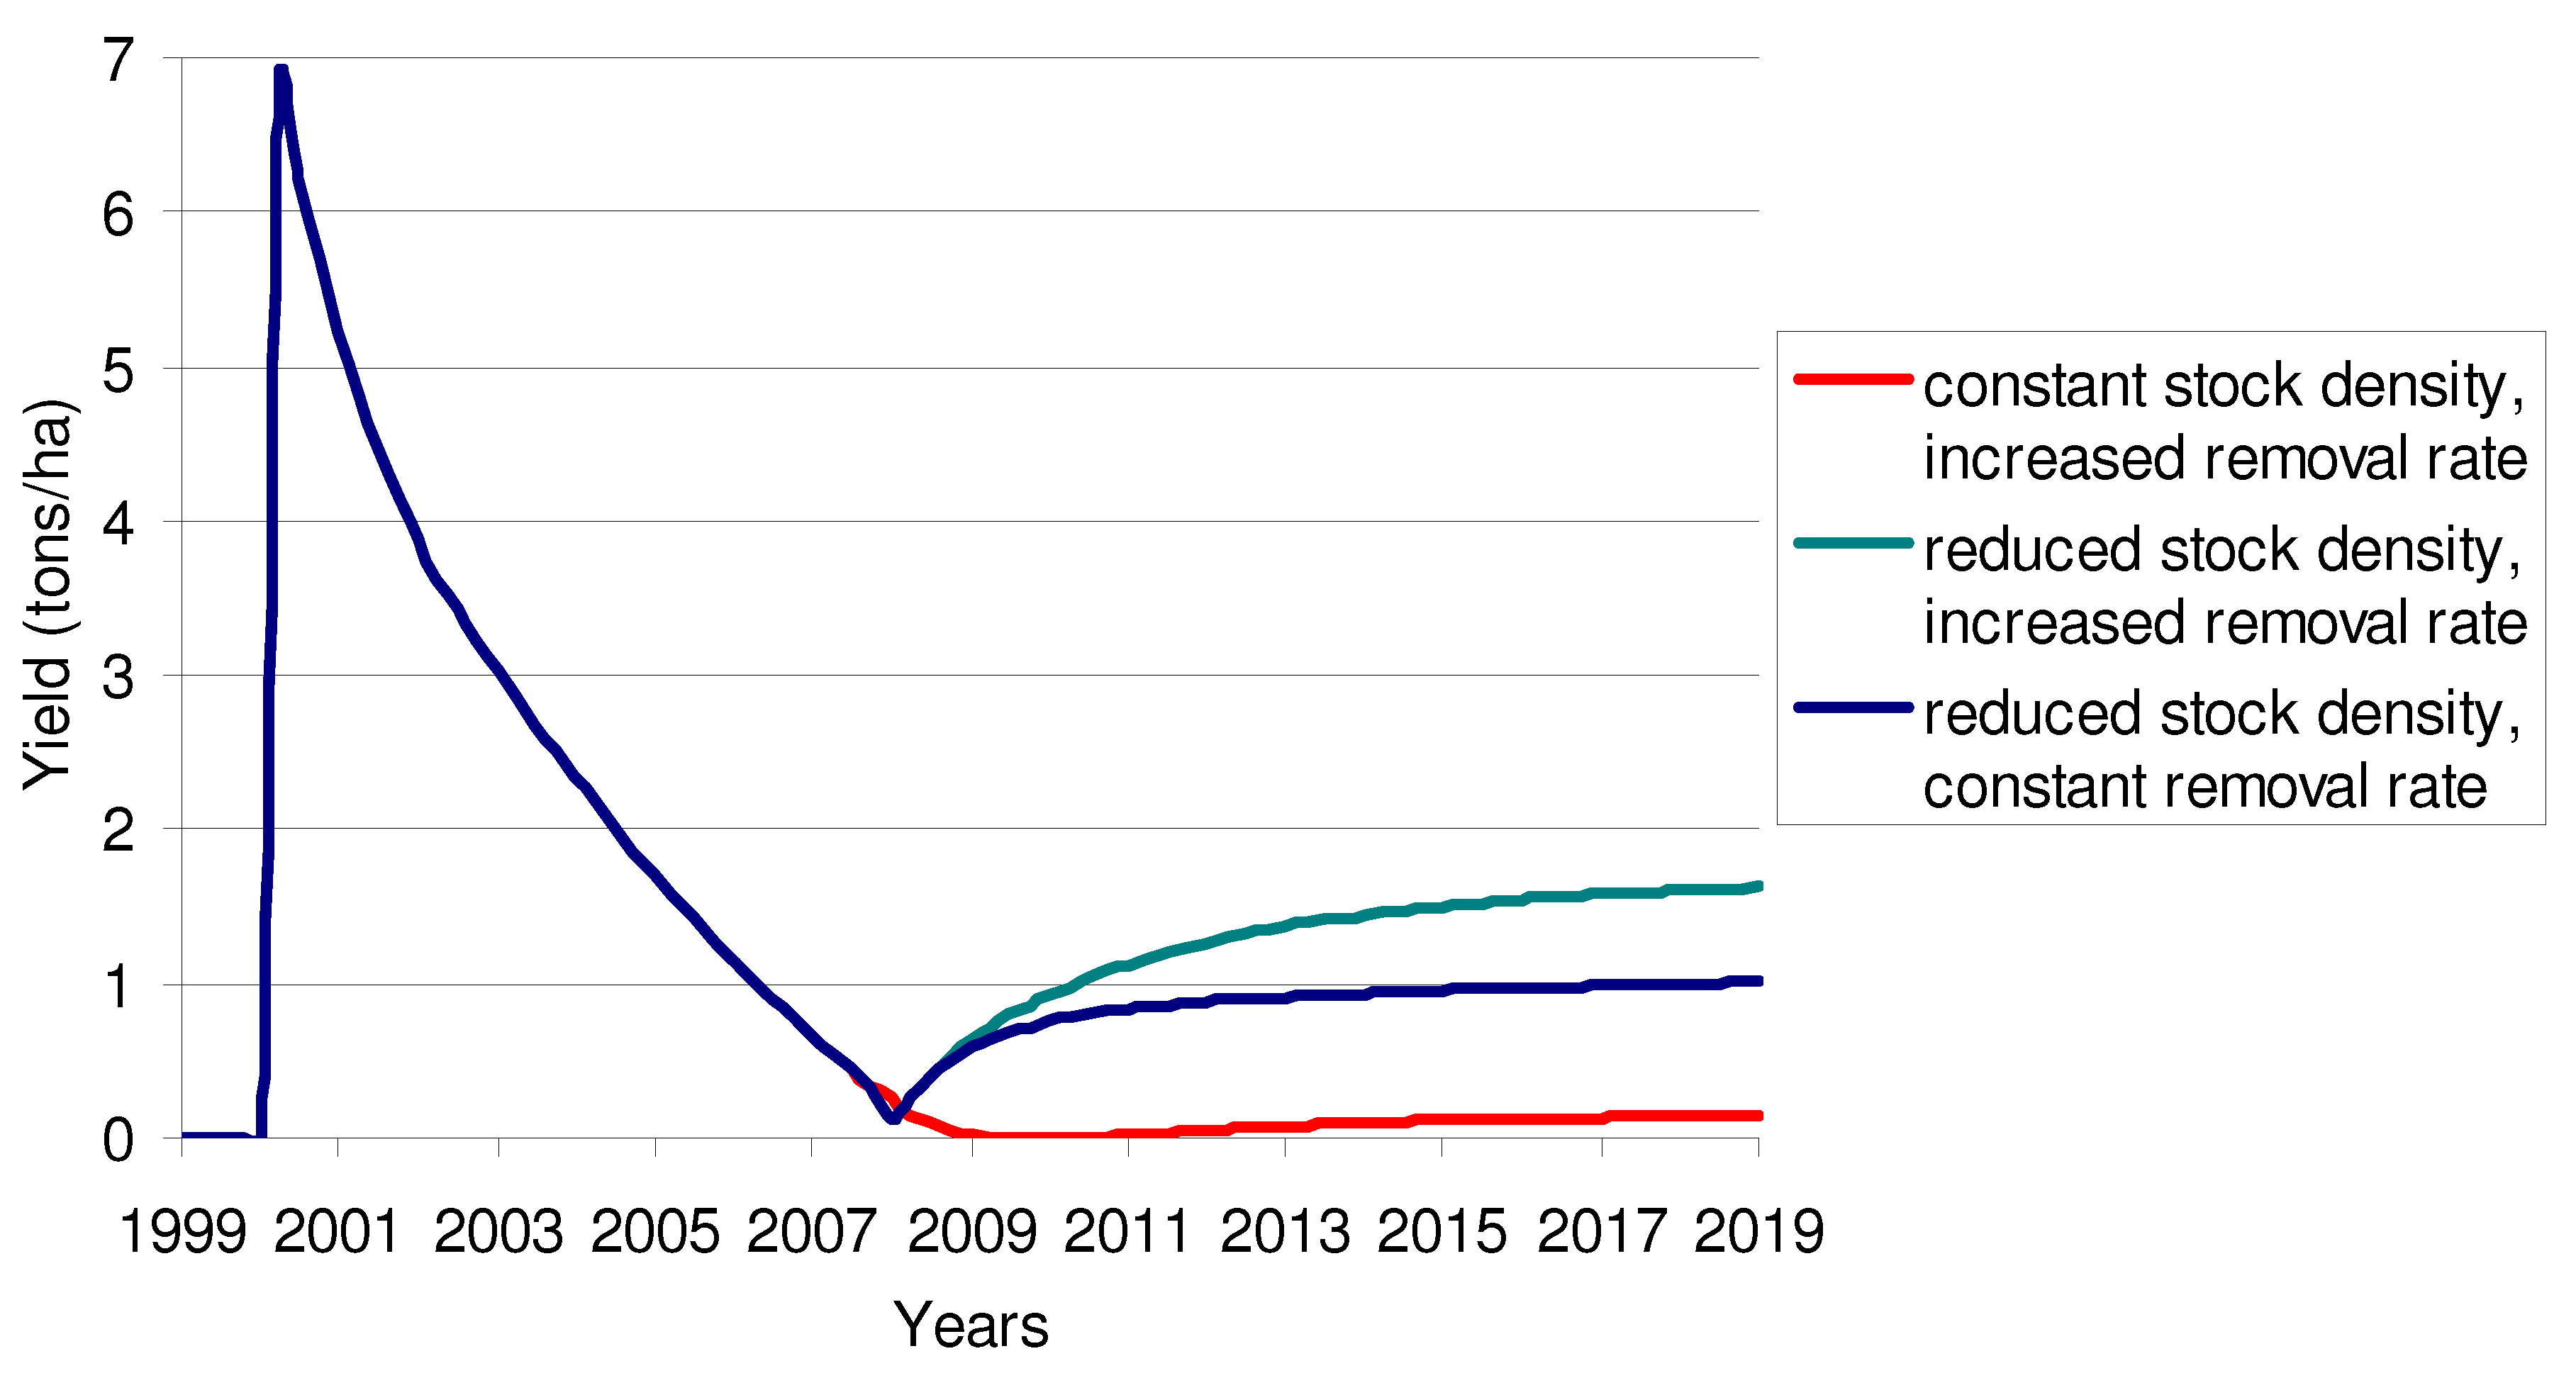
Figure 12 shows the impact of channel improvements by comparing three simulations:
- (1)
Constant stock density & channel improvements: the stock density is maintained at 40 fry/m2 and the tidal removal rate is increased from 50% per year to 75% per year in the year 2008;
- (2)
Reduced stock density & channel improvements: the stock density is cut in half in the year 2008, and tidal removal rate is increased from 50% per year to 75% per year;
- (3)
Reduced stock density & no channel improvements: the stock density is cut in half in 2008 and the tidal remains at 50% per year.
Figure 12 shows that improving the channel without lowering the stock density does not improve the situation. The high tidal removal rate might seem effective at first but it reduces its effectiveness when the substantial inflow of feed continues to build up in the pond and then the channel system. In fact, a combination of improving the channel and lowering the stock density appears more promising with a yield of 1.6 tons/ha in 2019 (
Figure 12). This is quite obvious as the high removal rate helps clean up the channel quickly and the inflow of feed for the low stock density accumulates slowly in the pond and the channel system. This policy yields a profit of $2,000,000 per year at the end of the period, as shown in
Figure 13. As the yield in
Figure 12 is steady, this profit is sustainable. The profit in the long term is so large that it might encourage policy makers to invest in infrastructure development.
These results demonstrate the usefulness of the current model. Like all models, this model is incomplete, and it could be improved in a variety of ways. On the supply side, an interesting improvement could be the inclusion of a simulation of the physiological processes of shrimp growth, perhaps along the lines of the model by Franco [
14]. Shrimp can achieve rapid weight growth in the early stages of the life cycle, so the inclusion of a physiological model would require a change in the units and simulation of time. Other useful extensions include a more detailed treatment of the local demand for shrimp.
Figure 12.
Shrimp yield in simulations with three policies.
Figure 12.
Shrimp yield in simulations with three policies.
Figure 13.
Shrimp profits in simulations with three policies.
Figure 13.
Shrimp profits in simulations with three policies.
5. Conclusions
The simulations presented here shed light on the economic incentives which have motivated local farmers to shift from rice cultivation to shrimp farming over the past 10 years. The simulations show the risky nature of the shrimp business as presently organized in Vietnam. Although farmers are very careful in taking training courses and observing the profits over several years, their expectations are dominated by the high profit obtained by the pilot farm and by their neighbors’ farms in the early years. The risks of shrimp farming are slow to be revealed due to the lags in nutrient accumulation in the ponds and the channels. When excessive nutrients do appear, the farmers are faced with major declines in shrimp yield, falling revenues and an inability to pay off their debts. The massive conversion of rice land to shrimp farming based on early lessons from a pilot farm whose ponds are stocked at high density is a financial trap. Once the land is converted to shrimp and the systems becomes polluted, farmers are stuck with too much debt and with no practical way to return their land to rice cultivation.
The simulations scenarios match the results of field interviews from the Dai Hoa Loc Commune. But the commune farmers are not alone as shrimp farming has proven to be an inherently risky business in other regions of Vietnam [
2] and in other countries in Asia [
15]. However, simulations with lower stocking density teach us that shrimp farming does not have to be such a risky business. The key is to help farmers anticipate the longer-term environmental effects on shrimp yield of high stocking density. But farmers face multiple uncertainties, especially uncertainties about the high cost of feed. Farmers’ reactions to uncertainty are mainly trial and error process, but their options are limited by lack of capital. Government loans would assist with the high initial investment costs, but the government must work with the farmers to limit the stock density (
i.e., to around 20 fry/m
2) and to improve the channel system. With these policy changes, shrimp farming could be a sustainable activity that would benefit the current and future farmers of the Mekong Delta.
Acknowledgements
This article was funded by a grant from the Vietnam Education Foundation (VEF) from 2007 to 2009. The opinions, findings, and conclusions stated herein are those of the authors and do not necessarily reflect those of VEF. We would like to thank Dang Van Tang at Ben Tre Department of Natural Resources and Environment for providing important monitoring data and facilitating us to connect with local people. Our appreciation goes to the People’s Committee of Tan My, Tan Xuan, Thanh Tri and Dai Hoa Loc for local statistics and knowledge. We are thankful to Ngo Thi Phuong Dung, Nguyen Hieu Trung, Nguyen Vo Chau Ngan and Nguyen Dac Cu at Can Tho University for their help during the summer of 2008. Our special thanks go to Joyce Kum Lin Soo for sharing with us the model of Ninh Thuan case.
References and Notes
- Soo, K.L.J. Sustainability of Intensive Shrimp Farming: A Case Study in Ninh Thuan, Vietnam. Master Thesis, Center for Environmental Studies at Lund University, Lund, Sweden, 2005. [Google Scholar]
- Risky Business: Vietnamese Shrimp Aquaculture—Impacts and Improvement; Environmental Justice Foundation: London, UK, 2003.
- Yamashita, A. Flood in the Mekong Delta. Available online: http://cantho.cool.ne.jp/mekong/water/flood_e.html (accessed on 14 February 2009).
- Forrester, J.W. Industrial Dynamics; Pegasus Communications: Waltham, MA, USA, 1961. [Google Scholar]
- Deaton, M.L.; Winebrake, J.J. Dynamic Modeling of Environmental Systems; Springer: New York, NY, USA, 2000. [Google Scholar]
- Ford, A. Modeling the Environment, 2nd ed.; Island Press: Washington, DC, USA, 2009. [Google Scholar]
- Sterman, J.D. Business Dynamics: Systems Thinking and Modeling for a Complex World; McGraw-Hill: New York, NY, USA, 2000. [Google Scholar]
- Nguyen, T.T.H. Modeling Socio-Economic and Environmental Impacts of Shrimp Farming in Mekong Delta, Vietnam. Master Thesis, Washington State University, Pullman, WA, USA, 2009. [Google Scholar]
- Johnston, D.; Trong, N.V.; Tien, D.V.; Xuan, T.T. Shrimp yields and harvest characteristics of mixed shrimp-mangrove forestry farms in southern Vietnam: Factors affecting production. Aquaculture 2000, 188, 263–284. [Google Scholar] [CrossRef]
- Chen, J.C.; Liu, P.C.; Lei, S.C. Toxicities of ammonia and nitrite to Penaeus monodon adolescents. Aquaculture 1990, 89, 127–137. [Google Scholar] [CrossRef]
- People’s Committee of Dai Hoa Loc, Quang Nam Province, Vietnam. Personal communication, 2008.
- Nga, B.T.; Lürling, M.; Peeters, E.T.H.M.; Roijackers, R.; Scheffer, M.; Nghia, T.T. Chemical and physical effects of crowding on growth and survival of Penaeus monodon Fabricius post-larvae. Aquaculture 2005, 246, 455–465. [Google Scholar] [CrossRef]
- Kautsky, N.; Ronnback, P.; Tedengren, M.; Troell, M. Ecosystem perspectives on management of disease in shrimp pond farming. Aquaculture 2000, 191, 145–161. [Google Scholar] [CrossRef]
- Franco, A.; Ferreira, J.; Nobre, A. Development of a growth model for penaeid shrimp. Aquaculture 2006, 259, 268–277. [Google Scholar] [CrossRef]
- Primavera, J.H. Socio-economic impacts of shrimp culture. Aquac. Res. 1997, 28, 815–827. [Google Scholar] [CrossRef]
- Vietnam Standards: Water Quality, Surface Water standards; TCVN 5942; Asia-Pacific Centre for Environmental Law, Faculty of Law, National University of Singapore: Singapore, 1995.
- The Procedure for Intensive Culture of Tiger Shrimp; 28TCN 171; Ministry of Fisheries: HaNoi, VietNam, 2001.
- Funge-Smith, S.J.; Briggs, M.R.P. Nutrient budgets in intensive shrimp ponds: Implications for sustainability. Aquaculture 1998, 164, 117–133. [Google Scholar] [CrossRef]
- Thakur, D.P; Lin, C.K. Water quality and nutrient budget in closed shrimp (Penaeus monodon) culture systems. Aquacult. Eng. 2003, 27, 159–176. [Google Scholar] [CrossRef]
- Burford, M.A.; Lorenzen, K. Modeling nitrogen dynamics in intensive shrimp ponds: The role of sediment remineralization. Aquaculture 2004, 229, 129–145. [Google Scholar] [CrossRef]
- Arquitt, S.; Honggang, X.; Johnstone, R. A system dynamics analysis of boom and bust in the shrimp aquaculture industry. Syst. Dynam. Rev. 2005, 21, 305–324. [Google Scholar] [CrossRef]
- Costanza, R.; Duplisea, D.; Kautsky, U. Modeling ecological and economic systems with STELLA. Ecol. Model. 1998, 110, 1–4. [Google Scholar] [CrossRef]
- Costanza, R.; Gottlieb, S. Modeling ecological and economic systems with STELLA: Part II. Ecol. Model. 1998, 112, 81–84. [Google Scholar] [CrossRef]
- Costanza, R.; Voinov, A. Modeling ecological and economic systems with STELLA: Part III. Ecol. Model. 2001, 143, 1–7. [Google Scholar] [CrossRef]
- Low, B.; Costanza, R.; Ostrom, E.; Wilson, J.; Simon, C.P. Human-ecosystem interactions: A dynamic integrated model. Ecol. Econ. 1999, 31, 227–242. [Google Scholar] [CrossRef]
Appendix
Appendix A. Stock and Flow Diagrams of the Model
Figure A-1.
Stocks and flows in the Shrimp land module.
Figure A-1.
Stocks and flows in the Shrimp land module.
Figure A-2.
Stocks and flows in the nitrogen module.
Figure A-2.
Stocks and flows in the nitrogen module.
Appendix B. Main Parameters of the Model
Table B-1.
Main parameters of the Shrimp land module.
Table B-1.
Main parameters of the Shrimp land module.
| Initial values of stocks: | |
|---|
| Rice land: 2,000 ha | Approximate number of arable land of the Dai Hoa Loc Commune [11] |
| Land with farmers rice capable: 2,000 ha | |
| All other stocks are initialized at zero | |
Converters (These are variables to help explain the flows) | |
| Shrimp unit fixed cost: $10,000/ha | Cost for creating ponds |
| Shrimp unit operating cost: $2,000/ha | Labor costs $1 000/ha and equipment operating costs $1 000/ha |
| Fry unit price: $30/10,000 fry | |
| Feed cost: $0.5/kg | |
| Initial loan: $10,000/ha | |
| Borrowing period: 5 years | |
| Loan interest rate: 14.4%/year | Rate of Agribank |
| Supply reservoir area fraction: 40%. About 30–50% of shrimp land is designated as supply reservoir |
| Rice price: $300/ton | |
| Rice yield: 3.5 tons/ha | |
| Rice unit operating cost: $500/ha | Seed, fertilizer and labor costs |
Table B-2.
Main parameters of the nitrogen module.
Table B-2.
Main parameters of the nitrogen module.
| Initial values of stocks: | |
|---|
| N concentration in the channel: 5E-5 kg/m3 | Water quality, surface water standards: TCVN 5942:1995 [16] |
| All other stocks are initialized at zero | |
Converters: | |
| Fry weight: 1g/fry | |
| Fertilizer: 20 kg/ha The procedure for intensive culture of Tiger shrimp specified 20–25 kg Urea [17] |
| Percent of N in feed: 7% | Funge-Smith and Brigss [18], Table 1 |
| Volatilization fraction: 6% | Thakur and Lin [19], Table 3: 5.2–7.9% |
| Remineralization rate: 6% | Burford [20], Table 1: remineralization rate ~ volatilization rate |
| Percent of N in shrimp weight: 11% | Funge-Smith and Brigss [18], Table 1 |
| Percent of dry weight: 27% | Calculated from Table 1, Funge-Smith and Brigss [18] |
| Expected shrimp weight: 30g/fry | |
| Annual water flow demand/ha: 12,000 m3/ha | |
| Channel estimated volume: 2E6 Channel area ~1,330,000 m2, 1.5 m depth | |
| Treatment efficiency of supply reservoir: 0.3 | |
| Dredging removal rate: 0.9 Assuming that all farmers clean their ponds almost completely after each harvest |
| Tidal removal rate: 0.5 | |
© 2010 by the authors; licensee MDPI, Basel, Switzerland. This article is an Open Access article distributed under the terms and conditions of the Creative Commons Attribution license ( http://creativecommons.org/licenses/by/3.0/).


