1. Introduction
Because post-development hydrology is important to developers and municipalities that must comply with the USEPA National Pollution Discharge Elimination System Phase II regulations, a simple method is needed during planning to guide the placement of impervious surfaces on a landscape. To maximize the opportunities for economical low impact on hydrology and water quality, the method must consider the unique spatial distribution of physical, topographical, and climatological features of the watershed. The objective of the present study is to develop and test a simple, objectively-applied, method that integrates land suitability analysis (LSA) that incorporates landscape features, soils, and climatological data and Low Impact Development (LID) to aid in reducing the anticipated increase in stormwater runoff flood volumes from a residential development.
A land suitability analysis (LSA) considers relevant factors to identify proper locations for different land uses. Land suitability analysis is a systematic procedure for examining the combined effects of a related set of factors that the analyst assumes to be important determinants of locational suitability [
1]. The meaning of suitability is to prioritize areas in terms of supporting proposed land use, considering social, physical, spatial or economic factors. The most suitable land will be used for development first.
The foundational work of McHarg (1969) popularized overlays of natural resources and landscape physiography to analyze land-suitability for, and impacts of, development plans [
2]. Furthermore, land-use planning decisions that encompass wildlife habitat, aesthetic and recreational aspects, and demand for open space have recently been joined by the imperative of stormwater-runoff management [
3]. These various planning and development themes are consistent with concepts of decentralized stormwater management infrastructure and runoff-source control, which attempt to maximize precipitation losses in the hydrological cycle (infiltration, evapotranspiration, interception, abstraction, and ground-water recharge) and minimize surface runoff. The philosophy and approach to decentralization and source control are brought together under green infrastructure (GI) [
4,
5]. One tenant of GI is to reconnect fragmented areas that have the potential to reduce high rates and volumes of runoff during storms. The end result of GI techniques yields contiguous corridors and areas of vegetated landscape that are proximate to areas of development. Several researchers have suggested that land is more likely to be managed in a near-natural state if it satisfies multiple objectives including stormwater management [
3,
6].
LID applies principles of green infrastructure to bring together site-planning and stormwater-management objectives [
7,
8,
9,
10]. The LID philosophy can be used to retrofit existing development and to plan new sites. Examples of this planning approach have been successfully implemented in municipalities throughout New England and the Mid-Atlantic states in the United States [
11,
12]. Some facets of LID include: (a) integrating conservation goals of wetlands protection, habitat preservation, or aesthetic requirements into the design; (b) minimizing development impacts on sensitive landscape locations (e.g., soils and landscapes prone to erosion) or preserving unique landscape characteristics (e.g., soils with high infiltration rates and good drainage, stands of mature vegetation) by using site-specific data in subsequent engineering design ; (c) maintaining natural or pre-development timing of peak-water flows through the watershed; (d) implementing multifunctional, small scale, source-control stormwater management practices that can be integrated directly into existing stormwater infrastructure and landscape; and (e) reducing or eliminating pollution at its source, instead of allowing it to be conveyed downstream.
Soils and topography play a significant role in minimizing stormwater runoff because these attributes vary considerably across even small landscapes, affecting infiltration, runoff, and drainage patterns. Although the spatial distribution of soils and their properties are usually considered in the planning process, the level of detail is often limited to a coarse county-level soil survey (e.g., STATSGO2 database developed by the USDA-Natural Resources Conservation Service in the USA) [
13]. The spatial resolution of these soils data are often not sufficient for designing stormwater management practices that rely on infiltration processes.
Soil maps (“order-1 surveys”) with much better spatial resolution than county-level maps, are often prepared for detailed studies on small tracts of land [
14]. The more detailed order-1 survey provides better spatial resolution, and offers more opportunities to the designer for identifying areas where development should be avoided for small development features (e.g., houses, driveways, and streets) in order to minimize runoff potential of a proposed integrated pervious-impervious landscape drainage system.
Although many rainfall-runoff models are in current use, hydrological models that incorporate the NRCS curve number method are useful to anticipate and compare runoff quantities from different land uses [
15]. The curve-number is a rainfall-runoff model that lumps site characteristics (hydrologic soil group, land use, vegetative cover) into a quantity known as a “curve number” (CN). A CN represents the runoff potential of a watershed, with values ranging between 0 and 100 (larger CNs represent watersheds with high runoff potential such as a rooftop) [
16]. The CN method is incorporated into many models widely used today at the large and small spatial scales to estimate the total runoff volume from watersheds, and in subsequent methods to estimate peak runoff rates for storms of varying frequencies [
17,
18,
19,
20,
21]. The CN method applied to a watershed utilizes the spatial delineation of soil map units, land use, and vegetative cover to compute an area-weighted average watershed CN to estimate runoff volumes.
The present study only focuses on the development and testing of a proof of the concept. Project economics are not considered. Total runoff depths expected from different frequency storms for four scenarios are compared: (i) the pre-development condition, (ii) a conventional design, (iii) LID design based on the LSA of same building size of the conventional design; and (iv) LID design based on the LSA with reduced building footprints.
2. Experimental Section
2.1. Study Site Characterization
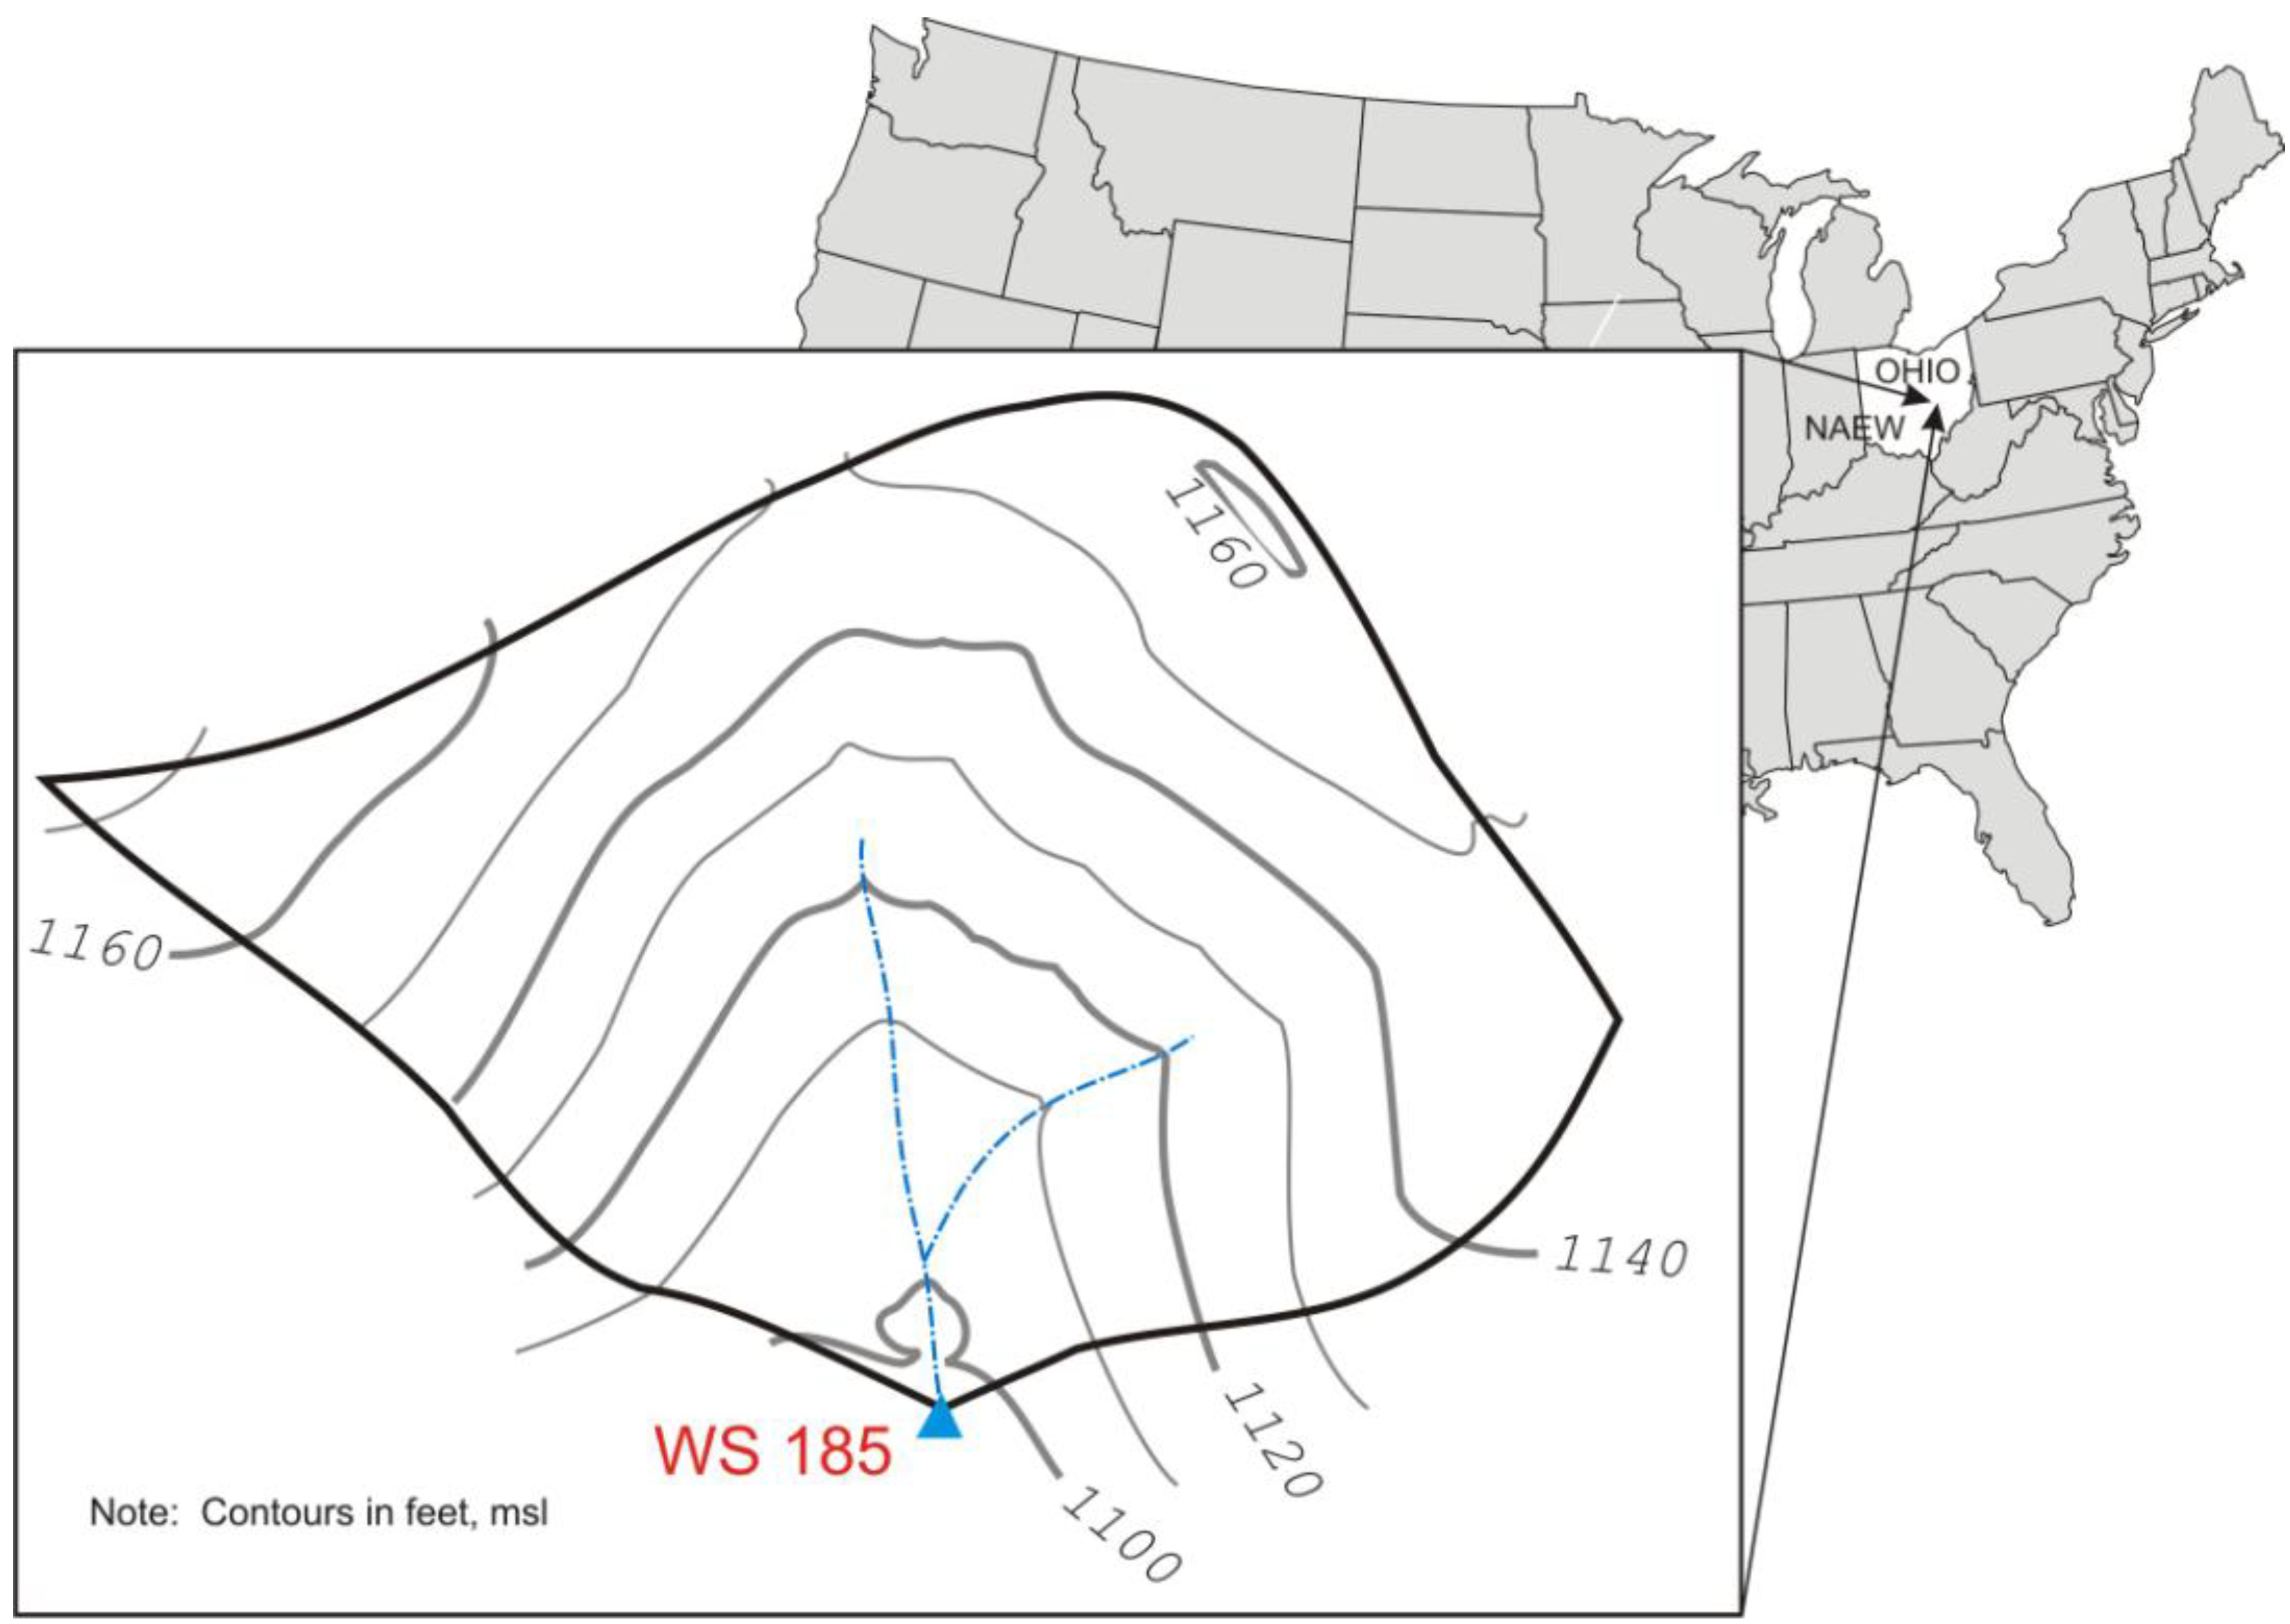
The 3-hectare experimental watershed used in this study (WS185) is located at the watershed facility operated by the USDA-Agricultural Research Service—North Appalachian Experimental Watershed (NAEW) near Coshocton, Ohio in the USA (
Figure 1). The climate is a continental pattern and receives an annual average of approximately 1,000 cm of precipitation. The greatest amount of precipitation normally occurs from May through August, a period when vegetative cover would be well-developed [
22]. The predominant land use at the site is hay meadow from 1986 to the present time.
Figure 1.
Topography of Watershed 185 at the NAEW near Coshocton, Ohio, USA.
Figure 1.
Topography of Watershed 185 at the NAEW near Coshocton, Ohio, USA.
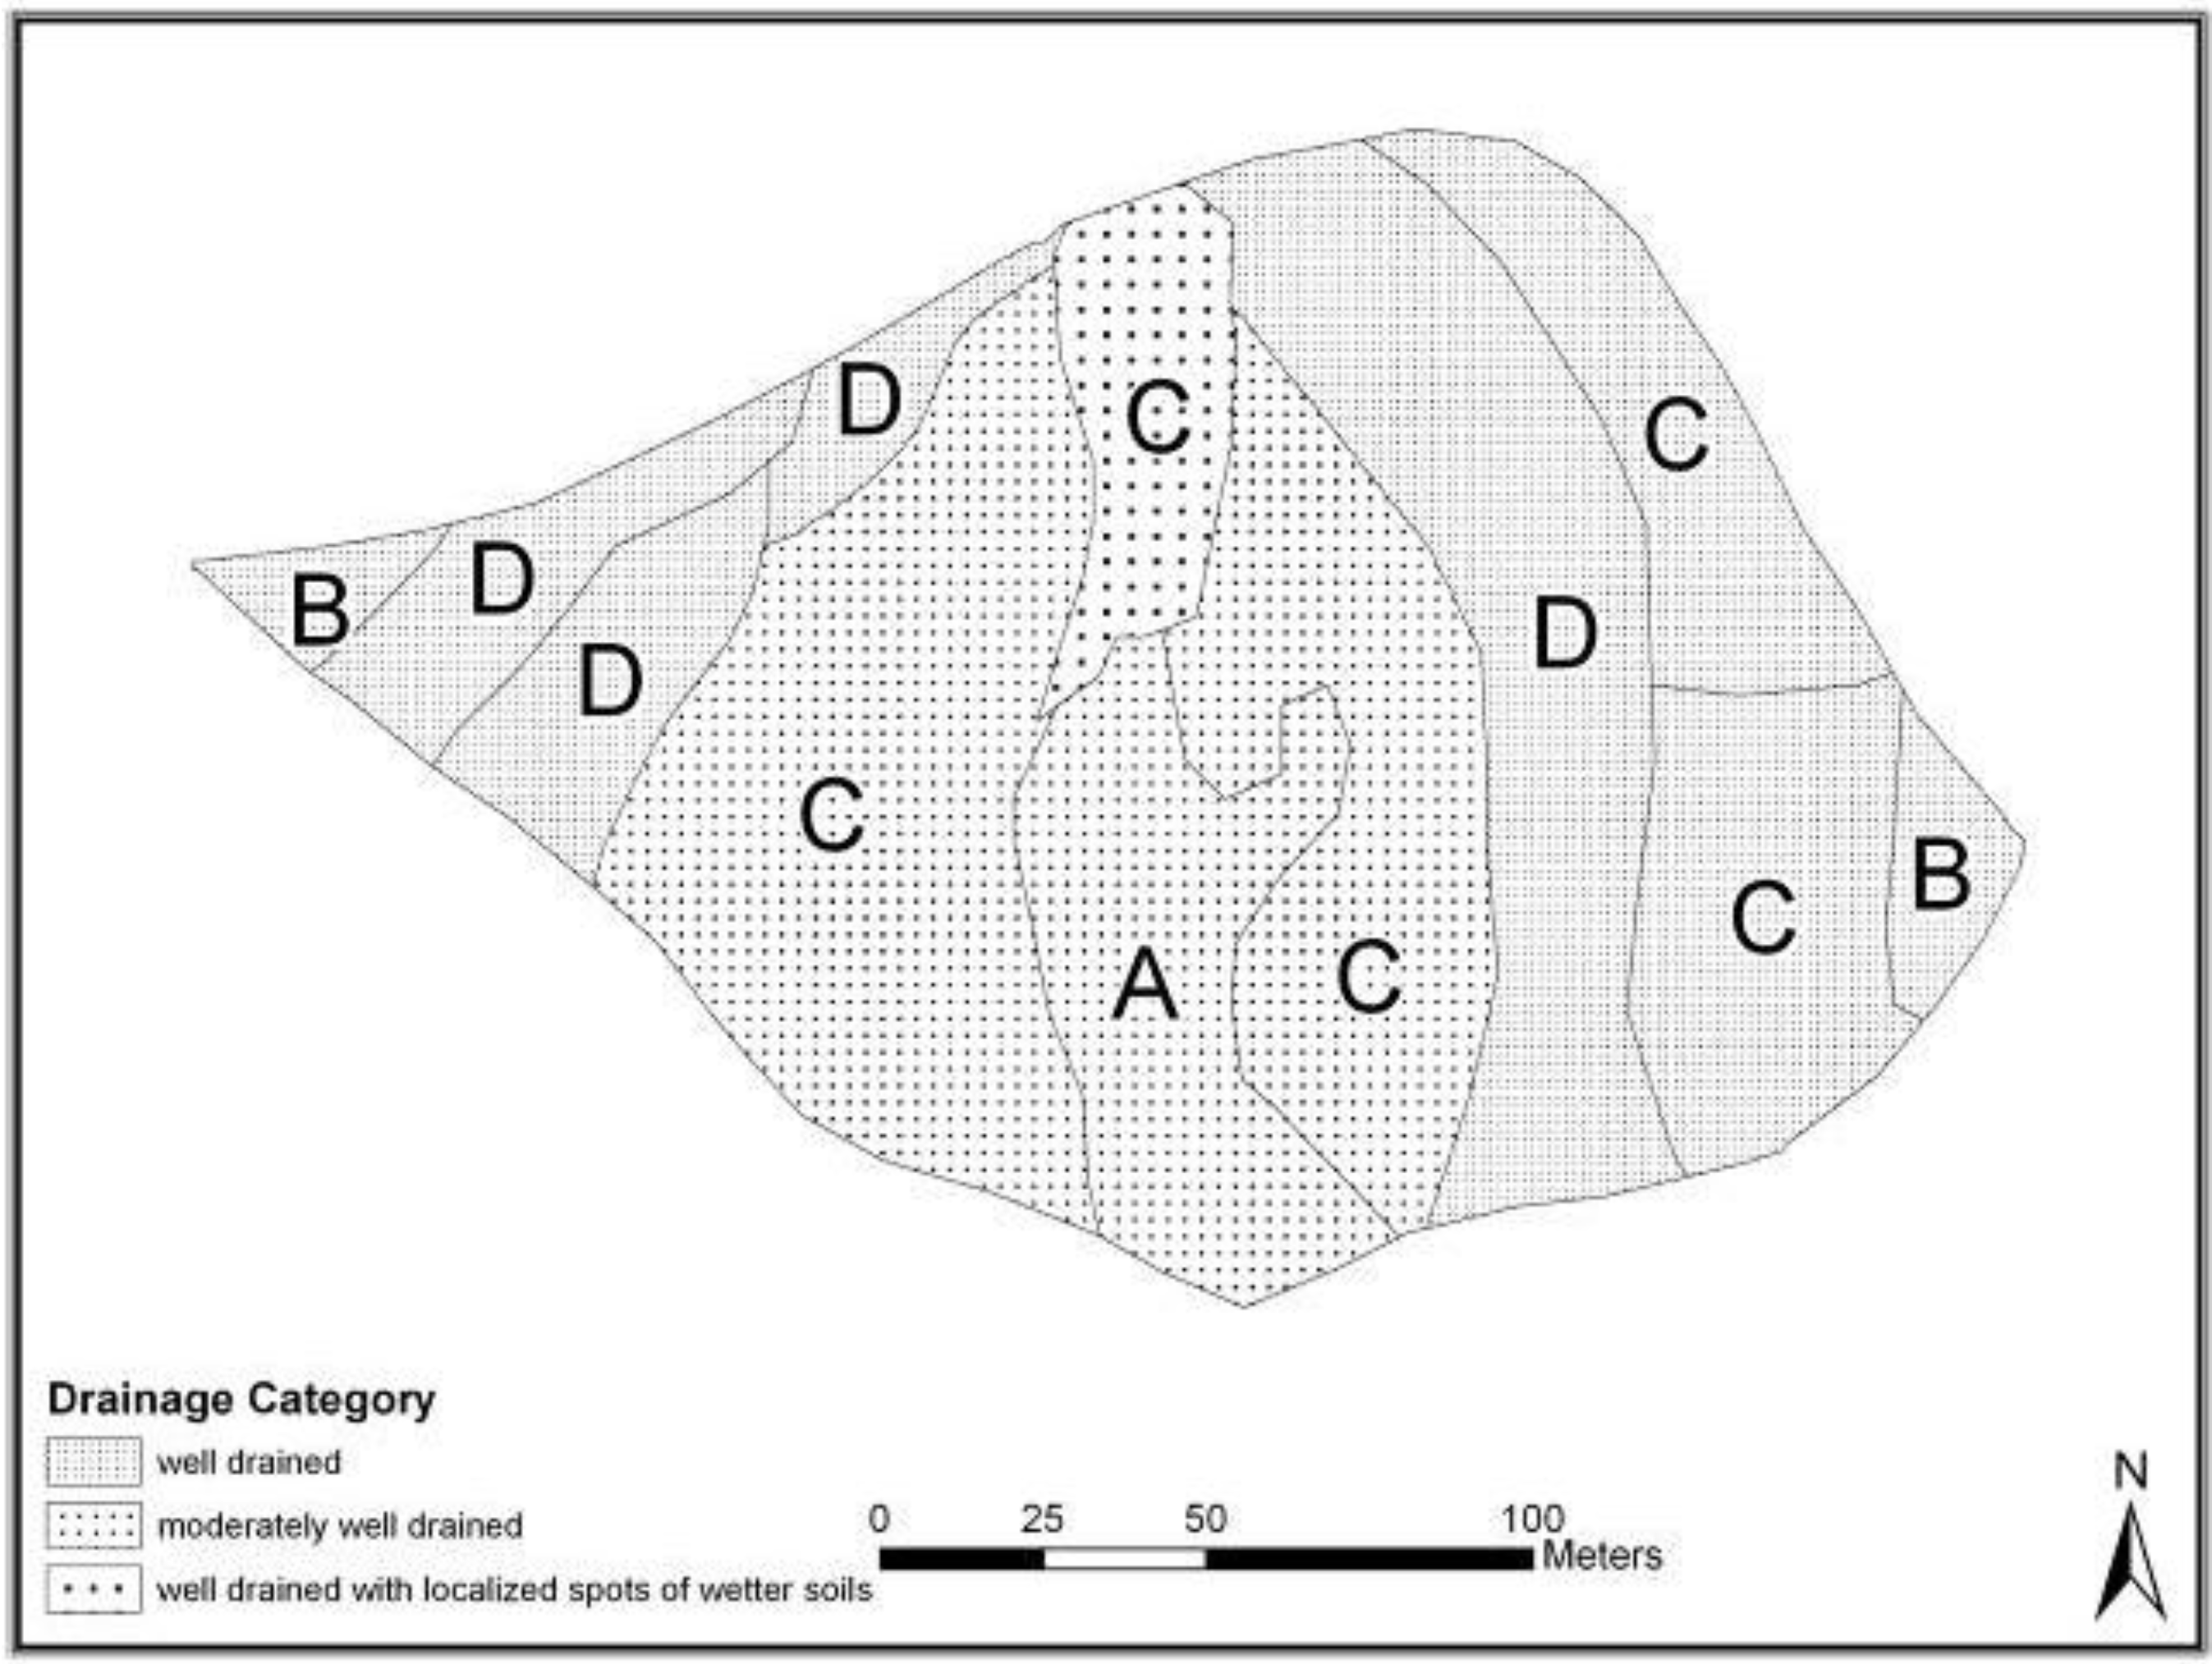
Data used in the study include order-1 soil survey data and a topographic map developed using 4-ft contours. An order-1 soil survey of WS185 was prepared by the USDA-Natural Resources Conservation Service (NRCS) in 2002. To prepare an order-1 soil survey map, the landscape is first visually divided into areas based on slope and landscape position. Survey map-unit boundaries are then estimated on the basis of known soil series in the area. Soil samples are obtained for each soil map unit to confirm and refine the initial classification of soil series and obtain better resolution of soil boundaries. Information gained from field-sampled soils include evidence of redoximorphic horizons (drainage tendency), argillic zones (long-term leaching behavior), texture (spatial variability in hydraulic conductivity at scales < 1 m), soil depth (potential for drainage), bedrock geology (potential for deep percolation) to qualitatively characterize infiltration and drainage properties.
Files for soil mapping polygons, local roads, and topography were overlaid using ArcGIS 9.3 (ESRI International; Redlands CA). Information from the soil survey was used to determine one of four NRCS hydrologic soil groups (HSG) for each map unit required by the CN method to quantify infiltration characteristics. The four HSG categories are A, B, C or D, in a sequence from higher to lower infiltration potential. The drainage characteristics of the soil map units were classified from the soil survey as well drained, moderately well drained, and well drained with localized spots of wetter soils (
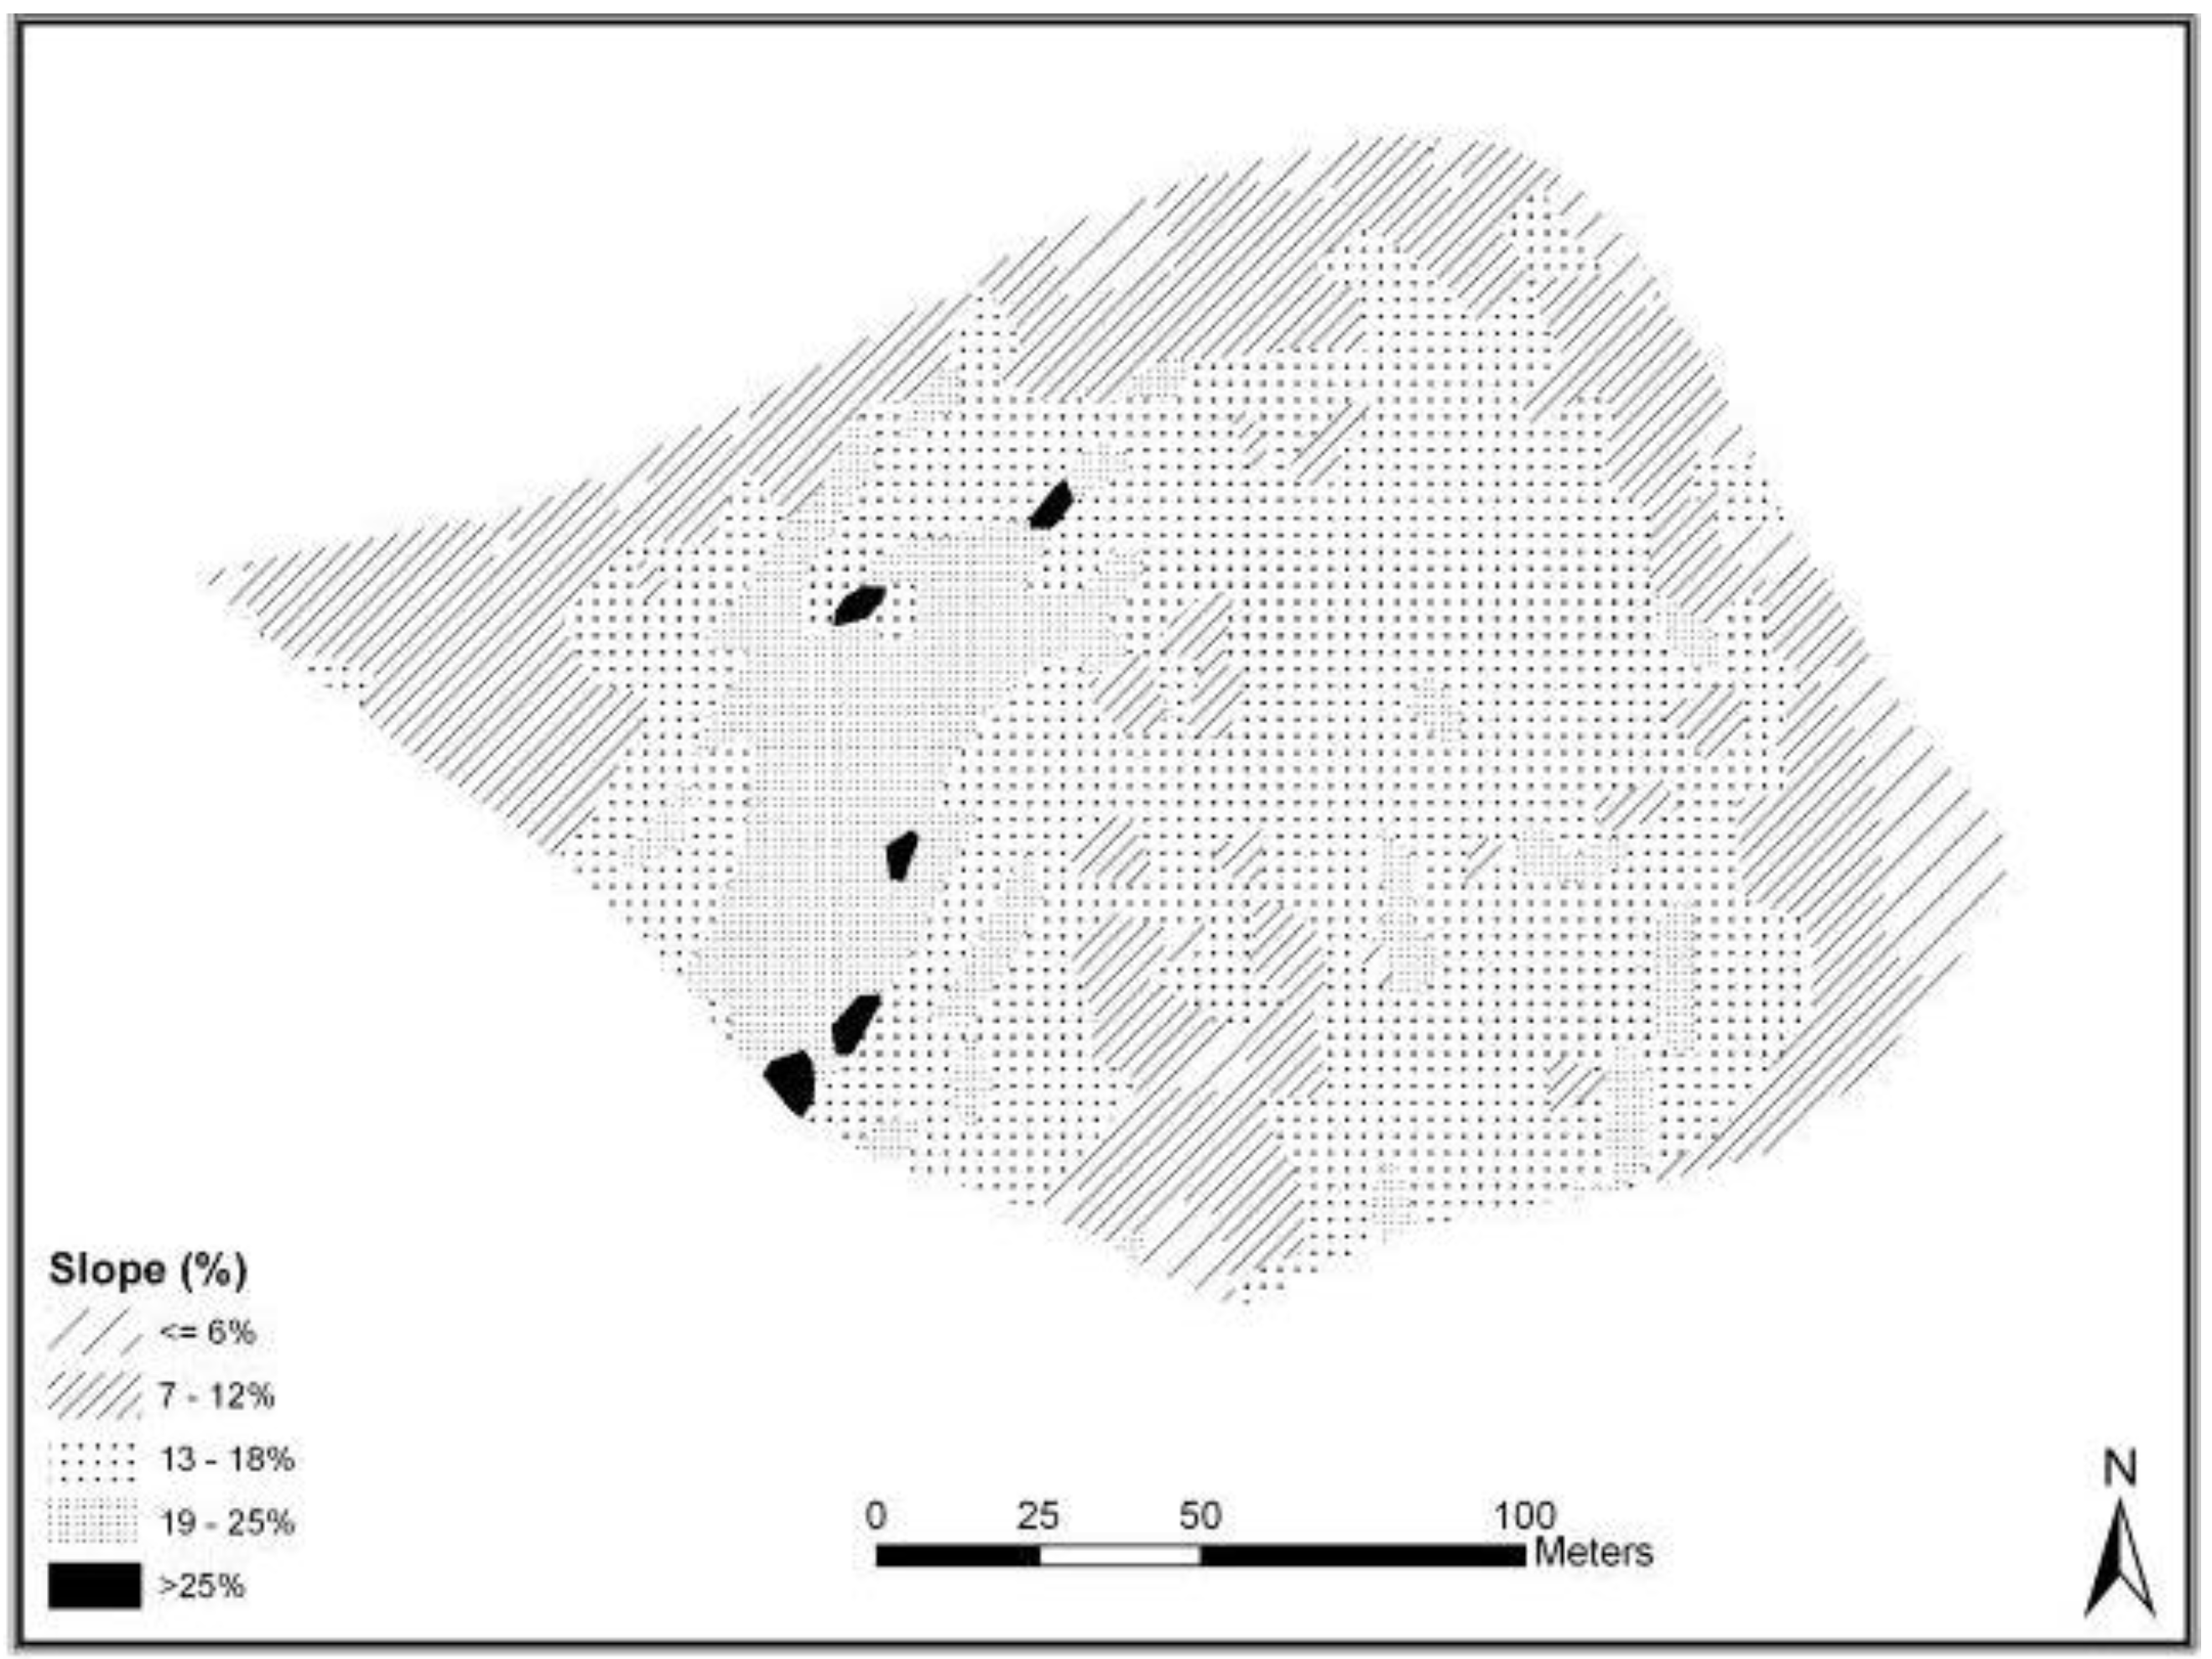
Figure 2). The 4-foot elevation contours were used to create a land surface slope layer measured as percent slope. The percent slope was further reclassified into 5 classes from a flat area to most steep slope area (
Figure 3).
Figure 2.
NRCS hydrologic soil groups and drainage categories for Watershed 185 at the NAEW.
Figure 2.
NRCS hydrologic soil groups and drainage categories for Watershed 185 at the NAEW.
Figure 3.
Slope categories of Watershed 185 at the NAEW.
Figure 3.
Slope categories of Watershed 185 at the NAEW.
2.2. Land Suitability Analysis
Land suitability analysis was used to determine the degree of suitability, based on factors deemed important, for proposed land use (
Table 1) [
3,
23]. Factors selected for the suitability analysis in this study were slope, hydrologic soil group (HSG), and soil drainage classification (
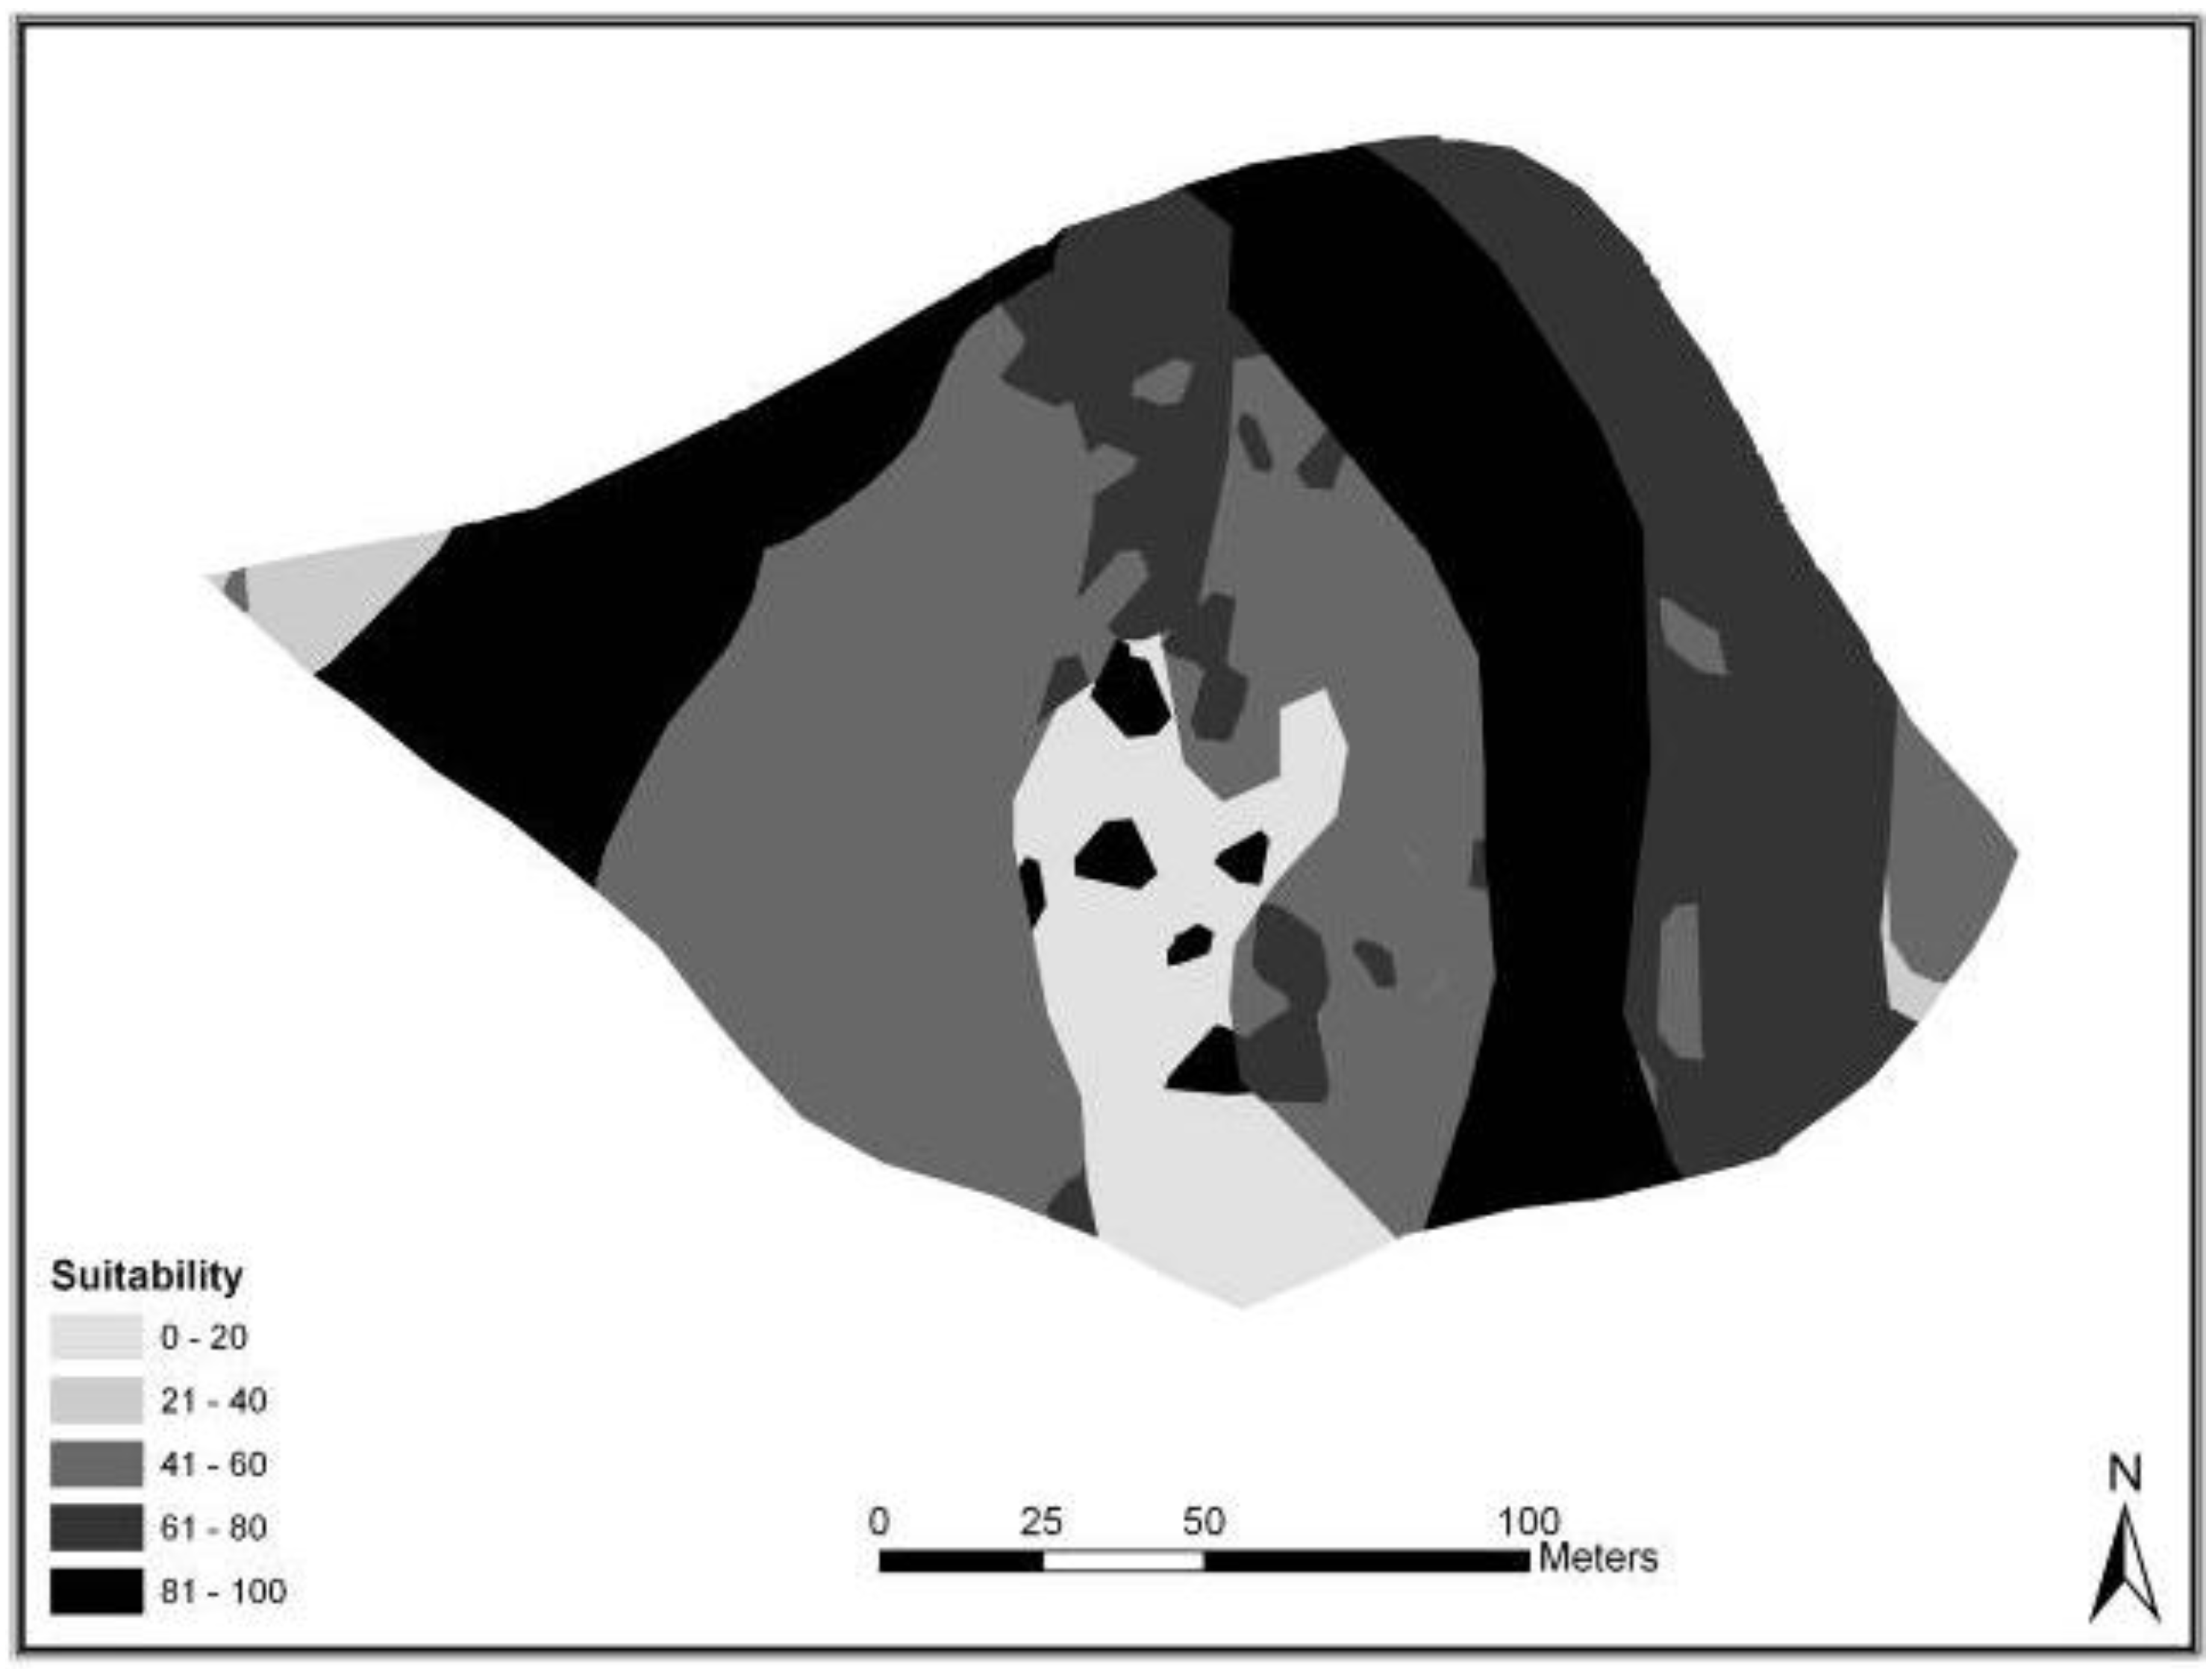
Table 1). Overlaying those factors generated many small polygons throughout the watershed. Each of the polygons was calculated a suitability score. The spatial variation of those values provided the basis for guiding land development.
Each factor was scored on a scale from 0 to 10, with a maximum score of 10 representing the most suitable and 0, the least suitable for the proposed residential development. The slope factor score was maximized for areas with the flattest slopes. Development on soils belonging to HSG A (i.e., soils with low runoff potential) is discouraged, as permeability is relatively high, and, hence these soil units would be expected to mitigate runoff. On the other hand, pre-development soils belonging to HSG groups C and D have lower permeability and their runoff potential is relatively larger, approaching that found for impervious areas. Therefore, larger scores are given to encourage development in these areas. Finally, drainage capability quantifies how well overland runoff is drained from the property through the soil horizon, and high scoring was assigned well-drained areas to encourage development on areas with high potential of runoff.
Table 1.
Suitability factor scores.
Table 1.
Suitability factor scores.
| HSG (Wt = 7) | Slope (Wt = 10) | Drainage (Wt = 5 ) | |
|---|
| Category | Value | Category | Value | Category | Value |
| A | 1 | <=6% | 10 | Well-drained | 10 |
| B | 4 | 7–12% | 7 | Moderately well-drained | 6 |
| C | 7 | 13–18% | 4 | Well drained with localized spots of wetter soils | 7 |
| D | 10 | 19–25% | 1 | - | - |
| - | - | >25% | 0 | - | - |
Scores were then weighted to reflect their relative importance in determining the suitability of development activity in a given area of the watershed. In the absence of criteria to rate the importance of each factor, heuristic arguments were applied to weight these factors. Slope was assigned a weight of 10 as it affects construction practices and therefore may be a more meaningful factor to developers. Slope also influences the potential for infiltration and peak runoff rate along the landscape, and therefore higher slopes would limit infiltration and increase runoff peak flows perpendicular to landscape contours. The HSG was given a weight of 7 due to its effects on infiltration potential which was considered a serious imposition on the prospects for development. Runoff control has not been typically accounted for in development plans, and therefore not a high priority for consideration by developers. The drainage factor was given the lowest weight of 5.
Suitability analysis was conducted with Scenario 360 software (Placeways, Boulder, CO) which was implemented on ArcGIS (Ver. 9.3; ESRI Inc., Redlands CA). This software facilitated the calculation of a suitability score from geospatial data (slope, HSG, drainage scores and weights), which were attributed to each soil-survey map unit. The suitability score (SS) was a simple weighted sum calculated with a matrix method as:
where W and s are the weight and the attribute score for factor i, respectively. A higher suitability score suggests an area appropriate for development, and areas with lower scores should be conserved for infiltration and to maintain pervious areas to minimize runoff generation.
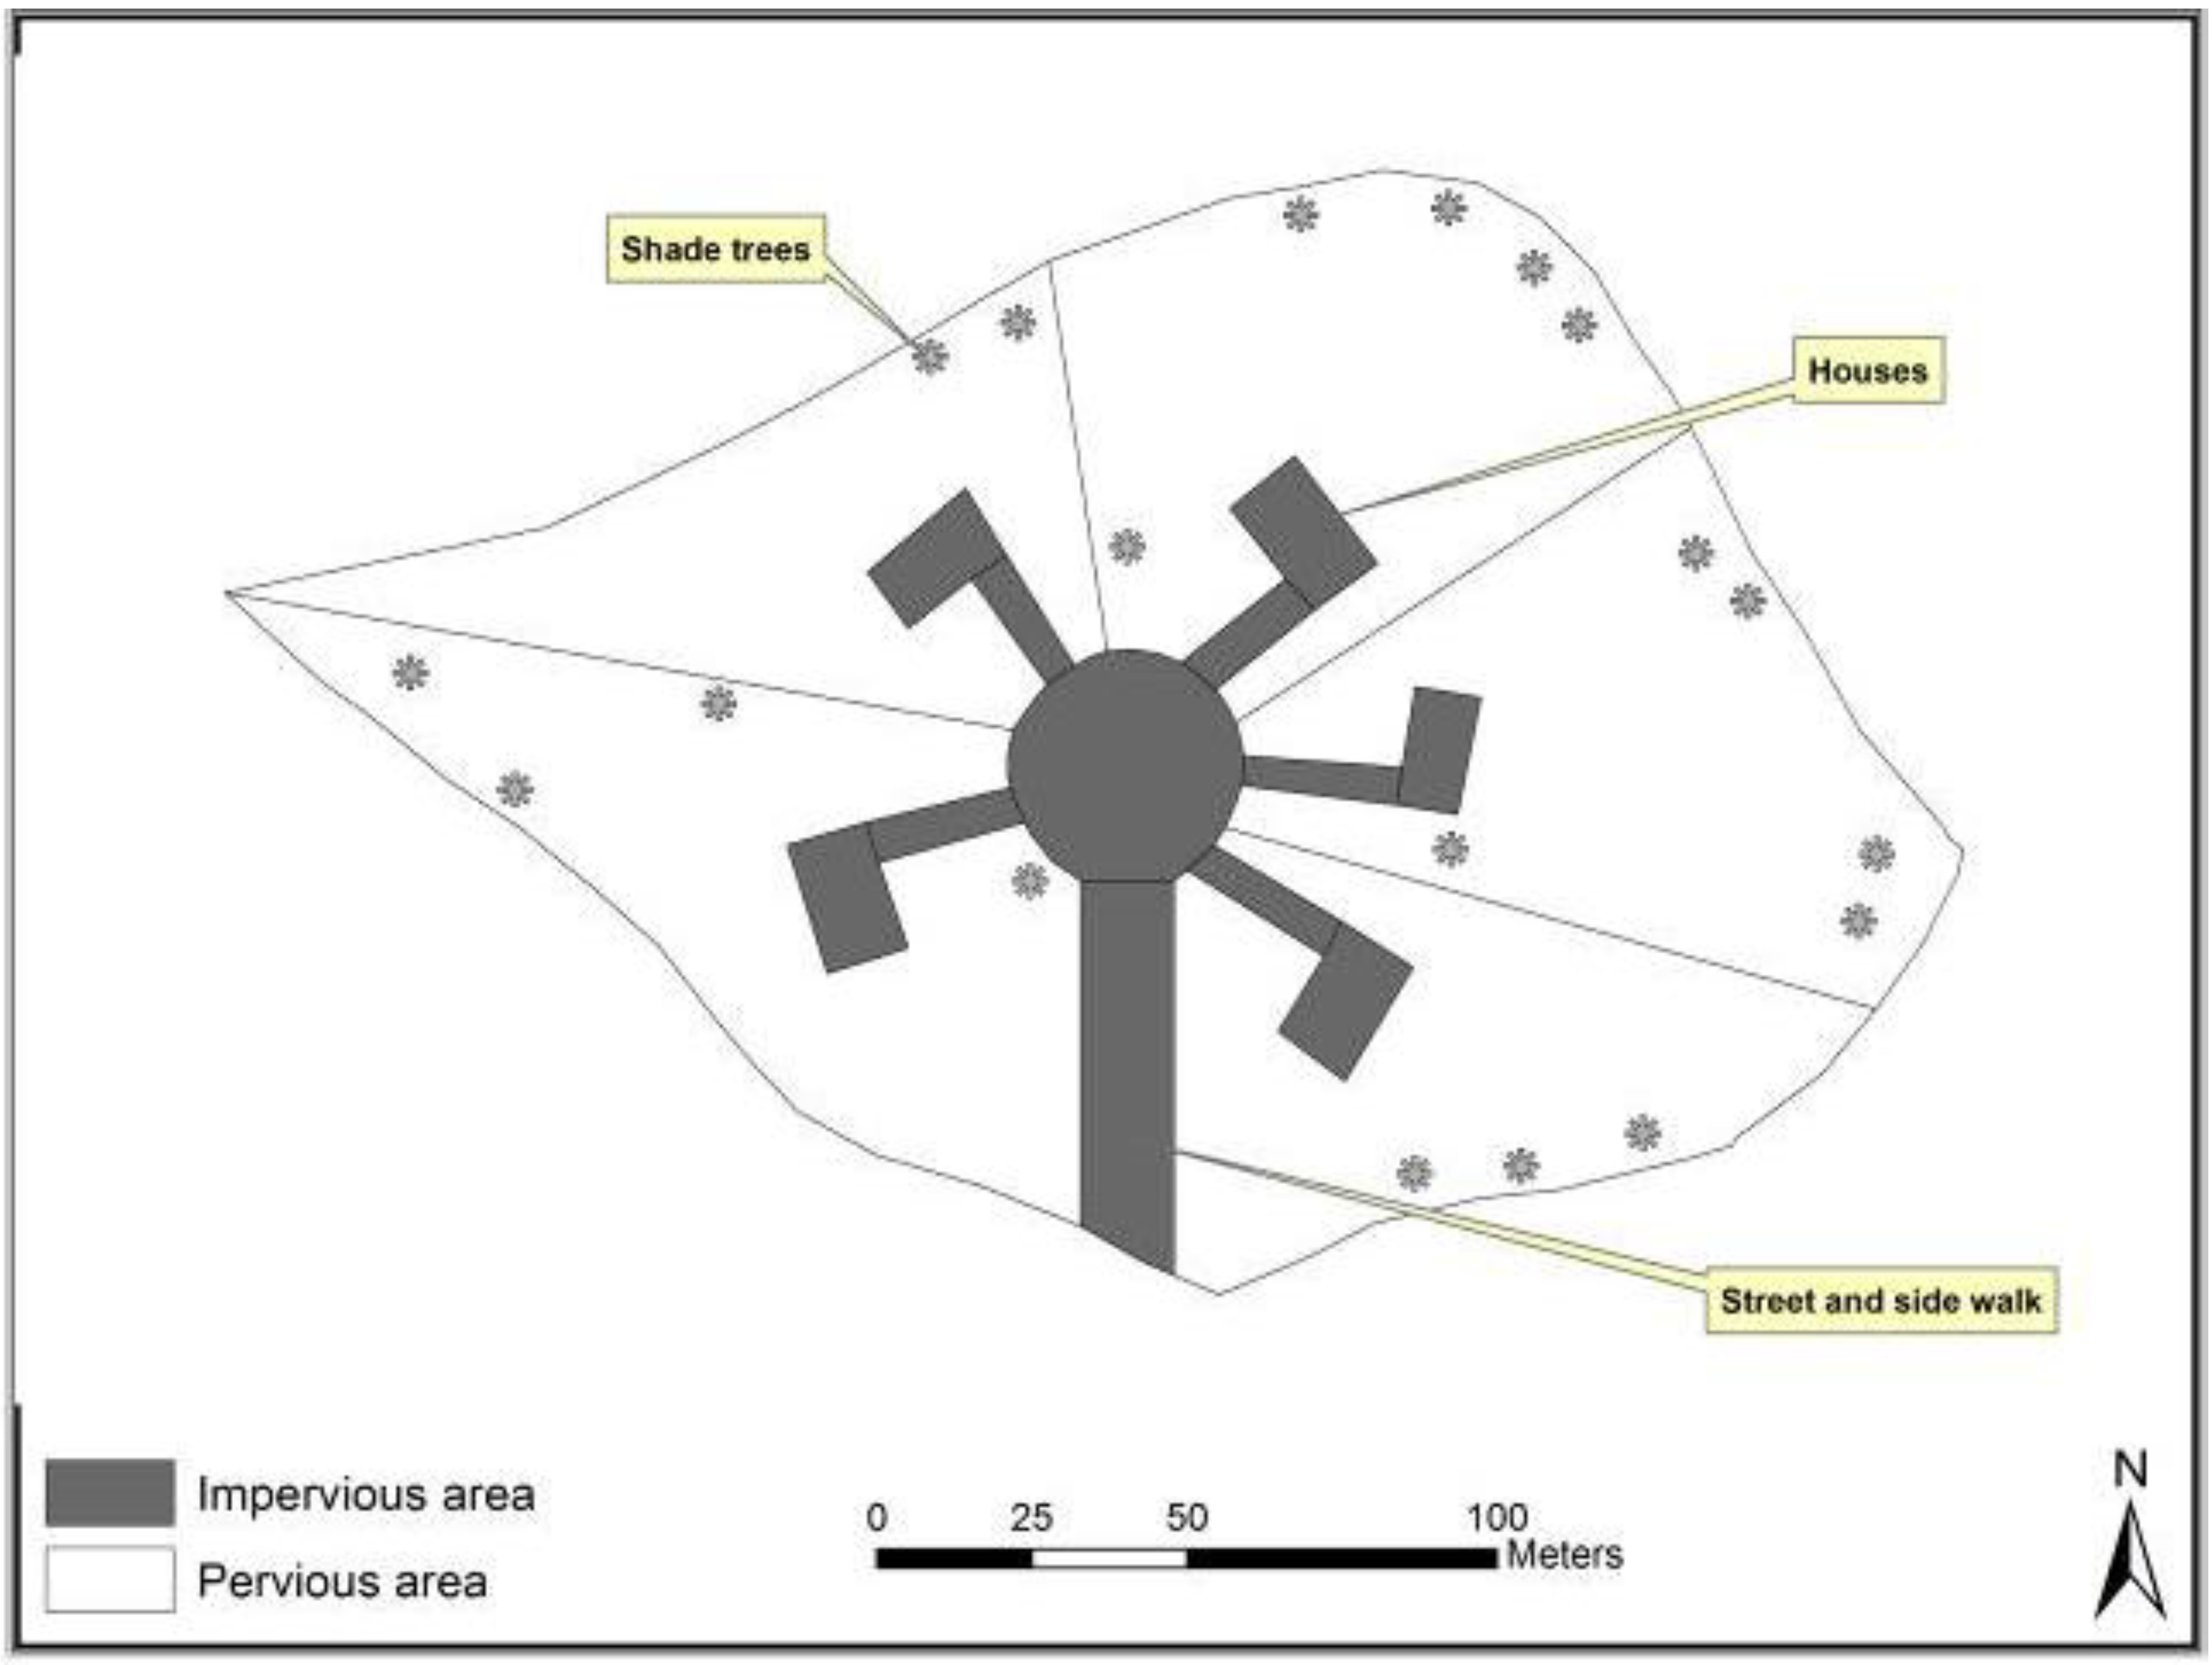
2.3. Development Plans
Because there were only a few spots where slope exceeded 25%, there were no restrictions on the conventional development and the layout of lots was based upon De Chiara
et al. and suburban development guidelines published for Wayne and Coshocton counties, OH [
24]. It has a checkerboard layout of large lots accessed by a wide street ending in a cul-de-sac. The typical cul-de-sac radii recommended by most city ordinances are equal or greater than 15 meters.
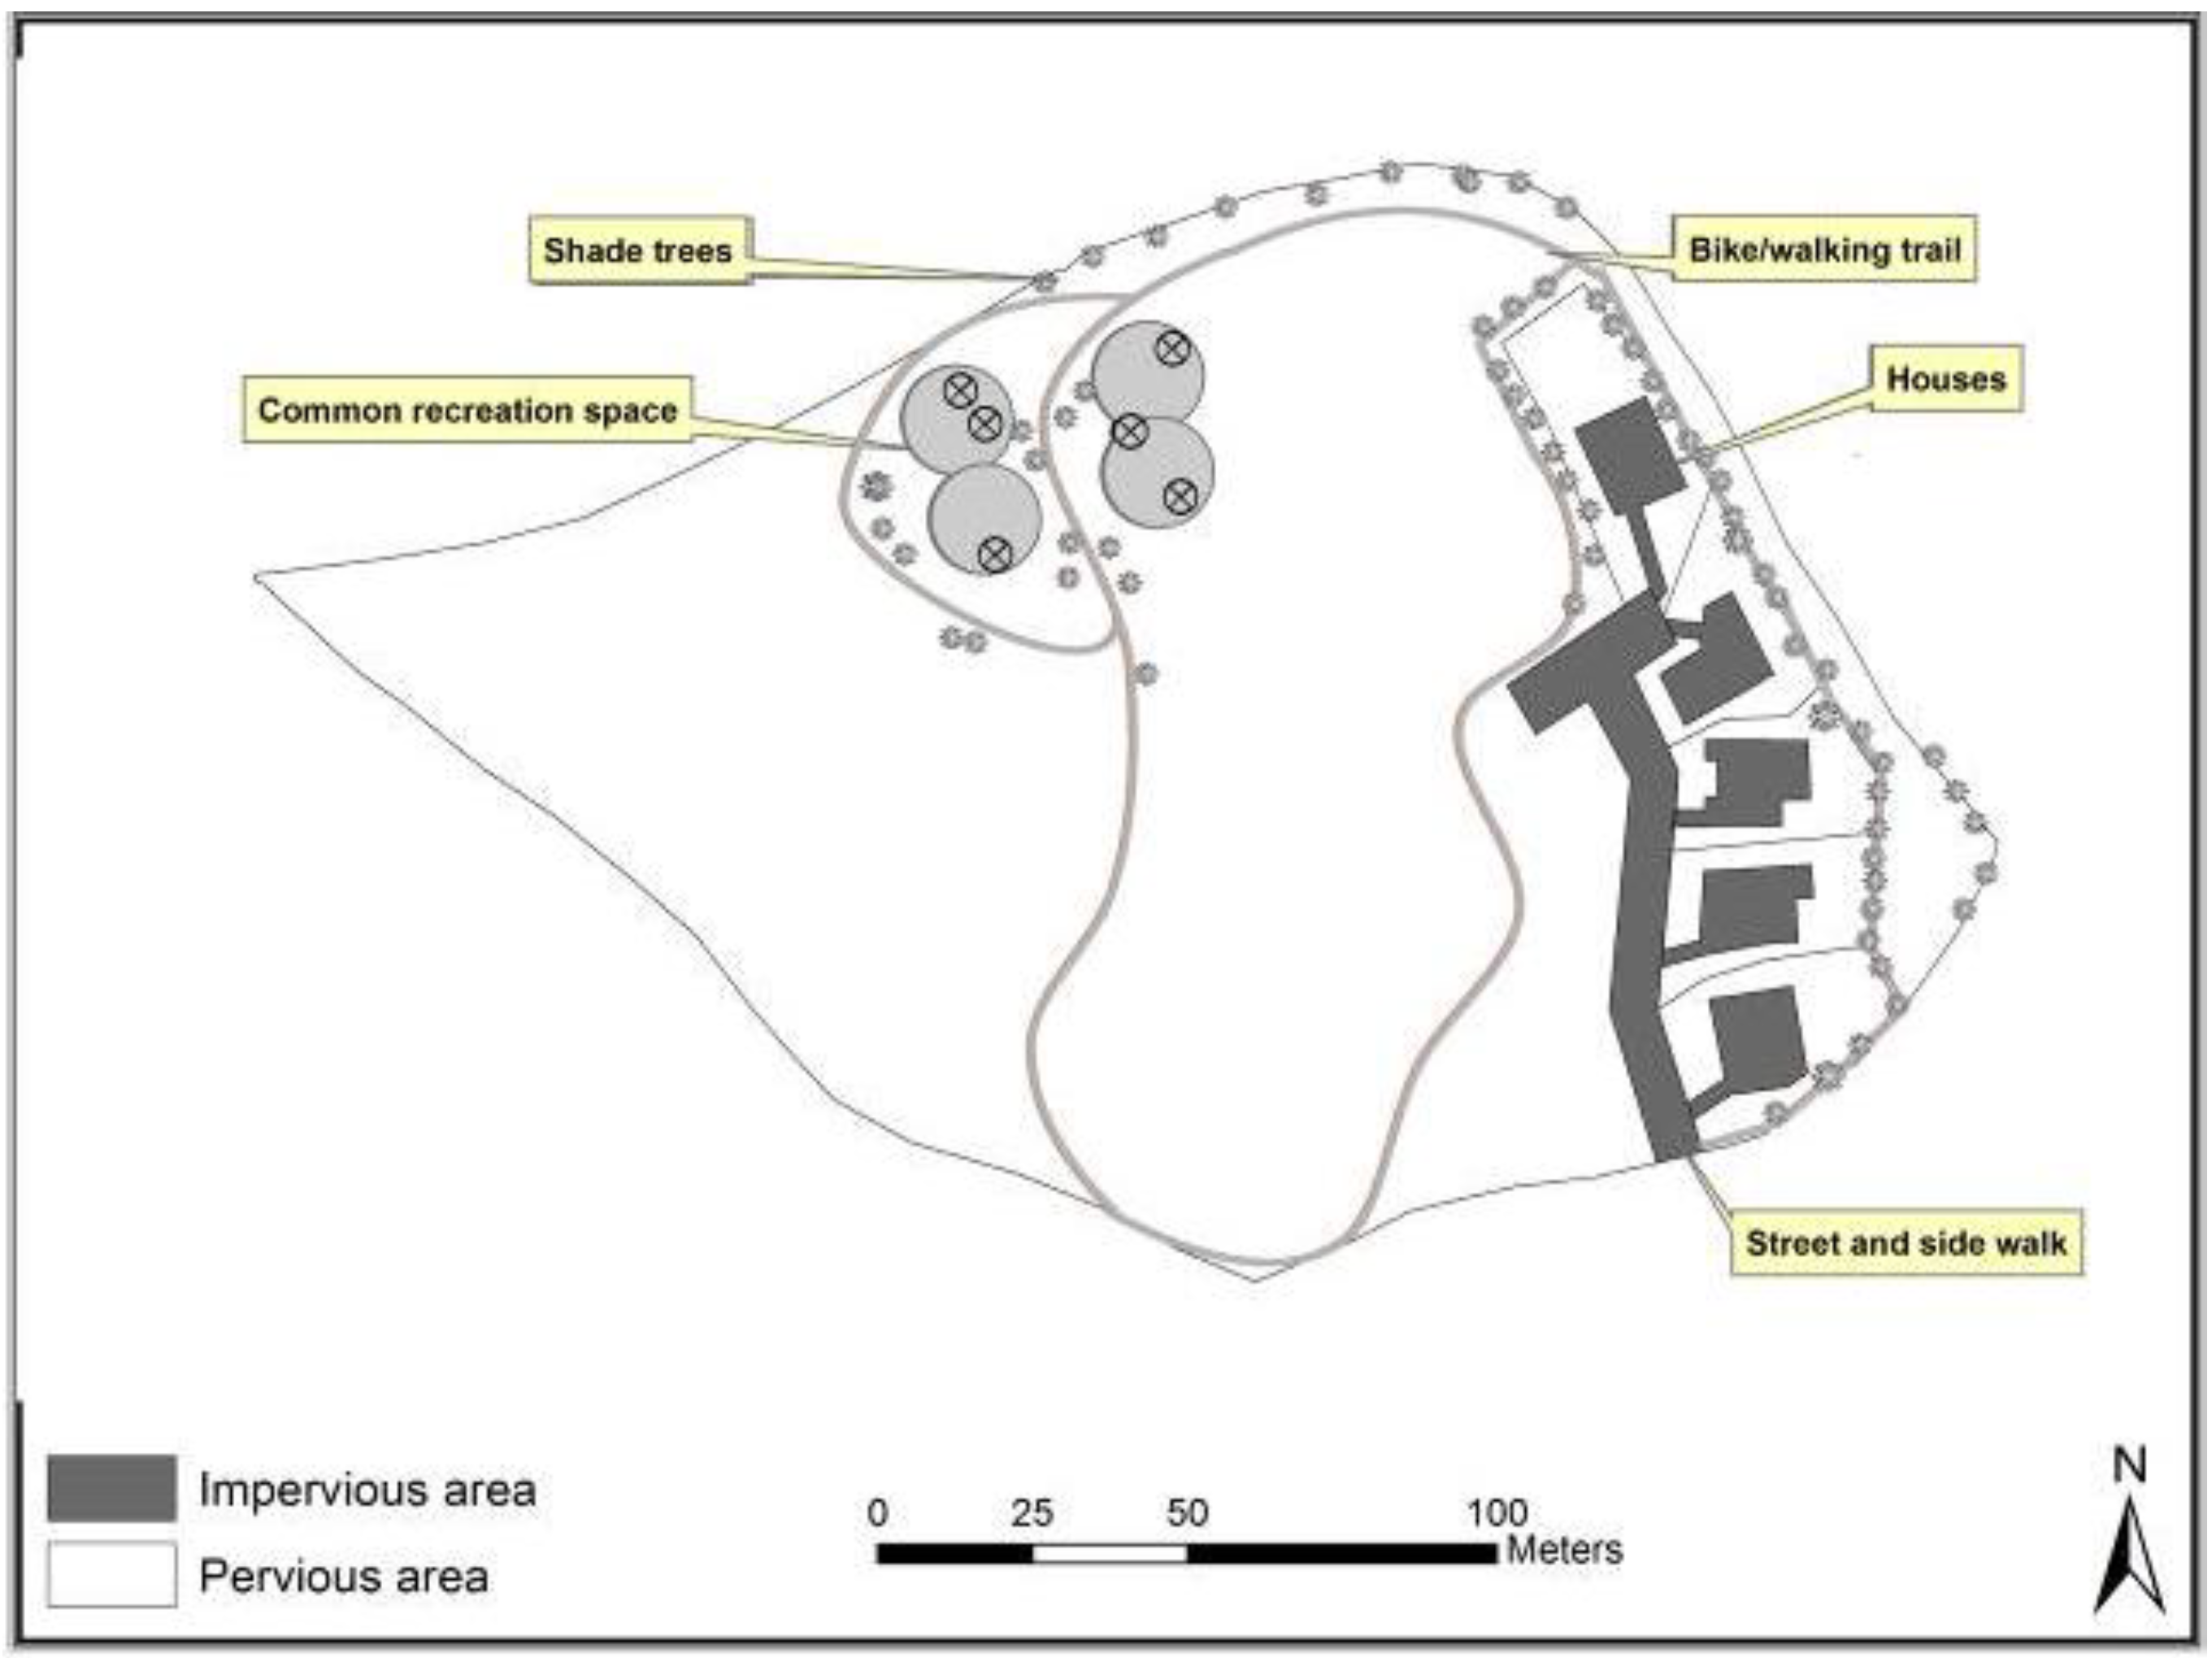
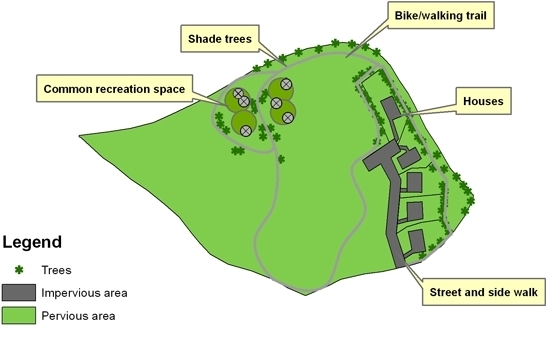
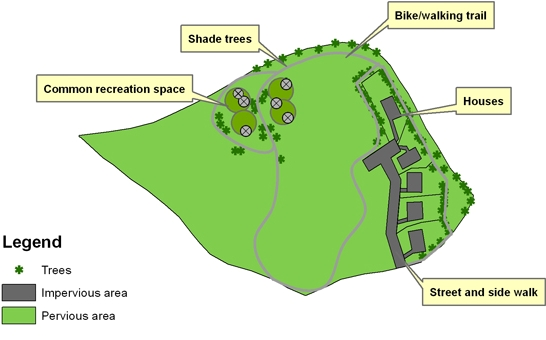
Guidelines for open space conservation design principles were adapted from Arendt (1996, 1999) to create LID plans [
11,
25]. The features of the design which distinguishes it from a conventional design are:
Narrower Streets: The American Society of Civil Engineers, in cooperation with the National Association of Home Builders and the Urban Land Institute, suggests street design to be based on the logical premise that street should be appropriate to its functions [
25]. Streets with 5.5–6 meters (18–20 feet) of paved width is enough for roads serving rural subdivisions with few homes [
11].
Smaller and compact lots: The lot sizes are reduced to that they fit inside the zone designated for building construction. Reducing lot size helps in preserving open space for common use, produces compact neighborhoods where neighbors can see and talk to each other more easily and more often.
Alternative to cul-de-sac: Instead of cul-de-sac design (as used in conventional design) which converts a large amount of space to impervious surface, alternate designs are often used. For example, the LID design for this study uses a simple “hammerhead “or “Turning T” to serve the five houses, as illustrated by [
11].
Reducing front setbacks: Because lots are smaller in size, front setbacks are reduced and houses can be closer to the access road. This helps to decrease length of driveway and increase backyard space. Reducing front yard length does not diminish the quality of design because backyards are used more often for family recreation than front yards, and hence need to be bigger.
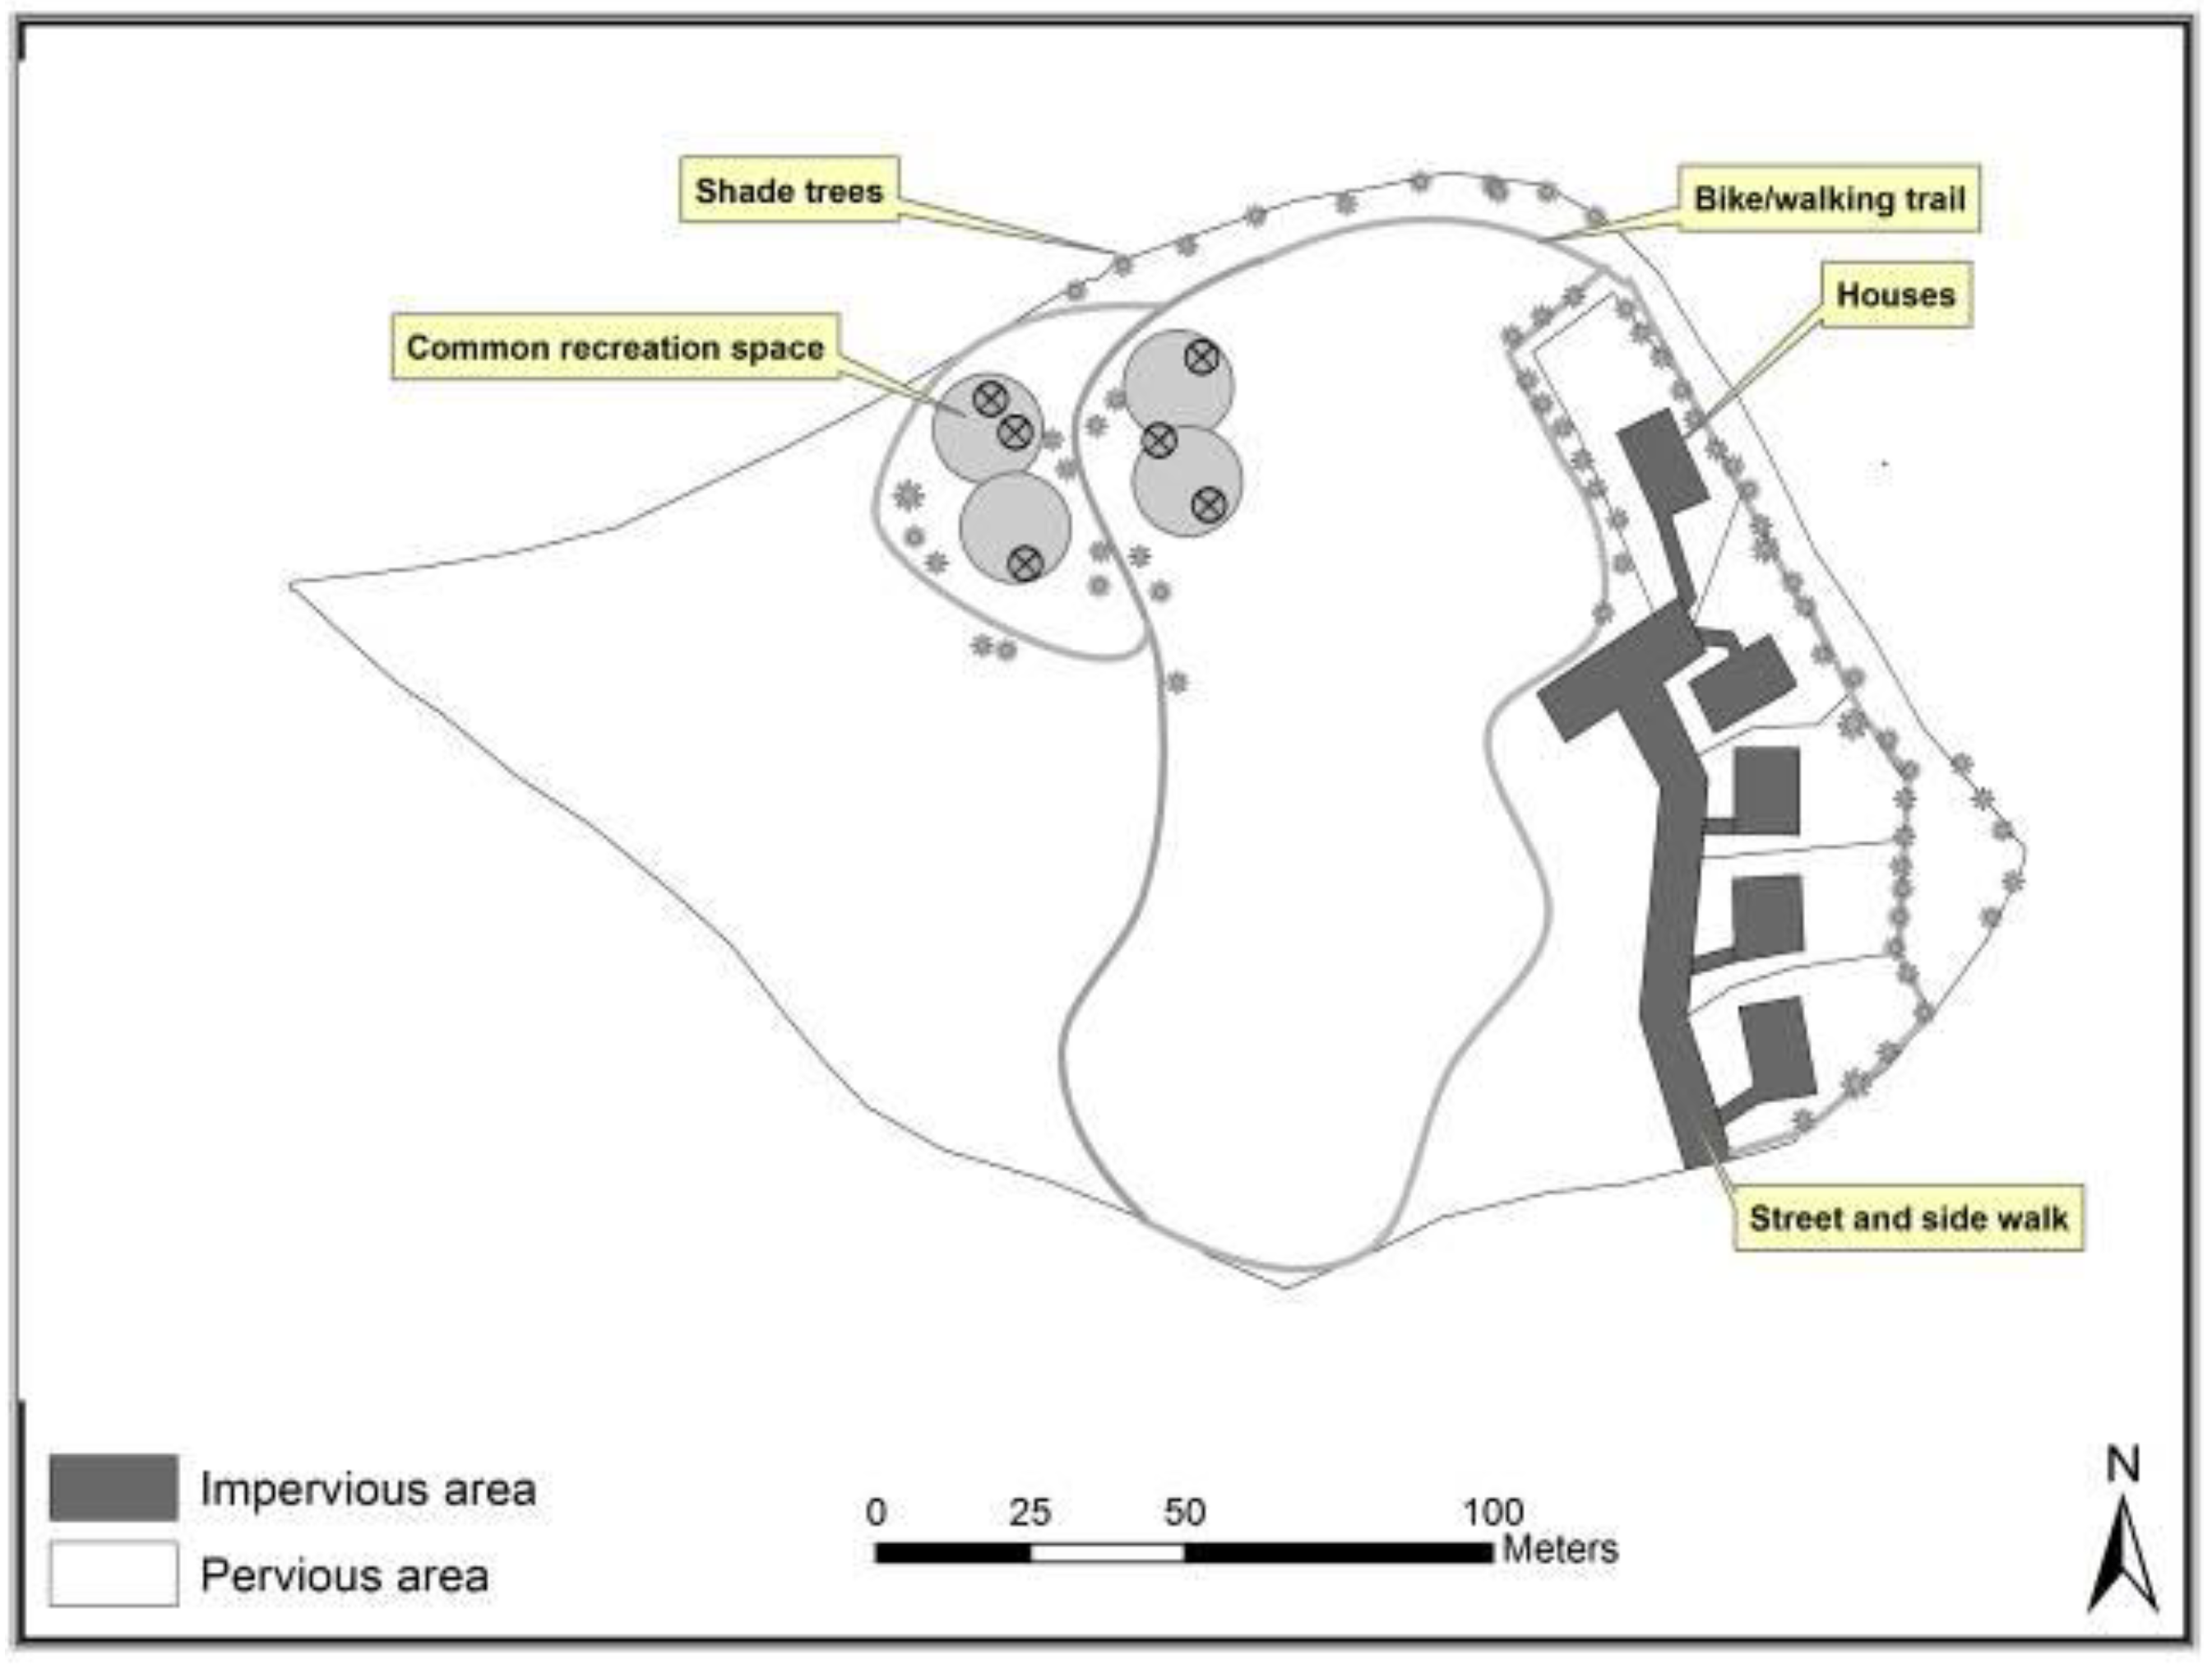
Bike trail /walk trail: Many people do in fact take advantage of opportunities to walk around the neighborhood when that choice exists [
26]. Hence, a walking/bilking trail is designed to link houses with the common space and to the access road. The trail can be enjoyed by everybody for a pleasant morning or evening walk around the neighborhood.
Common space: A part of the common space where the slopes are relatively flatter, is designed as a small picnic ground/park accessible from the homes via the walking/biking trail. This space can be used to organize activities or for just casual sitting and games.
2.4. Curve-Number Application
The NRCS curve-number method (CN) converts rainfall to runoff as a function of soil hydrologic group and land cover-type condition (
Table 2) [
15]. The pre-development land cover was assumed as “pasture in good hydrologic condition”. The pervious areas under the developed scenarios were treated as “grass cover greater than 50% and less than 75%”. Impervious surfaces (e.g., roads, roof tops, and driveways) were assigned a CN of 98.
Table 2.
Watershed curve numbers.
Table 2.
Watershed curve numbers.
| Land Cover | NRCS Cover Type and Hydrologic Condition [15] | A | B | C | D |
|---|
| Pre-development | Pasture Grassland or Range in good hydrologic condition | 39 | 61 | 74 | 80 |
| Pervious area of the development scenarios | Grass cover greater than 50% and less than 75% | 49 | 69 | 79 | 84 |
| Roof tops and driveways | Paved parking lots, roofs, driveways, etc. | 98 | 98 | 98 | 98 |
| Streets | Streets and roads: paved; curbs and storm drains | 98 | 98 | 98 | 98 |
Curve numbers from each land unit are then area-weighted to yield a composite curve number. 24 hour rainfall depths (P) corresponding to different recurrence intervals ranging from 2 to 25 years were used to generate runoff depth through the CN method. Briefly, runoff depth (Q) is computed using the CN Equation [
16]:
where S is the depth of potential maximum watershed retention of rainfall after the initiation of storm runoff. The relationship between S and CN was developed in the CN method as a convenience so that CN would range from 0 to 100 to correspond with larger CN for larger runoff potential:
The values for assigned S are then substituted into Equation 2 to yield a runoff depth. Equations 2 and 3 require that Q, P, and S have units of inches, but Q and P are afterwards converted to cm.
As is often assumed in hydrology, the runoff-depth frequency curve was assumed equal to that of rainfall depth. The magnitudes and frequencies of 24 hour rainfall used in Equation 2 were obtained from Huff and Angel and used in Equation 2 [
27]. Development designs for undeveloped, conventional development, and two LSA-LID scenarios were compared by using the runoff depths computed from Equation 2 for different precipitation frequencies.
4. Conclusions
In the present study we have applied a few facets of LID in a planning context especially as it relates to conservation design, minimize development impacts on sensitive or unique areas, maintain or improve on natural timing of water flows through the watershed. Regardless of the sizes of dwellings and imperviousness, a straightforward, comparative hydrologic analysis of low-impact development plans can be obtained from land-suitability analysis based on important watershed hydrological characteristics. The study supports our assertion that detailed site physiographic data can improve on conventional site-development practice. An order-1 soil survey was foundational in the identification of regions with high carrying capacity for runoff and drainage; this was accomplished without long-term pre-development monitoring of hydrology at the site. Yet, without actually implementing and monitoring such a development, our results stand as modeled approximations of what runoff response from the development plans. While a detailed survey may not be within the purview or budget of developers, we advocate its use in situations where soil variability is high and soil data quality is low; and the site has heterogeneity in slope. Cost information is limited to the experience of the primary author in commissioning NRCS to perform an order-1 survey on a 2 km2 area in suburban Cincinnati OH at a cost of (US) $12,000. Since indigenous knowledge of soils is generally limited to scientists and agricultural producers, and not passed on to or taken up by developers, an improvement of planning and development practice calls for some additional integrative research as a joint effort by the soils and planning communities.
While GIS based software can be used effectively to perform suitability analysis, use of decision support software like CommunityViz makes it easier to carry out the analysis and display results in visually attractive form with minimum effort. Since this software provides more dynamic, interactive and user friendly tools for analysis it has the potential to attract more users especially planners, developers and policy makers.
While economics of the LSA-LID were not investigated, the present study suggests some potential cost savings. The allocation of development features to parcels impacted least can be an important way to reduce the hydrological impacts of development without costly investment in structural controls (e.g., retention basins) that require large capital investment, commitment of larger tracts of land for their construction, and subsequent maintenance costs. Savings can also potentially be realized by reduction in stormwater infrastructure to convey water from the site. Furthermore, costs associated with compliance with water-quality regulations can be reduced because of the decrease in runoff and expected erosion. These costs are offset to some degree by potentially increased costs for detailed site characterization to quantify the inputs required by the land suitability analysis.
The present study is a promising example of how site factors can be incorporated into a simple development-planning tool. Other factors could be incorporated and other response variables evaluated such as peak runoff rate and water-quality constituents.

 ,
, 


