1. Background and Introduction
Over the past few years the U.S. government has been exploring how energy and environmental policies could help to meet present and future energy demands in a sustainable manner. An example is the American Clean Energy and Security Act of 2009, an energy bill that proposes a cap-and-trade mechanism as well as mandates for power generation from renewable energy sources [
1]. The available Federal funds could be invested in a broad variety of initiatives, ranging from immediate green building and energy efficiency improvements, to expansion of established sources such as nuclear and hydro, to development and commercialization of newer technologies such as fuel cells, distributed generation, waste to energy, solar, wind, geothermal, smart grids, and battery storage. The 2008–2009 economic recession increased the urgency of stimulating development, while the adoption of alternative energy portfolio standards in Ohio and other states, as well as the changing Federal regulatory landscape will place new constraints on conventional energy sources and greenhouse gas emissions. Moreover, growth in both traditional and alternative energy capacity will interact with many other factors that influence economic prosperity and quality of life including employment, productivity, disposable income, air and water quality, agriculture and bio-products, urban and regional land use, vehicle propulsion systems, public transportation and so forth.
In view of these complex and tightly connected systemic issues, policy makers need an integrated approach to energy policy and technology assessment, considering the full socioeconomic impacts of a specified energy portfolio. For example, comparative analysis of investments in biomass energy should consider the upstream supply chain resource requirements (e.g., corn or petroleum) and the alternative uses of those resources for chemicals, packaging, food, and other industry sectors, as well as potential future natural or anthropogenic disruptions in resource availability. In addition, the timing of investments needs to be considered, since it may be preferable to hedge against uncertainty by preserving future options. What is needed is a comprehensive planning approach that balances the direct costs and benefits as well as the life cycle impacts, opportunity costs, and social utilities of different energy mixes, in order to achieve the highest and best use of available resources. In short, integrated assessment capabilities are needed to fill the gap between promising innovation and successful real-world implementation, and to capture the complex, dynamic interactions among energy, environmental, social, and economic forces.
It should be noted that no mathematical model can provide accurate predictions of the future. Policy assessment needs to be an ongoing, adaptive process, supported by flexible tools that enable policy makers to investigate the potential costs, risks, and benefits of alternative policies. The System Dynamics (SD) methodology allows for an integrated evaluation of policy options relating to a variety of issues that arise in complex social, managerial, economic, and ecological systems [
2]. SD responds to the need for policy assessment methodology with a proven framework that can integrate empirical data, causal relationships, subjective judgments, and detailed rigorous mathematical models. The SD approach is particularly important when analyzing rapidly changing environments and innovative policy proposals, because there is little or no history from which to extrapolate. For instance, when projecting longer-term energy scenarios, using exogenous assumptions on population and economic development may lead to an inaccurate analysis [
3]. By including causality and feedback loops in the analytic framework, the SD-based model will provide deeper insights than are possible with parameter-based optimization and econometric frameworks. Furthermore, the inclusion of broader social, economic and environmental outcomes allows for a more comprehensive analysis of the policy implications, including unexpected side effects or bottlenecks.
The authors have created an SD model for analysis of waste policies and incorporated it into Threshold 21 (T21) [
4,
5,
6,
7], a national development planning model developed by the Millennium Institute, thus accounting for social, economic and environmental factors in one coherent, integrated framework. This results in an integrated policy assessment tool for sustainable development customized to the State of Ohio, which is called T21-Ohio. The T21-Ohio model is intended to help policy-makers who are grappling with the complexities of sustainable growth. Ohio’s future economic prosperity depends upon a complex network of interdependent factors, including energy systems, employment, transportation, urban design, education, recreation, public services, and environmental quality. Managing these factors will require policy coordination among diverse agencies at the State, county, and local level, and the interdependence makes it challenging to understand the key leverage points and underlying feedback loops. The T21-Ohio model provides a quantitative framework for projecting the outcomes of different policy scenarios (state revenue, industrial migration, quality of life, employment growth,
etc.) and developing a portfolio of mutually reinforcing policies.
We apply this model to investigate the broader impacts of waste management activities and sustainable energy generation such as recycling, electricity generation from waste, and bio-fuel production. T21-Ohio helps to address a variety of questions that inform policy making decisions. These questions include:
Is waste recycling an effective option to curb greenhouse gas emissions while yielding economic growth?
How might the conversion of industrial waste streams into by-products impact job creation and local/regional quality of life?
How does waste recycling compare with other clean energy supply options, such as ethanol production from biomass?
As discussed below, our approach exploits the strengths and avoids the weaknesses of existing models, while providing a uniquely customized, dynamic and integrated model that meets the requirements of the State of Ohio. The model is currently being utilized by the Ohio Department of Development and the Ohio Environmental Protection Agency to assess alternative climate policies.
2. Literature Review
A broad variety of models have been developed to support energy planning and policy analysis. These models are mostly based on optimization, econometrics, simulation, or system dynamics.
An optimization model consists of decision variables, constraints and an objective function [
8,
9]. The goal of the model is to find the best outcome (such as maximum profit or minimum cost) given a set of constraints represented as linear equations. Spengler
et al. [
10] develop an optimization model for the recycling of industrial by-products in the German steel industry. Giannikos [
11] presents a multi-objective optimization model for locating disposal facilities and transporting hazardous waste. Barros
et al. [
12] propose an optimization model for solving the problem of recycling construction wastes. Krikke
et al. [
13] develop a model for recycling copiers; they minimize total processing, transportation, and inventory costs in a reverse logistics network. Solano
et al. [
14] present an optimization based decision model that identifies environmentally and economically efficient strategies for integrated municipal solid waste management. Najm and E-Fadel [
15] utilize a mathematical formulation to optimize the flow of material through a variety of disposal processes, accounting for environmental and social costs associated with pollution.
Econometric models utilize statistical analysis of economic data to find correlations between specific selected variables [
16]. The quality and validity of model projections is highly dependent on the soundness of the theory used to define the structure of the model. DOE’s National Energy Modeling System is a computer-based, energy-economy modeling system of U.S. through 2030. NEMS projects the production, imports, conversion, consumption, and prices of energy, subject to assumptions about macroeconomic and financial factors, world energy markets, resource availability and costs, behavioral and technological choice criteria, cost and performance characteristics of energy technologies, and demographics.
Dalemo
et al. [
17] develop a simulation model for handling organic waste in urban areas, considering environmental effects, plant nutrient utilization, and energy turnover for large, complex systems. The model simulates different scenarios and evaluates emissions to air and water, energy turnover, and amount of residues returned to arable land. Fagan
et al. [
18] develop a simulation model to analyze material and energy flows in water systems. Another simulation model is developed by [
19] to predict and monitor E-waste recycling technologically, economically, and environmentally.
Although no integrated SD model can be found in the literature that investigates the broader implications of environment and sustainable energy policies, there are a few models with a narrower focus that are customized to different geographical areas. Some of these, relevant to our research, are briefly presented here. Sudhir
et al. [
20] employ an SD model to capture the dynamic nature of interactions among the various elements of urban solid waste management system in a typical metropolitan city in India. Karavezyris
et al. [
21] present a model of waste management systems based on SD that considers interactions between environmental behaviors, waste treatment costs, and quantities of collected, treated and recycled waste. Dyson
et al. [
22] also present an SD modeling approach for the prediction of solid waste generation by considering the factors such as total income, people per household, income per household, and population. Bantz
et al. [
23] describe the formulation of a SD model of the U.S. biodiesel marketplace. Beigl
et al. [
24] review previously published models of municipal solid waste generation and propose an implementation guideline. Su
et al. [
25] investigate how SD modeling can support the development of green supply-chain strategies.
In summary, while there are many different models based on optimization, econometrics, simulation, and system dynamics that are available for environmental and economic decision making, most of these models either consider the economic costs or ecological impacts of waste recycling and reuse, but not both. Also, they are generally too complex for a non-technical end user to understand or use in a decision making process. Furthermore, those models that are sufficiently robust to capture the economic-ecological trade-offs are customized to a given situation and are not easily generalized. In conclusion, the models described in the literature are not adequate for addressing the broad and diverse nature of energy planning and policy analysis.
3. T21-Ohio Model
T21-Ohio is a quantitative tool for integrated, comprehensive policy evaluation, designed to support the broad process of medium- to long-term development planning. T21-Ohio aims to deepen the understanding of the key structural relations between waste management, sustainable energy planning, and broader economic and social development. T21-Ohio can provide insights into the potential impact of sustainable energy and environmental policies across a wide range of sectors and can reveal how different strategies interact with one another to achieve planned goals and objectives.
T21-Ohio is a customized version of the T21 model framework, specifically adapted to support policy assessment in the State of Ohio, and enhanced by adding, among others, modules related to waste management and sustainable energy planning. As in T21, T21-Ohio consists of three main spheres—economy, society, and environment—built upon eighteen modules (see
Table 1). A more detailed description of the T21 framework is available in [
4,
5,
6,
7].
Table 1.
T21-Ohio main and sub-sectors.
Table 1.
T21-Ohio main and sub-sectors.
| | Main Sectors |
|---|
| | Economy | Society | Environment |
|---|
| Sub-Sectors | Production | Labor | Energy |
| Investment | Population | Land |
| Technology | Health | Waste Generation |
| Banks | Education | Waste Products |
| Government | Poverty | By-Product Synergy |
| Households | Infrastructure | Emissions |
The
Economy sphere of the model contains major production sectors; agriculture, mining, industry, services, waste management services, and government. These are characterized by Cobb-Douglas production functions [
26] with inputs of labor, capital, technology and total factor productivity (natural resources, energy prices, and more). A social accounting matrix [
27] is used to model the economic flows across the main sectors of the economy. Government accounts track revenues (e.g., from taxation) and functional expenditures. Public expenditure impacts overall economic performance and the delivery of public services, including waste collection and recycling. Standard IMF budget categories are employed and key macro balances are incorporated into the model for both government and household accounts. The “rest of the world” sub-sector comprises trade, current account transactions, and capital flows including debt management [
28].
The
Society sphere contains detailed population dynamics by sex and age cohort, including health and education, employment, and income distribution. These sectors take into account, for example, the interactions of income, healthcare and adult literacy rates on fertility and life expectancy, which in turn determine population growth. Population determines the labor force, which shapes employment together with economic capital (infrastructure). Education and health influence labor productivity. Employment and labor productivity affect the level of production from a given capital stock [
29].
The Environment sphere tracks fossil fuel emissions and their impacts on health, and eventually on production. It also estimates the consumption of natural resources, both renewable and non-renewable, and the effects of environmental degradation such as soil erosion on other sectors, including agricultural productivity and nutrition. Key variables in the environment sphere are energy and water demand and supply, forest depletion, land allocation and greenhouse gas emissions.
Rather than seeking an “optimal” solution, T21-Ohio is a flexible simulation tool that helps to explore both graphically and quantitatively the direct and indirect effects of different policy options. It encourages a systemic view rather than narrow, piecemeal analysis, thus revealing the potential hidden or unintended consequences of policy decisions. The tool is readily customizable and can easily be coupled with existing data sources and tools that provide finer resolution for specific components (e.g., energy supply) of the overall model. T21-Ohio was designed to be used in an exploratory fashion, so that the user can test different assumptions, compare different policy scenarios, and evaluate the implications for a variety of performance indicators. Each simulation run produces graphical outputs showing the projected changes over time for selected model variables.
4. Waste Reduction for Sustainable Development
The U.S. Environmental Protection Agency (EPA) defines recycling as a series of activities that include collecting materials that would otherwise be considered waste, sorting and processing them into raw materials, and converting the raw materials into new products or energy [
29]. Waste recycling results in decreased air pollution and greenhouse gas emissions (GHG) from waste incineration, reduced hazardous waste leaching from landfills, reduced industrial energy consumption, and a reduction in environmentally damaging resource extraction such as mining and logging [
30]. Furthermore, the utilization of biomass resources made available through converted waste, a clean and renewable energy source, could reduce airborne emissions and greenhouse gases that result from fossil fuel consumption in thermal generation plants [
31].
A highly efficient approach to waste recycling is converting wastes into byproducts, known as by-product synergy (BPS). BPS usually involves a number of industrial firms that collaborate to convert wastes into useful energy and materials rather than operating as isolated entities. In order to facilitate an exchange of materials and resources, businesses need to work together to determine what unwanted by-products exist, and what their potential applications are. The resources can then be exchanged, sold, or transferred free of charge between sites by establishment of synergistic collaborations. BPS activities result in reduced waste and GHG generation, along with economic benefits through avoided costs for purchasing virgin materials and disposing waste, as well as creation of jobs [
32].
Many companies have discovered the economic value of waste recovery and recycling, and some have formed BPS networks. One example is Dow Chemical, which launched a BPS project in partnership with the U.S. Business Council for Sustainable Development (USBCSD) in 2003 [
33]. Applying BPS principles among Dow production facilities yielded annual savings of about $15 million annually, through reductions in fuel consumption (approximately 900,000 MMBtu), waste creation (as much as 155 million pounds) and generation of CO
2 emissions (about 108 million pounds). State governments have also taken similar actions; for example, Oregon House Bill 2626 [
34] creates and finances a statewide collection, transportation and recycling system for electronic devices including televisions, desktop and portable computers, and computer monitors [
35], so far yielding a reduction of about 20 million pounds of CO
2 emissions. The State of Ohio has implemented several waste reduction initiatives since the year 2000. For example, The Ohio Bureau of Workers Compensation implemented a paperless medical claim imaging system, saving $483,000 in expenses, nearly 22 tons pounds of office paper and file folders, and 2,500 pounds in toner cartridges. The Ohio Department of Transportation’s reused 50 tons of old asphalt in new road construction in the year 2000.The recycled-content asphalt costs just $2.25 per ton, far less than the $28 a ton paid for “virgin” asphalt. In 2010, the Ohio Department of Natural Resources supported the establishment of the Ohio BPS Network, a project of the USBCSD that brings together a variety of companies from across the state.
5. Modeling Waste Reduction Policies
The original contribution of this study is to develop an integrated approach to waste reuse and recycling policy analysis. A set of key variables are introduced into T21-Ohio representing the domain of investigation; namely waste recovery. These variables include waste sources, uses, capital, production, and employment.
Generally, in T21-Ohio recycled commodities are assumed to be cheaper than virgin ones, due to lower production and transport costs, among others [
24]. Further, recycling is linked to water and air pollution in the model, taking into account, among others, the energy and carbon intensity of the recycling process. Similarly, energy production from waste is assumed to result in lower energy prices [
36]. Lower energy and commodity prices have a positive impact on production (or gross state product, GSP), increasing total factor productivity. Increasing production triggers an additional positive feedback loop: recycling waste creates jobs in plant operations and capital asset production. In fact, waste recycling could become an additional industry sector that stimulates economic development by increasing regional competitiveness. As a result of higher economic activity in the state/region, government revenues as well as disposable income would increase, further reinforcing the positive feedback loop triggered by investments in waste recycling, and creating new indirect jobs.
Technology plays an important role in the system represented by the T21-Ohio model. Increased waste production would generate higher margins (e.g., because of scale effects), thus increasing the return on investment in new technologies (e.g., advanced recycling, bio-fuels, bio-products, alternative energy sources). The adoption of more efficient technology increases the total factor productivity of the economy by reducing the cost of the industrial activity (i.e., making it more efficient).
In the T21-Ohio model, the waste sector consists of four sub-sectors: waste sources and uses, agricultural bio-products, by-product recovery, and policies.
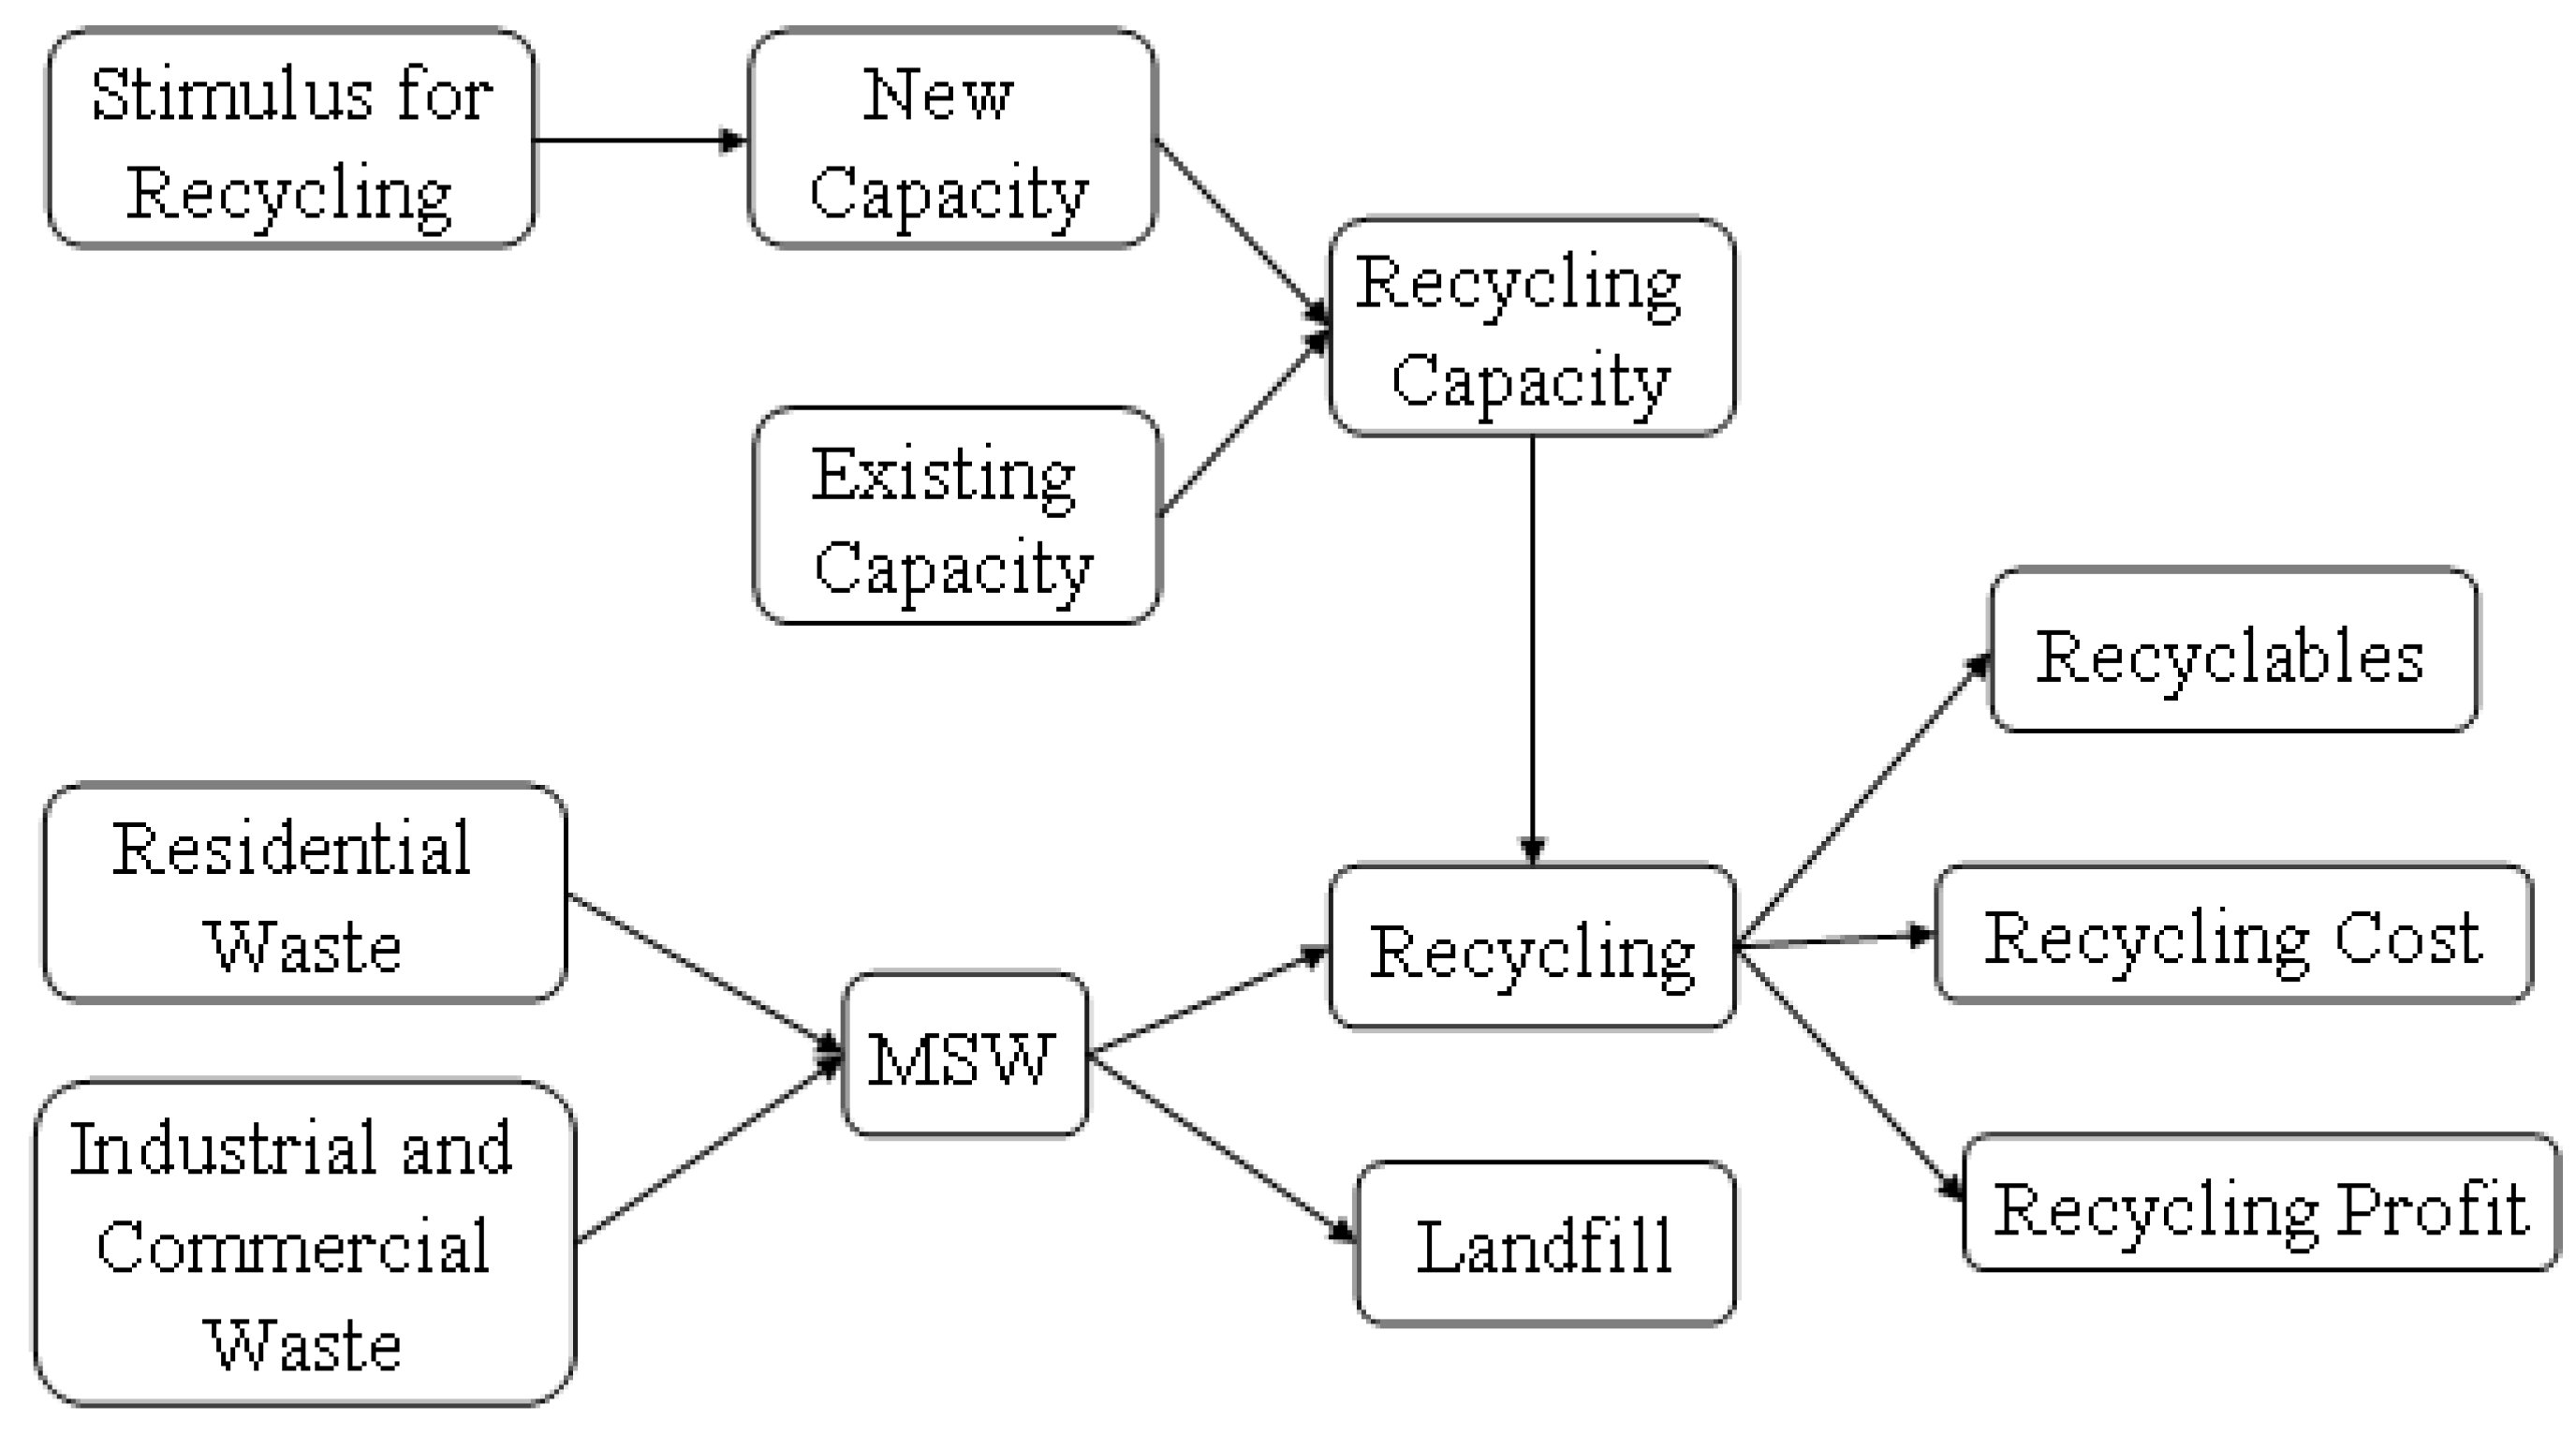
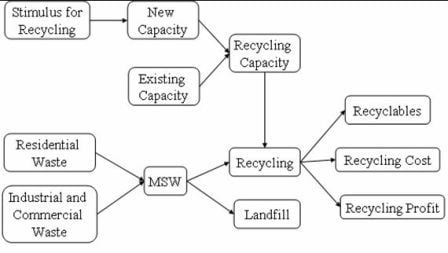
The waste uses sector models waste generation, conversion of waste into recyclables, production of bio-fuels, bio-products, natural gas, and electricity from waste, and waste storage (landfill). In T21-Ohio, waste generation is disaggregated into residential, industrial, commercial, agriculture and forestry. While endogenous population values are used to estimate residential waste, sectoral GSP is employed to calculate industrial and commercial waste. Agriculture and forest land, as well as production from these sectors, affect the amount of agriculture and forestry waste.
In this sector, residential waste is considered to be municipal solid waste (MSW), industrial and commercial wastes are divided into MSW and the waste used in BPS applications, and agriculture and forestry wastes are defined as organic waste. Non-used waste volumes are accumulated into the stock of landfill. Recyclables are separated from total waste generation by selected recycling processes in the model (see
Figure 1).
Figure 1.
Recycling activity in the waste uses sector.
Figure 1.
Recycling activity in the waste uses sector.
Concerning production capacity for waste processes, the model simulates investment decisions from both the private and public sector, stemming from the household and government accounts. In the recycling process, we represent two types of recycling capacity: existing and new. The existing recycling capacity is the current capacity of waste recycling plants. For each time period,
t, let
ERC(t) be the existing recycling capacity at time
t. Let
NRC(t) be the new recycling capacity for time period
t, driven by specific investments. Let
GOVS(t) be the government stimulus for recycling at time
t and
PSINV(t) be the private sector investment for recycling at time
t. The new capacity is calculated by multiplying total investment by the output/capital ratio (e.g., gallon of biofuel per dollar invested). Define
IER to be the investment effect on recycling capacity and
SER to be the stimulus effect on recycling capacity. Therefore, the recycling capacity generated by government expenditure for time period
t is
GOVS(t) ×
SER. Similarly, the private sector investment generates the recycling capacity for time period
t which is
PSINV(t) ×
IER. Then, the new recycling capacity for each time period
t is formulated as
The existing and the new recycling capacities give the total recycling capacity. Therefore,
TRC(t) is the total recycling capacity for time period
t, where
Recyclables are separated from usable waste by considering available recycling capacity, and inputs to landfill are non-used waste in recycling, non-used MSW, and non-used organic waste. Waste in landfill is then used to calculate electricity and natural gas generation. In fact, large municipal or industrial landfills produce gas that can be utilized to generate electricity. Microorganisms that live in organic materials such as food wastes, paper or yard clippings cause these materials to decompose, thus producing landfill gas (typically comprised of roughly 60% methane and 40% carbon dioxide). Landfill gas is collected from landfills by drilling “wells” into the landfills, and collecting the gases through pipes. Once the landfill gas is processed, it can be combined with natural gas to fuel conventional combustion turbines, or used to fuel small combustion or combined cycle turbines. Landfill gas may also be used in fuel cell technologies, in which chemical reactions generate electricity more efficiently than combustion turbines. The production capacity for electricity generation and natural gas production are determined in the model similarly to recycling capacity (capital accumulation driven by investments and discard) by considering both private and public investments.
Biomass in MSW and organic waste is used to generate electricity, and to produce bio-products and bio-fuels in the model. Electricity is generated from biomass in two ways: direct combustion power plants and biomass gasification. There are two types of direct combustion alternatives in the model: cofiring biomass in existing coal power plants, and new direct combustion biomass power plants. In the model, whenever biomass is available it is assumed to replace coal use for electricity generation. Direct combustion thermal power plants burn the biomass fuel directly in boilers that supply steam for the same kind of steam-electric generators used to burn fossil fuels.
With biomass gasification, biomass is converted into a gas, methane, which can then fuel steam generators, combustion turbines, combined cycle technologies or fuel cells. The primary benefit of biomass gasification, compared to direct combustion, is that extracted gasses can be used in a variety of power plant configurations. In T21-Ohio, bio-fuel production from crops is endogenously modeled, with only the share of crops used for bio-fuel production being an exogenous input. By considering the available capacity for production, the annual amount of crops produced, and the fraction allocated to energy, bio-fuel production is determined. The bio-fuel generated is assumed to be a perfect substitute for sectoral bio-diesel and ethanol consumption.
The waste policy sector analyzes the impacts of capital expenditure policies of both the government and private sectors. For example, governments may allocate funds to construct new waste-related plants or to provide subsidies for existing players in the market. Since T21-Ohio is used to analyze “waste to profit” decisions, we keep government waste expenditure separate from the other budgetary expenditures. Further, in T21-Ohio government expenditure has a direct effect on the economy of the State through the representation of a system of national accounts (SNA) [
37]. Investments by Government and the private sector are accumulated in the stock of capital, one of the main factors of production for the economy. A second factor of production is employment (endogenously modeled in T21-Ohio), which is also directly influenced by capital [
28].
6. The State Of Ohio Application
We apply T21-Ohio to analyze the broader social, economic and environmental impacts of waste to profit activities such as recycling, electricity generation from waste, and bio-fuel production in the State of Ohio. This innovative investigation has few precedents.
The most relevant study in the literature that analyzes key economic and environmental indicators with respect to energy policy issues in Ohio is by Shakya [
38]. The study develops and uses a dynamic linear programming model based on the MARKAL family of models, the OH-MARKAL, to evaluate biomass co-firing as a feasible upgrade option—substituting coal use for power generation with biomass feedstock—for selected coal power plants (both existing and new) to generate commercial electricity in Ohio. The results of the study indicate that biomass co-firing in selected coal-fired power plants and new biomass plants could reach about 7.44% of electricity generation from renewable sources in Ohio, or 2.7 million kwh per year, reducing emissions by 6% in 2029, or about 152 million tons.
A few weaknesses in the design and use of the OH-MARKAL model should be considered when analyzing its results. First, the model does not account for sectoral links between environment, society and economy. Because population growth and GDP, among others, are exogenous to OH-MARKAL, neither the societal and economic impacts of waste generation nor the consequences of waste recycling ramp-up on employment, government and households accounts can be analyzed with the model. Second, since OH-MARKAL only analyzes the biomass co-firing option, other green energy alternatives such as bio-fuel and bio-product production from crops and electricity generation from waste are not considered. Third, non-linear relations may exist in waste management and electricity generation, but they are not accounted for in the model. Finally, technology costs, energy demand, and prices are exogenous to the model, which is largely driven by assumptions.
Scenarios
In the State of Ohio application, we use the T21-Ohio model to compare the base case scenario, which assumes a continuation of policies currently in place, with three alternative scenarios—biomass co-firing, government stimulus for solid waste recycling, and by-synergy activities. In each alternative scenario, we consider different capital investment options, and then compare them with the base case. The focus of the analysis is on variables such as waste to landfill, amount of recyclables produced, GHG emissions generated, number of jobs created, and GSP. The outputs of these major variables for the years 1992–2008 in the base case scenario are compared with historical data to calibrate the T21-Ohio model. The model is initiated in 1992 and its equations (representing causal relations) in combination with exogenous inputs (e.g., elasticities, estimated based on econometrics) are calibrated to coherently reproduce historical trends. The strength of this approach lies in its dynamic complexity; the feedback loops within and across sectors create dynamic and integrated projections in which various components interact to produce the results presented in this study.
Base Case Scenario
The base case scenario assumes the continuation of policies currently in place and simulates future projections from 2008 to 2025. The actual simulation of the system starts in 1992, which contributes to testing the validity of the model against 16 years of history. Since at present there are 21 commercial coal-based power plants in Ohio, with an annual generation capacity of 21,000 MW of electricity, and no cofiring, we assume no expansion of the latter in the baseline scenario. Also, we assume that there is no government stimulus for waste management, especially for solid waste recycling. Results of the baseline simulation are presented for population, economic development, energy, and waste management.
As of 2008, the state’s population was estimated at 11,485,910 by the United States Census Bureau. Ohio’s population grew at rates of over 10% per decade until the census of 1970, which recorded just over 10.65 million Ohioans. Growth then slowed for the next three decades, and approximately 11.35 million people resided in Ohio in 2000. As of 2007, 6.5% of Ohio’s population is under 5 years of age, compared to a national average of 6.9%, and 13.4% of Ohio’s population is over 65 years of age, compared to a national average of 12.6%. Females comprise 51.3% of Ohio’s population, compared to a national average of 50.8% [
39]. The base case scenario projects the Ohio’s Population to reach 11.78 million in 2025.
As of 2007, Ohio’s GSP was $466 billion. This ranks Ohio’s economy as the seventh-largest of all fifty US states. However, as of January 2009, Ohio’s unemployment rate stood at 8.8%, compared to a national average of 7.6%. Ohio’s per capita income stood at $34,874, while Ohio’s median household income was $46,645, with 13.1% of the population living below the poverty line [
40]. In 2025, the base case scenario projects Ohio’s GSP at $637.30 billion with a 2.22% average growth rate and unemployment rate of 3.54%. Concerning sectoral activities, the manufacturing and financial sectors dominate the Ohio economy, each representing about 18.3% of Ohio’s GSP. Ohio’s manufacturing sector is the third-largest of all fifty United States in terms of gross domestic product [
41].
Ohio, with its $13 billion electric utility industry, is the third largest generator of electricity in the U.S. after Texas and California [
42]. The electric utility industry has an enormous impact on the well being of Ohio’s economy, providing electricity to over 4.6 million customers, or about 90% of Ohio’s electric users. The industry employs more than 20,000 people and operates about 253 power plants and facilities in Ohio, paying over $967 million in state and local taxes each year [
38]. Over 86% of electricity used in Ohio comes from coal-fired power plants, causing Ohio to have the second highest emissions of carbon dioxide from electricity generation in the US. In addition, 70% of the coal burned in Ohio’s power plants is imported from other states. Among biofuels, bio-diesel is mostly produced from soy beans in Ohio. In 2008, about 3,980,000 acres of soybeans were harvested and 161 million bushels were produced, while 3,780,000 acres of corn were harvested and 540 million bushels corn were produced. It is estimated that 66% of total soybeans and 55% of total corn in Ohio was used to produce soy bio-diesel and ethanol in 2009 [
41]. Three plants produce 35 million gallons of soy bio-diesel. Also, Ohio has six ethanol production facilities with a total of 360 million gallons (30.384 trillion btu) capacity [
43]. In 2025, the base scenario projects Ohio’s electricity demand at 547,330 kwh. Also, the average yearly growth rate of electricity demand is 0.95%. About 93% of total electricity demand (508,829 kwh) is generated by fossil fuels in 2025.
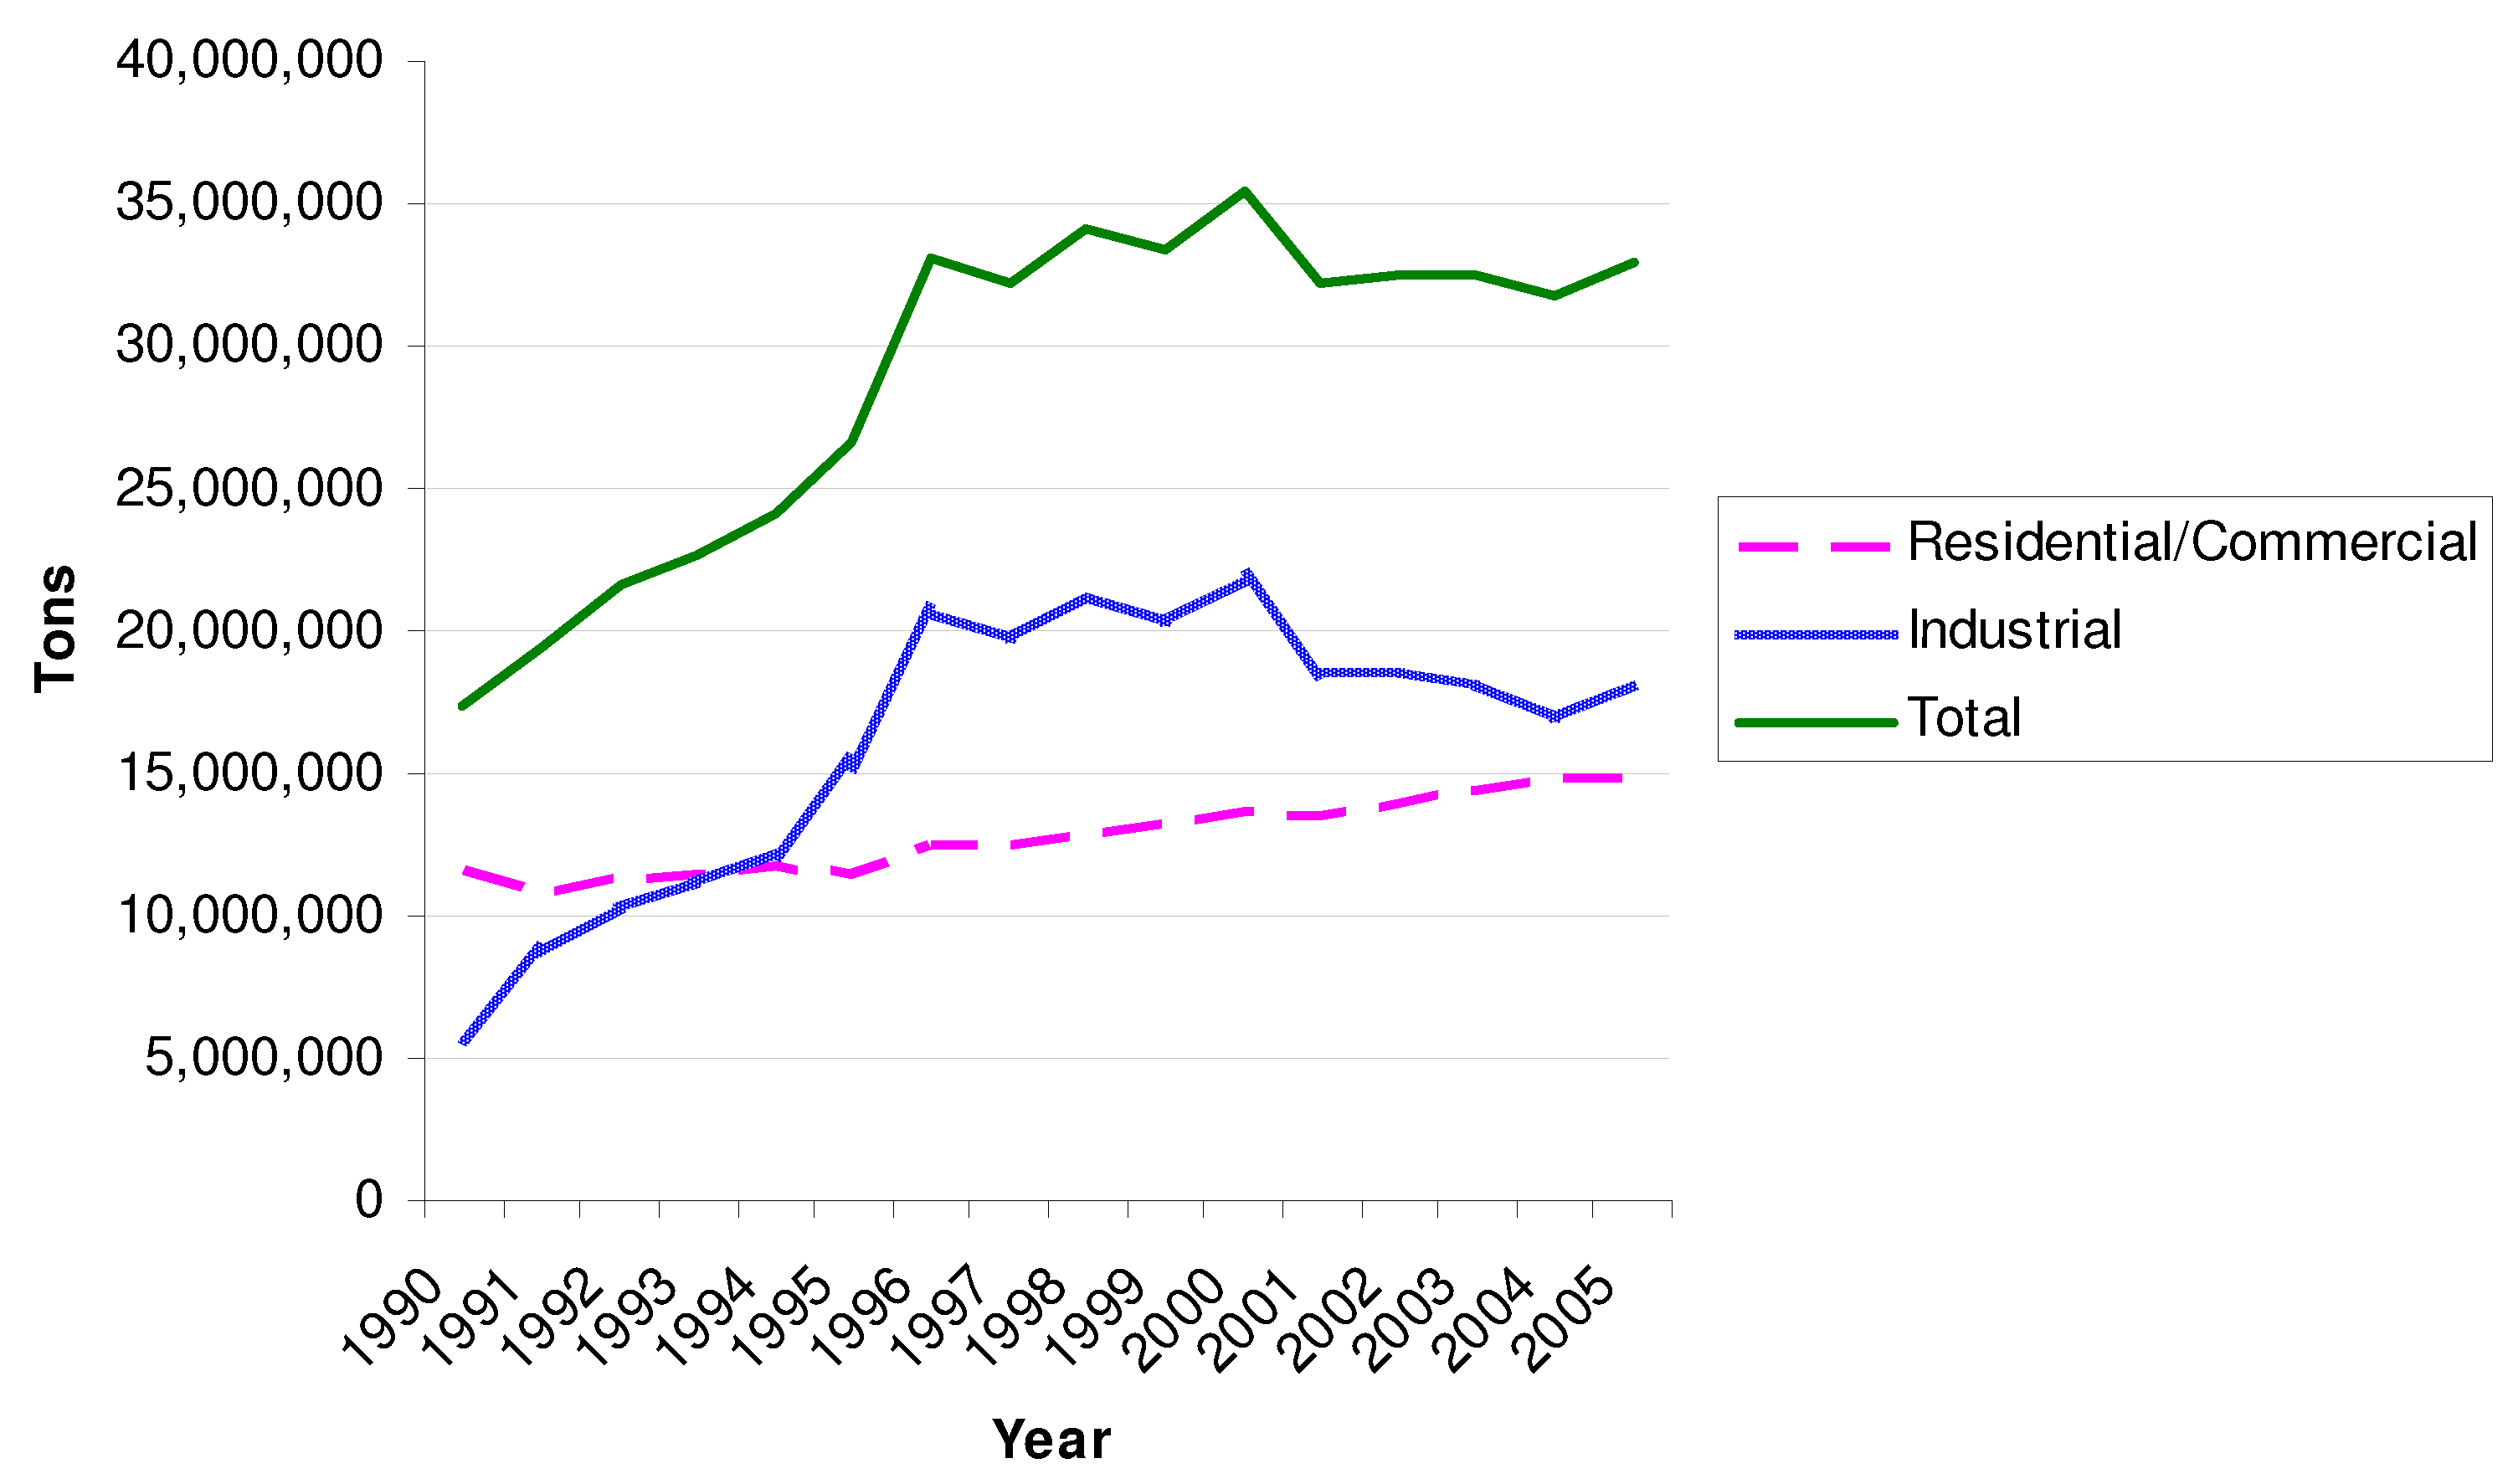
In 2007, Ohioans generated almost 33.7 million tons of solid waste. Broken down by sector, Ohioans generated approximately 14.7 million tons of residential/commercial solid waste. Ohio’s industrial sector generated solid wastes totaling more than 16.9 million tons [
44].
Figure 2 shows the solid waste generation in the state of Ohio between the years 1990 and 2005. The base case scenario projects a total of 27.21 million tons of industrial waste and 21.45 million tons of residential waste generated in 2025. Ohio currently does not have operating solid waste incinerators that burn mixed MSW. As a consequence, Ohio relies almost exclusively on landfill facilities for disposing of solid waste. At the end of 2007, Ohio had 42 operating MSW landfill facilities with available capacity of 591,652,964 cubic yards [
45]. Also, Ohio’s solid waste disposal rates are strongly affected by the presence of three large coal-burning power plants in the state. These power plants dispose of significant quantities of waste, largely combustion by-products (in 2007 alone about 20 million tons of solid waste was disposed by these plants).
Table 2 presents data regarding waste recycling in Ohio for the years 2001
–2007. In 2025, the base case scenario projects that a total of 12.16 million tons of waste will be recycled.
Table 2.
Solid waste recycling for Ohio (tons).
Table 2.
Solid waste recycling for Ohio (tons).
| Year | Residential/Commercial | Industrial | Total |
|---|
| 2001 | 2,979,310 | 10,564,515 | 13,543,825 |
| 2002 | 3,015,265 | 10,775,708 | 13,790,973 |
| 2003 | 3,124,507 | 9,917,779 | 13,042,286 |
| 2004 | 3,386,355 | 8,775,726 | 12,162,081 |
| 2005 | 3,745,758 | 9,474,260 | 13,220,018 |
| 2006 | 3,518,289 | 9,501,987 | 13,020,276 |
| 2007
| 3,817,366 | 9,085,475 | 12,902,480 |
Figure 2.
Ohio waste generation (tons/year).
Figure 2.
Ohio waste generation (tons/year).
Alternative Scenario 1: Biomass Cofiring
While more than 50% of U.S. electricity is generated by burning coal, Ohio’s reliance on this carbon intensive fuel approaches 90%. Using renewable energy, such as biomass, to produce electricity would presumably reduce the impact on the environment and human health, while also providing a more diversified power supply portfolio that could contribute to Ohio’s rural economy. In this scenario we simulate the biomass cofiring option in conventional coal-fired power plants.
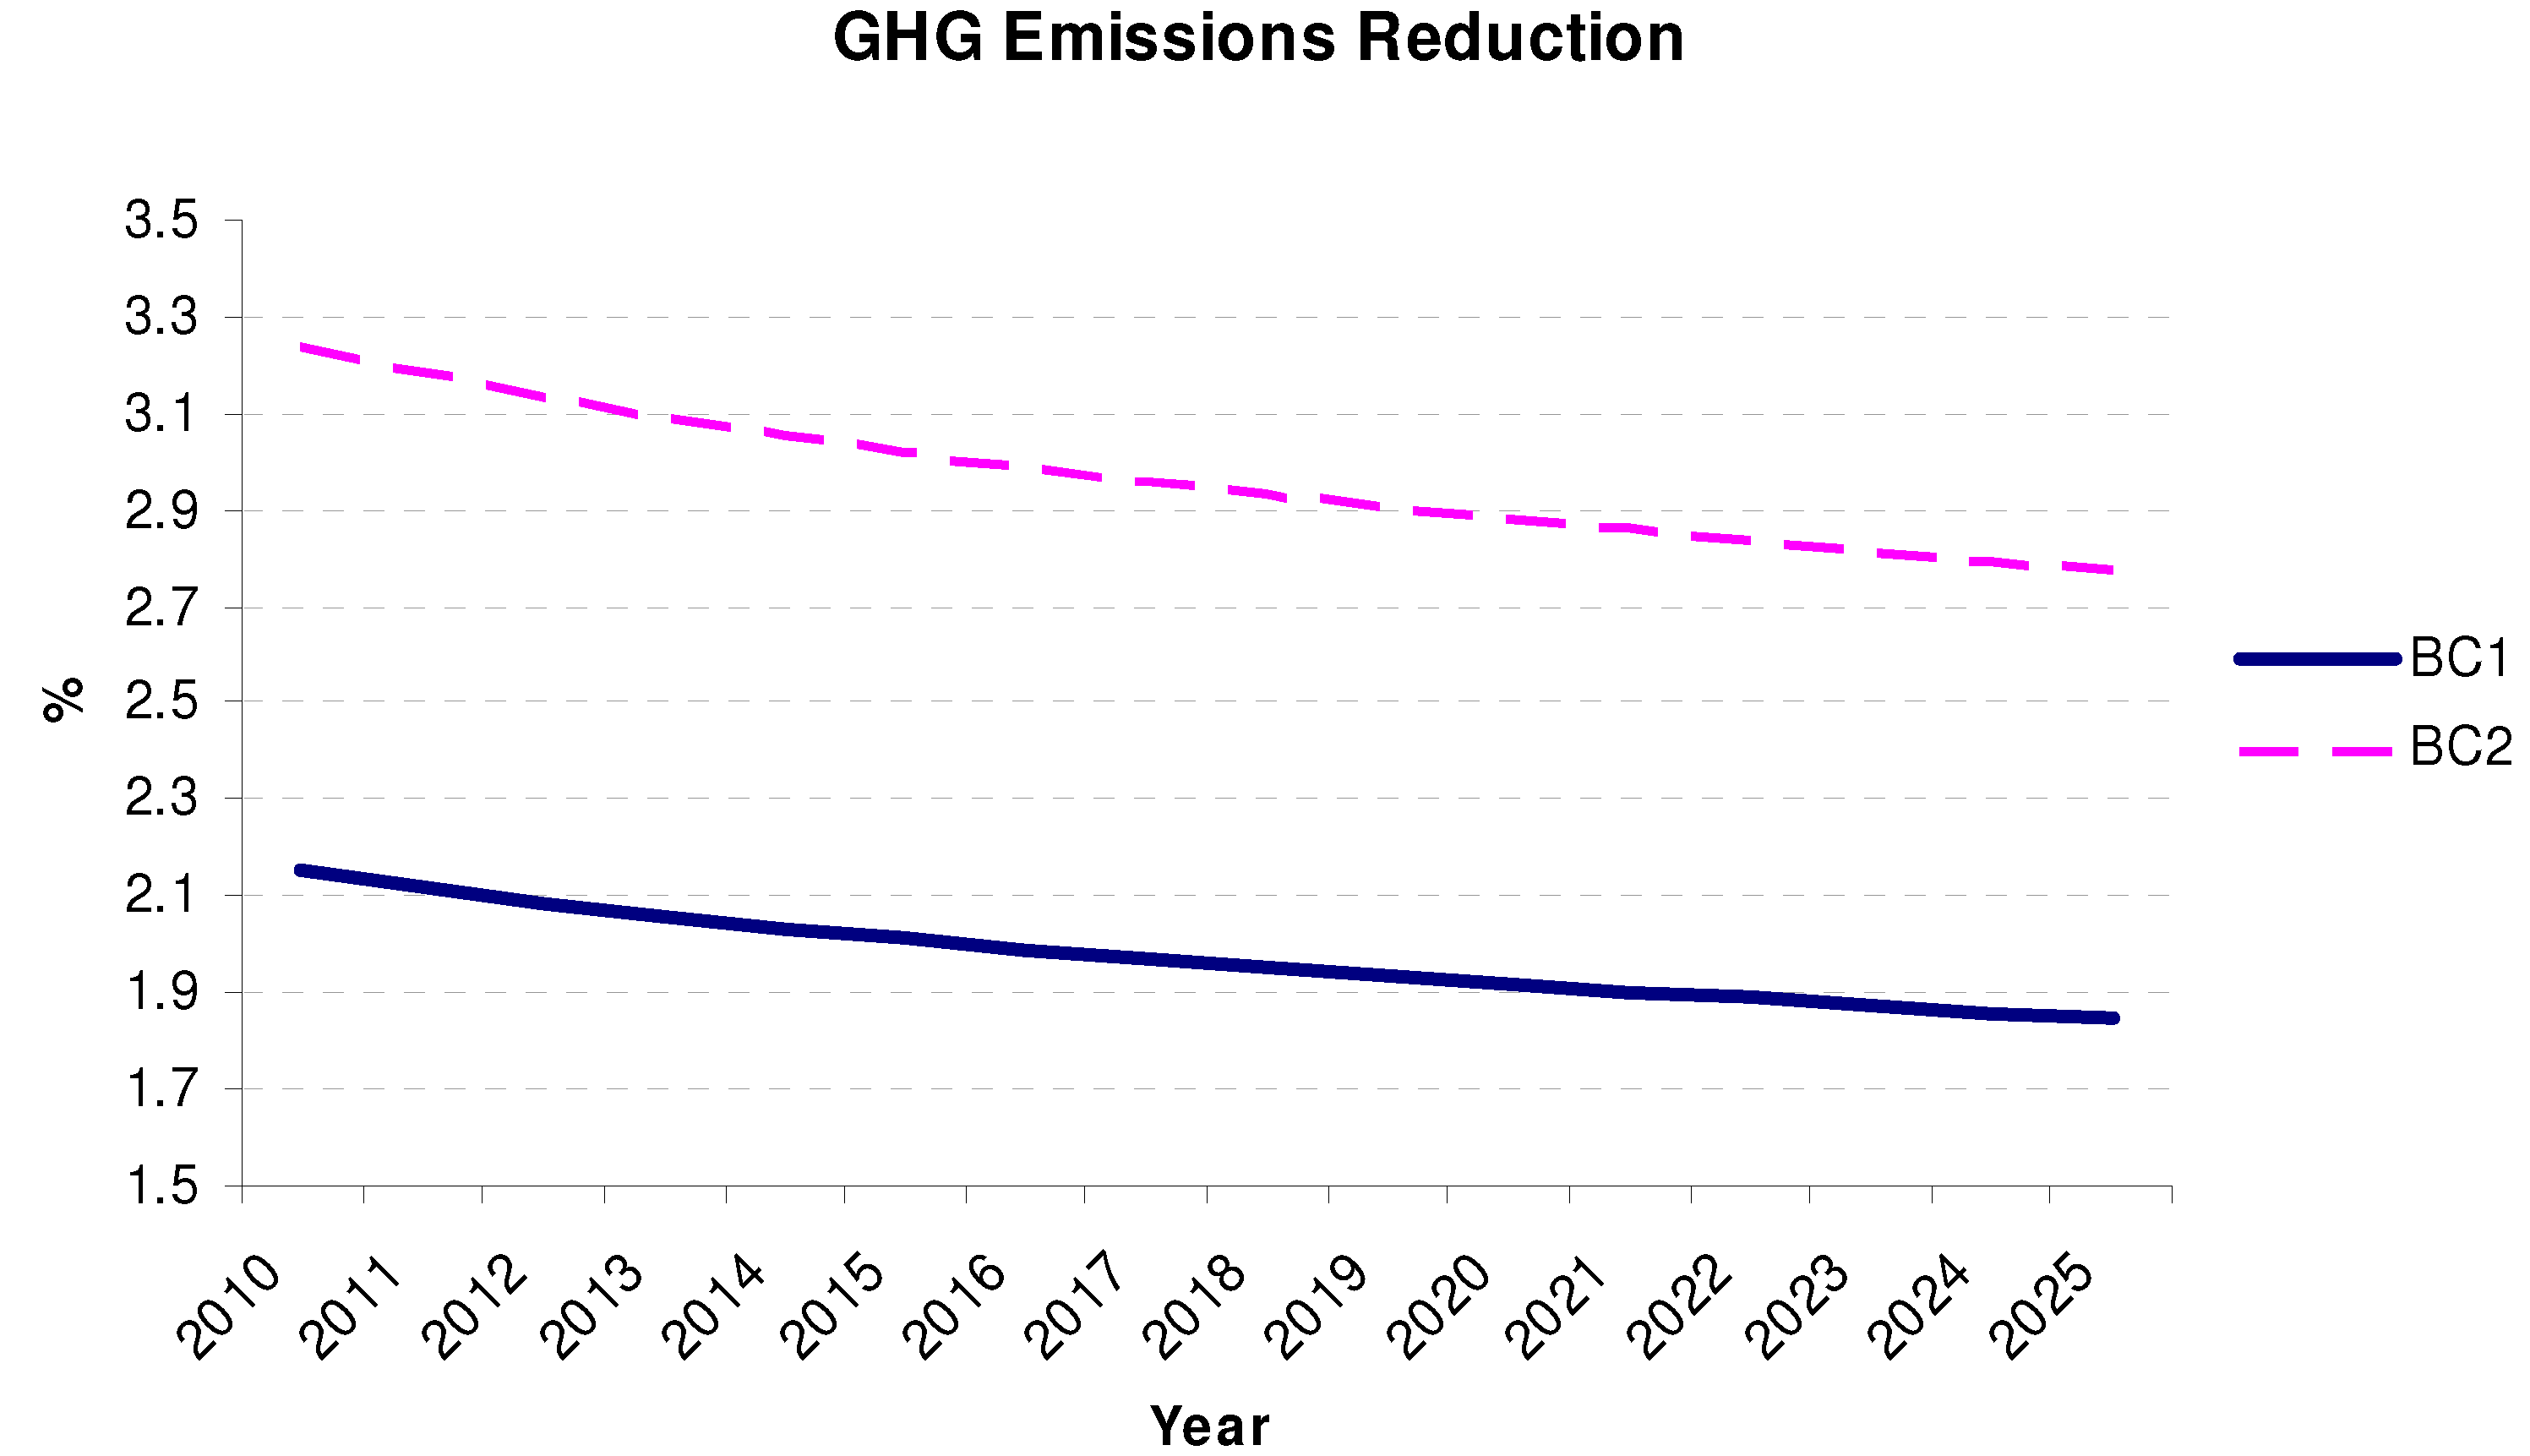
Two plans (or targets) are set: 10% and 15% penetration of biomass cofiring by 2025 (BC1 and BC2). In plan BC1, an average of 3.1 million kwh of electricity per year would be generated by using biomass. The amount of electricity generated in BC2 averages to 4.55 million kwh per year. Also, an average 3,500 tons of biomass in BC1 and 5,800 tons of biomass in BC2 are diverted from landfill and replace coal each year.
Figure 3 shows the projected GHG reduction achieved in these scenarios between 2010 and 2025. Due to the reduction in coal use under both scenarios, the total GHG emissions are correspondingly reduced by an average of 2% in BC1 and 3% in BC2 as compared with the base case scenario in each year. Also, the emission reductions in the power sector average 7% in BC1 and 9% in BC2 as compared with the base case scenario in each year.
Figure 3.
GHG reductions for BC1 and BC2.
Figure 3.
GHG reductions for BC1 and BC2.
By 2025, BC1 and BC2 create a total of 537 and 806 new jobs (cumulative), respectively, also having a net positive impact on the state economy.
Alternative Scenario 2: Stimulus for Solid Waste Recycling
The second alternative scenario investigates the effect of government stimulus plans for solid waste recycling in Ohio between 2010 and 2025. This allocation of funds could be used to increase the capacity of existing solid waste processing plants, to build new plants, and to increase public awareness about the advantages of recycling. We consider two options (see
Table 3): the GS1 case, in which the government would provide 100 million dollars to increase solid waste recycling in Ohio starting from 2010; and the GS2 case, in which the amount of funds disbursed would be 200 million dollars. In both scenarios we assume that it takes two years for these funds to translate into installed capital.
Table 3.
Stimulus plans.
| GS1 | | | |
|---|
| Years | 2010 | 2015 | 2018 |
| Stimulus (million $) | 60 | 20 | 20 |
| GS2 | | | |
| Years | 2010 | 2015 | 2018 |
| Stimulus (million $) | 120 | 40 | 40 |
In GS1, an average of 1,738,183 tons of solid waste is diverted from landfill annually between 2010 and 2025. As a consequence, landfill GHG emissions are reduced by an average of 663,986 tons per year (or 1.8%). In GS2, an average 1,753,920 tons of solid waste is diverted from landfill each year. Thus, the annual average reduction of GHG emission from landfill is 669,998 tons.
Higher waste production results in higher GSP in Ohio. GSP grows above the base case by an average 0.49% and 0.52% in GS1 and GS2 respectively each year throughout the simulation. Higher production generates revenues for the state of Ohio as well as higher disposable income for households. Thus, GS1 and GS2 result in increasing disposable income by an average of 0.54% and 0.57%, respectively.
Higher waste recycling also generates indirect work opportunities in various economic sectors. It is estimated that in GS1, a total of 11,864 new jobs are created from 2010 to 2025. In GS2, a total of 12,389 new jobs are created by 2025.
The increased economic activity also translates into higher energy demand and consumption, causing an increase in statewide GHG emissions of about 0.45% and 0.47% in GS1 and GS2 respectively.
The implication is that increasing government stimulus has a positive impact on the state economy such as increasing GSP and total number of jobs. Higher GSP in turn increases both consumption and waste recycling. Although increasing waste recycling pushes GHG emissions higher, the annual average increase in emissions is smaller than the increase in GSP and income.
Alternative Scenario 3: Ohio BPS
In the third alternative scenario we investigate the effect of BPS activities in Ohio. We assume that a BPS network is created and operates starting from 2010. A customer’s process that uses by-products from a generator as inputs is defined to be a “synergy”. Wastes produced and exchanged have a variety of possible uses for customers, such as substitutes for material inputs (e.g., fuels, solvents) that are normally procured from outside the network.
We create four alternative BPS plans, BPS5, BPS10, BPS15 and BPS20. In each plan a specific share of usable industrial waste in Ohio, 5%, 10%, 15%, and 20%, is utilized in the BPS network.
Table 4 shows the projected amount of usable waste generated in Ohio between years 2010
–2025.
Table 4.
Usable waste generated between years 2010–2025.
Table 4.
Usable waste generated between years 2010–2025.
| Year | 2010 | 2011 | 2012 | 2013 | 2014 | 2015 | 2016 | 2017 |
| Million tons | 10.8 | 11.2 | 11.6 | 12.0 | 12.5 | 12.9 | 13.3 | 13.8 |
| Year | 2018 | 2019 | 2020 | 2021 | 2022 | 2023 | 2024 | 2025 |
| Million tons | 14.2 | 14.7 | 15.2 | 15.7 | 16.1 | 16.6 | 17.1 | 17.5 |
Table 5 shows the average reduction (as a percentage) of waste diverted from landfill in the plans simulated. If the share of usable industrial waste utilized by the network increases, then the average percent reduction of waste diverted from landfill also increases. As a consequence, average GHG emissions from landfill are projected to decrease by 0.5% in BPS5, 1% in BPS10, 1.54% in BPS15, and 1.98% in BPS20.
As a result of BPS activities, government revenues would increase by an average of $11.1 million in BPS5, $22.2 million in BPS10, $33 million in BPS15, and $44.4 million in BPS20 per year. Also, since companies’ expenses decrease in BPS, GSP increases by about $145.2 million in BPS5, and $581.4 million in BPS20 per year. Production and transportation activities in BPS would create a total of 7,820 new jobs in BPS5, and 29,350 new jobs in BPS20, both direct and indirect, by 2025.
Table 5.
The results of the third scenario over 2010–2025 time horizon.
Table 5.
The results of the third scenario over 2010–2025 time horizon.
| | BPS5 | BPS10 | BPS15 | BPS20 |
|---|
| Average % reduction in GHG emissions | 0.5 | 1 | 1.54 | 1.98 |
| Average % reduction in waste diverted from landfill | 2.03 | 3.97 | 5.82 | 7.58 |
| Average government revenue increase (million $) | 11.1 | 22.2 | 33 | 44.4 |
| Average GSP increase (million $) | 145.2 | 290 | 436 | 581.4 |
| Average number of jobs created | 724 | 1,448 | 2,171 | 2,895 |
The implication is that BPS activities in Ohio will have a positive impact on the economy of Ohio by increasing government revenue, GSP, and employment. BPS also reduces waste to landfill as well as GHG emissions.
7. Conclusions
We utilized the System Dynamics (SD) methodology to carry out an integrated evaluation of policy options relating to waste recycling and reuse and BPS in the context of complex social, managerial, economic, and ecological systems. SD responds to the need of policy assessment methodology with a proven framework (T21) that can integrate empirical data, causal relationships, subjective judgments, and detailed mathematical models.
In this study, we have effectively developed an integrated policy assessment tool, T21-Ohio, for sustainable development. We apply T21-Ohio to analyze the broader social, economic and environmental impacts of waste to profit activities such as recycling, electricity generation from waste and bio-fuel production in the State of Ohio. We compare the base case scenario, which is the assumption of a continuation of the policies currently in place, with three alternative scenarios—biomass co-firing, government stimulus for solid waste recycling, and by-product synergy activities.
The analysis carried out with T21-Ohio on various options to increase waste processing capacity in Ohio indicates that waste recycling results in decreased air pollution and GHG emissions from incineration, reduced hazardous waste leaching from landfills, and reduced energy consumption as a result of reduced waste and resource consumption (which leads to a reduction in environmentally damaging mining and logging activities among others). Further, the analysis shows that the use of certain biomass resources, made available through converted waste, a clean and renewable energy source, could reduce power generation-related emissions, currently driven by fossil fuel consumption in thermal generation plants. Also, BPS activities result in reduced waste and GHG generation, and yield cost savings to industry through avoided procurement of virgin materials and disposal of waste, while creating jobs.
Concerning further research, we are planning to develop and analyze additional policies related to waste to profit decisions in Ohio. For example, one future scenario concerns the effect of private sector investments in the conversion of landfill gas to natural gas. Another possible future scenario is the analysis of the impact of government stimulus funds on bio-fuel production from waste and crops. We also aim to expand the structure of T21-Ohio so that more detailed analysis can be carried out. Specifically, we will add a regional disaggregation for the State of Ohio. This functionality will provide scenario analysis at the micro level. Further, we will incorporate a water module, which will add drinking water and waste water management options to the analysis. Since at this stage we have primarily analyzed the impact of investments on selected indicators, a more detailed study of policy, structural and cultural obstacles, requiring more in depth research, will be carried out during the next steps of the project. In our effort we have already defined quality of life as a combination of employment opportunities, income, air quality and the presence of pollution related diseases (such as asthma). The simulation of the investments analyzed in our study highlight progress in all these areas, indicating—at a very high level—the potential increase in quality of life in Ohio. A natural next step is therefore the analysis of policy and social aspects of such a proposed transition, or alternative allocation of investment. Finally, the State of Ohio has issued a contract to Ohio University and The Ohio State University to develop a climate policy assessment tool based on the T21-Ohio model.

