Analysis of the Energy Return on Investment (EROI) of the Huge Daqing Oil Field in China

Abstract
: In China there has been considerable discussion of how one should express the efficiency of energy conversion and production. Energy return on investment (EROI) can be useful for this because its methodology is based on outputs and inputs. Unfortunately, similar to the rest of the world, most of the data available for assessing energy gains and costs for oil and gas in China has to be derived from economic costs and revenues for oil fields. In this paper we derive a first EROI for China based on using this approach and the existing data for production of crude oil and natural gas for the Daqing oil field, the largest oil field in China. We estimate that its EROIstnd expressed as heat equivalent was 10:1 in 2001 but has declined to 6.5:1 in 2009. Based on this trend we project that the EROIstnd will decline to 4.7:1 in 2015, and the net energy from the field will be decreasing substantially. The calculations have some errors because of incomplete data, and if various externalities are taken into account, the EROI of this oil field would be lower than our present estimates. The trends of EROI and net energy suggest that the Daqing oil field will face more difficulty in the future which can not be overcome by government fiat.1. Introduction
In traditional economic analyses there are two types of profits and returns from economic systems: “gross” and “net”. These are used routinely in such assessments as the gross national product (GNP) and the net national product (NNP), and in gross income and net profit in financial analyses. Any economic system, from enterprises to countries, must consider not only the total or gross output or sales but also the net output (profit) for their decision making.
Curiously the same concept is almost completely ignored by most researchers in the energy field. This has been true even though the concept has a long history in energy analysis. For example, Cottrell [1] uses the concept of net energy production, which he calls energy surplus. Howard Odum [2] writes explicitly about the importance of gross vs net energy output. Hall et al. [3] and Cleveland et al. [4] put forward a related concept, energy return on investment (EROI), as a more intuitive description of net energy. Although the concept seems easy enough (energy output divided by energy inputs used in the same energy production process), it is actually very complex in practice. It can be used in at least two ways: firstly for getting energy itself, e.g., the normal process of oil exploration, development and production from an oil field or province, and secondly more generally for the energy required to maintain and develop an economy or society.
So far EROI has not been undertaken according to any unified standards because it has involved many uncertain factors and many independent and sometimes arbitrary judgments, as discussed in Murphy et al. [5] in this journal special issue. This has contributed to different results from different analyses, although nearly all analyses show that: the EROI of conventional oil, gas and coal is high but decreasing, and the EROI of oil shale, liquefied coal and biofuels is much lower. In 1970 the oil and gas industry in the United States used the energy equivalent of one barrel of oil to produce about 30 barrels of oil, so the EROI was 30:1 [6]. Today, for the U.S. the EROI has dropped to approximately 10:1 while the global value has declined from 35:1 in1999 to 18:1 in 2006 [7].
EROI has additional relevance to the concept of peak oil. Many geologists and economists are optimistic that technology can solve the peak oil problem, so they disagree, more or less, with the concept. The truth is that depletion and technology are in a race, and there is no obvious way to distinguish which is the winner without empirical analysis of particular situations. Technology can indeed sustain or increase output, but it usually requires substantial energy investments to do so. In a sense the change in EROI evaluates who is winning in the race between oil depletion and technological progress. That assessment gives more credibility to peakoilism [8].
1.1. Daqing Oil Field and Its Important Role in China
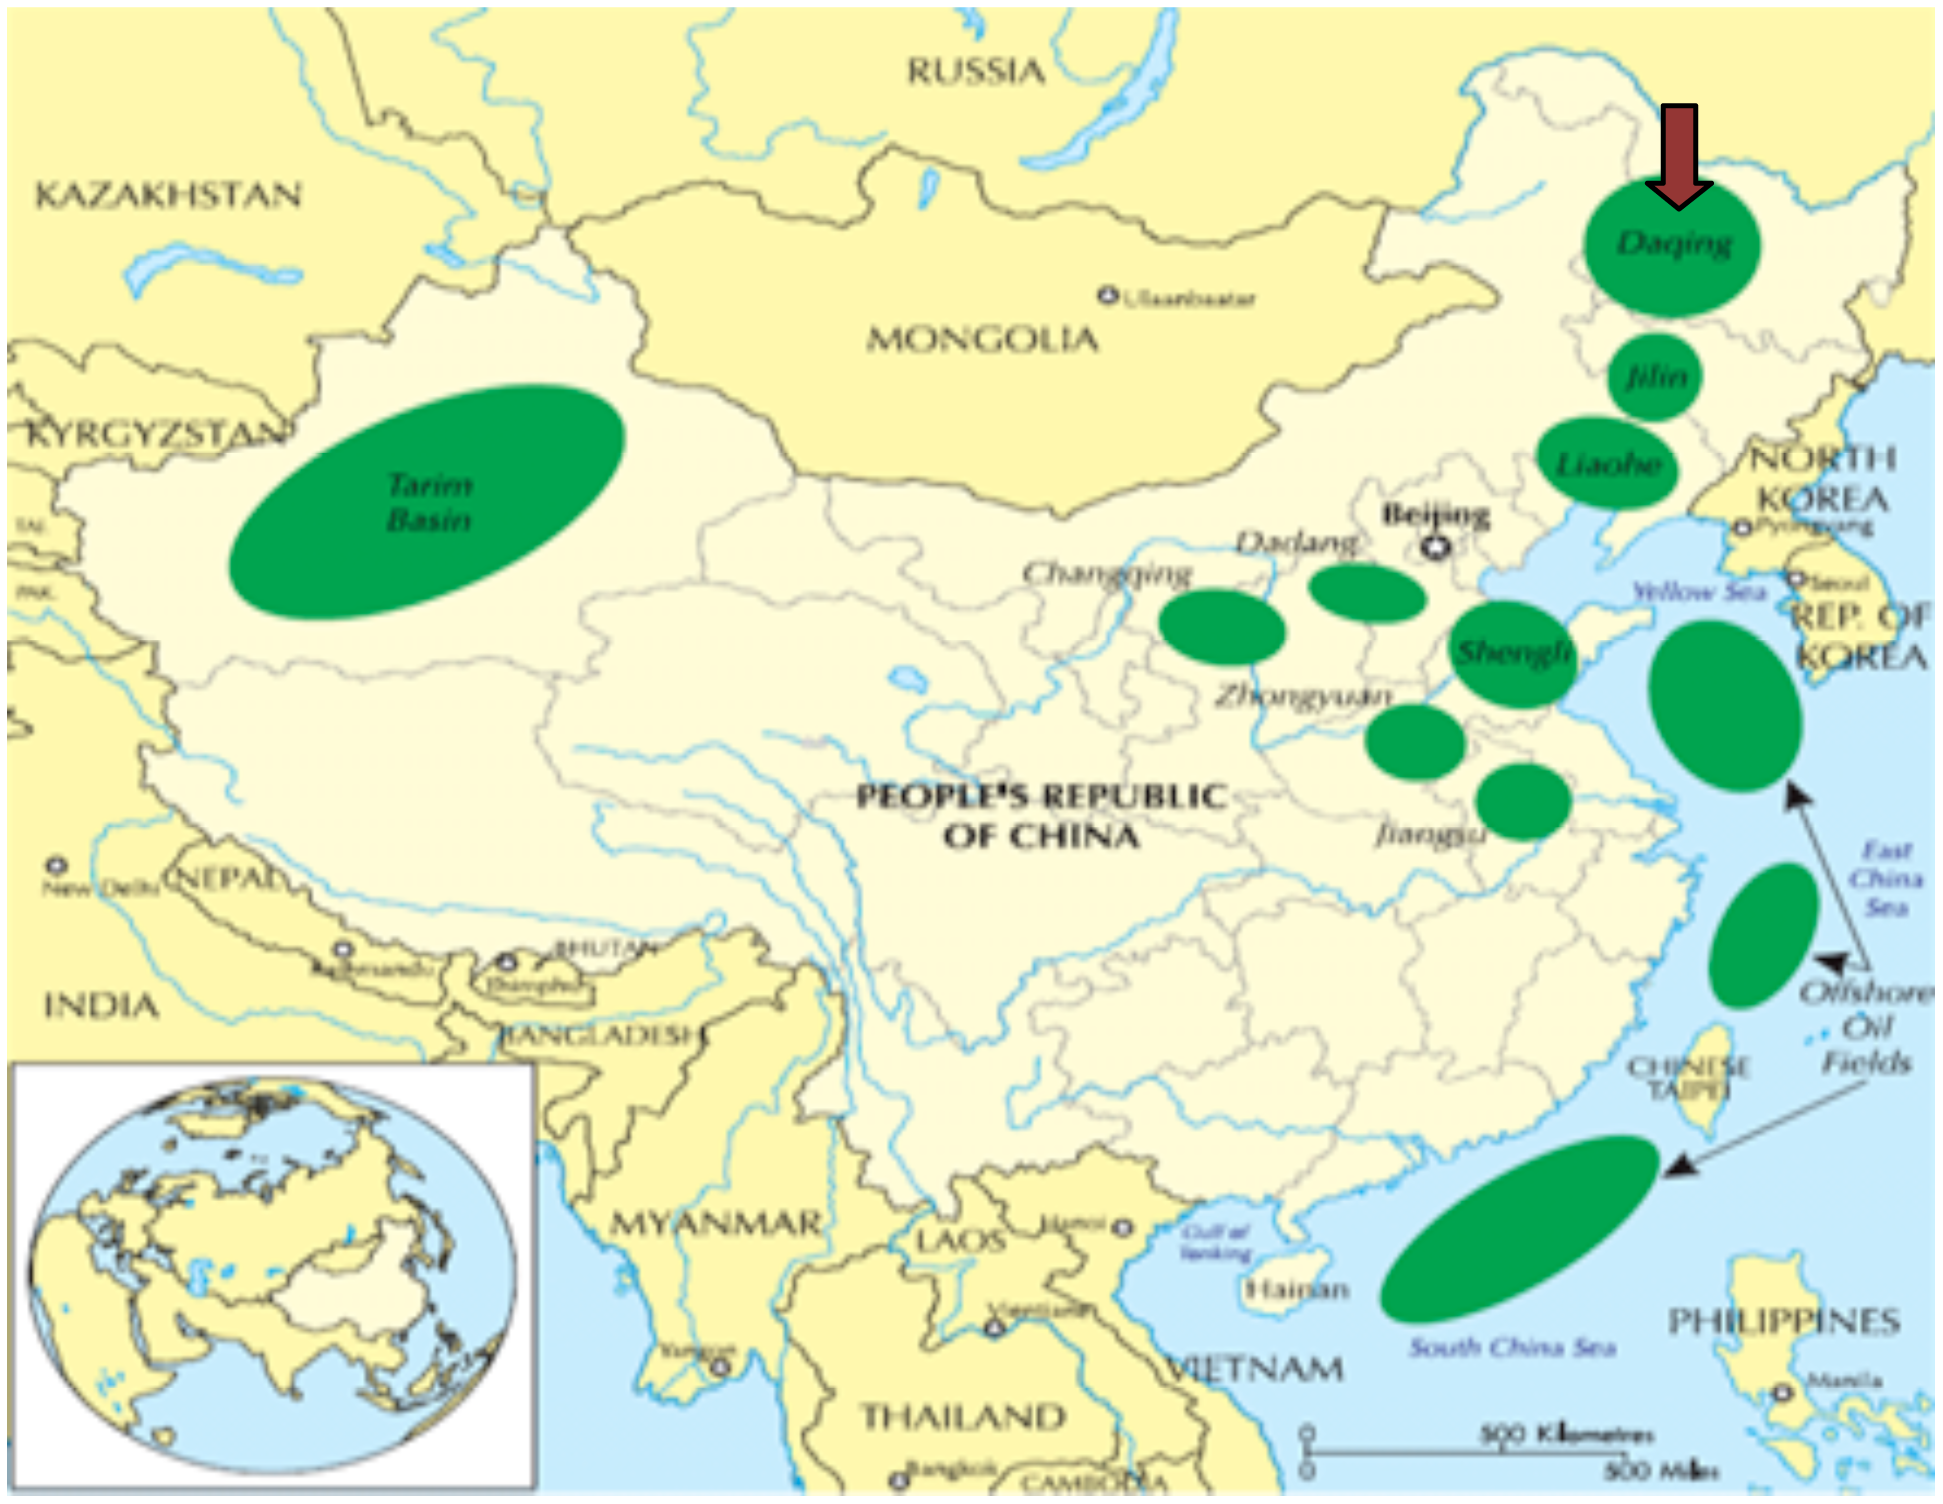
The discovery of Daqing oil field in 1959 made China an oil-rich country. The Daqing oil field is by far China's largest oil field to date (Figure 1), and is also among the world's largest oil fields. It has obviously made a tremendous contribution to China's oil industry and maintained a long-term stable yield. Since it has recently shown some signs of faltering, this seems like a good time to ask if EROI can add anything to our understanding of this important oil field.
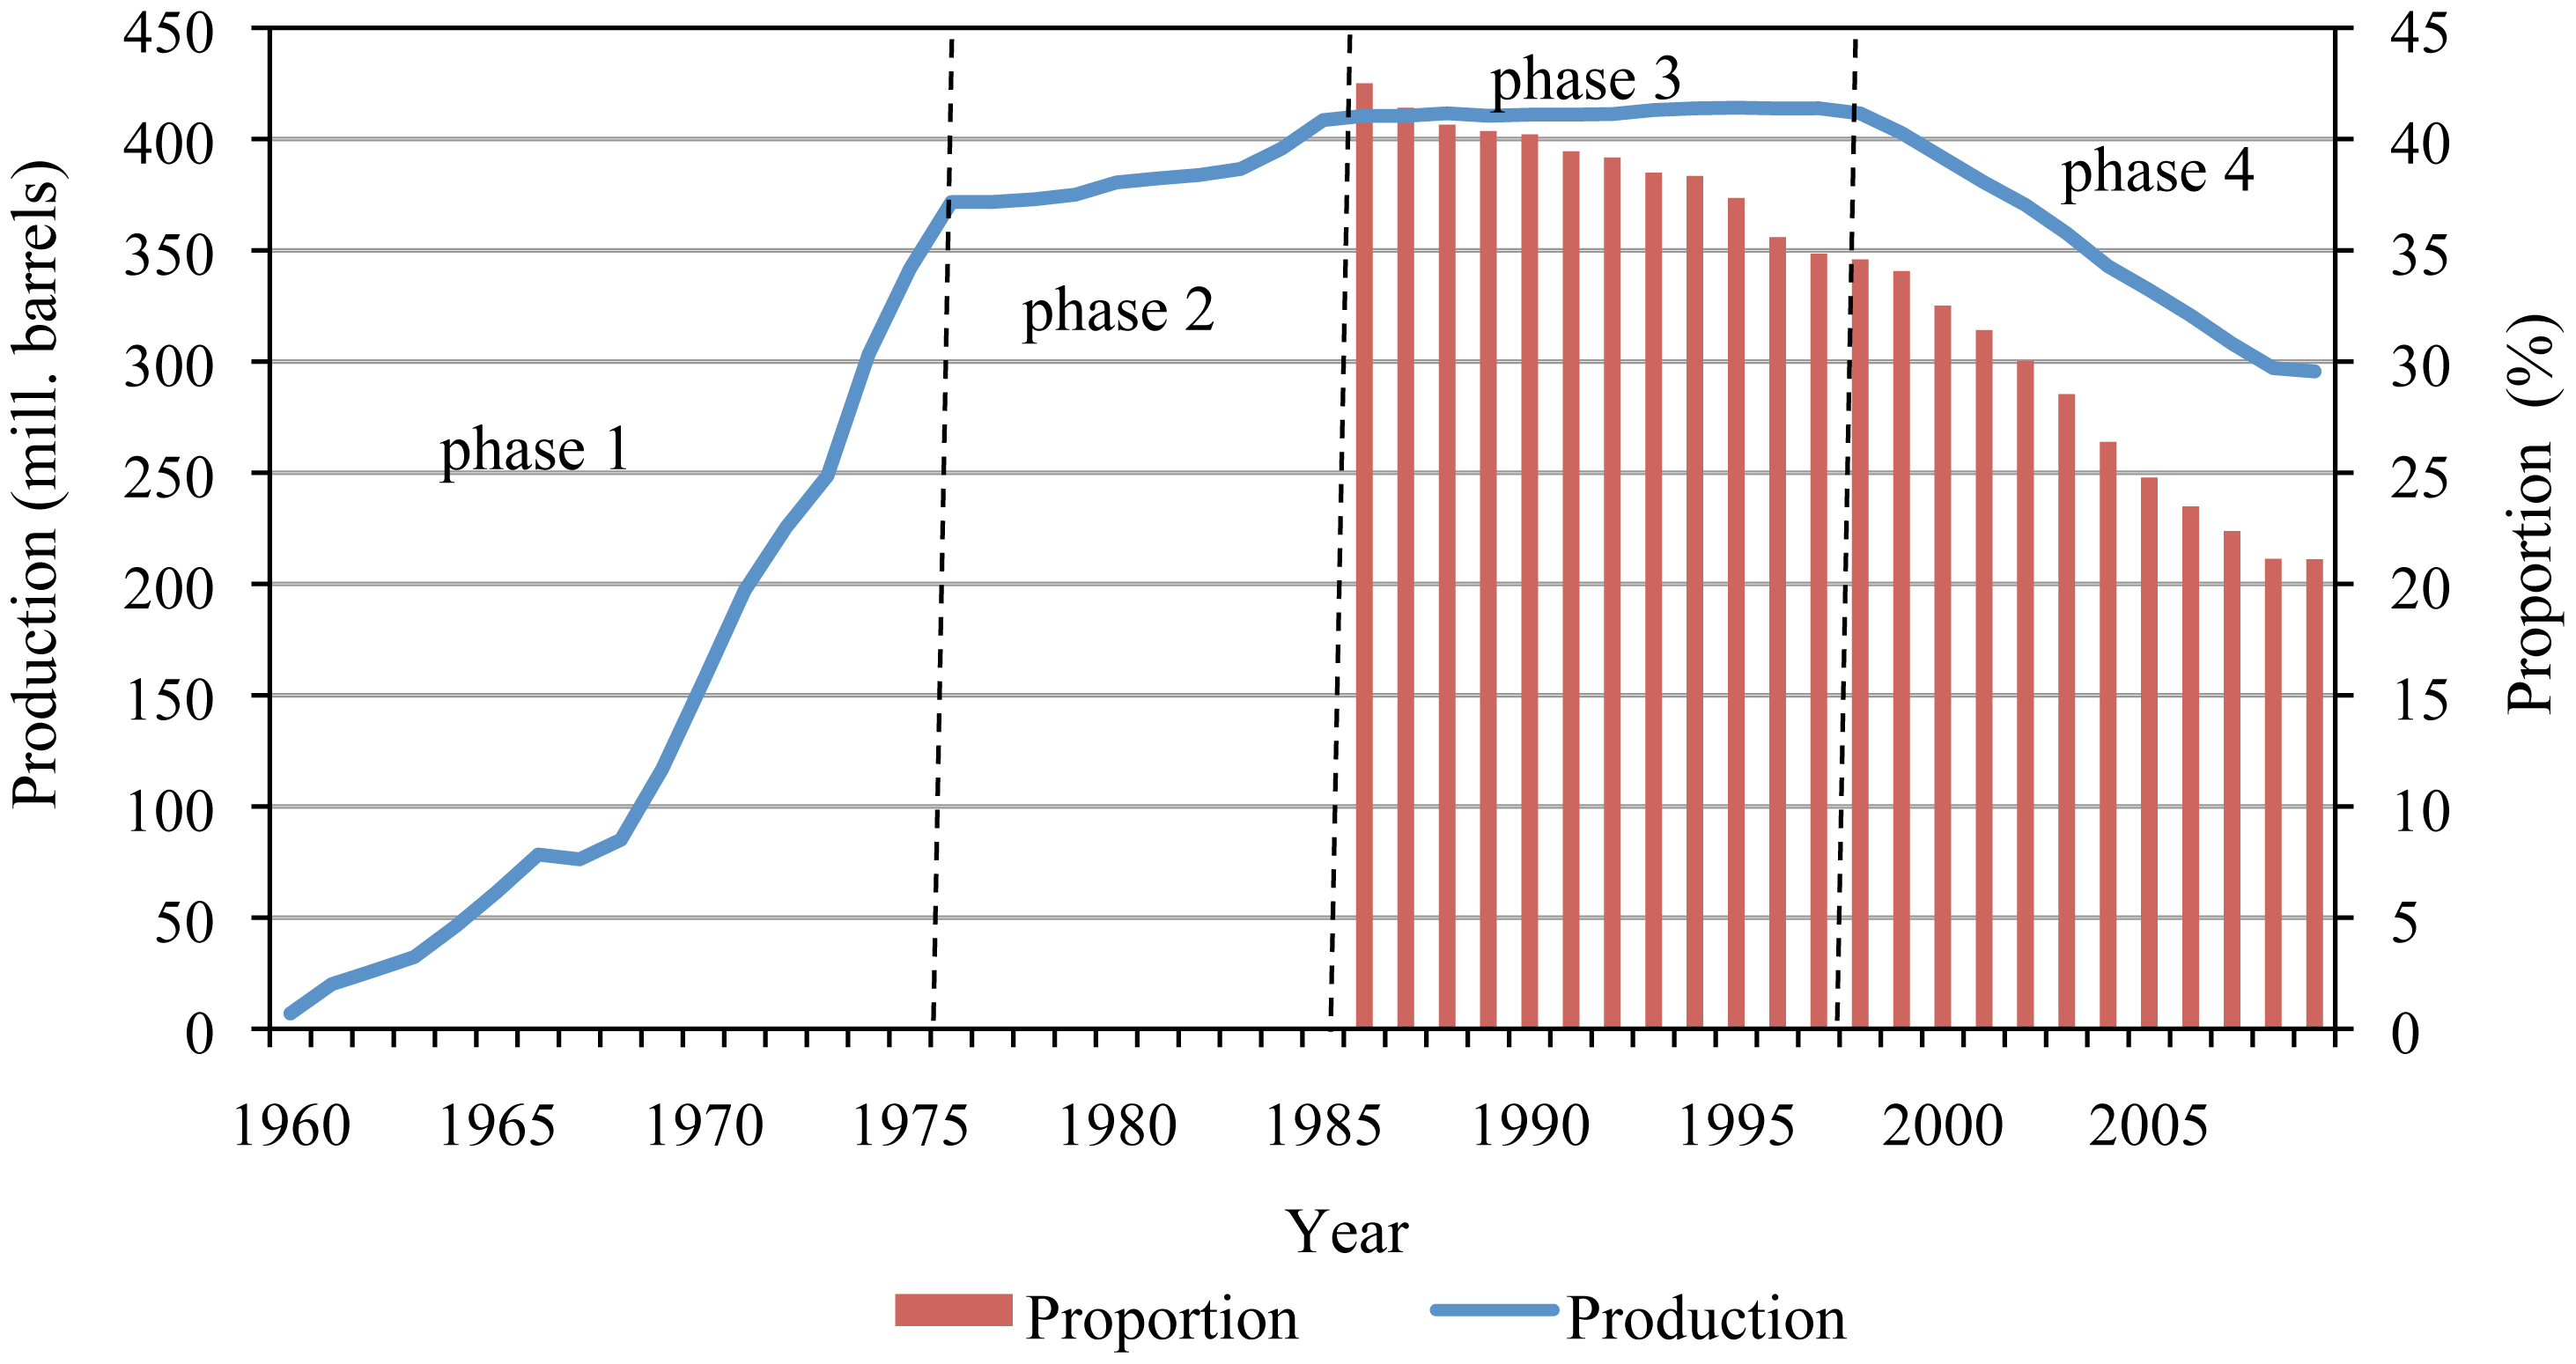
The development of Daqing oil field can be divided into four phases (Figure 2).
In the first phase (1960–1976), crude oil production increased rapidly, to 371.7 million barrels per year in 1976.
In the second phase (1977–1986), the oil field was in a moderate “containing-water” stage and had stable production for a decade. By increasing the pressure of the water beneath the oil and increasing pressure among a series of different strata, annual production increased continuously, from 371.8 million barrels in 1977 to 410.5 million barrels in 1986.
In the third phase (1987–1997), which was the second stable production decade of the Daqing oil field, the field began to become saturated with water. While the quantity of additional water in the field was increased gradually, it became more difficult to maintain a stable yield. Therefore, China then used advanced technology which aimed to improve the output of old wells, and to increase the productive potential of the field's low-to-moderately permeable strata. Consequently, the annual production increased from 410.5 million barrels in 1987 to 413.9 million barrels in 1997. At this phase, Daqing oil field experienced a “peak plateau” period at about 410 million barrels per year. The proportion of this one field in the national total production declined from 41.4% in 1987 to 34.8 % in 1997.
In the fourth phase (1998–2009), the oil production began declining. The production of the Daqing oil field has been decreasing since the peak of 410 million barrels to 295.6 million barrels in 2009. In this period, oil production was maintained and water content was controlled mainly by increasing the pressure of the water beneath the oil and the use of polymer flooding technology to maintain oil production and control water content. The proportion of the Daquing field in national production also declined, from 34.6% in 1998 to 21.1% in 2009. One can note that, even at peak usage, there was less than half a barrel produced per year per Chinese citizen.
2. EROI Methodology
2.1. EROI and Similar Indexes in China
There are several existing indexes of efficiency used in China whose equations are somewhat similar to EROI. These include “energy macro-efficiency”, “productivity”, “energy physical efficiency”, and “efficiency of energy conversion”. Just like EROI, each of them evaluates relations of “output” and “input”. However, they are essentially different from EROI.
Energy intensity, one important index of “energy macro-efficiency” from the national point of view, regards GDP as output, and energy consumption as input (equation 1). A higher economic efficiency causes a lower energy intensity. It emphasizes the relation of energy consumption to the economy, and reflects from the national perspective the dependence of economic well-being on energy.
Productivity, like energy macro-efficiency, uses the ratio of output and input to evaluate production capacity from a macro-view (equation 2). Output is gross (or net) national production and input is based on human, material or financial resources or a combination of these resources.
Energy physical efficiency is generally assessed as energy consumption per unit product (equation 3). This index focuses mainly on energy utilization per unit of energy-intensive products, such as total energy consumption per unit steel production. It is especially suitable for the comparison between enterprises which have the same production structure, and the same level of equipment and management. The similarity of this index and EROI is energy consumption per unit of production, although they are reciprocal.
Efficiency of energy conversion, is the ratio of output of a particular kind of energy to the energy inputs for processing and conversion in the same period (equation 4). This analysis focuses on the levels of equipment and the technology of conversion and management used. In recent years, this index for petroleum refining and coking has been maintaining at 95% and above. The same ratio for electricity generation by power stations fluctuates about 39%.
Most of these ratios are applied at the level of the entire economy, the nation or some other large entity. EROI is different because it examines the effectiveness of obtaining energy itself, assesses the energy gain relative to energy costs, and assesses how the quality of the energy base is changing over time, including changes in net energy gains from energy resources. It is usually applied at the level of a particular field, region or political unit. Importantly, it allows ranking different fuels and examing trends in the relation of technology and depletion over time. We believe that EROI should become one of the important components of China's official energy statistics like the above four. There may be less enthusiasm for governments to maintain such statistics because, unlike the other indices, it often declines over time, which is in opposition to the concept of continual technological progress which the government likes to project.
2.2. Static and Dynamic Process
EROI analysis can be used to derive the energy relations at one point in time, but it usually generates more interesting results when it is used to evaluate the dynamic productivity of an energy supply process, that is its behavior over in time. A discussion about the performance of a process usually starts from a static state, often for the present, and then develops from there.
A difficulty is assigning the time period when inputs generate outputs. Usually the energy output data should be for the same period as that of energy input. Some of the fuel produced at a given time, however, came from investments long ago, and today's investments are likely to be generating fuel well into the future. In actuality much of today's costs are for immediate production (such as natural gas used to pressurize or pump an oil field), some is used for replacing equipment that has worn out over past years, and some is used to find or exploit new oil or gas. Since different depreciation methods are used for different fixed assets, we can't simply put total fixed assets into “energy inputs”. However, we can get the total depreciation from the Daqing oil field. In addition, while detailed records of energy consumption are kept, these data are expressed in terms of money, such as total cost and expense during the processing year. They must be multiplied by some index of energy intensity if we want to use them in an EROI formula. This gives a straightforward assessment of energy in physical units.
2.3. Approaches to EROI
Our initial method of deriving EROI is to compare energy outputs and inputs in thermal units. The formula is as follows:
and respectively indicate thermal equivalents of energy outputs and inputs for the period considered. Thermal equivalents are based on the first law of energy conservation, i.e., that all energies can be measured by their final conversion to heat. However, the ability to heat water is just one attribute of energy. Different characteristics and ways of using energy can contribute to different power generation of the same thermal energy [10]. We believe it is necessary, in addition, to apply a quality factor and revise EROI because of different energy qualities. Howard Odum was among the first to propose the concept of energy quality and defined it as relative economic utility among different energy types [11]. The revised formula is as follows:
where λ means the quality factor. This revised EROI can better reflect the real supply of useful energy to society.
The two formulas above are dynamic over time. In one time unit (such as one year), the formula of EROI is as follows:
where λOis joules of all energy outputs expressed in the same units, λEI and λEDirect, respectively, represent total input and direct (on site) input of different kinds of energy, λ is a quality factor representing the “potency” of the different forms of energy used, MIndirect expresses indirect inputs, which are usually derived from money spent and its energy intensities per monetary unit, Eins.
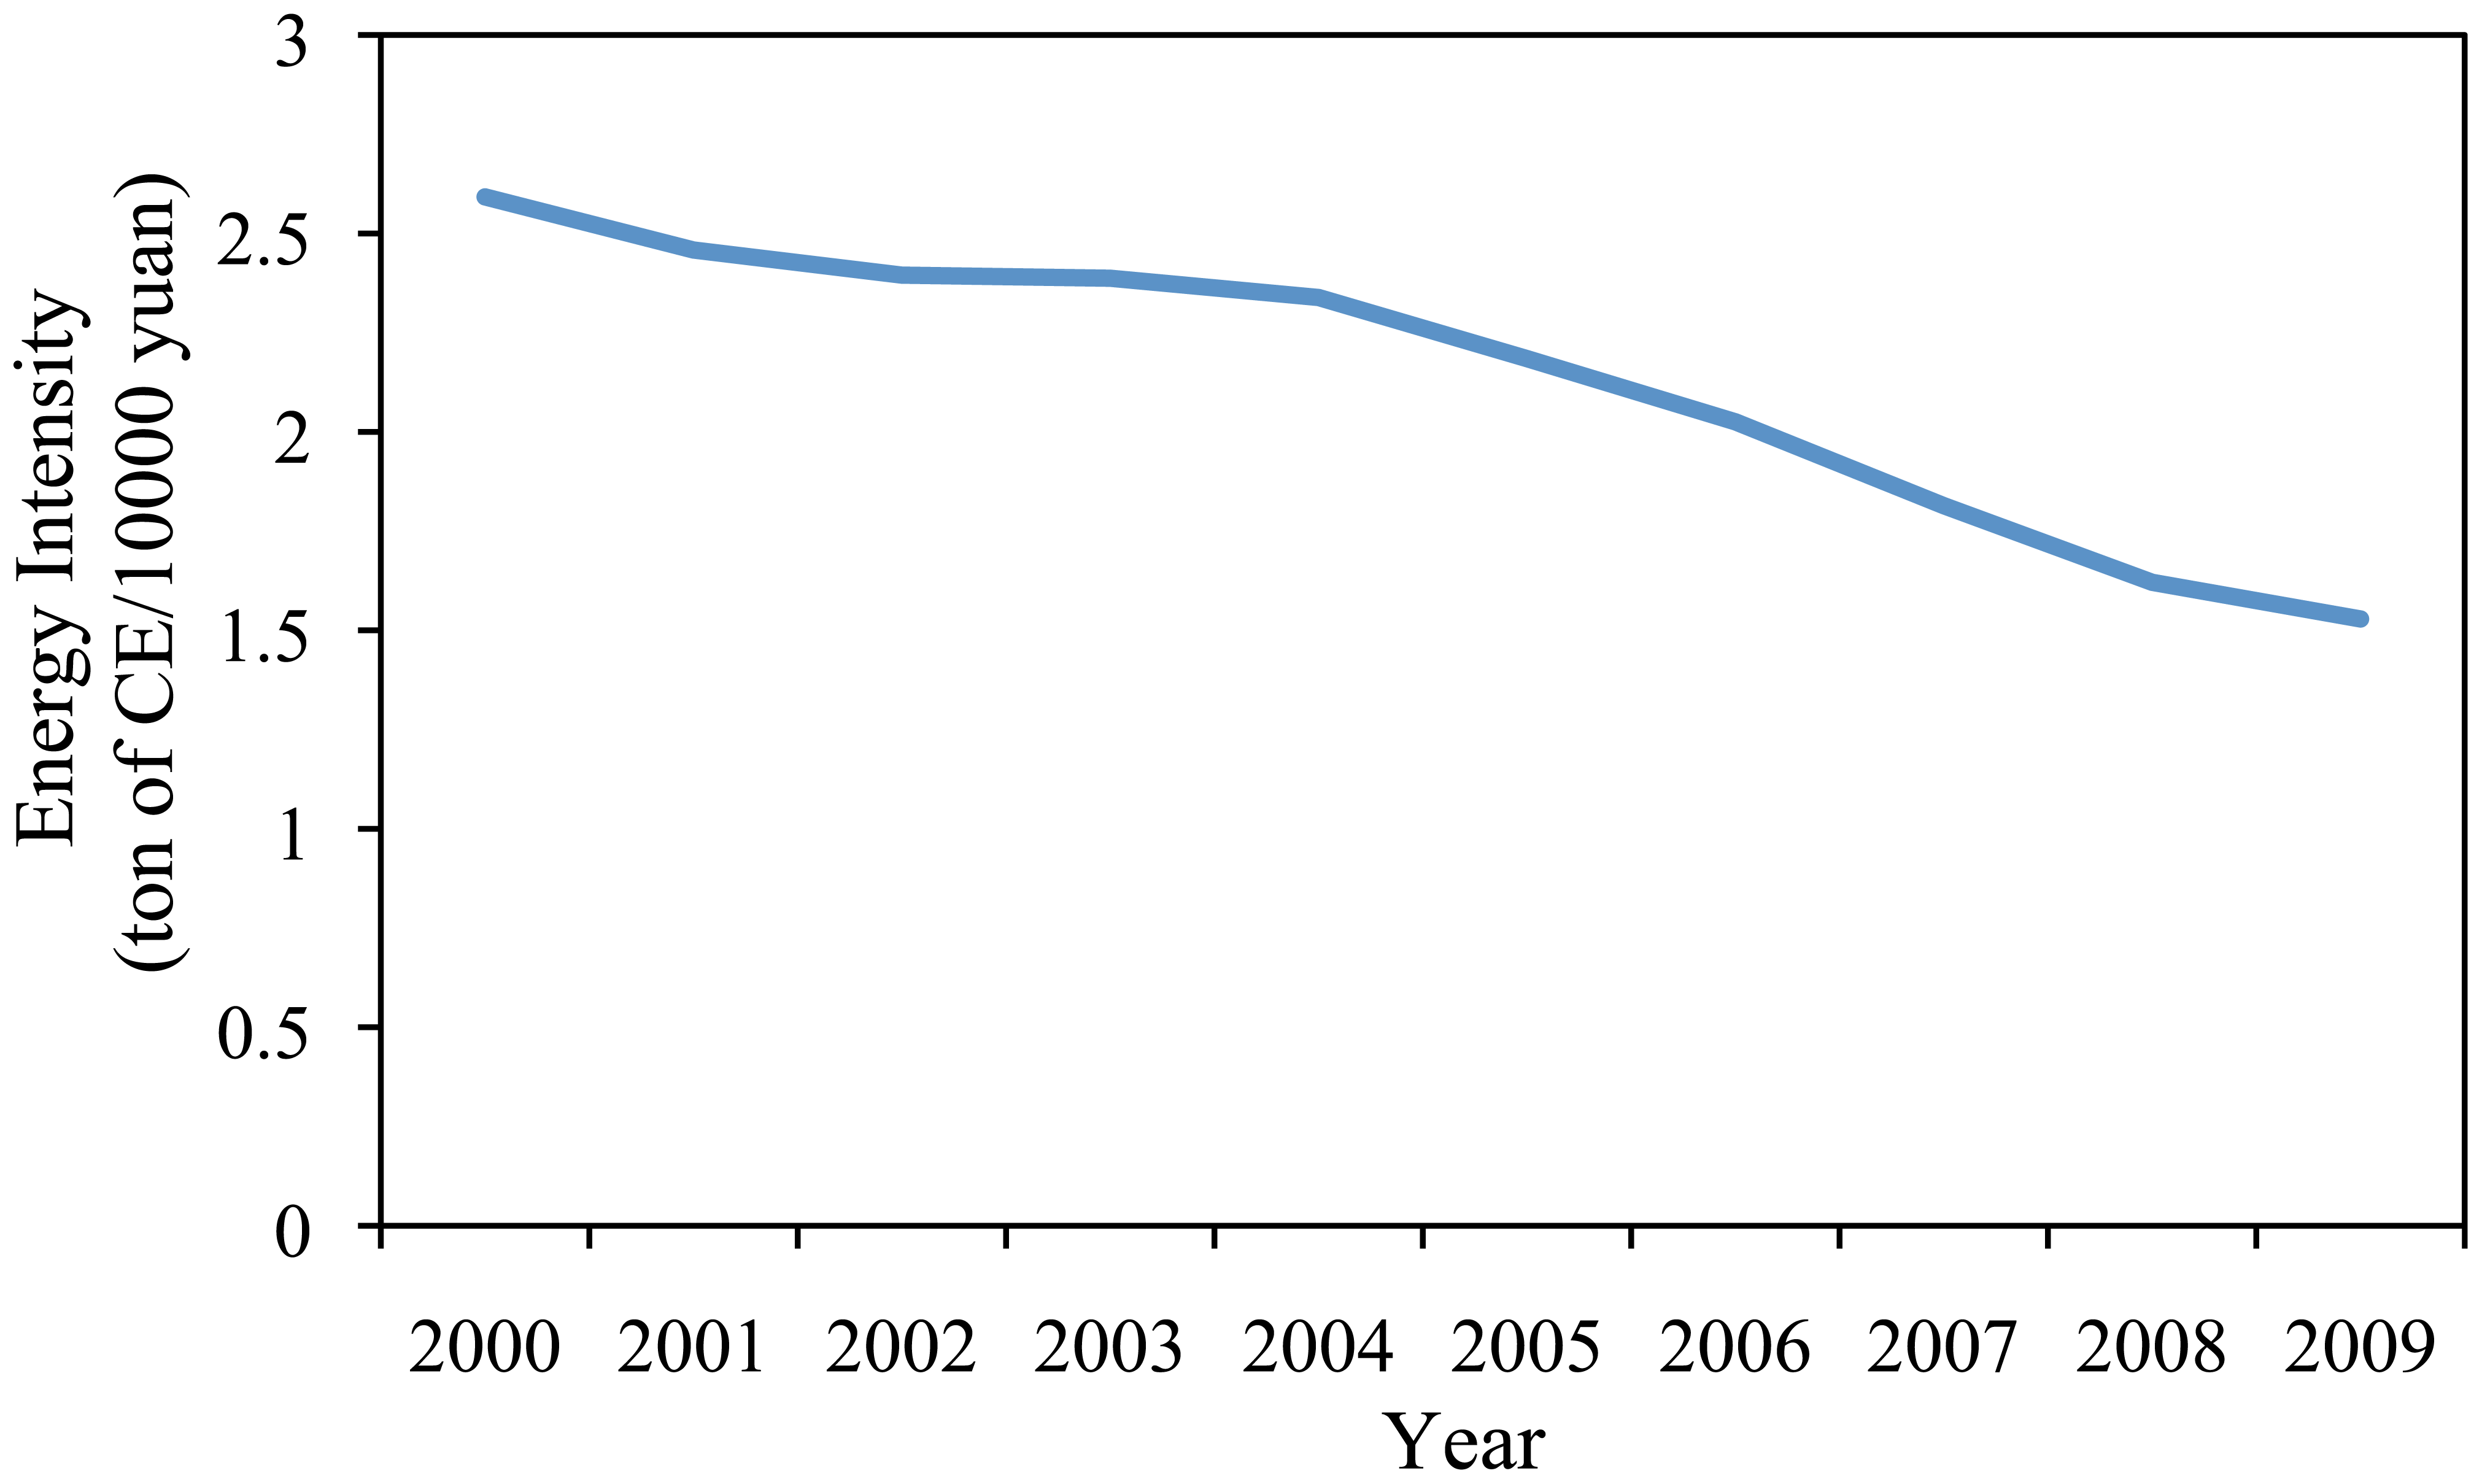
In theory, energy intensity should be based on numbers from the entire (national) oil industry or related to the national oil and gas supply sectors—in other words, it should be for those sectors supplying the indirect inputs such as steel forms or drill bits. It is difficult to calculate this, however, because of a lack of data on GDP and energy consumption for specific sectors of the Chinese economy. In the Chinese data, the sectors for extraction of petroleum and natural gas are categorized simply as belonging to “industry”. Therefore, we must use more general conversion factors, those for the energy intensity of all industry. These can result in certain errors in the calculation of energy inputs to EROI but are more accurate than using values for the economy as a whole. We were able to get data for GDP and energy use to derive a time series of energy intensity for all industry (Figure 3). We eliminate the effect of inflation by using each year's ratio [7].
In order to get quality-corrected energy outputs and direct energy inputs, we used the Divisia index, which basically makes the assumption that the quality of a fuel is related to its relative price per heat unit [5][13][14]. While price is not the perfect predictor of energy quality, it is better than no correction and easy to get. This is most important here with respect to the quality differences between oil, natural gas and other energy [15]. The Divisia index which corrects for price changing and from one year to the next is expressed as:
where P is the price of n different types of fuels and E is the final consumption of energy (joules) for each fuel type.
Since most kinds of energy originate from solar energy, all energies could be weighed relative to solar energies, which can make different kinds of energy comparable [16]. Although it seems to be effective, there are some limitations for its application to EROI analysis of oil and natural gas extraction since it is not quite clear how much sunlight goes into making a heat unit of oil vs. gas. It is rarely used in energy analysis.
3. EROI of Daqing Oil Field
3.1. Boundary
Selecting the appropriate boundaries for EROI analysis is a crucial step. The use of different boundaries in the past based on different research objectives have resulted in very different results, even when applied to the same energy resource. According two-dimensional framework for EROI analysis advocated by Murphy et al. [5], one dimension is “what do we count as energy output?” and is depicted with the three system boundaries; other dimension is “what do we count as inputs?” and is divided five levels.
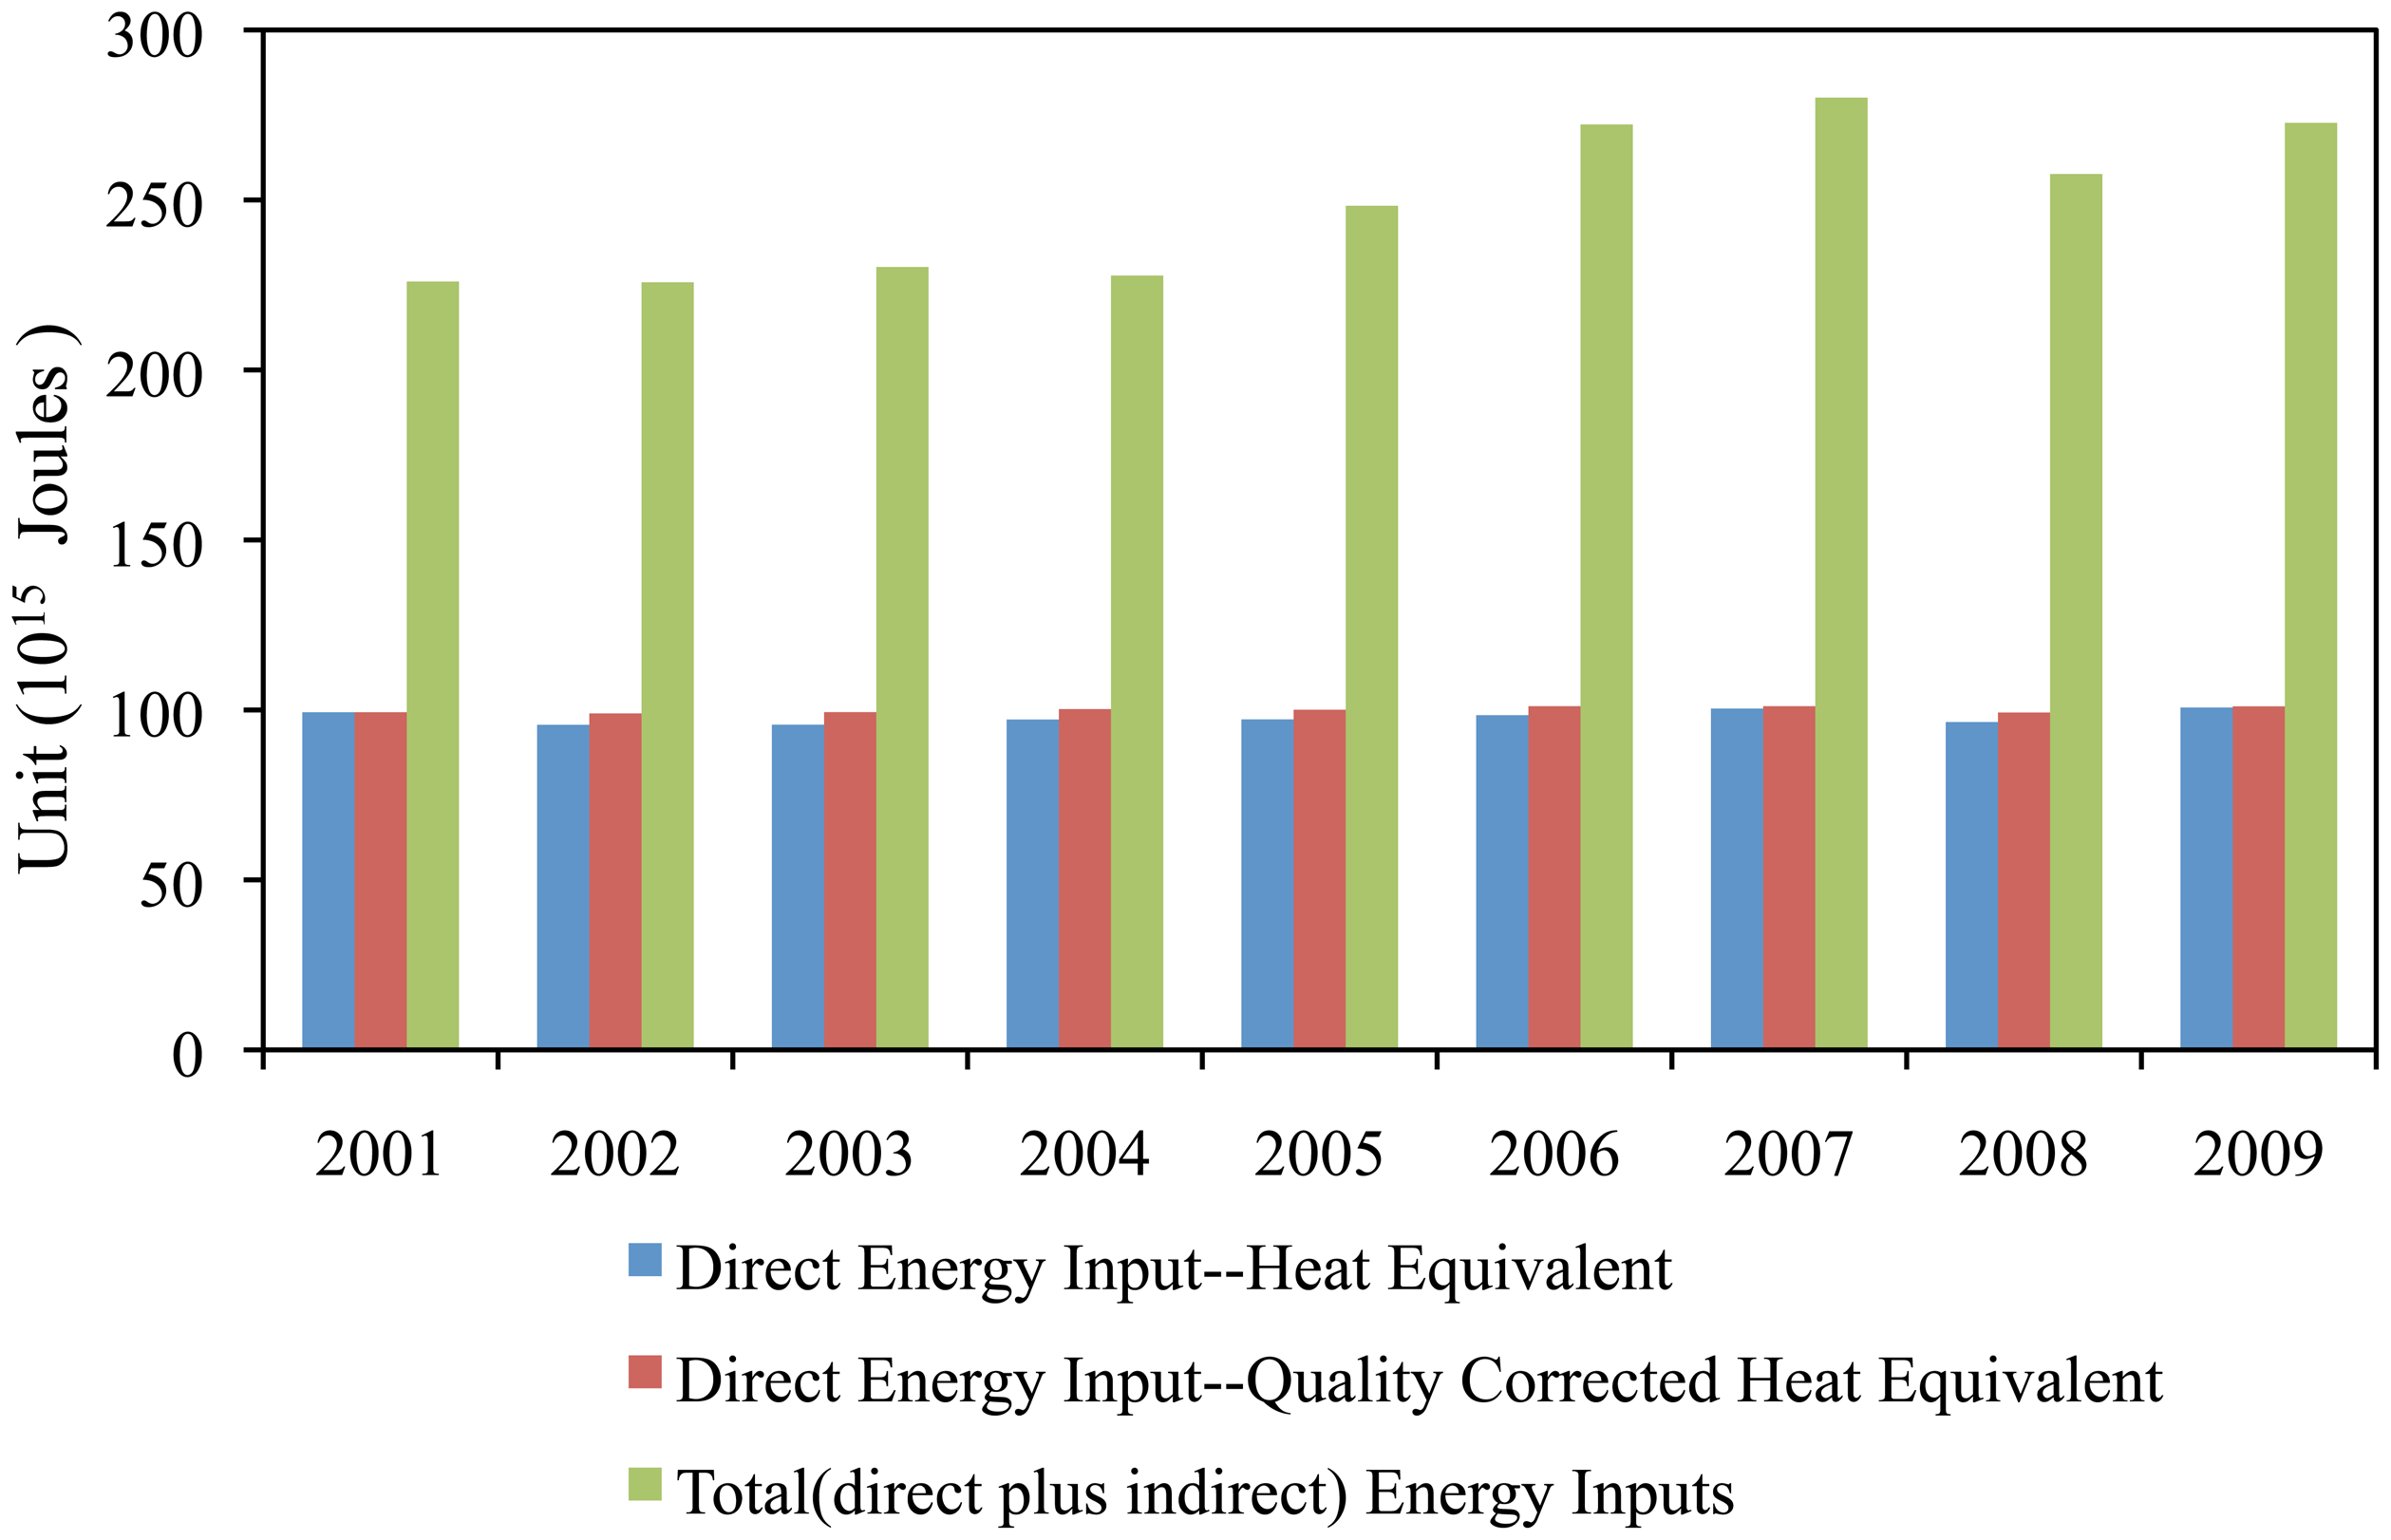
This paper discusses the process of exploration and development, and production, and the output is crude oil and natural gas from this process. That is we choose the system boundary 1, which is extracted unprocessed energy described by Murphy et al. [5]. According to the Daqing oil field statistics, we convert natural gas output into oil equivalents. Considering inputs, we divide them into two levels. The first level is direct level, which just has direct energy input given in physical units. The second level is indirect level, which include direct and indirect energy input (total energy input). Besides that, we make the quality-corrected for direct energy input, and then we can get the total energy input of quality-corrected heat equivalents. Therefore, this paper provides the two-dimensional framework (Table 1), which is similar with the protocol [5] and is appropriate to the type of Daqing oil field data and for the oil and gas industry. In the Table 1, the subscript “1” means the boundary for system boundary 1, while the “d” refers to direct energy inputs. EROIstnd represents the direct and indirect energy inputs and outputs from boundary 1. The “Qd” refers to direct energy input of quality-corrected heat equivalents, while the “Qstnd” refers to quality-corrected of “EROIstnd”.
3.1.1. Energy Outputs
The data of the Daqing oil field output was derived from the official web site for the field. This output was converted to heat units using the values in Table 2. Then, we can get energy output as heat equivalents (Figure 4).
However, joule unit measurements are not always equal; for example, the utility of a heat unit of electricity is different from that of a heat unit of coal. Because of this, we also convert all energy units to a common unit by using Divisia index for weighing the difference in quality amongst energy types. By calculating the Divisia index, energy prices are the key factor.
We are able to get accurate crude oil prices for the Daqing oil field every year [17-26]. The National Development and Reform Commission publishers adjusted gas prices several times over the course of nine years for different using categories. We derived the annual average gas price for industries [27]. Then, we got energy output after correcting the heat equivalent values for quality (Figure 4).
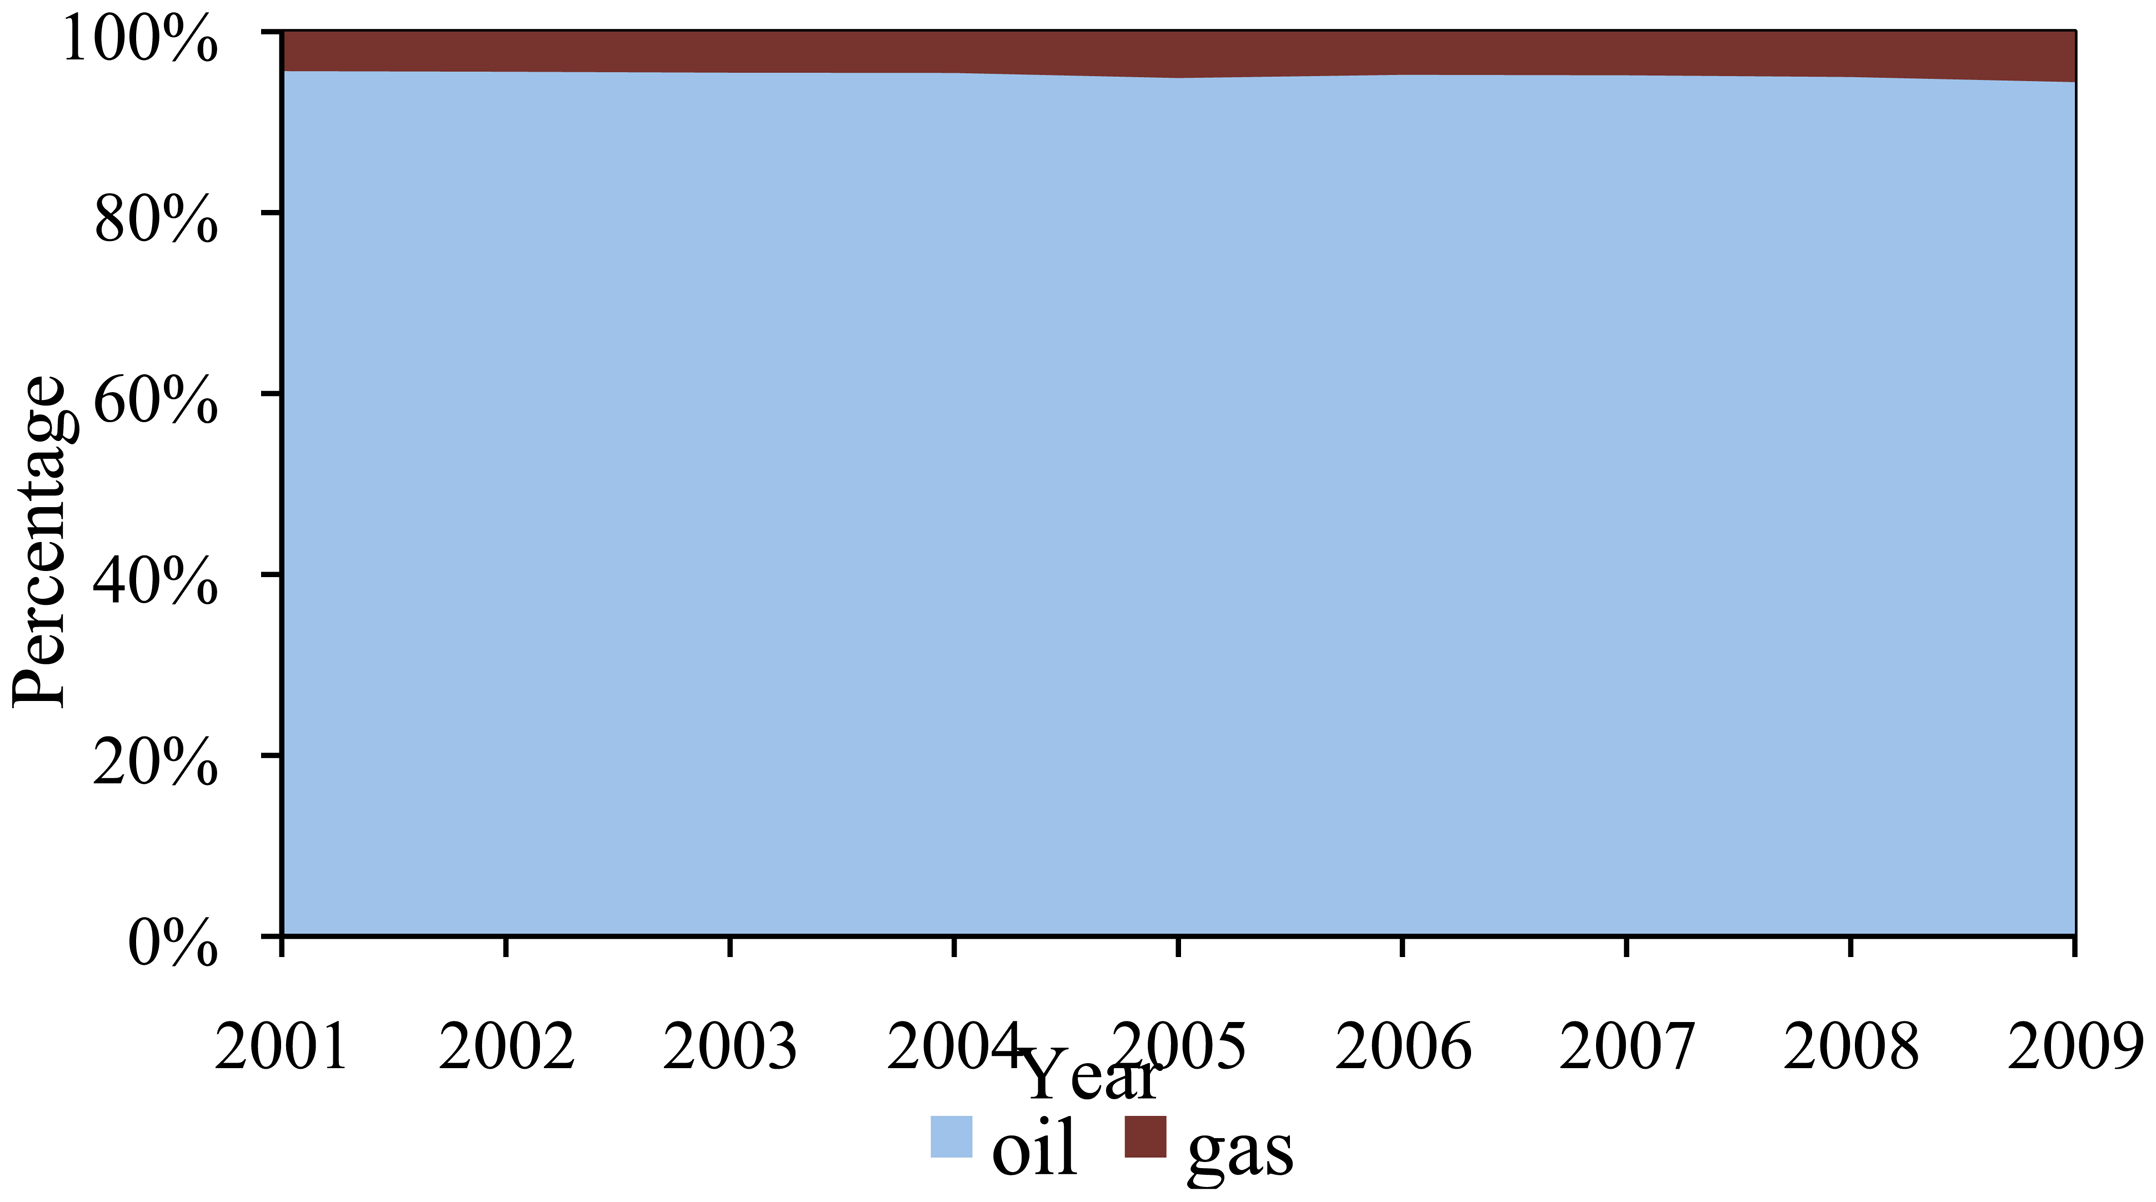
The difference between quality-corrected and non-corrected energy output is very small (Figure 4). The first reason for this is that natural gas production is small compared to oil production (4.36% in 2001, and 5.57% in 2009; Figure 5). The gas production expressed as joules gives only a very small correction. The second reason is that natural gas prices, which are lower than the true market prices, are controlled by the National Development and Reform Commission.
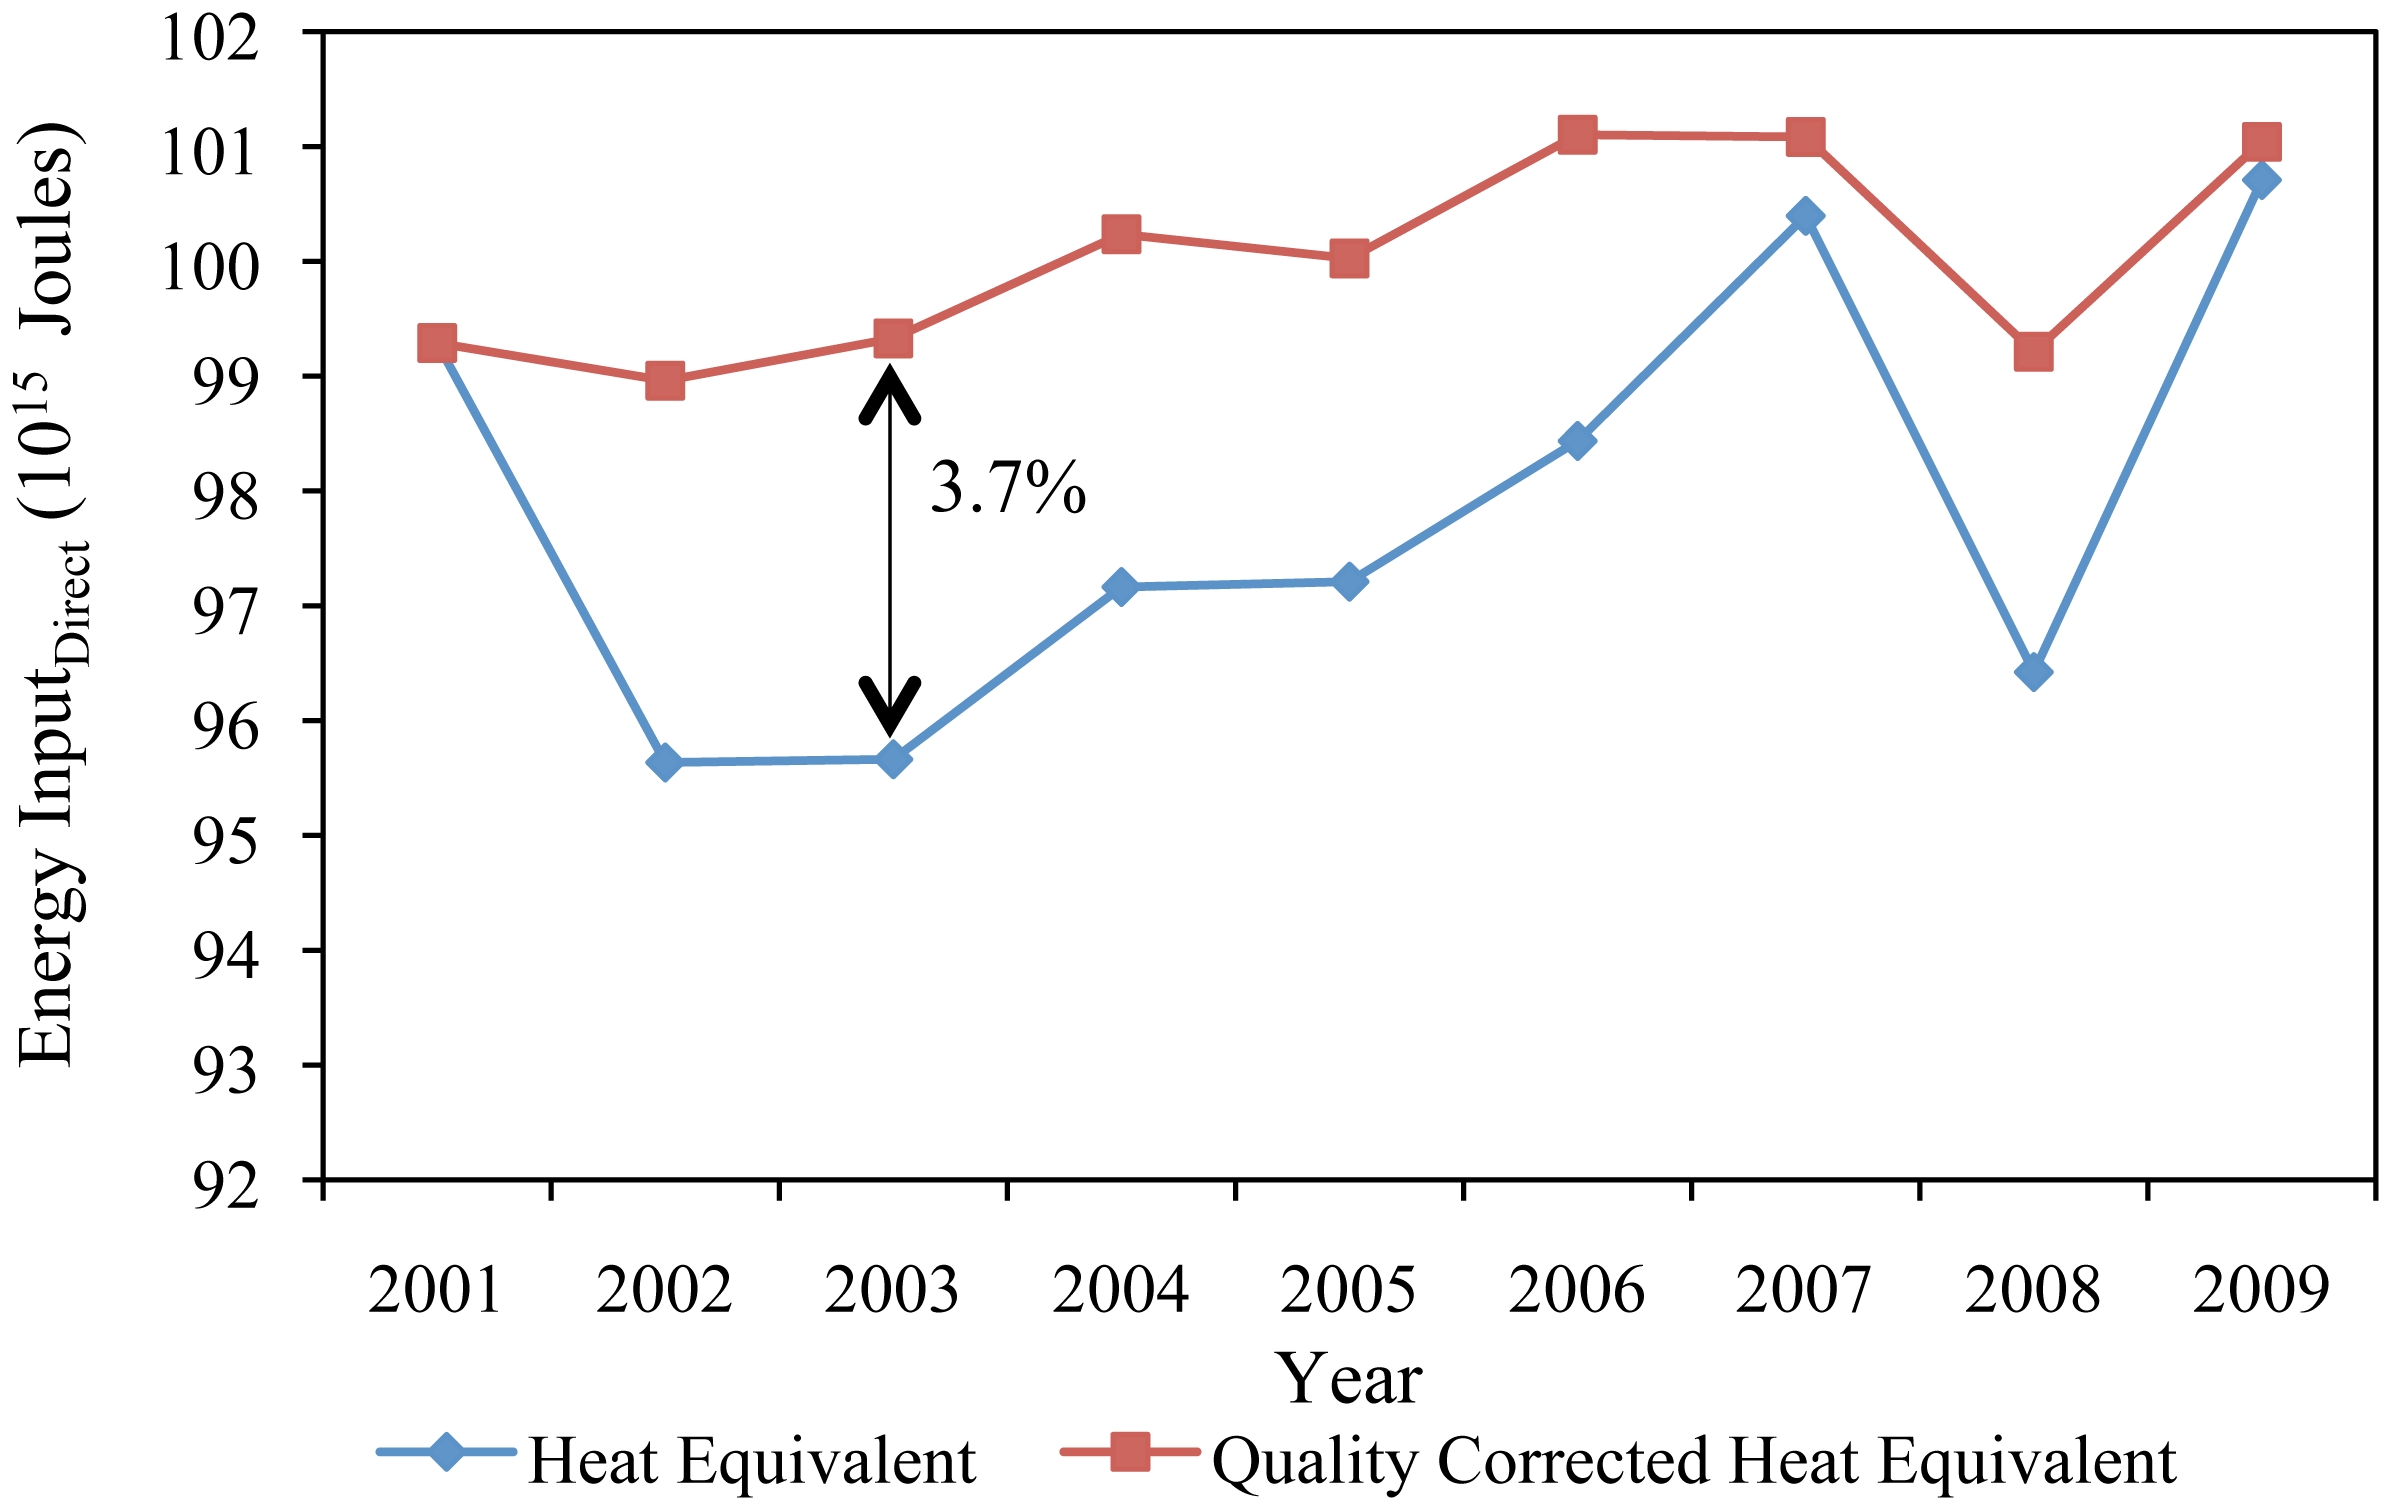
3.1.2. Direct Energy Inputs
Direct input, is given in the Daqing oil field in physical units (ton or kwh), and consists of oil for self-use, gas for self-use, gasoline, diesel, and electricity (Table 3). Some of the direct inputs, such as water, cannot be defined in energy terms, so we ignore them. The input was also expressed in quality-corrected terms using the same Divisia method as for energy output (Figure 6). The maximum percentage difference in quality-corrected heat equivalents compared to heat equivalents is only 3.8%. The gasoline and diesel price comes from pricing policy of NPRC, which we use to calculate annual average price. Electricity price is based on 0.572 yuan/Kwh from 2001 to 2008 and 0.595 yuan/Kwh in 2009.
3.1.3. Indirect Energy Inputs
No data was available explicitly for indirect energy input. However, we were able to derive indirect cost as equation 9.
As the Table 3 showed, we derived indirect monetary costs for Daqing oil field from total monetary costs minus direct monetary costs generated from physical units. Then, we got the indirect energy inputs by converting monetary units into energy units (Table 4).
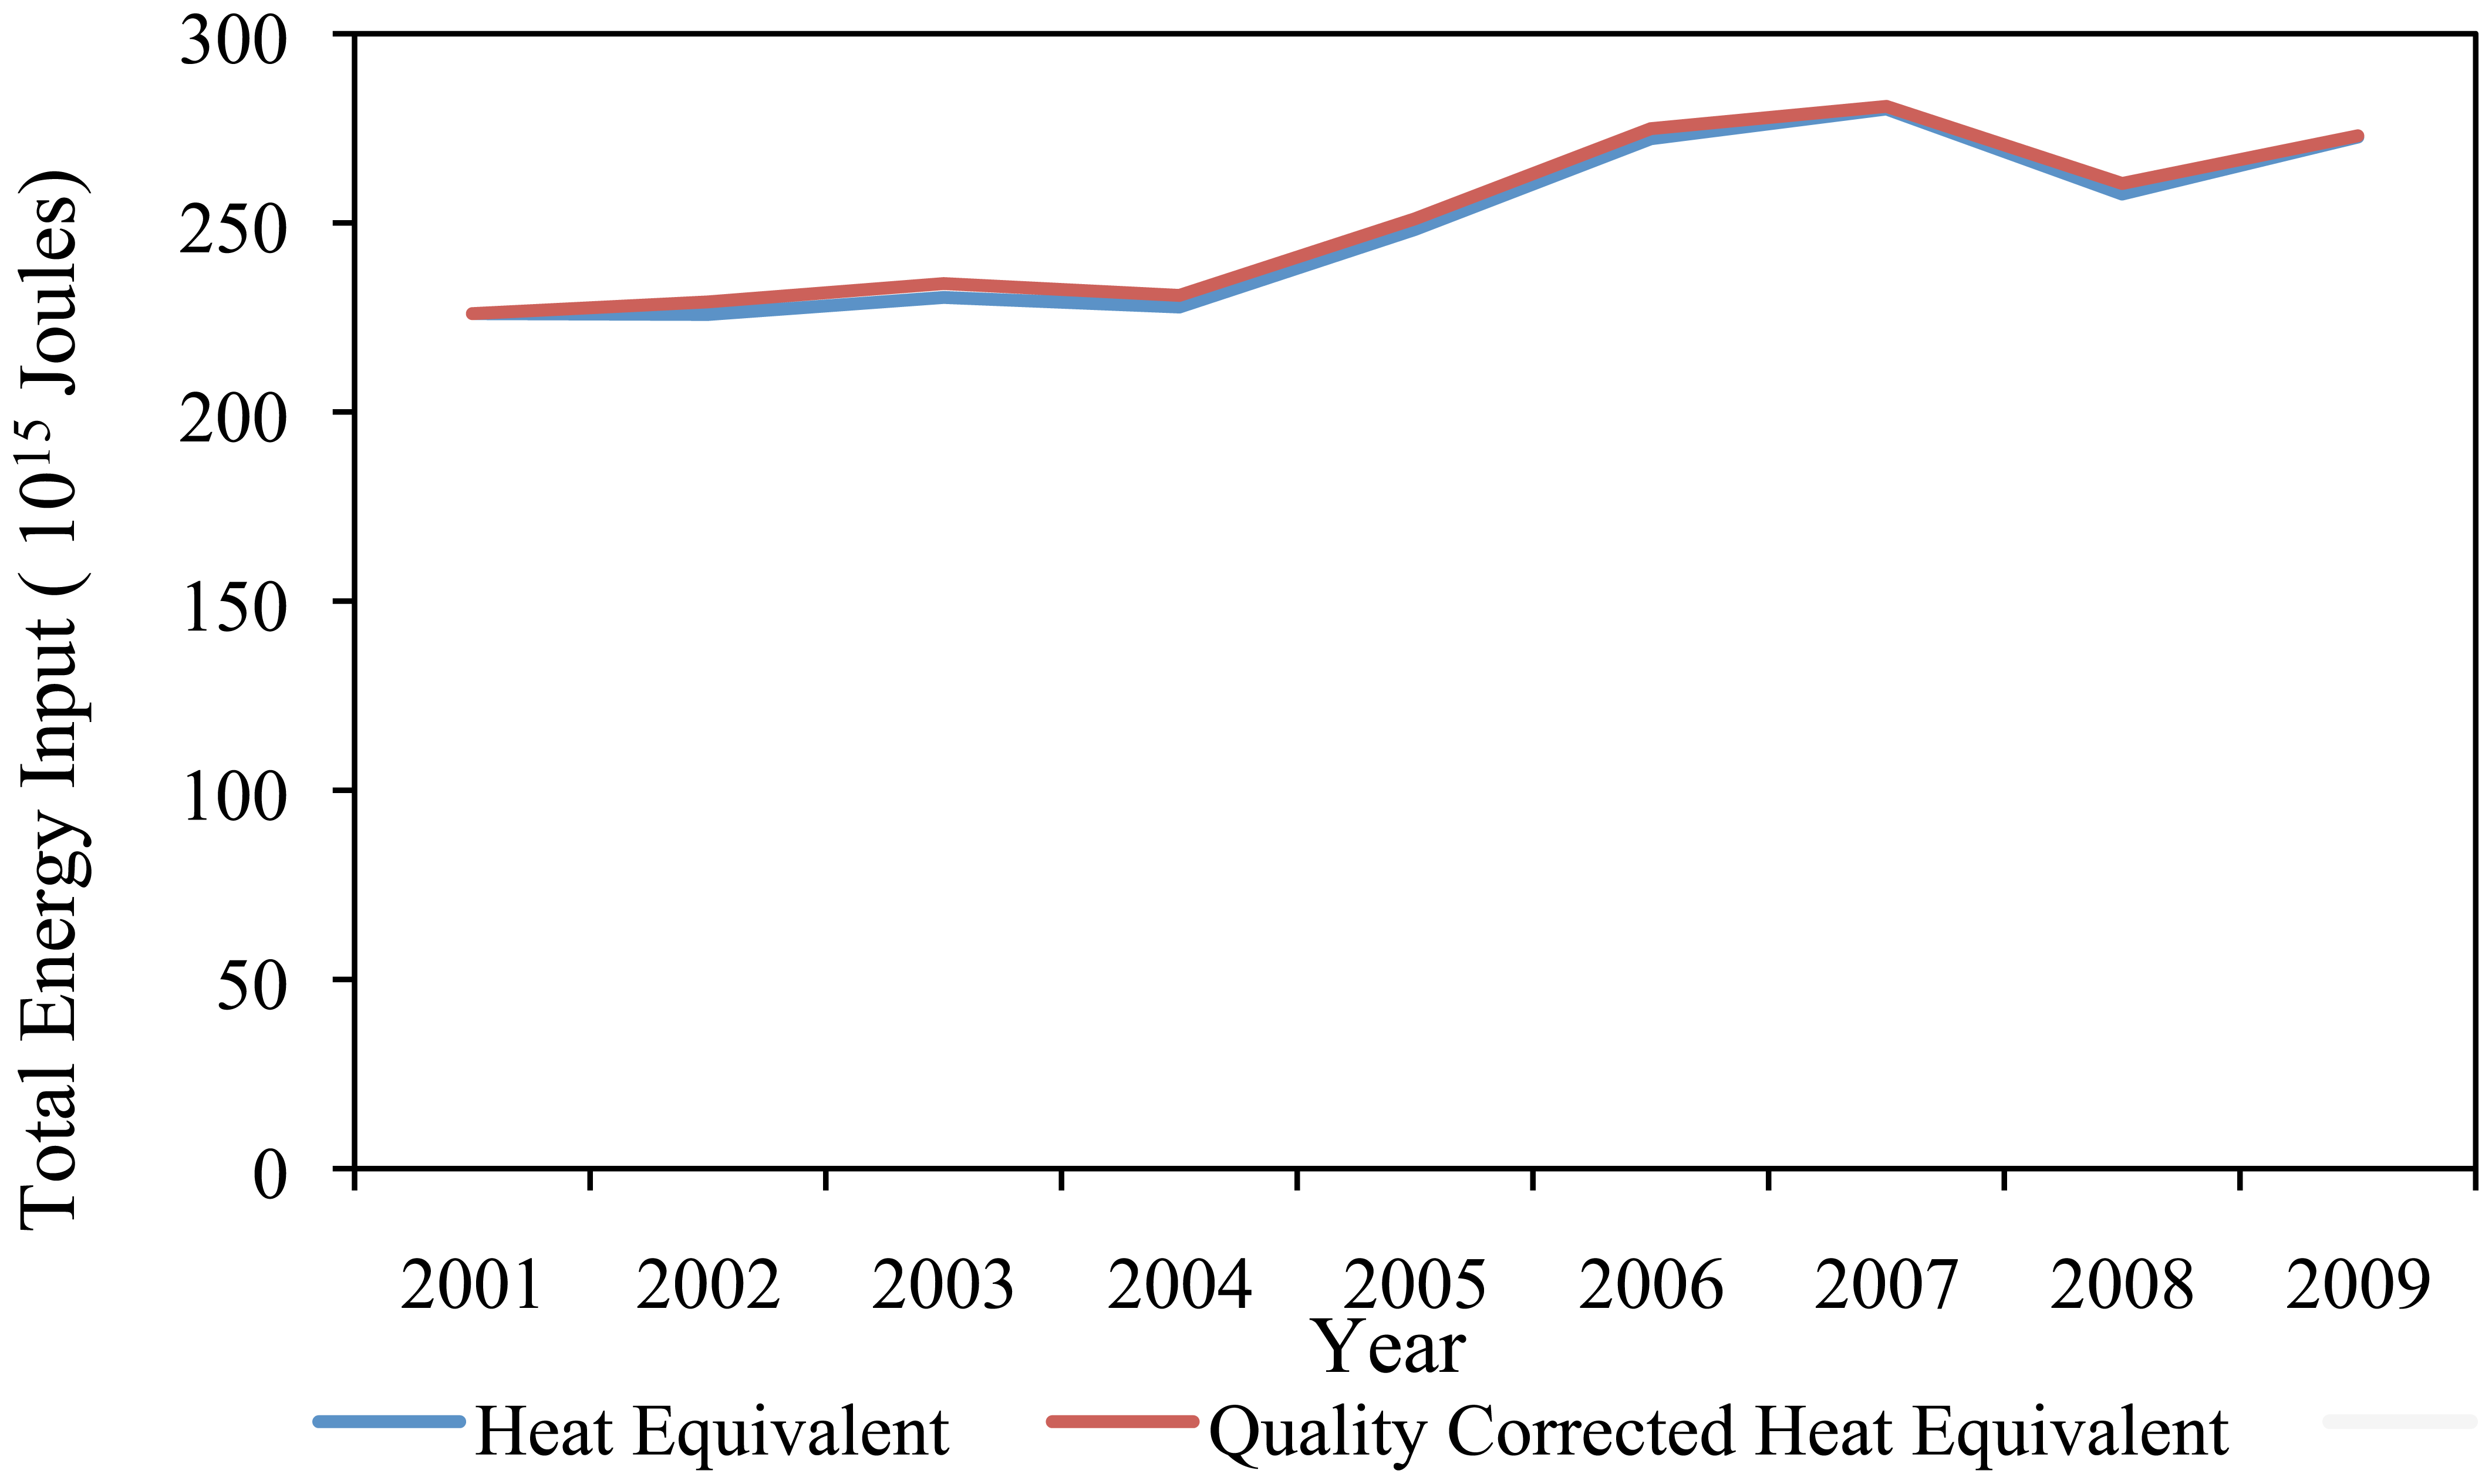
3.1.4. Total Energy Inputs
The second level of EROI analysis includes direct and also indirect energy inputs derived from financial data. These are operation costs, depreciation and expenses for producing oil and gas, which include some direct energy inputs (Table 3). These numbers are not published in a journal or book, but we were able to get them from the financial records of the company. The time series of the energy intensity of Chinese industry are used to convert financial data to joules. Quality-corrected heat equivalent total energy input is shown in Figure 7. There is only a small difference between quality corrected and non-corrected total energy input (or total energy input). This is because the quality difference is even smaller when we compare them with total energy input by heat equivalent (Figure 8).
3.2. Results
We estimate that the energy return on investment (EROIstud) for the Daqing oil field decreased from about 10:1 in 2001 to 6.5:1 in 2009 (Table 5 and Figure 9). The EROI derived in four different ways show the same decreasing trends, and EROI derived using heat equivalents is higher than when corrected for quality using the Divisia index. However, EROI expressed as heat equivalents changes less than when outputs and inputs are corrected for quality (Figure 9). In addition, when the indirect costs are not included, the EROI appears higher, which of course is an artifact of the incomplete analysis.
Most often, an EROI analysis is determined by the data available. Since the Daqing oil field does not publish data on pollution we cannot include environmental data as an energy input. For example, the Daqing oil field increases the pressure of the polymers pumped into the ground each year which has large negative impacts on the environment. If the negative externality upon the environment were to be considered, the EROI of the Daqing oilfield would be decreased substantially compared to the value that we present.
4. Discussion
Both ecosystems and human societies require energy flows, energy transformations and energy storages. However, different categories of energy vary in source and quality and they have fundamental differences in availability and value. The EROI method helps to connect conceptually the production capacity of both ecosystems and economic systems. If the EROI value reaches 1:1, it means this production activity is no longer energetically favorable—whether in an ecosystem or economic system. Although the EROI value of some energy extraction processes can reach 1:1, the production activity can only continue if subsidized by some other fuel. This appears the case for corn-based ethanol in the US.
The declining trend of the EROI of the Daqing oil field demonstrates that oil and gas extraction is becoming more and more difficult even for very large and relatively well-managed fields such as Daqing. The reason is principally that as fields age they require energy-intensive techniques, such as water and polymer injection under substantial pressure. The productivity of any oil field eventually declines regardless of other circumstances. The reasons for the decline are varied, but the important thing is that it seems that depletion of this oil field is a more powerful factor than technological improvements. Also, the reason for the decline in EROI is that while the production of Daqing decreased slowly, the investment of funds and energy increased almost linearly. This paper makes a simple prediction by extrapolating the output and input of Daqing oil field and concludes that the EROI is likely to continue declining over the next 5 years. We utilize the increasing rate of output and input as heat equivalent to make a linear extrapolation, to project the EROIstnd for the next 5 years (Figure 10). If the decline in EROI continues to follow the present rate, it will reach very low values within one to two decades. In contrast, the output of the Daqing oil field is supposed to be determined by the national plan, which calls for the continued production of 295.6 million barrels. We accept this for the moment, and, make another extrapolation, using this assumption but also assuming that input increased from 2001 to 2009. Then, the EROI declines even if oil production remains flat. Since production of this oil field has been under the control of government which takes great pride in its ability to manage it, the decline in production is rather an embarrassment. The decline in EROI only makes matters worse, but is consistent with what is happening with nearly all other fossil fuels, as seen in this special volume.
Net energy analysis related to EROI is of great importance, reflecting the amount of energy which can actually be delivered to society. We find that the net energy of Daqing oil field has the same trend as EROI, both of which are declining, at 3.7% per year (Figure 11). From the point of view of energy value, production will lose its significance if the net energy reaches zero, which would impact China's oil industry deeply. Hence, both continuously decreasing EROI and net energy output indicate that the Daqing oil field is suffering from serious challenges now and in the future.
Over the past five years, China's energy consumption increased 6.8% annually, which contributed to the development of the national economy, which has been growing at 11.4% each year. China's economy demands long-term reliable oil production into the future. According to forecasts [28], China's oil production will probably reach a peak in 2011, at 1450 million barrels. Thereafter, the development of China's economy may be severely constrained by the limitation of energy. As the largest oil field in China at present, the strategic objective of Daqing is sustainable and effective development to create an “evergreen enterprise” to continue to contribute to China's economic, political and social development by supplying plenty of oil. Nevertheless, the Daqing oil field is becoming of lower importance in the national oil supply as its share of total production dropped from 51.3% to 21.1% in 2009. The managers of the Daqing oil field should become fully aware of the warning index that EROI and net energy play, and then adjust to this reality.


| Level | Energy Inputs | Heat Equivalents | Quality-corrected Heat Equivalents |
|---|---|---|---|
| Level 1 | Direct energy inputs | EROI1, d | EROI11, Qd |
| Level 2 | Indirect energy inputs | EROIstnd | EROI1, Qstnd |
| Energy | Average Calorific Value |
|---|---|
| Crude Oil | 41.8 M joule/kg |
| Natural Gas | 38.9 M joule/cu. m |
| Raw Coal | 20.9 M joule/kg |
| Gasoline | 43.1 M joule/kg |
| Diesel | 42.7 M joule/kg |
| Electricity (in calorific value) | 36.0 M joule/kWh |
| Energy | Physical Unit to Coal Equivalent |
| Raw Coal | 0.7143 kgCE/kg |
| Total inputs (raw data) | Unit | As money (103 yuan) | |||
|---|---|---|---|---|---|
| operating costs | 11,390,080 | 103 yuan | 11,390,080 | ||
| depreciation | 10,625,160 | 103 yuan | 10,625,160 | ||
| expenses | 3,588,010 | 103 yuan | 3,588,010 | ||
| Total money input (MTotal) | 25,603,250 | ||||
| Direct inputs (raw data) | Unit | Price | Unit | As money (103 yuan) | |
| oil for self-use | 200.0 | 103 t | 1,558,012 | yuan/103 t | 312,070 |
| gas for self-use | 1.2 | 109 m3 | 920,000,000 | yuan/109 m3 | 1,130,680 |
| gasoline | 36.3 | 103 t | 303 | yuan/103 t | 11.0 |
| diesel | 62.1 | 103 t | 273 | yuan/103 t | 16.9 |
| electricity | 9.8 | 109 kwh | 571,700,000 | yuan/109 kwh | 5,596,371 |
| Direct money input (MDirect) | 7,039,149 | ||||
| Indirect money input (MIndirect=MTotal- MDtrect) | 18,564,101 | ||||
| Indirect input | Unit | As Energy |
|---|---|---|
| Indirect energy input | 103 ton of coal equivalent | 4,455 |
| Indirect energy input | 103 ton of raw coal | 6,236 |
| Indirect energy input(EIndirect) | 1015 J | 130.4 |
| 2001 | 2002 | 2003 | 2004 | 2005 | 2006 | 2007 | 2008 | 2009 | |
|---|---|---|---|---|---|---|---|---|---|
| EROI 1, d | 22.7 | 22.9 | 22.2 | 20.9 | 20.4 | 19.4 | 18.2 | 18.4 | 17.6 |
| EROI 1, Qd | 22.7 | 22.2 | 21.3 | 20.3 | 19.7 | 18.8 | 18.1 | 17.8 | 17.4 |
| EROI stnd | 10.0 | 9.7 | 9.2 | 8.9 | 8.0 | 7.0 | 6.5 | 6.9 | 6.5 |
| EROI 1, Qstnd | 10.0 | 9.6 | 9.1 | 8.8 | 7.8 | 6.9 | 6.5 | 6.8 | 6.4 |
Acknowledgments
This research has been supported by National Natural Science Foundation of China (No. 71073173).We are grateful to two friends at SUNY-ESF, David Murphy and Xiaoliang Yang and three anonymous reviewers who helped improve the manuscript substantially.
References and Notes
- Cottrell, W.F. Energy and Society: The Relationship Between Energy, Social Change, and Economic Development, McGraw-Hill, Book Company, New York, NY, USA, 1955.
- Odum, H.T. Environment, Power and Society, Wiley-Interscience, New York, NY, USA, 1971; p. 336.
- Hall, C.A.S.; Cleveland, C.; Berger, M. Yield per effort as a function of time and effort for United States petroleum, uranium, and coal. Energy and Ecological Modelling, Elsevier Scientific, Amsterdam, The Netherlands, 1981; pp. 715–724. [Google Scholar]
- Cleveland, C.J.; Costanza, R.; Hall, C.A.S.; Kaufmann, R. Energy and the U.S. economy: A biophysical perspective. Science. 1984, 255, 890–897. [Google Scholar]
- Murphy, D.J.; Hall, C.A.; Dale, M.; Cleveland, C. Order from chaos: A preliminary protocol for determining the EROI of fuels. Sustainability 2011, 3, 1888–1907. [Google Scholar]
- Cleveland, C.J. Net energy from the extraction of oil and gas in the United States. Energy 2004, 30, 769–782. [Google Scholar]
- Gagnon, N.; Hall, C.A.S.; Brinker, L. A preliminary investigation of energy return on energy investment for global oil and gas production. Energies. 2009, 2, 490–503. [Google Scholar]
- Lin, Z.; Lianyong, F. Is Peakoilism Coming? Energ.Policy 2009, 37, 2136–2138. [Google Scholar]
- U.S. Energy Information Administration. 2011. http://www.eia.gov/countries/cab.cfm?fips=CH(accessed on25 November 2011).
- Adams, F.G.; Miovic, P. On relative fuel efficiency and the output elasticity of energy consumption in Western Europe. J. Ind. Econ. 1968, 17, 41–56. [Google Scholar]
- Cleveland, C.J. Energy quality and energy surplus in the extraction of fossil fuels in the U.S. Ecol. Econ. 1992, 6, 139–162. [Google Scholar]
- Energy statistics department of national bureau of statistics of China. China Energy Statistical Yearbook; China Statistics Press: Beijing, China, 2009; pp. 3–15. [Google Scholar]
- Berndt, E.R. Aggregate energy, efficiency and productivity measurement. Annu. Rev. Energy. 1978, 3, 225–273. [Google Scholar]
- Berndt, E.R. Energy use, technical progress and productivity growth: A survey of economic issues. J. Prod. Anal. 1990, 2, 67–83. [Google Scholar]
- Brown, M.T.; Ulgiati, S. Energy quality, emergy, and transformity: H.T. Odum's contributions to quantifying and understanding systems. Ecol. Model 2004, 178, 201–213. [Google Scholar]
- Odum, H.T.; Peterson, N. Simulation and evaluation with energy systems blocks. Ecol. Model 1996, 93, 155–173. [Google Scholar]
- Trends in Oil Prices. International Petroleum Economic 2002, 10, 58.
- Trends on oil Prices. International Petroleum Economic 2003, 11, 57.
- Trends on oil Prices. International Petroleum Economic 2004, 12, 66.
- Trends on oil Prices. International Petroleum Economic 2005, 13, 65.
- Trends on oil Prices. International Petroleum Economic 2006, 14, 69.
- Oil Price Trends. International Petroleum Economic 2007, 7, 73.
- Oil Price and Related Index Trends. International Petroleum Economic 2008, 4, 92.
- Oil Price and Related Index Trends. International Petroleum Economic 2009, 7, 87.
- Trend of Oil Price and Relevant Indexes. International Petroleum Economic 2010, 2, 85.
- Trends in Oil Prices and Relevant Indices. International Petroleum Economic 2011, 6, 107.
- National Development and Reform Commission. http://www.sdpc.gov.cn/zfdj/default.htm(accessed on 25 November 2011).
- Lianyong, F.; Junchen, L.; Xiongqi, P. China's oil reserve forecast and analysis based on peak oil models. Energ. Policy 2008, 36, 4149–4153. [Google Scholar]
© 2011 by the authors; licensee MDPI, Basel, Switzerland. This article is an open access article distributed under the terms and conditions of the Creative Commons Attribution license (http://creativecommons.org/licenses/by/3.0/).
Share and Cite
Hu, Y.; Feng, L.; Hall, C.C.S.; Tian, D. Analysis of the Energy Return on Investment (EROI) of the Huge Daqing Oil Field in China. Sustainability 2011, 3, 2323-2338. https://doi.org/10.3390/su3122323
Hu Y, Feng L, Hall CCS, Tian D. Analysis of the Energy Return on Investment (EROI) of the Huge Daqing Oil Field in China. Sustainability. 2011; 3(12):2323-2338. https://doi.org/10.3390/su3122323
Chicago/Turabian StyleHu, Yan, Lianyong Feng, Charles C.S. Hall, and Dong Tian. 2011. "Analysis of the Energy Return on Investment (EROI) of the Huge Daqing Oil Field in China" Sustainability 3, no. 12: 2323-2338. https://doi.org/10.3390/su3122323