The Dynamics of Brownfield Redevelopment

Abstract
: Negligence of former industrial sites (“brownfields”) has adversely impacted urban landscapes throughout the industrialized world. Brownfield redevelopment has recently emerged as a sustainable land use strategy and impetus for urban revitalization. This study presents a system dynamics model of the redevelopment process that illustrates how delays compound before realizing financial benefits from investment in these core urban areas. We construct a dynamic hypothesis, in which brownfield redevelopment activities are dependent upon funding and in turn bolster tax base through job creation. Drawing on previous studies, barriers to brownfield redevelopment are explored, including fear of liability, regulatory concerns, and uncertain cleanup standards and funding mechanisms. We model a case study of redevelopment in the State of Michigan (USA), which is informed by data from the Department of Environmental Quality (MDEQ) and U.S. Conference of Mayors brownfield surveys. Stock-flow structures represent phases of redevelopment, with diverted streams for sites in which no contamination was found (false alarms) and those with excess contamination level. The model is used to examine the point at which cumulative tax revenues from redeveloped areas exceed cumulative expenditures on brownfield redevelopment under different levels of funding availability.1. Introduction
Negligence of former industrial sites due to real or perceived contamination has left scars upon the urban landscape of North America and European cities in the form of “brownfields” [1]. The U.S. Environmental Protection Agency (EPA) broadly defines brownfields as, “abandoned, idled, or under-used industrial and commercial facilities where expansion or redevelopment is complicated by real or perceived environmental contamination [2].” Similarly, the Comprehensive Environmental Response, Compensation, and Liability Act (CERCLA) of 1980 (42 U.S.C 9601, sect. 101) defined brownfields as, “…real property, the expansion, redevelopment, or reuse of which may be complicated by the presence or potential presence of a hazardous substance, pollutant, or contaminant [3].”
These definitions characterize a large number of properties as brownfields, since the severity (or even existence) of contamination is not specified. Brownfields tend to be located in core urban areas and industrial suburbs with long histories of traditional manufacturing [4], and include small commercial and residential lots such as gas stations and dry-cleaners that are suspected of contamination.
An aspect of urban revitalization that has garnered widespread political support is redevelopment of under-utilized brownfield sites that are often located in dilapidated but core urban areas [5]. In recent years, brownfield redevelopment has emerged as a sustainable land use strategy and one of several ways to address urban sprawl and promote economic development through new job creation [6-10]. Because of the complex ways in which processes such as site remediation, permitting, liability, funding, and economic viability are intertwined, studies have begun to argue for increased dynamicism in brownfield redevelopment policy models [1].
This research simulates dynamic behavioral modes of the redevelopment process to examine how factors such as liability and funding affect system outcomes. After exploring major barriers to brownfield urban redevelopment, we construct a system dynamics model to simulate how delays induced by phases of redevelopment shape the realization of costs and benefits associated with sustainable reuse of former industrial sites. The formalized model is designed for an application to the State of Michigan (USA), whose “aggressive brownfield redevelopment incentive programs may well put it at the forefront of brownfield redevelopment innovation nationally [11], pg. 7023.”
In many systems where long-term studies or experimental manipulations are expensive or infeasible, as with complex urban and economic systems, dynamic models have proven helpful for filling knowledge gaps, assisting in decision-making, and formulating policy [12]. Amidst a number of decision support systems for selecting and prioritizing brownfield redevelopment sites, only a few studies examine the complex dynamics of brownfields policy and redevelopment tradeoffs [13-16]. Other studies use system dynamics to focus on urban development and redevelopment issues [17-19].
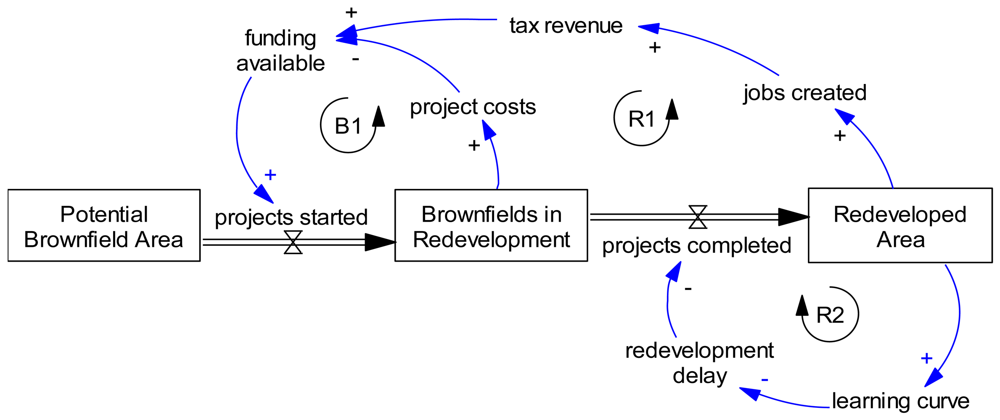
To frame this study, we outline a dynamic hypothesis of the brownfield redevelopment process, expressed as a causal map of the major feedback relationships among variables in the system [20]. The causal loop diagram illustrated in Figure 1 emphasizes the dependence of brownfield redevelopment on available funding. The stock of potential brownfields at left is reduced when availability of funding enables redevelopment to commence.
Because costs are incurred over time in proportion to the area in redevelopment, the stock of brownfields in redevelopment creates a balancing (B1) loop by diminishing available funding. Once projects are completed, tax benefits from jobs created on the stock of redeveloped land accrue, completing a reinforcing (R1) feedback loop through an increase in funds available. A second reinforcing loop (R2) may be triggered if the experience from redevelopment projects enables future projects to be streamlined in terms of shorter completion times. However, as discussed in the sections that follow, a number of barriers may act to further delay or stall redevelopment projects.
Background
Brownfield redevelopment is a regional endeavor to ameliorate historical problems that have troubled inner cities for decades. The failure to reuse and redevelop contaminated urban lands has become a major concern for many municipalities. Research on the dynamics of brownfield redevelopment emphasizes the need to shift redevelopment incentives away from “greenfields” (undeveloped sites at the urban periphery) and towards core urban brownfields.
Public awareness of the brownfield problem has grown as empirical estimates of the number of brownfields in the United States have expanded to between 500,000 and 1 million sites [21]. The mid-1980s saw a shift in planning and policymaking attention towards measures designed to improve the quality of life in urban areas by transforming underutilized land [22,23], with the US Environmental Protection Agency [24] aiming to “empower states, communities, and other stakeholders in economic development to work together in a timely manner to prevent, assess, safely clean up, and sustainably reuse brownfields.”
Although brownfields can be found almost anywhere, they commonly occur in the urban core areas of major cities. Observations of urban growth patterns across the nation have shown an exodus of capital and population away from major downtown areas during the last several decades [25]. Downtown areas of major industrial cities such as St. Louis and Detroit have suffered significantly as relocating entities settle in suburban greenfields which are easily cleared for new development and contain no actual or perceived contamination. For these historically industrial cities, brownfield redevelopment is one of several methods currently sought to revitalize the economic and environmental health and viability of the urban core [1].
U.S. law distinguishes between extremely contaminated sites and sites possibly contaminated with low levels of ordinary, non-hazardous waste. Hazardous sites are federally governed by CERCLA, and its 1986 amendments, the Superfund Amendments and Reauthorization Act (42 U.S.C. §9601 et seq.). CERCLA law taxed chemical and petroleum industries and provided broad Federal authority to respond directly to releases of hazardous substances that posed a threat to public or environmental health. Over five years (1980–1985), $1.6 billion was collected for a trust fund targeted at cleaning up abandoned or uncontrolled hazardous waste sites (commonly called the Superfund). A major goal of CERCLA is to initiate “long term remedial response actions that permanently and significantly reduce the dangers associated with releases or threats of releases of hazardous substances [3],” on the contaminated sites that comprise the National Priorities List (NPL). In 2002, approximately 1,300 Superfund sites were listed on the NPL, indicating that they contain toxic waste or dangerous heavy metals such as lead or mercury [4].
Most brownfield sites have relatively low levels of contamination when contrasted with Superfund sites. As such, most sites are not governed directly by CERCLA, but rather fall under the jurisdiction of state Superfund laws often modeled after CERCLA that contain similarly strict liability provisions [8]. Each state has different types of cleanup standards, procedures for identifying sites and provisions for apportioning liability.
2. Barriers to Brownfield Redevelopment
Studies of brownfield redevelopment highlight a critical conflict created by state and federal legislation [1]. While governments focus on revitalizing contaminated urban lands into areas that provide economic benefit the surrounding community, the same governments attempt to promote public health by enacting strict environmental regulations that increase liability risks for stakeholders interested in redeveloping a contaminated area. These sometimes contradictory goals slow revitalization in areas with questionable economic viability. Brownfield sites with even small amounts of contaminants may still be extremely challenging to remediate. Benefits of redeveloping brownfields take time to accrue, and are often discounted relative to immediate costs.
A survey of respondents from major American cities identified the most frequent barrier to brownfield redevelopment as lack of clean-up funds (87 percent of respondents), followed by the need for environmental assessments (61 percent), and liability issues (54 percent [9]). Both McCarthy [4] and Wernstedt [26] advocate governmental responsibility for rigorous studies of the future marketability of brownfield sites as well as social cost-benefit analyses of brownfield redevelopment alongside participatory dialogues with the community.
McCarthy [4] states that brownfield redevelopment presents a “dual policy challenge,” in that barriers to private-sector redevelopment of brownfields must be reduced while encouraging the connection of brownfield reuse to the broader goals of the community. This policy challenge requires recognizing and reducing uncertainties surrounding barriers to redevelopment such as liability provisions, cleanup standards (and challenges in carrying out environmental assessments), funding opportunities, and legal regulations [9]. Attempts to remove barriers to redevelopment must not conflict with protection of the environmental and economic health of local residents.
2.1. Liability Concerns
Stakeholders interested in redevelopment must be aware of the potential liability problems associated with a brownfield site. In the past, U.S. law (both federal and state) has held that anyone working with contaminated sites can be held liable for all cleanup costs, thus prompting business owners and potential developers to avoid abandoned industrial sites, even if contamination problems are relatively minor. Uncertainty regarding site ownership (ownership that is unknown, divided, etc.) further complicates the process of determining site cleanup liability. Liability concerns often lower site land values and divert capital away from brownfield areas, limiting prospects for redevelopment [1,27].
Liability as a disincentive for redevelopment has been well documented by the banking industry, where loan officers often require costly environmental assessments to ensure that by providing a mortgage the bank cannot be held liable under the same strict liability logic placed on other developers [28]. A 1990 American Bankers Association survey found that 62.5% of U.S. lending institutions had rejected loan applications solely because of the possibility of environmental liability [29]. Liability concerns have also forced many industrial site owners to stop placing old sites on the market in order to avoid discovery of contamination that might force them to initiate an expensive remediation program.
Under CERCLA (and similarly worded state laws), liability for property contamination may be imposed on the owner of property based solely on his or her status as property owner. U.S. common law imposes strict liability where a person undertakes an “ultra-hazardous” or “inherently dangerous” activity (Nurad, Inc. v. W.E. Hooper & Sons, Inc., 966 F.2d 837, 1191, 10th Cir. 1997). Courts have concluded that storage of hazardous substances can constitute an inherently dangerous activity. Therefore, under CERCLA, “a property owner may be held responsible for remediation of property even if the environmental condition was in existence prior to the current owner's purchase of the property ([28], pg. 10).” Concurrently, CERCLA imposes joint and several liability on individuals or entities identified as partial brownfield owners. This type of liability holds that where the conduct of two or more persons combines to create an indivisible harm, either defendant can be held responsible for the entire harm (Wisconsin Natural Gas Co. v. Ford, Bacon & Davis Construction Corp., 291 N.W.2d 825, Wis. 1980). Thus, the fear of liability surrounding brownfield redevelopment is compounded. An individual who may not have been responsible for contamination may be forced to assume the entire burden of the cleanup cost with no outside assistance. Two recent Supreme Court decisions, Burlington Northern and Santa Fe Railway Company, et al. v. United States (2009; 07-1601) and Shell Oil Company v. United States (2009; 07-160), have begun to chip away at several aspects of CERCLA's strict liability provisions.
Beginning in the 1990s, many state and federal agencies made attempts to mitigate the barrier of liability in brownfield redevelopment. The command and control logic that drives Superfund cleanups has been more recently replaced in brownfield programs with voluntary agreements backed by grants and tax credits. In these cases, funding is based on incentives rather than punitive liability schemes [30].
Many states have created State Voluntary Cleanup Programs (VCPs) intended to expedite assessment, remediation and redevelopment by allowing private parties to voluntarily investigate and remediate a property while receiving some level of protection from future state enforcement action [4,31]. On the federal level, the EPA has attempted to calm fears of federal action by entering into Superfund Memoranda of Agreement (MOAs) with individual states. MOAs create agreements to refrain from direct federal involvement at sites utilizing VCPs. The critical problem from a federal and state governmental perspective is achieving a liability balance which encourages redevelopment while ensuring that sites are adequately remediated and do not pose a danger to public and environmental health.
2.2. Complex Web of Regulation
Compliance with federal, state and local remediation regulations can involve substantial time and financial costs, thus creating another major barrier to redevelopment. This process is complicated by a lack of information or database integration among the different levels of regulatory oversight agencies. Most local and state Geographic Information System (GIS) programs have not integrated brownfield maps into their databases or websites [7,32]. In a survey of 231 cities, 57% indicated that they held brownfield redevelopment partnerships with their county or state governments [33]. These partnerships are not necessarily archived in any widely accessible database that would facilitate regional brownfield redevelopment. One suggested way of managing the complex, redevelopment regulatory framework is to establish local brownfield redevelopment authorities that could act as major points of contact for information and financial assistance [34,35]. However, disagreement exists as to whether or not this entity would function in the private or public sector [4].
2.3. Uncertain Cleanup Standards
Another major barrier to redevelopment is induced by unclear environmental remediation standards. State and federal regulators require remediation within thresholds of contamination that varies in accordance with the anticipated future use of the site. Sites whose future function will remain industrial may require less remediation than sites slated for residential or open space use by young children or other individuals that would be endangered by residual levels of contamination. For example, contaminated groundwater requires remediation to drinking water standards before it leaves the property and enters wells used for drinking, showering, and cooking [4]. The failure of state and federal agencies to determine widespread cleanup standards and the complex and interconnected legal nature of federal and state agency involvement in redevelopment coordination compound barriers to brownfield redevelopment.
2.4. Availability of Funding
The most frequently cited barrier to brownfield redevelopment is lack of funding, a constraint compounded by uncertainty surrounding the possible cost of environmental assessments and remediation [36,37]. Significant financial investment is required to remediate areas to the extent required by law [9,38]. Thus, many private investors require assistance from lending institutions, insurance firms and government agencies [4]. In fact, all 12 major federal brownfield revitalization programs reviewed by the Washington University in St. Louis [39] included new grant or loan programs to assist with brownfield redevelopment. Many individual state and local governments also attempt to provide grants, loans, loan guarantees and tax credits to stimulate redevelopment. Although redevelopment funding increased in the mid-1990s, so did the number and variety of funding organizations (e.g., state agencies, EPA, Department of Housing and Urban Development [HUD], etc.), thus increasing the complexity in securing multiple loans and grants for redevelopment.
More recent federal efforts include the 2001 passage of the Small Business Liability Relief and Brownfields Revitalization Act (Public Law 107–118), which provides support for state and local efforts to assess, remediate, and redevelop brownfields by redirecting more public and private resources towards redevelopment. State government involvement has also increased: between 1993 and 1998, state-level brownfield redevelopment programs grew from 14 to 44, with increasing emphasis on economic redevelopment following remediation [40]. Heightened complications in securing funds have also confronted investors in recent years as regulatory systems governing brownfield redevelopment vary throughout the country, making fund acquisition complicated from both a local and regional perspective.
Should redevelopment funds be focused on areas that suffer from higher contamination or should they be channeled specifically to brownfields in locations that are more economically viable? McCarthy [4] describes a common strategy in which redevelopment funds are channeled towards high profile brownfields with strong prospects for successful reuse in an attempt to trigger a “domino effect” of revitalization. However, this strategy neglects the large number of non-economically viable sites in dilapidated communities where many brownfields have little or no market value and negative images of crime drive a vicious cycle of economic hardship. This type of positive feedback has become prevalent in many cities such as East St. Louis, IL where negative perceptions surrounding crime and economic viability have caused an exodus of social and financial capital which, over time, has amplified negative perceptions of crime and economic hardship, leading to a further drain of capital [39].
The practice of avoiding the lowest market value parcels commonly excludes disadvantaged neighborhoods from redevelopment programs. This behavior may widen inequalities between wealthier and poorer neighborhoods thus undermine the basis of inner-city revitalization [41]. Given this situation, there are currently few strategies for remediating and redeveloping economically non-viable sites even if site redevelopment is socially desirable [41].
3. Michigan Brownfield Redevelopment Policy
The State of Michigan has led an aggressive environmental cleanup effort since the 1970s, spending more than $830 million to clean up contaminated brownfield sites [42]. Since 1995, numerous and extensive state policies have attempted to address many of the criticisms of federal brownfield redevelopment legislation. Several groups have argued that Michigan's redevelopment efforts and policies have established the state as a model for the country [11,43], and have created a viable real estate market for brownfield land [42]. Much of this redevelopment effort has occurred through a combination of brownfield tax credits, tax increment financing, site assessment services, and redevelopment grants and loans [11,43]. Hula [44] provides a thorough discussion of the numerous Michigan redevelopment policies and programs, categorizing these efforts into four parts that address the barriers described above: liability protection, increased reliance on voluntary/private action, flexible cleanup standards, and public funding.
In 1995, the State of Michigan passed major amendments to Part 201 of the Michigan Natural Resources and Environmental Protection Act (Act 451-1994-II-7-201), the State's primary environmental remediation statute, which defines brownfields and creates a full list of current brownfields in the State. In 2000, the Michigan legislature expanded the legal definition of brownfield to include “functionally obsolete” buildings in a set of Michigan core cities, leading to the possibility that a site may be treated as a brownfield, even in the absence of contamination [42].
The most fundamental contrast between Michigan and U.S. federal policy relates to liability provisions. Michigan deviates from federal liability treatment by requiring new owners of potential brownfields to perform baseline environmental assessments (BEAs) of existing site contamination levels. Figure 2 depicts historical data for the annual and aggregate BEAs requested in Michigan since the 1995 legislation. While former owners remain liable for this initial site contamination, new owners only assume liability for contamination beyond what is reported in the BEA. This updated stance on liability in Michigan's current law creates an affirmative responsibility of landowners to proactively identify and remediate contaminated sites. To avoid liability, new owners of potentially contaminated property in Michigan are required to perform a baseline environmental assessment (BEA) to gauge existing contamination levels of their property. An unexpected benefit of the BEA process has been identifying sites where contamination was less than anticipated, allowing these sites to be placed back on the private market [42]. The BEA process also provides liability protection with dramatically lower transaction costs than under Michigan's former, CERCLA-style legal framework.
The state also created alternative revenue streams for redevelopment including local brownfield authorities (BRAs) and the Clean Michigan initiative. BRAs are granted fiduciary powers to help redevelop sites, including the ability to capture tax increases from redevelopment and offer tax credits for redevelopment. In 1998, voters approved the Clean Michigan bond referendum, which directed $335 million towards brownfield remediation. MDEQ has taken action at nearly 1,800 sites. Although total expenditures are only reported cumulatively, the Michigan Department of Environmental Quality has identified a need of $90–100 million per year to provide a continuing level for the cleanup and redevelopment program that includes addressing orphan sites and redevelopment needs[45].
4. Modeling the Redevelopment Process
This section describes a model to represent central dynamics of the brownfield redevelopment process. The model simulates the process of redevelopment as it occurs through different phases and delays associated with brownfield remediation. The EPA delineates the brownfield redevelopment process according to three primary phases: (I) site assessment and due diligence, (II) site investigation, (III) development of remedy plan, remedy implementation, and redevelopment activities [46]. A simplifying assumption for the system dynamics model is that the development of a plan of remediation takes place during the Phase II site investigation. The brownfield remediation process is typically performed by environmental consulting agencies with experience in dealing with dangerous contaminants.
Phase I of brownfield redevelopment typically represents site assessment, involving an initial screening to explore owner records and site history, extent of contamination, and possible legal and financial risks. If no apparent contamination, health or environmental risks are found, redevelopment activities may begin immediately. If environmental engineering metrics reveal the site to contain extremely high levels of contamination, a reassessment of the project's viability may be necessary. Phase I site assessment also includes due diligence for “preliminary cost estimates for property purchase, engineering, taxation and risk management ([46], p. 8).” Due diligence further involves a study of the market viability of the proposed redevelopment project.
A Phase II site investigation involves chemical sampling of the site to improve understanding of the contamination. If this investigation reveals no significant sources of contamination, redevelopment activities may commence immediately. If the Phase II site investigation reveals a manageable level of contamination it is next possible to evaluate possible remedial alternatives. If no feasible remedial alternatives are found, the project's viability must again be reassessed. Otherwise, the next steps are to select an appropriate remedy, develop a remedy implementation plan, and implement it (Phase III).
The stock-flow structures in Figure 3 reveal an ‘aging chain’ structure for phases of redevelopment, with a sequence of stocks simulating a progression of states over time [20]. The process of brownfield redevelopment flows between stocks from left to right, with the undeveloped stock of brownfields at the left-most side of Figure 3. The structure in Figure 3 includes the reinforcing feedback effects outlined in Figure 1. The base run centers on the balancing loop B1, which operates by stopping new brownfield projects if no funding is available. Correspondingly, the base run in Figures 4–9 and sensitivity analysis in Figure 10 reflect the cascading delays of the aging chain stock-flow structure. Note that the reinforcing feedback loops R1 (plowback tax fraction) and R2 (learning curve) are only explicitly added and explored in the analyses presented in Figures10-14. The average duration of Phase I (site assessment) is two months. As the site assessment process addresses uncertainty about potential contamination, a rejection rate outflow is specified for sites that are too highly contaminated to address with the given resources, and for sites that are actually uncontaminated, ready for redevelopment without remediation.
Brownfields rejected from Phase I accumulate in a separate stock (Figure 3, top) of areas where contamination is too high for project stakeholders to manage. We assume that most (90%) of the brownfield area in Phase I continues on to Phase II (site investigation), over a delay time of 12 months. As with the outflows from Phase I, we also assume that the baseline rejection rate from Phase II is 5% for additional contamination found, as well as 5% for false alarms (no contamination found). The highly contaminated areas identified in Phase I and II are removed from the brownfield redevelopment process and potentially reclassified as Superfund sites. A delay time of 30 months is assumed for Phase III of brownfield redevelopment, which includes remedy plan development, remedy implementation, and redevelopment activities. Phase delay estimates are broadly consistent with the EPA's estimates [46].
Parameters for average site size and the initiation rate of brownfield redevelopment projects are based upon estimates from the MDEQ and from a recent survey of over 200 cities across the nation [9]. Because the parcel area of brownfield sites is not individually tracked in the MDEQ's Part 201 database, Adelaja et al.[11] divided the state into five regions, sampled the Part 201 database, and verified the area of 618 known brownfield sites from tax assessment data. The mean site area across this sample is 18 acres (7.28 ha), which we use as our average site size assumption. This figure is broadly consistent with national estimates of ∼13.9 acres/site (5.6 ha; [38]). The model is parameterized such that the BEA flow rate in Michigan (Figure 2) sets the pace for initiating brownfield redevelopment, so long as project funding is available. If the budget stock is greater than zero, the average site area is multiplied by the BEA rate to determine a constant flow of brownfield development.
Downstream rates of redevelopment are encoded using a 3rd order delay from the upstream flow. The outflow from Phase I is thus determined by the rate of project initiation offset by the delay associated with activities in that phase. Likewise, the outflow from Phase II is determined by its rate of inflow, offset by the 12-month delay associated with that phase. The ripple effects of this structure are evident in a base run of the stocks and flows associated with each phase of brownfield redevelopment. Figure 4 represents the area in each phase of redevelopment. Figure 5 illustrates the flow rates for completion of Phases I, II, and III, as well as the construction rate on clean sites.
The stock and flow dynamics simulated in Figures 4 and 5 demonstrate how a temporary constant flow of brownfield project initiation affects downstream phases of redevelopment. Toward the end of the 10-year (120-month) simulation horizon, another phase of project initiation begins. However, for most of the simulation, the new inflow valve is closed because so much funding is already allocated to brownfields in redevelopment that the budget is depleted and a deficit exists.
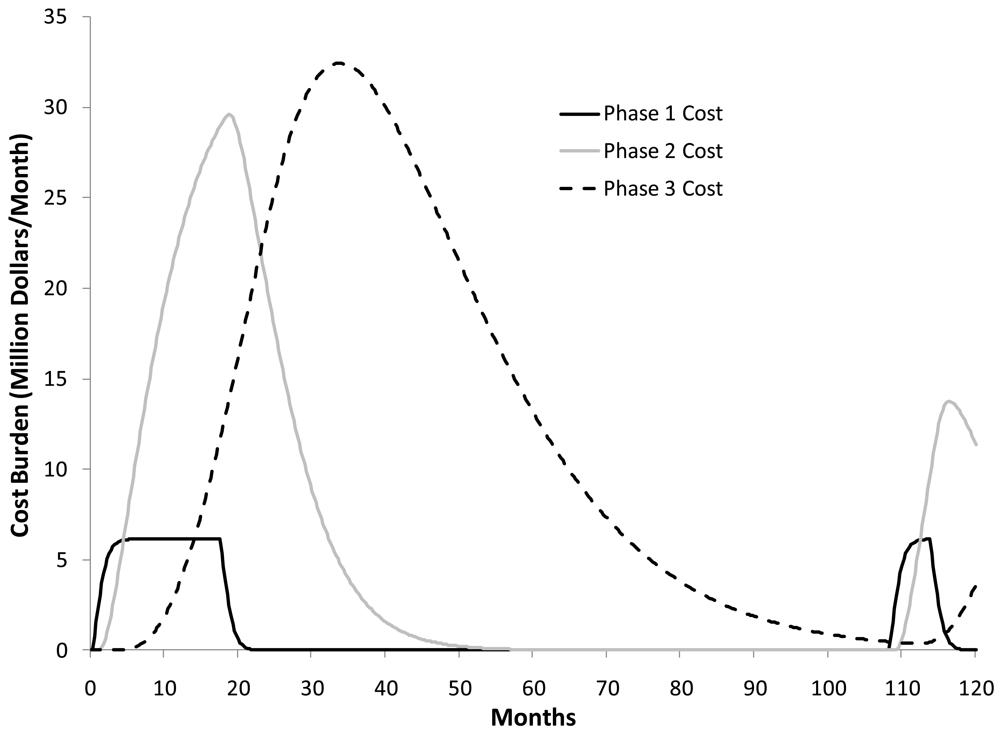
In this model, project cost is a proxy for liability concerns. Available funding thereby mitigates the liability of redevelopment. Estimated project costs are prorated over the expected project duration, as the sum of delays from Phases I, II, and III. Figure 6 shows how costs are incurred for brownfields in each of the three phases of redevelopment, allowing for a budget deficit so as to complete work on projects underway.
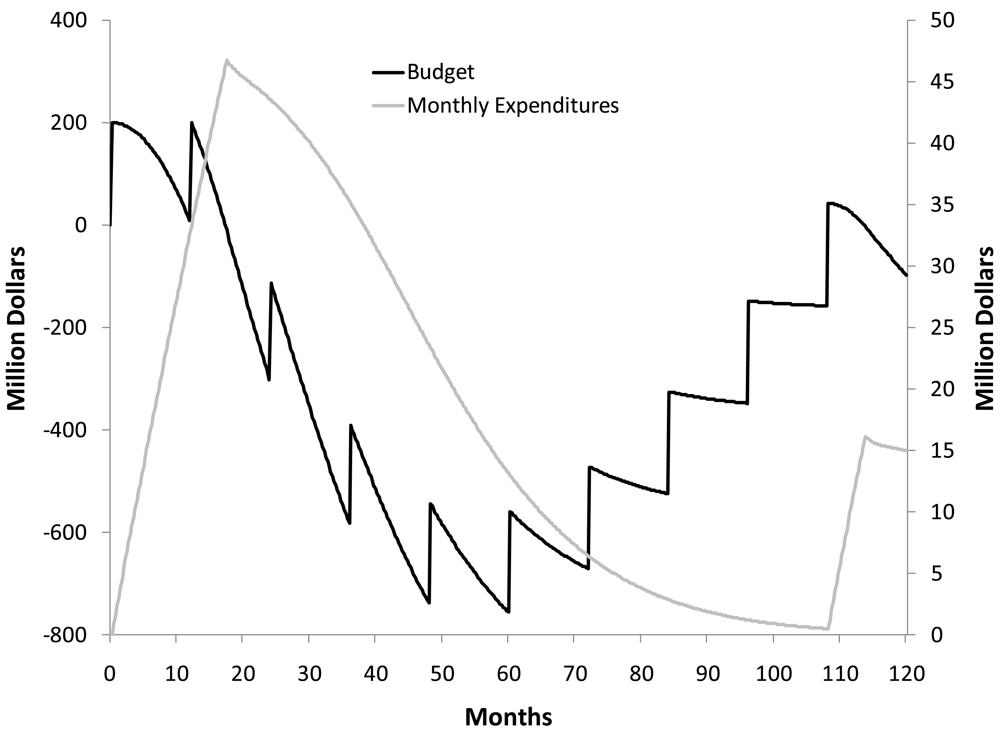
In the base run, the budget stock is replenished with an inflow of $200 million every 12 months, consistent with the federal 2001 Brownfields Revitalization and Environmental Restoration Act, but double the estimated $90–100 million annual brownfield funding for the state of Michigan. Even so, the dynamics in Figure 7 reveal that as expenditures are incurred during the period of redevelopment, the budget enters a deficit, preventing new projects from beginning.
Redeveloped property bolsters the tax base with jobs created from the redevelopment process. Specifically, redeveloped acres translate to job creation through a multiplier of 7.4 jobs per acre, derived from the US Conference of Mayors [9,38,47]. The average public cost per job created through redevelopment has been estimated at $14,000 by a number of studies [35,48-50]. Although this cost is a barrier, if jobs are sustained on the redeveloped land, governments collect tax revenues over time that offset the investment required.
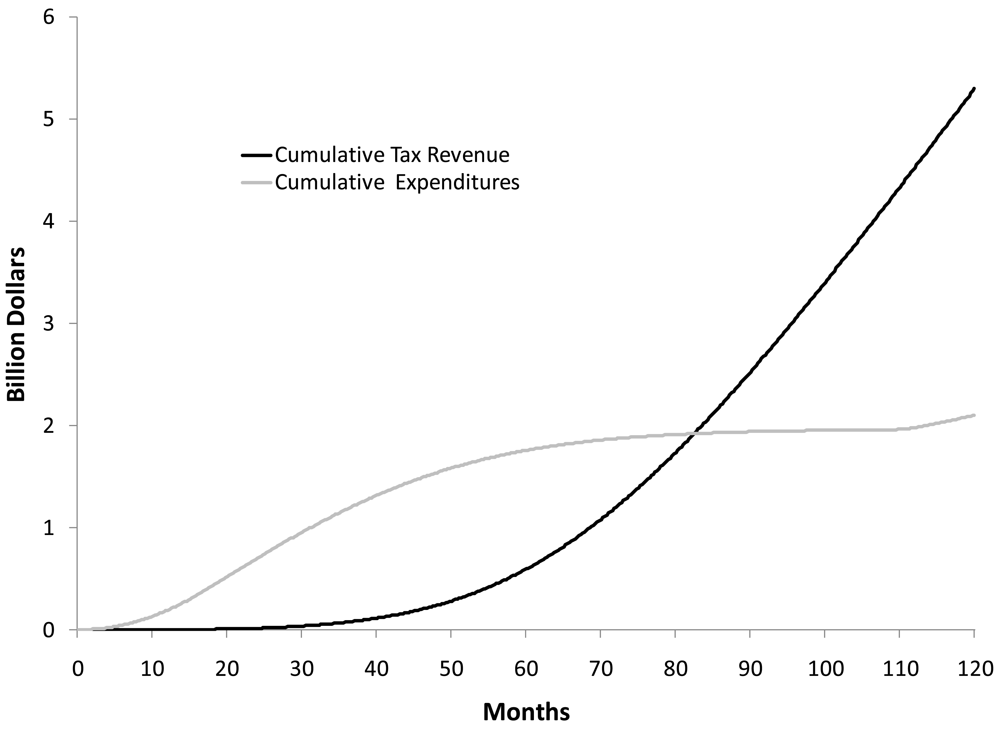
A growing number of jobs create a tax inflow based upon estimates of average tax revenue generated by brownfield redevelopment [9,38,47]. This inflow is integrated into the overall tax base. The impact of the brownfield redevelopment process on cumulative tax benefits and expenditures is illustrated in Figure 8. A breakeven point is realized where tax revenue exceeds cumulative expenditures. However, this juncture is not reached until after 82 months into the simulation, almost 7 years after the first projects began. As redeveloped area increases, the second-order effects evident in the slope of increasing tax revenues imply a shorter additional time (approximately 2 years) to double cumulative expenditures. These expenditures level off as projects are completed before the breakeven point, at which point revenues catch up with expenditures, as illustrated in Figure 8.
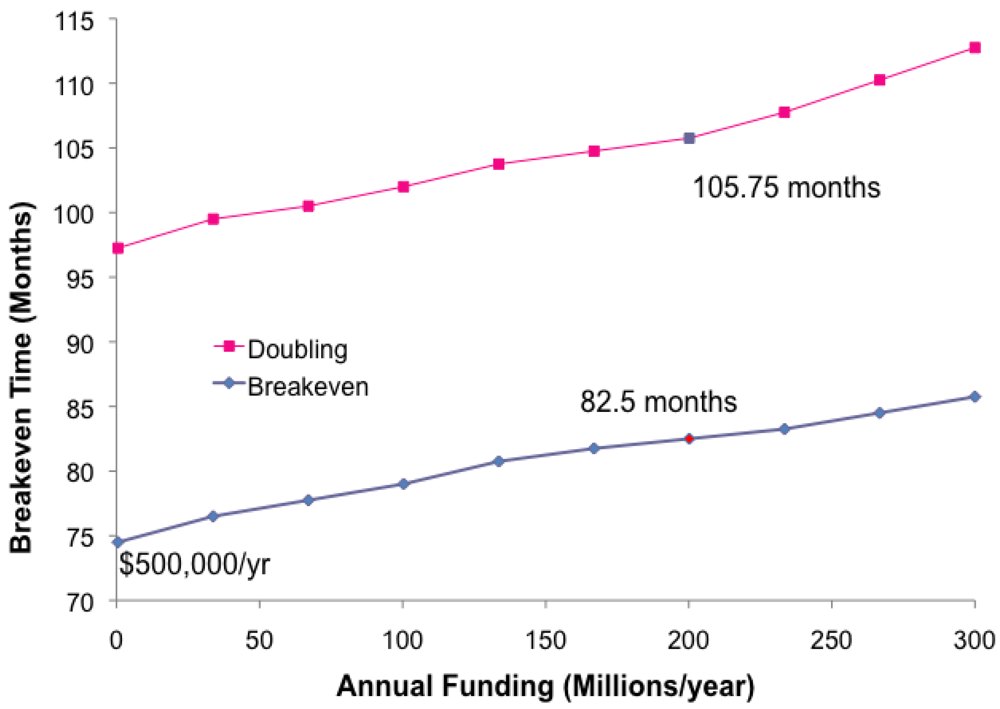
To examine the breakeven point, sensitivity tests are performed for variations in funding (Figure 9). Although the breakeven time occurs earlier for lesser amounts of annual funding, delays inherent in the redevelopment process still result in at least 6 years before simulated benefits begin to outweigh the costs, even when funding is reduced to $500,000/year (versus $200,000,000/year in the base run). Conversely, greater amounts of annual funding result in slightly longer delays to break even-nearly 86 months, just over 7 years, for annual funding at $300 million. This positive association between funding and time to breakeven is contingent upon the funding mechanism modeled. With a greater influx of funds, the budget stock takes longer to deplete, enabling the temporary, constant BEA rate of project initiation to continue for a longer period of time. Once a deficit is reached, the large number of projects in redevelopment induces costs over a period of time that extends the duration of the deficit beyond that of lesser-funded scenarios. Regardless of funding level, doubling time is consistently shorter than time to breakeven, highlighting the nonlinear accumulation of economic benefits from brownfield redevelopment projects.
The base run presented in Figures 4–8 above assumes that none of the tax revenue is returned to the budget, although the potential for so doing is analyzed in the breakeven analysis shown in Figure 9. Figure 10 below illustrates the range of outcomes from a sensitivity test of variation in the “plowback” fraction of tax revenue that is allocated to the budget of funding available for redevelopment. As the allocated tax fraction (TF) increases, the area redeveloped also increases, although effects diminish after a TF of 0.6. Non-zero TF values activate the reinforcing feedback (loop R1 in Figure 1) of funding from the delayed availability of redeveloped land, while the case of no taxes returned to the budget is equivalent to the base run, representing only the balancing feedback (loop B1 in Figure 1) during periods of deficit. While the plowback effect is significant, its impact does not register until a sizeable amount of land is put to productive use, thereby employing workers who contribute to the tax base. Note that the time scale in Figure 10 shifts to 20 years, double the horizon examined in the base run of Figures 4–8.
Because the variation in outcomes simulated in Figure 10 diminishes after a plowback tax fraction (TF) of 0.6, the TF range from zero to 0.6 was chosen for sensitivity testing of the plowback effect under a moderate learning curve. While the plowback effect is represented by reinforcing loop R1 in our causal map (Figure 1), the learning curve from experience with redevelopment is represented by loop R2. The results of this sensitivity testing in comparison with the base run, which completes loop B1, are illustrated in Figure 11 for a moderate learning curve in which project completion time is reduced according to a graphical function (scenario B in Figure 12) that maps experience to a reduction in redevelopment delay time.
While Figures 10 and 11 demonstrate effects upon the stock of land area redeveloped, Figure 12 demonstrates the effects that the learning curve and plowback fraction have upon the rate of brownfield project completion. Over the 20-year horizon, oscillations in the completion rate are apparent in the base run (TF 0), which reflects the balancing feedback (loop B1). An additional cycle is introduced with the learning curve effect (loop R2). Two more scenarios that include the plowback effect at TF 0.3 (loop R1) reach a higher steady state completion rate than those without plowback. The value at which these rates plateau is determined by the constant inflow of new brownfield redevelopment projects, approximated by the rate of BEAs received annually in the state of Michigan (see historical behavior in Figure 2). The results in Figure 12 demonstrate that the learning curve accelerates completion rate and that the plowback fraction increases completion capacity further via increased funding for redevelopment. Funding comes from both internal tax revenue and external funding, the latter simulated as annual inflows to the budget in the base run (see Figure 7).
The learning curve is specified using the graphical functions mapped in Figure 13. Normalized experience, plotted on the x-axis in Figure 13, is determined as the cumulative completion of projects that have passed through Phases 1, 2, and 3, scaled by a constant value (in this case 20,000 acres, which approximates the amount of redeveloped land at the end of 10 years for the base run). As normalized experience approaches one (and beyond), the learning curve impact on redevelopment delay time approaches a constant value: 0.595 (A), 0.475 (B), or 0.360 (C). This fraction is multiplied by the Phase 3 delay time (set to 30 months in the base run) to determine the rate at which projects are completed. The three scenario conditions defined in Figure 13 were selected to be qualitatively distinct from each other and to approach different constant values as experience accumulates.
Using the same legend for learning curves A, B, and C as depicted in Figure 13, Figure 14 contrasts simulation results for these different scenarios alongside a no learning scenario under a plowback effect in which the tax fraction (TF) returned to the budget is 0.3. These outcomes are contrasted with the base run. As introduced in our causal map (Figure 1), the base run reflects balancing loop B1, the learning curves correspond to reinforcing loop R2, and the plowback effect corresponds to loop R1. The impact of these differences in the effect of experience is primarily in the amplitude of the oscillation of redevelopment rates, although the strong learning curve (C) damps the oscillation by one cycle.
4. Discussion and Conclusions
Using system dynamics to model dimensions of brownfield redevelopment leads to promising avenues of research and policy analysis. Examples of these include the implementation of a municipally controlled land bank that would initiate brownfield redevelopment soon after a property underwent tax foreclosure (see [41,51] for more information). Models help to inform the debate on policies and funding mechanisms for brownfield redevelopment, bringing public and private stakeholders closer to a common goal of caring for urban spaces. This study outlines a conceptual framework and dynamic model of brownfield redevelopment that enables consideration of compounded delays from phases of the process, along with diverted redevelopment for sites found to be clean or too highly contaminated to be remediated with available resources. By representing redevelopment in the form of an aging chain, we seek to improve understanding about the momentum associated with the redevelopment process. Our emphasis on stock-flow dynamics, rather than feedback complexity, is consistent with studies of how these structures help to convey insight about system behavior to an audience of non-modelers [52,53].
Additional reinforcing and balancing feedback relationships from factors such as economic viability and liability concerns have been explored in earlier work simulating brownfield dynamics [54], but the model presented herein is simplified for the sake of transparency. The central tension developed in our model involves the delay between when expenditures are incurred, and when tax benefits accrue from redevelopment. For this purpose, the formalization focuses first on the balancing feedback highlighted in B1 as project costs are incurred, deplete available funding, and preclude new redevelopments from starting.
In the implemented model, areas found to be highly contaminated are relegated to a separate stock, and do not complete the redevelopment process. Extensions of this analysis might treat highly contaminated areas as potential ‘rework’ in need of additional treatment, and funds, before completing the redevelopment process. Such dynamics are frequent in project dynamics models, whereby elements of larger projects, already thought to be finished, are found to be defective and must be re-completed [55].
The model is formalized such that the budget stock can, and does, run a deficit as costs are project costs are incurred over the course of redevelopment, representing a commitment to completing redevelopment projects once they have begun. The existence of a deficit is consistent with the fiscal dilemma that states like Michigan have faced since enacting brownfield legislation in the mid-1990s. Because the purpose of the model is to improve understanding of the important delays impacting brownfield redevelopment dynamics, all stocks are initialized at zero. Non-zero initial values for redeveloped land, cumulative expenditures and revenues based upon empirical data for Michigan would render the breakeven analysis more plausible.
Project initiation approximates the rate of BEAs processed annually in Michigan (Figure 2), but is set to zero if the budget enters a deficit, consistent with the balancing feedback mechanism expressed in our dynamic hypothesis (loop B1 in Figure 1). Cumulative project expenditures are contrasted with cumulative tax revenue to assess the time to break even. With compounded delays based upon EPA redevelopment phase estimates, and additional time for construction on clean sites, breakeven time is 6–7 years across a range of annual funding levels.
After presenting the base run and breakeven analysis, we conducted several sensitivity tests under an extended simulation horizon to determine the impact of including reinforcing feedback effects to project starts (R1) and completions (R2) through tax revenue and learning, respectively. The plowback effect (R1) of increasing the tax fraction (TF) returned to the budget results in completion rates approximating the constant inflow of BEAs (Figure 2), so long as funding is available. Accelerated learning curves (R2) increase the amplitude of oscillation in the project completion rate.
Future brownfield modeling efforts at the scale of the municipality could examine losses to the tax base from household outmigration induced by the presence of brownfields in the area. In addition to job gains, redevelopment can slow or even reverse the exodus of people away from areas adjacent to former brownfield zones. Spatially explicit extensions of this research within a municipality could further examine the inverse reciprocal relationship between proximity to brownfields and economic viability of property. Further research should also consider the efficacy of representing brownfields with individual-based simulation techniques in which projects are geo-referenced and tracked throughout the redevelopment process. By studying the localized context of individual brownfields within a broad dynamic framework, municipalities enhance their capacity to respond to heterogeneous circumstances hindering redevelopment activity.
In spite of the flexibility offered by individual-based analysis, Hula and Bromley-Trujillo [42] argue that emphasis on the individual success of specific brownfield projects [56] overstates the overall impact of brownfield policies. They echo Simons and Jaouhari [57], who call for improved evaluative measures of brownfield program success. Bacot and O'Dell [58] argue that brownfield redevelopment success is signified by property values, contamination levels, and private investment levels. However, these factors do not reflect rates of site redevelopment or changes in site conditions over time.
Quantification of site-specific factors such as economic viability, marketability and liability (especially as discussed by Tam and Byer [6]) improves public and private evaluations of redevelopment projects. These quantifiable factors provide a means for calibrating models that capture more complex feedback dynamics than the model presented herein. Through simulation experiments, modeling enables testing of theories such as the dual-benefits of brownfield redevelopment for public and private stakeholders. Highlighting the tension between public and private perspectives, Adams et al. [1] note that the redevelopment “process becomes effective when it creates an institutional framework in which brownfield land is consistently seen as a source of strategic profit by the private sector and as a means of strategic policy delivery by the public sector.”
Connecting brownfield redevelopment with broader community goals is difficult because it involves intangibles and externalities that extend beyond the cost-benefit analyses often utilized in planning. The social costs and benefits of brownfield redevelopment relate to issues of environmental justice, environmental quality and regional land use—issues that local governments cannot completely control. The alignment of brownfield redevelopment with smart growth initiatives and sustainable planning strategies creates novel funding opportunities. By anticipating intangible and future benefits through simulation, policy makers can better channel limited funding for brownfield redevelopment.


References and Notes
- Adams, D.; De Sousa, C.; Tiesdale, S. Brownfield Development: A Comparison of North American and British Approaches. Urban Stud. 2010, 47, 75–104. [Google Scholar]
- EPA. Brownfields National Partnership Action Agenda; EPA 500-K-95-001; U.S. Environmental Protection Agency: Washington, DC, USA, 1995. [Google Scholar]
- EPA. CERCLA Overview; U.S. Environmental Protection Agency: Washington, DC, USA, 2003. [Google Scholar]
- McCarthy, L. The Brownfield Dual Land-Use Policy Challenge: Reducing Barriers to Private Redevelopment while Connecting Reuse to Broader Community Goals. Land Use Pol. 2002, 19, 287–296. [Google Scholar]
- Syms, P. Redeveloping Brownfield Land The Decision-Making Process. J. Property Invest. Finance 1999, 17, 481–500. [Google Scholar]
- Tam, E.K.L.; Byer, P.H. Remediation of Contaminated Lands: A Decision Methodology for Site Owners. J. Environ. Manag. 2002, 64, 387–400. [Google Scholar]
- Thomas, M.R. GIS-Based Decision Support System for Brownfield Redevelopment. Landsc. Urban Plann. 2002, 58, 7–23. [Google Scholar]
- Kirshenberg, S.; Fischer, W.; Bartsch, C.; Collaton, E. Brownfields Redevelopment: A Guidebook for Local Governments & Communities; International City/County Management Association: Washington DC, USA, 1997. [Google Scholar]
- US Conference of Mayors. Recycling America's Land: A National Report on Brownfields Redevelopment (Volume VI).; U.S. Conference of Mayors: Washington, DC, USA, 2006. [Google Scholar]
- De Sousa, C.; Wu, C.; Westphal, L.M. Assessing the Effect of Publicly Assisted Brownfield Redevelopment on Surrounding Property Values. Econ. Dev. Q. 2009, 23, 95–110. [Google Scholar]
- Adelaja, S.; Shaw, J.; Beyea, W.; McKeown, J.D.C. Renewable Energy Potential on Brownfield Sites: A Case Study of Michigan. Energ. Pol. 2010, 38, 7021–7030. [Google Scholar]
- Sterman, J.D. A Skeptic's Guide to Computer Models. In Managing a Nation: The Microcomputer Software Catalog; Barney, G.O., Kreutzer, W.B., Garrett, M.J., Eds.; Westview Press: Boulder, CO USA,, 1991; pp. 209–229. [Google Scholar]
- Bleicher, A.; Gross, M. Sustainability Assessment and the Revitalization of Contaminated Sites: Operationalizing Sustainable Development for Local Problems. Int. J. Sustain. Dev. World Ecol. 2010, 17, 57–66. [Google Scholar]
- Walker, S.B.; Boutilier, T.; Hipel, K.W. Systems Management Study of a Private Brownfield Renovation. J. Urban Plann. Dev. 2010, 136, 249–260. [Google Scholar]
- Chen, Y.; Hipel, K.W.; Kilgrou, D.M.; Zhu, Y. A Strategic Classification Support System for Brownfield Redevelopment. Environ. Model. Software 2009, 24, 647–654. [Google Scholar]
- Taylor, B.; Hipel, L.; Hipel, K.W.; Fang, L.; Heng, M. Preventing Future Brownfields: Engineering Solutions and Pollution Prevention Policies. Science and Technology for Humanity (TIC-STH), 2009 IEEE Toronto International Conference, Toronto, Canada, 26–27 September 2009; pp. 1030–1035.
- Forrester, J.W. Urban Dynamics; Pegasus Communications: Waltham, MA, USA, 1969. [Google Scholar]
- Shen, Q.; Chen, Q.; Tang, B.-S.; Yeung, S.; Hu, Y.; Cheung, G. A system dynamics model for the sustainable land use planning and development. Habitat Int. 2009, 33, 15–25. [Google Scholar]
- Emmi, P. Coupled Human-Biologic Systems in Urban Areas: Towards an Analytical Framework Using Dynamic Simulation. Proceedings of the 21st System Dynamics Conference, New York, NY, USA, 20–24 July 2003.
- Sterman, J. Business Dynamics: Systems Thinking and Modeling for a Complex World; Irwin/McGraw-Hill: New York NY, USA,, 2000. [Google Scholar]
- U.S. Government Accountability Office. Brownfield Redevelopment: Stakeholders Report That EPA's Program Helps to Redevelop Sites, but Additional Measures Could Complement Agency Efforts (GAO-05-94); U.S. Government Accountability Office: Washington, DC, USA, 2004. [Google Scholar]
- De Sousa, C. Contaminated Sites: The Canadian Situation in an international Context. J. Environ. Manag. 2001, 62, 131–154. [Google Scholar]
- De Sousa, C. Turning brownfields into green space in the City of Toronto. Landsc. Urban Plann. 2003, 62, 181–198. [Google Scholar]
- EPA. Brownfields Mission Statement; U.S Environmental Protection Agency: Washington, DC, USA, 2003. [Google Scholar]
- Platt, R. Land Use and Society: Geography, Law, and Public Policy (Revised Edition); Island Press: Washington, DC, USA, 2004. [Google Scholar]
- Wernstedt, K. Gauging the Outcomes of US Brownfield Revitalisation: A Review of the Impacts. J. Urban Regener. Renew. 2009, 3, 316–232. [Google Scholar]
- Sigman, H. Environmental Liability and Redevelopment of Old Industrial Land (Working Paper 200609); Rutgers University: New Brunswick, NJ, USA, 2009. [Google Scholar]
- Rafson, H.J.; Rafson, R.N. Brownfields: Redeveloping Environmental Distressed Properties; McGraw Hill: New York NY, USA, 1999. [Google Scholar]
- Byrne, J.J.; Greco, T.J. Superfund Reform Needed to Keep Credit Flowing. American Banker 1994, 22. [Google Scholar]
- U.S. Government Accountability Office. Superfund: EPA's Use of Funds for Brownfield Revitalization; GAO\RCED-98-87; GAO: Washington, DC, USA, 1998. [Google Scholar]
- Wright, J.G. Risks and Rewards of Brownfield Redevelopment; Lincoln Institute of Land Policy: Cambridge, MA, USA, 1997. [Google Scholar]
- Hayek, M.; Novak, M.; Arku, G.; Gilliland, J. Mapping Industrial Legacies: Building a Comprehensive Brownfield Database in Geographic Information Systems. Plann. Pract. Res. 2010, 25, 461–475. [Google Scholar]
- US Conference of Mayors. Recycling America's Land: A National Report on the Status of Brownfields (Volume III); U.S. Conference of Mayors: Washington, DC, USA, 2000. [Google Scholar]
- Borak, D.; Meek, C. Putting the Pieces Together; International City/County Management Association: Washington, DC, USA, 1999. [Google Scholar]
- Pepper, E. Lessons from the Field: Unlocking Economic Potential with an Environmental Key; Northeast-Midwest Institute: Washington, DC, USA, 1997. [Google Scholar]
- Simons, R. Creative Refinancing of Brownfield Sites. In Brownfields: A Comprehensive Guide to Redeveloping Contaminated Property; Davis, T.S., Ed.; American Bar Association: Washington, DC, USA, 2002. [Google Scholar]
- Simons, R.A. Turning Brownfields into Greenbacks: Developing and Financing Environmentally Contaminated Urban Real Estate; Urban Land Institute: Washington, DC, USA, 1998. [Google Scholar]
- US Conference of Mayors. Recycling America's Land: A National Report on Brownfields Redevelopment (Volume VII); U.S. Conference of Mayors: Washington, DC, USA, 2008. [Google Scholar]
- Interdisciplinary Environmental Clinic, Brownfield Programs: Federal, Illinois and Missouri Tools for Revitalization; Prepared by the Washington University in St. Louis for East-West Gateway Coordinating Council: St. Louis, MO, USA, 2003.
- Jones, R.; Welsh, W.F. Michigan Brownfield Redevelopment Innovation: Two Decades of Success; Michigan Department of Natural Resources and Environment: Lansing, MI, USA, 2010. [Google Scholar]
- Leigh, N.G. Promoting More Equitable Brownfield Redevelopment: Promising Approaches for Land Banks and Other Community Land Development Entities; WP00NL2; Lincoln Institute of Land Policy: Cambridge, MA, USA, 2000. [Google Scholar]
- Hula, R.; Bromley-Trujillo, R. Cleaning up the Mess: Redevelopment of Urban Brownfields. Econ. Dev. Q. 2010, 24, 276–287. [Google Scholar]
- MEDC Community Assistance. Brownfield Redevelopment; Michigan Economic Development Corporation: Lansing, MI, USA, 2010. [Google Scholar]
- Hula, R. An Assessment of Brownfield Redevelopment Policies: The Michigan Experience; PricewaterhouseCoopers Endowment for the Business of Government: Washington, DC, USA, 1999. [Google Scholar]
- MDEQ. A MDEQ Report on the: Environmental Protection Bond Fund, Cleanup and Redevelopment Fund, Clean Michigan Initiative Bond Fund; Michigan Department of Environmental Quality: Lansing, MI, USA, 2009. [Google Scholar]
- EPA. Technical Approaches to Characterizing and Redeveloping Brownfields Sites: Municipal Landfills and Illegal Dumps (EPA/625/R-02/002); National Risk Management and Research Laboratory, Technology Transfer and Support Division: Cincinnati, OH, USA, 2002. [Google Scholar]
- US Conference of Mayors. Recycling America's Land: A National Report on Brownfields Redevelopment (Volume IV); U.S. Conference of Mayors: Washington, DC, USA, 2003. [Google Scholar]
- Gilliland, E. Brownfield Redevelopment: Performance Evaluation; Council for Urban Economic Development: Washington, DC, USA, 1999. [Google Scholar]
- US Conference of Mayors. Recycling America's Land: A National Report on Brownfields Redevelopment (Volume II); U.S. National Conference of Mayors: Washington, DC, USA, 1999. [Google Scholar]
- US Conference of Mayors. Brownfield Redevelopment: A Compendium of Case Studies (Volume 1); US Conference of Mayors: Washington, DC, USA, 2004. [Google Scholar]
- Betancur, J.; Leachman, M.; Miller, A.; Walker, D.; Wright, P. Development without Displacement Task Force Background Paper; The Chicago Rehab Network: Chicago, IL, USA, 1995. [Google Scholar]
- Homer, J.B. Structure, Data, and Compelling Conclusions: Notes from the Field. Syst. Dynam. Rev. 1997, 13, 293–309. [Google Scholar]
- Sweeney, L.B.; Sterman, J.D. Bathtub dynamics: initial results of a systems thinking inventory. Syst. Dynam. Rev. 2000, 16, 249–286. [Google Scholar]
- BenDor, T.; Metcalf, S. Conceptual Modeling and Dynamic Simulation of Brownfield Redevelopment. Proceedings of the 23rd International System Dynamics Conference, Boston, MA, USA, 17–21 July 2005.
- Ford, D.; Sterman, J. Overcoming the 90% Syndrome: Iteration Management in Concurrent Development Projects. CERA 2003, 11, 177–186. [Google Scholar]
- EPA. Brownfield Success Stories; U.S. Environmental Protection Agency: Washington, DC, USA, 2010. [Google Scholar]
- Simons, R.; Jaouhari, A.E. Local government intervention in the brownfields arena. Econ. Dev. Comment. 2001, 25, 12–18. [Google Scholar]
- Bacot, H.; O'Dell, C. Establishing indicators to evaluate brownfield redevelopment. Econ. Dev. Q. 2006, 20, 142–161. [Google Scholar]
© 2011 by the authors; licensee MDPI, Basel, Switzerland. This article is an open access article distributed under the terms and conditions of the Creative Commons Attribution license (http://creativecommons.org/licenses/by/3.0/).
Share and Cite
BenDor, T.K.; Metcalf, S.S.; Paich, M. The Dynamics of Brownfield Redevelopment. Sustainability 2011, 3, 914-936. https://doi.org/10.3390/su3060914
BenDor TK, Metcalf SS, Paich M. The Dynamics of Brownfield Redevelopment. Sustainability. 2011; 3(6):914-936. https://doi.org/10.3390/su3060914
Chicago/Turabian StyleBenDor, Todd K., Sara S. Metcalf, and Mark Paich. 2011. "The Dynamics of Brownfield Redevelopment" Sustainability 3, no. 6: 914-936. https://doi.org/10.3390/su3060914
APA StyleBenDor, T. K., Metcalf, S. S., & Paich, M. (2011). The Dynamics of Brownfield Redevelopment. Sustainability, 3(6), 914-936. https://doi.org/10.3390/su3060914