1. Introduction
The Intergovernmental Panel for Climate Change (IPCC) Fourth Assessment Report [
1] established with very high confidence that anthropogenic intervention is forcing a change in the climate, such as Green House Gas (GHG) emissions at the current rate will increase the global mean temperature by 2.8 C by the end of 21st century. Another impact of increased GHG emissions, and subsequent global warming, is expected to be on the increased intensity of hurricanes by a factor of 8% to 16% during the 21st century [
2]. While it is generally expected that the increased intensity of hurricanes will cause higher economic and societal damage where the hurricanes would make landfalls, it is not yet known how much more damage would occur. In fact, the challenge of estimating a damage function from increased intensity of hurricanes is a controversial topic. For example, in the aftermath of hurricane Katrina and a rather destructive hurricane season in 2005, the journal Nature published an interesting debate between Pielke Jr. [
3] and Emanuel [
4]. Pielke Jr. [
3] takes a rather strong position in arguing for a non-significant upward trend in the “normalized” damages from hurricanes during the 20th century. Based on earlier analyses [
5,
6], Pielke Jr. [
3] argues that inflation adjusted damages from hurricanes can be de-trended by normalizing them with increases in population and wealth. More formally, it is proposed that normalization of hurricane damages should be undertaken as suggested in Equation (1):
![Sustainability 04 00917 i001]()
Equation (1) makes two major assumptions in “normalizing” the damages: First, damages from hurricanes are monotonically increasing functions of population and wealth. Second, population and wealth changes are given equal weights in normalizing the damages. It is hypothesized in this paper that both of these assumptions are not tenable and may lead to an incorrect “normalization” of damages. It is argued that normalization of damages should only be adjusted for inflation, as suggested in Equation (2):
![Sustainability 04 00917 i002]()
Following the normalization proposed in Equation (2), it is possible to construct statistical and structural models for testing the two assumptions made by Pielke and Landsea [
5,
6]. Furthermore, the revised normalization proposed in Equation (2) enables forecasting the normalized damages in the face of changing intensities of hurricanes (due to global warming as suggested by Emanuel [
4]), and changing socio-economic and demographic conditions. Most importantly, it enables assessing the structural weights of not only population and wealth effects on damages rather other social and demographic effects (e.g., housing, agricultural land cover, population configuration) can also be assessed and weighted. A long term structural assessment is important from two aspects: (1) Forecasting the hurricane damages in the 21st century if we continue with “business as usual” scenario, such as IPCC’s A1 scenario family; (2) Forecasting hurricane damages in the 21st century if we adapt through various policy & planning interventions and behavioral changes.
While global coastal communities will very likely be exposed to a range of socio-economic impacts from unmitigated global climate change, such as sea level rise, flash floods, and heat waves [
8], this paper is limited in its scope to measuring the impact of increased intensity of hurricanes in the Atlantic and Gulf coastal regions of the U.S., as observed in the 20th century. Such assessment is aimed at establishing a baseline case of spontaneous adaptation under current Land Use and Land Cover (LULC) trends. This baseline case, in turn, could be compared with alternate scenarios of planned adaptation through policy driven changes in LULC as suggested by Kelly and Adger [
9] and Adger
et al. [
10]. In this broader context of climate change adaptation policy development, the scope of this paper is delimited to estimating economic damage functions from increased intensity of hurricanes conditional upon LULC developments in the coastal communities and other natural variability. It is hypothesized that adaptation in the form of policy driven caps on the growth rates of housing densities and agricultural land use in the coastal areas vulnerable to hurricane damages could lead to significantly reduced damages from 8% to 16% more intense hurricanes expected to make landfall in the 21st century. This study thus quantifies the adaptation effects of potentially policy driven caps on housing densities and agricultural cover in coastal (and adjacent inland) areas vulnerable to hurricane damages in the Atlantic and Gulf Coastal regions of the U.S. Time series regressions, especially Prais-Winston and Autoregressive Moving Average (ARMA) models, are estimated to forecast the economic impacts of hurricanes of varying intensity, given that various patterns of LULC emerge in the Atlantic and Gulf coastal states of the U.S. The Prais-Winston and ARMA models use observed time series data from 1900 to 2005 for inflation adjusted hurricane damages and socio-economic and land-use data in the coastal or inland regions where hurricanes caused those damages. Next
Section 2 presents detailed information about empirical data and the research methodology.
Section 3 presents results and their interpretations.
Section 4 discusses the limitations and prospects of this modeling approach
vis-a-vis other socio-economic impact assessment approaches.
Section 5 presents the implications of the study findings for land-use adaptation to climate change in the broader public policy and planning context.
2. Data and Research Methodology
This study uses hurricane damages data for one hundred and five years (1900–2005) [
11]. A portion of the same damage data from 1926–1995 has been initially analyzed by Pielke Jr. and Landsea [
5]. As mentioned earlier, their analysis focused on normalizing the damages by inflation, wealth and population indices. Pielke Jr. and Landsea [
5] found that the normalized damages from hurricanes have neither increasing nor decreasing trend during the 1926–1995 period. Same “normalized” data was employed by Katz [
12] in a Poisson regression model to model changes in the incidence rates of land-falling hurricanes and a log normal model to predict changes in the normalized damages when hurricanes make landfalls. The authors of both of these studies, however, did not use the hurricane damage data to predict the expected damages that are conditional upon changes in the intensity of the hurricanes, as well as land-use, societal and economic changes, such as population density, housing densities, and agricultural land cover. It should be noted that the Landsea Hurricane damages data follows a heuristic of doubling insurance losses, which may not be true and thus may induce a measurement error. Due to non-standard data collection procedures in the first half of the 20th century, the hurricane damage data in the initial fifty to sixty years may contain higher measurement error than the latter half of the series. Further, Landsea damages data does not include fatalities, social costs, ecological costs and other indirect damages from hurricanes.
Socio-economic data about the housing and population densities of the affected areas as well as % agricultural cover was derived from U.S. census data. Since the census data is measured on a decadal time-scale, linear interpolation method was used to derive annualized estimates for socio-economic variables of interest. SST Nino, which refers to observed Sea Surface Temperature variability at intra-decadal time-scale, is derived from a National Climate Center database. It is included in the models because Katz [
12] and Pielke Jr. and Landsea [
6] hypothesized that normalized damages increase in La Nina years and decrease in El Nino years.
Table 1 presents descriptive statistics of the annualized time series data from 1900 to 2005. This table shows that annual damages from hurricanes in U.S. Atlantic and Gulf coasts averaged US$2937.73 Million, which ranged from 0% to 0.99% as a proportion of the U.S. Fixed Reproducible Tangible Wealth (FRTW). Annual damages per square mile of the affected area averaged US$0.42 Million. On average, 1.62 hurricanes made landfall every year with an average intensity of 1.71 (on Safire Simpson (SS) Scale). Annually, 13,079.13 Square Miles of land were affected by land-falling hurricanes, which affected on average 2.46 million people. Average annual population density affected by hurricanes is about 182 persons/square mile. On average, 1.01 million houses get affected by landfalling hurricanes every year, which means average annual housing density affected by hurricanes is about 66 houses/square mile. About 31.07% of the total affected land is agricultural.
Figure 1 shows annual damages from hurricanes in 2005 US $ Millions. This figure shows an upward trend in annualized damages.
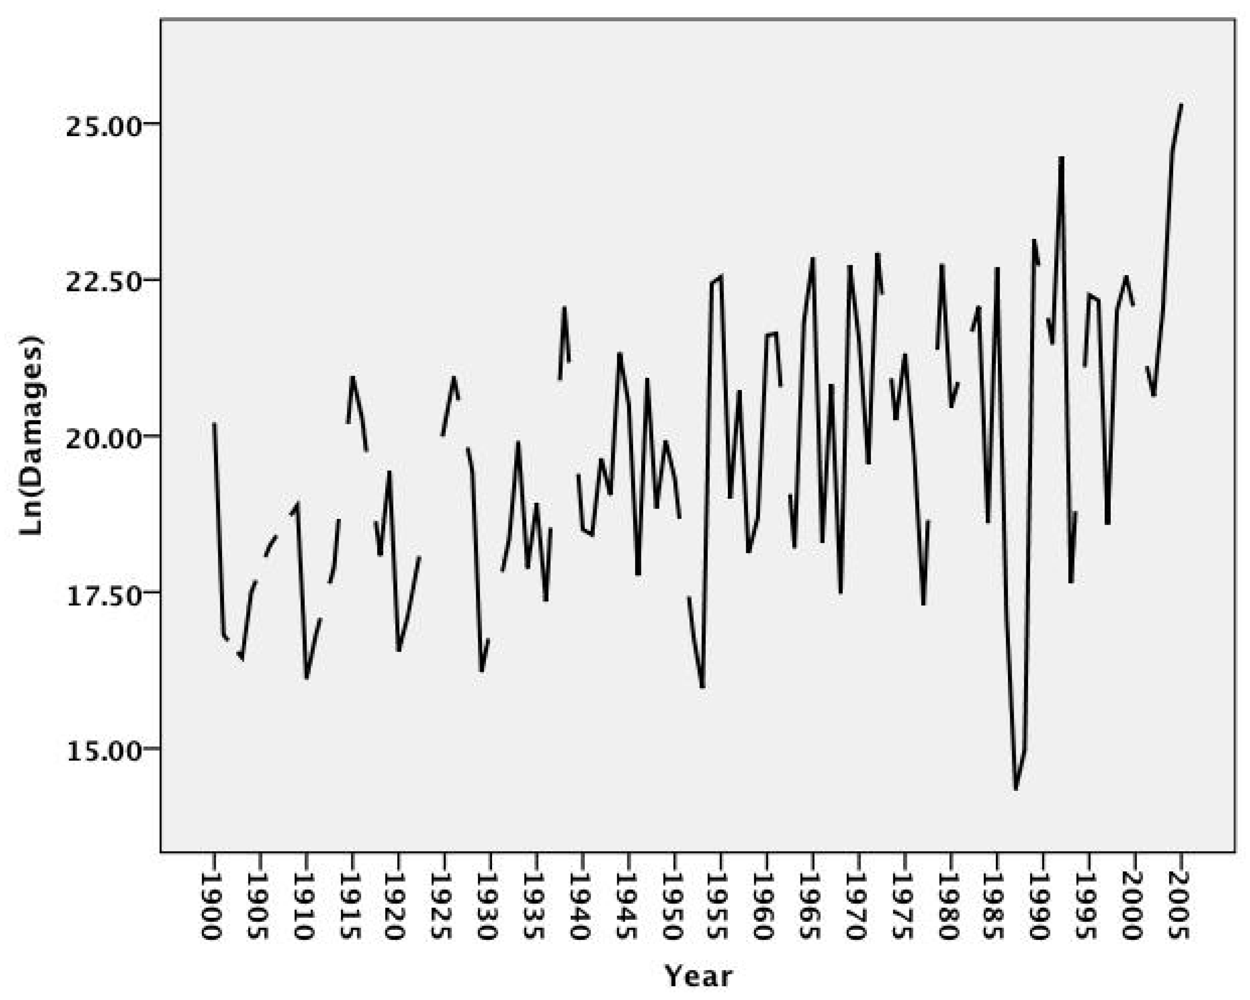
Figure 2 shows a logarithmic transformation of the annualized damages.
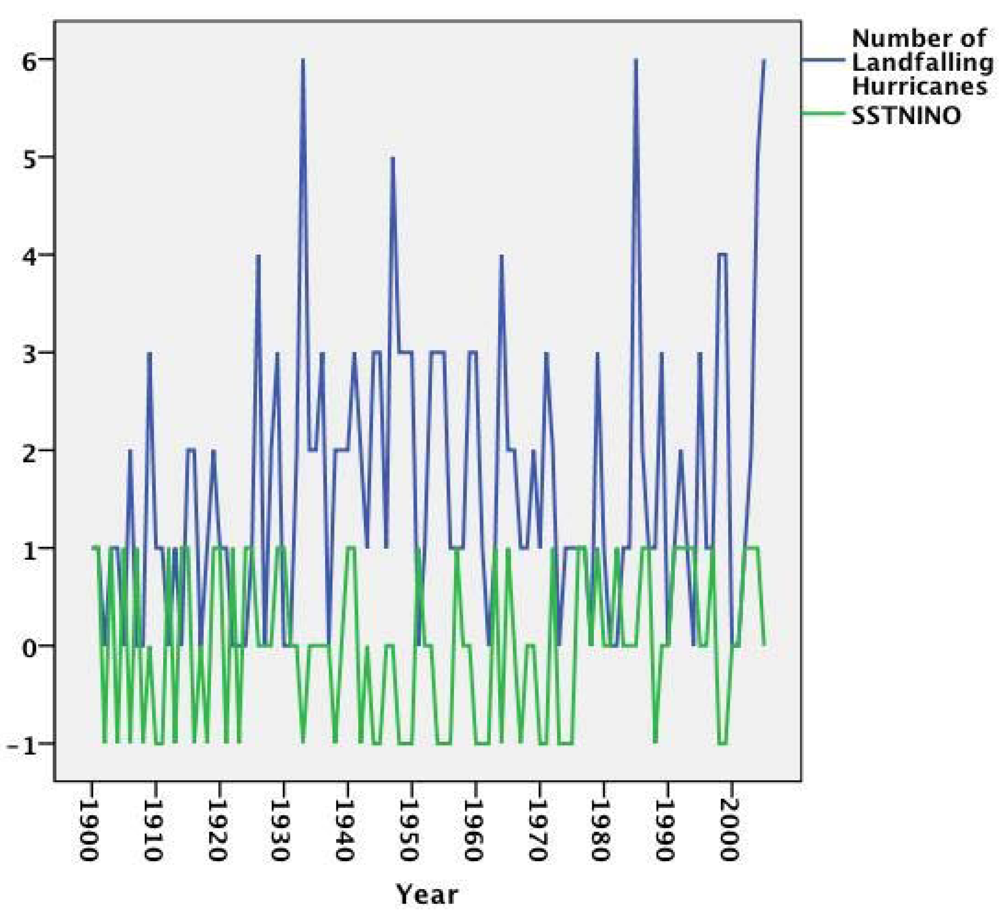
Figure 3 plots inter-decadal variability by plotting the number of land-falling hurricanes against SST Nino. There is no clear statistically significant trend between La Nina and El Nino years in terms of increasing or decreasing frequency of land-falling hurricanes.
Figure 4 shows variation in the average intensity of land-falling hurricanes
vis-à-vis SST Nino, again without any significant discernable trend.
This study develops a time series forecasting model that can predict the inflation-adjusted damages at different intensities of hurricanes, while controlling for housing densities of the areas impacted by the hurricanes. Such forecasting model could potentially be used to predict the damages in the next one hundred years (2006–2106), if policy/planning interventions are employed to carry out various land-use adaptations (i.e., manipulating the trends in housing densities, population densities, and agricultural land cover at various planning thresholds).
Table 1.
Descriptive Statistics.
Table 1.
Descriptive Statistics.
| Variable | N | Minimum | Maximum | Mean | Standard Deviation |
|---|
| Annual Damages (2005 U.S. Million $) | 106 | 0 | 99,150 | 2,937.73 | 11,340.11 |
| Ln (Damages) | 80 | 14.34 | 25.32 | 19.74 | 2.35 |
| Annual Damages as % of Fixed Reproducible Tangible Wealth (%) | 106 | 0 | 0.99 | 0.05 | 0.13 |
| Ln (Annual Damages as % of Fixed Reproducible Tangible Wealth) | 80 | −10.54 | −0.01 | −4.30 | 2.12 |
| Annual Hurricane Frequency | 106 | 0 | 6 | 1.62 | 1.43 |
| Average Annual Hurricane Intensity (Safire-Simpson Scale) | 106 | 0 | 4 | 1.71 | 1.20 |
| Annual Affected Area (Square Miles) | 106 | 0 | 238,409 | 13,079.13 | 34,995.14 |
| Annual Affected Population | 106 | 0 | 41,664,959 | 2,465,596 | 7,255,926 |
| Annual Affected Population Density (People/Sq Mile) | 80 | 2.51 | 4,604.81 | 181.80 | 522.43 |
| Annual Affected Houses | 106 | 0 | 21,742,632 | 1,011,516 | 3,299,449 |
| Annual Affected Housing Density (Houses/ Sq Mile) | 80 | 0.51 | 1,512.35 | 66.01 | 174.73 |
| % of Agricultural Land in the Affected Area (%) | 80 | 0.16 | 93.65 | 31.07 | 23.17 |
| Deviations from Sea Surface Temperature (SST) | 106 | −1.9 | 2.52 | 0.06 | 0.98 |
| SST Nino | 106 | −1 | 1 | 0.01 | 0.82 |
| Year | 106 | 1,900 | 2,005 | 1,952.5 | 30.74 |
Figure 1.
Direct damages from hurricanes in the Atlantic and Gulf coasts.
Figure 1.
Direct damages from hurricanes in the Atlantic and Gulf coasts.
Figure 2.
Log of direct damages from hurricanes in the Atlantic and Gulf coasts.
Figure 2.
Log of direct damages from hurricanes in the Atlantic and Gulf coasts.
Figure 3.
Inter-decadal variability of hurricane activity.
Figure 3.
Inter-decadal variability of hurricane activity.
Figure 4.
Variation in hurricane intensity.
Figure 4.
Variation in hurricane intensity.
The simplest time series forecasting model uses inflation-adjusted damages (D) for a year (t) as the dependent variable. The dependent variable could also be normalized through a measure of inflation-adjusted damages as a proportion of GDP or as a proportion of FRTW. FRTW is preferred here because it only contains fixed assets, while GDP contains both fixed and liquid assets. It is hypothesized that the following predictors affect the changes in inflation-adjusted hurricane damages: (1) Average intensity of land-falling hurricanes for a year (t), measured on a Saffire-Simpson scale, (X1); (2) Annual frequency of land-falling hurricanes (X2); (3) Fixed Reproducible Tangible Wealth (X3); (4) Area-weighted housing density affected by the hurricane path and their squared and cubed values (X4 to X6); (5) % of Agricultural land cover (X7); (6) SST El Nino (X8) and (7) Time variable measured in years (X9). When the dependent variable is normalized by FRTW, the FRTW is dropped from the list of independent variables.
The simplest form of the model was initially specified as an OLS model, as shown in Equation (3):
![Sustainability 04 00917 i003]()
Various statistical tests were employed to detect autocorrelation and heteroskedasticity for estimating the β
r.
Table 2 and
Table 3 in the results section provide a summary of these statistical test results. Model 1 in
Table 2, for example, is an OLS model that predicts inflation-adjusted damages. Similarly, Model 5 in
Table 3 is also an OLS model that predicts inflation-adjusted damages normalized by FRTW. Model 1 produced a Durbin-Watson d-statistic of 1.0324, which led to a rejection of null hypothesis of no autocorrelation [
13] and acceptance of an alternative hypothesis of positive autocorrelation. Similar evidence for positive autocorrelation is observed for model 5 that predicts normalized damages. In addition to autocorrelation, the OLS models also manifested evidence of heteroskedasticity. Breusch-Pagan/Cook-Weisberg test was implemented to test for the null hypothesis of no heteroskedasticity in OLS models 1 and 5. This null hypothesis was rejected for both the OLS models (P > chi2 = 0.0000). After testing for various functional forms, a logarithmic transformation of the dependent variable successfully minimized heteroskedasticity, which led to log-linear functional forms of Model 2 (
Table 2) and Model 6 (
Table 3). While log-linear models minimized heteroskedaskticity (P > chi2 = 0.0165 for Model 3 and P > chi2 = 0.1788 for Model 6), the null hypothesis of no temporal autocorrelation could only be barely rejected (d-statistic of 1.3290 for Model 2 and 1.2462 for Model 6). To account for temporal autocorrelation, both Prais-Winston and ARMA modeling approaches are used by specifying auto-regression, moving average and differencing orders for stationarizing the time series. Prais-Winston regression models are special cases of generalized ARMA models that assume first order auto-regression on residual terms and adjust the regression coefficients through transforming the d-statistic. The ARMA model, as shown in Equations (4) and (5), is a more generalized approach to predict the log of damages conditional upon hurricane intensity trends, and trends in housing densities and agricultural land cover in the south eastern USA. Model 3 in
Table 2 and Model 7 in
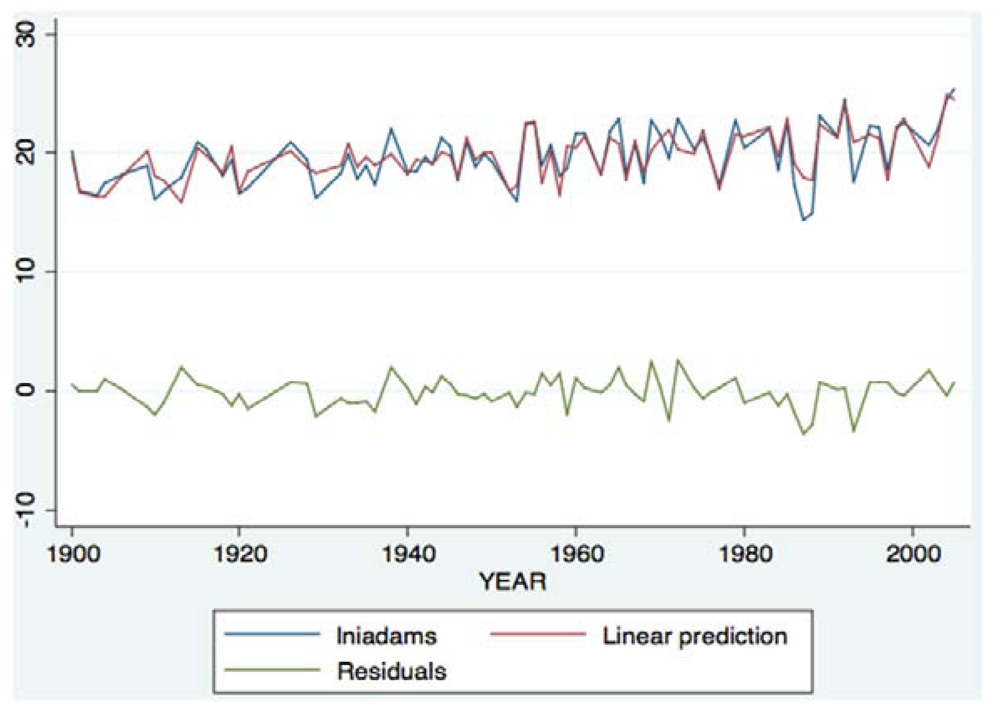
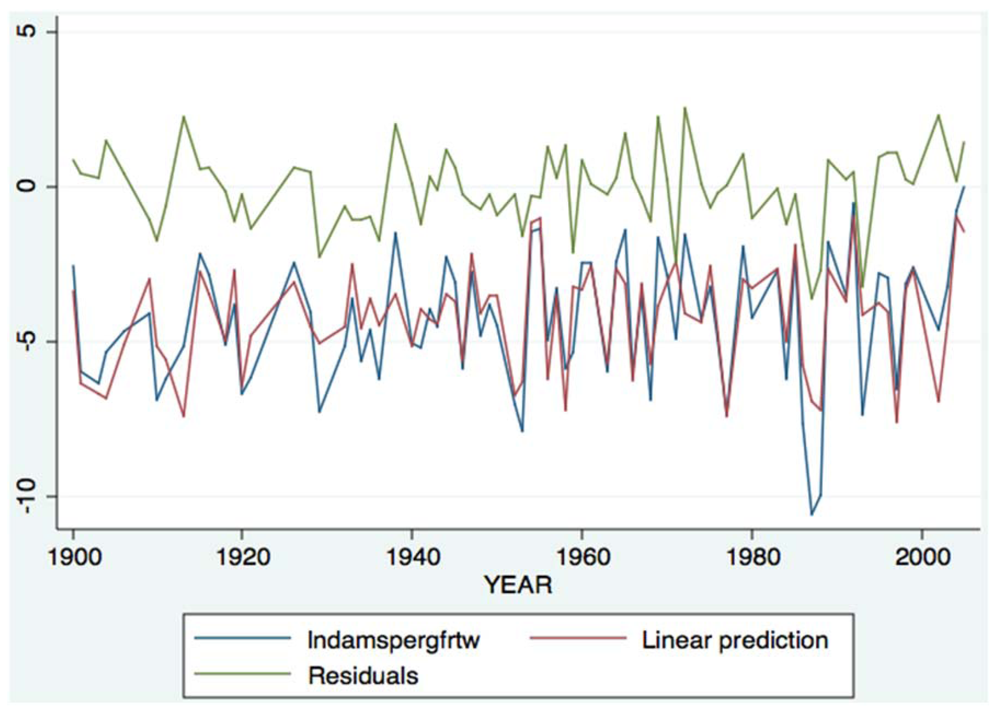
Table 3 are Prais-Winston regression models to respectively predict inflation-adjusted and normalized damages. The transformed d-statistic in Prais-Winston regression models shows that the estimated coefficients in these models do not present any evidence of first-order autocorrelation. The evidence for higher order autocorrelation and moving average is tested in ARMA specifications to predict inflation-adjusted damages in Model 4 and inflation-adjusted damages as a proportion of FRTW in Model 8. While there is evidence for higher-order autocorrelation, the direction and significance of estimated coefficient values in Prais-Winston and ARMA regression models are robust and consistent.
Table 2.
Estimated Models Predicting Economic Damages from Land-falling Hurricanes in the Atlantic and Gulf Coasts of the U.S., 1900–2005.
Table 2.
Estimated Models Predicting Economic Damages from Land-falling Hurricanes in the Atlantic and Gulf Coasts of the U.S., 1900–2005.
| Variable | OLS Model 1 Predicting
Damages
(2005 U.S. Million $) | Loglinear Model 2 Predicting
Ln(Damages) | Prais-Winston Model 3 Predicting Ln(Damages) | ARMA (5,1,5) Model 4 Predicting
Ln(Damages) |
|---|
| Year | −246.2259 **
(117.6930) | 0.0013
(0.0147) | 0.0001
(0.0187) | Dropped |
| Average Annual Hurricane Intensity (Safire-Simpson Scale) | 2,885.8720 **
(1,430.2020) | 1.3166 ***
(0.1795) | 1.3018 ***
(0.1805) | 1.6768 ***
(0.1851) |
| Annual Affected Housing Density (Houses/ Square Mile) | 50.2466
(60.9161) | 0.0277 ***
(0.0076) | 0.0268 ***
(0.0073) | 0.0023 *
(0.0012) |
| Annual Affected Housing Density Squared | −0.1473
(0.1961) | −0.00005**
(0.00002) | −0.00005 **
(0.00002) | Dropped |
| Annual Affected Housing Density Cubed | 0.00007
(0.0001) | 2.77e−08 **
(1.33e−08) | 2.76e−08 **
(1.27e−08) | Dropped |
| % of Agricultural Land in the Affected Area | 21.7046
(55.0235) | 0.0189 **
(0.0069) | 0.0151 **
(0.0068) | 0.0229 ***
(.0068) |
| SST Nino | 771.0973
(1,519.7360) | −0.1640
(0.1907) | −0.1507
(0.1870) | 0.1572
(0.2173) |
| Fixed Reproducible Tangible Wealth (2005 US $ Billions) | 4.5842 ***
(1.2851) | 0.0002 *
(0.0001) | 0.0003
(0.0002) | −0.0013
(0.0016) |
| Constant | 452,702.3000 **
(225,767.7000) | 10.3225
(28.3424) | 12.8121
(36.0164) | 0.1090
(0.1638) |
| AR (1) | N/A | N/A | 0.3607 | −1.9835 *** |
| AR (2) | N/A | N/A | N/A | −2.3611 *** |
| AR (3) | N/A | N/A | N/A | −1.4897 ** |
| AR (4) | N/A | N/A | N/A | −0.4514 |
| AR (5) | N/A | N/A | N/A | 0.2234 |
| MA (1) | N/A | N/A | N/A | 1.0750 |
| MA (2) | N/A | N/A | N/A | 0.6469 |
| MA (3) | N/A | N/A | N/A | −0.6469 ** |
| MA (4) | N/A | N/A | N/A | −1.0750 |
| MA (5) | N/A | N/A | N/A | −1.0000 *** |
| Sigma | N/A | N/A | N/A | 1.0202 *** |
| R2 | 0.4378 | 0.7318 | 0.8715 | N/A |
| F-test or Wald-test score | 6.0600 ***
F(9,70) | 21.22 ***
F(9,70) | 52.76 ***
F(9,70) | 7,229.2700 ***
W(9,60) |
| Durbin-Watson d-statistic | 1.0324
(10, 80) | 1.3290
(10,80) | 1.6921
(10,80) | N/A |
| Breusch-Pagan/Cook-Weisberg test for heteroskedasticity | Chi2 = 248.0900
(P = 0.0000) | Chi2 = 1.8100
(P = 0.1788) | N/A | N/A |
Table 3.
Estimated Models Predicting Economic Damages as a % Proportion of Fixed Reproducible Tangible Wealth (FRTW) from Land-falling Hurricanes.
Table 3.
Estimated Models Predicting Economic Damages as a % Proportion of Fixed Reproducible Tangible Wealth (FRTW) from Land-falling Hurricanes.
| Variable | OLS Model 5 Predicting
Damages/FRTW (%) | Loglinear Model 6 Predicting
Ln(Damages/FRTW) | Prais-Winston Model 7 Predicting Ln(Damages/FRTW) | ARMA (5,1,5) Model 8 Predicting
Ln(Damages/FRTW) |
|---|
| Year | 0.0006
(0.0006) | 0.0007
(0.0068) | −0.00002
(0.0080) | Dropped |
| Average Annual Hurricane Intensity (Safire-Simpson Scale) | 0.0496 **
(0.0163) | 1.3142 ***
(0.1821) | 1.3065 ***
(0.1813) | 1.6710 ***
(0.1804) |
| Annual Affected Housing Density (Houses/ Square Mile) | 0.0015 **
(0.0006) | 0.0270 ***
(0.0077) | 0.0261 ***
(0.0072) | 0.0023 *
(0.0012) |
| Annual Affected Housing Density Squared | −4.08e−06 *
(2.23e−06) | −0.00005 **
(0.00002) | −0.00005 **
(0.00002) | Dropped |
| Annual Affected Housing Density Cubed | 2.3e−09 *
(1.21e−09) | 2.63e−08 *
(1.35e−08) | 2.65e−08 **
(1.27e−08) | Dropped |
| Average Annual Hurricane Frequency | 0.0386 ***
(0.0110) | 0.5785 ***
(0.1233) | 0.5909 ***
(0.1222) | 0.6979 ***
(0.1425) |
| % of Agricultural Land in the Affected Area | −0.0003
(0.0006) | 0.0167 **
(0.0068) | 0.0136 **
(0.0067) | 0.0224 **
(0.0071) |
| SST Nino | 0.0209
(0.0168) | −0.1040
(0.1882) | −0.1212
(0.1855) | 0.1173
(0.2181) |
| Constant | −1.4776
(1.1979) | −11.5060
(13.3742) | −9.7455
(15.7553) | −0.0318
(0.0660) |
| AR (1) | N/A | N/A | 0.3954 | −1.9573 *** |
| AR (2) | N/A | N/A | N/A | −2.3032 *** |
| AR (3) | N/A | N/A | N/A | −1.4156 ** |
| AR (4) | N/A | N/A | N/A | −0.3951 |
| AR (5) | N/A | N/A | N/A | 0.2503 |
| MA (1) | N/A | N/A | N/A | 1.0865 |
| MA (2) | N/A | N/A | N/A | 0.6467 |
| MA (3) | N/A | N/A | N/A | −0.6467 ** |
| MA (4) | N/A | N/A | N/A | −1.0865 |
| MA (5) | N/A | N/A | N/A | −1.0000 ** |
| Sigma | N/A | N/A | N/A | 1.0431 *** |
| R2 | 0.4084 | 0.6550 | 0.6791 | N/A |
| F-test or Wald-test score | 6.1300 ***
F(8,71) | 16.85 ***
F(8,71) | 18.78 ***
F(8, 71) | 8,172.2600 ***
W(6,60) |
| Durbin-Watson d-statistic | 1.1380
(9,80) | 1.2462
(9,80) | 1.6746
(9,80) | N/A |
| Breusch-Pagan/Cook-Weisberg test for heteroskedasticity | Chi2 = 102.2400
(P = 0.0000) | Chi2 = 5.7400
(P = 0.0165) | N/A | N/A |
Both Prais-Winston and ARMA estimation is undertaken in the software STATA by maximum likelihood methods. Harvey [
14], Hamilton [
15] and Gourieroux and Monfort [
16] explicate the fuller details of Prais-Winston and ARMA model employed in this study to account for autocorrelation of residual errors. The generalized ARMA model is shown in Equations (4) and (5). Prais-Winston regression model is a special case of ARMA with first order autocorrelation value of p = 1, while time-differencing (d) and moving average (q) parameters are assumed to be zero. Overall, the estimated Prais-Winston regressions (Models 3 and 7) appear very robust that explain significant amount of variation in the observed data (R
2 at 87.15% and 67.91% respectively for Models 3 and 7) while minimizing heteroskedasticity and first-order autocorrelation. The Prais-Winston regression models should therefore be used to interpret the study findings with respect to quantifying the effects of changing hurricane intensities, hurricane frequencies, housing densities and agricultural LULC on inflation adjusted damages (
Table 2) and inflation adjusted damages as a proportion of FRTW (
Table 3).
![Sustainability 04 00917 i004]()


