Review

Energy Costs of Energy Savings in Buildings: A Review

Industrial Research Chair in Technologies of Energy and Energy Efficiency, École de Technologie Supérieure, Université du Québec, 1100, Rue Notre-Dame Ouest, Montréal, QC H3C 1K3, Canada
*
Author to whom correspondence should be addressed.
Sustainability 2012, 4(8), 1711-1732; https://doi.org/10.3390/su4081711
Submission received: 30 March 2012 / Revised: 4 July 2012 / Accepted: 19 July 2012 / Published: 9 August 2012

Abstract

:
It is often claimed that the cheapest energy is the one you do not need to produce. Nevertheless, this claim could somehow be unsubstantiated. In this article, the authors try to shed some light on this issue by using the concept of energy return on investment (EROI) as a yardstick. This choice brings semantic issues because in this paper the EROI is used in a different context than that of energy production. Indeed, while watts and negawatts share the same physical unit, they are not the same object, which brings some ambiguities in the interpretation of EROI. These are cleared by a refined definition of EROI and an adapted nomenclature. This review studies the research in the energy efficiency of building operation, which is one of the most investigated topics in energy efficiency. This study focuses on the impact of insulation and high efficiency windows as means to exemplify the concepts that are introduced. These results were normalized for climate, life time of the building, and construction material. In many cases, energy efficiency measures imply a very high EROI. Nevertheless, in some circumstances, this is not the case and it might be more profitable to produce the required energy than to try to save it.

1. Introduction

Energy efficiency is one of the key tools to tackle two of the biggest challenge facing humanity: climate change and energy scarcity. Indeed, to avoid catastrophic climate changes, it is generally acknowledged that the world needs to reduce the CO2 emission by 50% from the current level by 2050 [1]. For developed countries, this translates into a reduction of 80%, a division by five with respect to 1990’ semissions. While, increases in renewable energy production can help to reach this goal, some authors including those of the current paper, have proposed instead to drastically reduce the energy consumption as the renewables development will never be fast enough to overcome the scarcity of fossil fuels in the current century.
Along this idea, Kesselring and Winter [2] proposed the concept of a 2000 W society which aims at consuming no more than what corresponds to an average continuous power of 2000 W per capita; the value being considered as a fair share of the world energy consumption maintained at a sustainable level. This concept was later further developed and expanded [3,4]. Since actual rates of energy consumption is about 6000 W in Europe and even 10,000 W in North America, this would certainly imply dramatic changes in day to day life for most of OECD countries.
Transportation is often singled out as the main target for energy efficiency. However, the building industry has an even larger energy and environmental footprint as it is one of the human activities with the largest environmental impact. As noted by Dixit et al. [5], the construction industry depleted two-fifths of global raw stone, gravel, and sand; one-fourth of virgin wood; and it consumes 40 percent of total energy and 16 percent of fresh water annually [6,7,8,9,10,11,12]. These figures are more or less similar in any developed country. Indeed, for OECD countries, energy consumption by buildings varies between 25% – 50% of total energy consumption [13], whereas it is closer to 50% in the European Union [14].
In these conditions, the building industry is an obvious target for energy efficiency. This is the rationale behind the European Union Directive on Energy Performance of Buildings [15]. This directive requires member states to implement energy efficiency legislations for buildings, including existing ones with floor areas over 1000 m2 that undergo significant renovations. The French legislation [16] specifies that by January 2013, any new building will have to consume less than 50 kWh/m2/yr of primary energy (this value is modulate with the building type, apartment size and local climate). By 2020, all new buildings will have to be at least net zero—that is involving a consumption of 0 kWh/m2/yr—or better, that is globally producing energy [16]. In a similar way, the Swedish government promulgated a Bill on Energy Efficiency and Smart Construction, to reduce total energy use per heated building area by 20% by 2020 and 50% by 2050, using year 1995 as the reference [17]. In addition, these energy efficiency measures offer a significant opportunity to reduce CO2 emissions [1,18].
Such ambitious goals in energy efficiency improvements raise the key issue of the efficient allocation of resources. Actions that need a large upfront investment for a minimal reduction of the energy consumption are undesirable. In some cases, the return might be so small that one might wonder if it would be better to produce the energy than trying to save it. This is true both for economic and ecological efficiencies.
This first paper of a series of two addresses this key issue from the point of view of energy savings as applied to two popular energy savings measures implemented in buildings: insulation and window optimization.

2. Energy Return on Investment: A Revised Concept

One potentially useful alternative to conventional economic analysis when it comes to evaluate the sustainability of a particular solution aimed at saving energy (and consequently greenhouse gas emissions) or producing energy is the net energy, Enet, analysis. The concept relies on the estimation of two parameters depending whether energy production or energy savings are considered.

2.1. Energy Production

In the first case, all energy required to implement a particular equipment or process (from cradle to grave) is accounted for: it is called the energy invested, Einvested. Then, all energy that this device or process will generate or produce, Eproduced, during its lifetime is evaluated. Accordingly, the net energy is simply:
Sustainability 04 01711 i001
In the desirable situation, Enet, is positive, that is the device or process will generate or produce more energy than it took to implement it. On contrary, it could happen that the required amount of energy required from cradle to grave could be more important than the production. This could be due to a short lifetime and most of the time driven by the economics.
The concept can be applied to non-existing solutions, project starting from scratch, for which there is no production at all at the beginning. In this context it is possible to compare several solutions to one another based on this criterion.
Or, it could be applied to solutions improvements in which case the solutions will be compared to the existing one. In this latter case, Enet, has to be defined in terms of the improvement only.

2.2. Energy Saved

In a second–opposite–case, energy savings are considered. For this case, Eproduced is replaced by Esaved. The savings, Esaved, are estimated for the difference between the amount of energy that the device, building or process would require provided nothing is done and the amount of energy it should consume with the implementation of the proposed device, building or process. On the other hand, Einvested does not account for the energy used by the device after the measures of economy are implemented. In this case, Einvested only accounts for the energy required to implement the solution or install the equipment (from resources extraction to commissioning not from cradle to grave). The energy used by the solution is already accounted for in the definition of Esaved.
Sustainability 04 01711 i002
In this case, a positive value of Enet accounts for savings (which are negawatts or a negative production) that are greater than the energy invested, which of course is desirable. To obtain a desirable effect associated with a positive value of Enet, the savings must be positive. On the other hand, the worst case solution is the case when the savings are negative, that is when, after an investment, the amount of energy used Econsumed,after is larger than that used previously in the original situation Econsumed,before. And this happens more often than we might think when the analysis failed to adequately predict the energy embodied into a solution and focused solely on the eventual savings over a somewhat short lifetime.
As for the case of production, Enet can be defined with respect to novel or additional measures of energy efficiency.
In both savings and production cases a positive Enet means a desirable effect and conversely.

2.3. The Energy Ratio: Energy Return on Investment

This analysis deals with the calculation of the ratio of the energy savings by a particular solution (over a given period of time) or the energy produced by some equipment or process to the energy required to implement the solution or install the equipment (from resources extraction to commissioning). This net energy analysis is sometimes called the assessment of energy surplus, the energy balance method, or the energy return on investment (EROI) [19,20,21,22,23]. In the case of energy production, the EROI is calculated from Equation (3):
Sustainability 04 01711 i003
The key challenge to obtain a meaningful value for this ratio is to correctly define the boundaries of the problem which is investigated and to include—or try to include—all the inputs and outputs in the process [22,23]. For instance, the production of gasoline should account for all the steps required to produce it and deliver it to the stations as in a life cycle analysis.
Of course, the higher this ratio, the lower the environmental impact per unit of energy is expected since less input is used for the same output and consequently less impact is felt by the environment [24].While several authors may argue that the energy consumption and its environment burden adequacy is not straightforward, it has still some merit as an indirect environmental impact indicator [25,26] it is likely to be linked with a better economic investment since the energy content is closely—but not necessarily linearily—related to the price of a product, a process or a service. As a result, energy sources involving a better EROI should be selected in preference to others [27,28]. This is especially true for renewable energy sources for which the environmental burden comes mostly from the extraction and transportation of the resources and manufacturing of the energy systems prior to their use. This concept is related to that of net energy, Enet, that is when Enet = 0, EROI = 1 and a negative Enet means EROI < 1.
Calculating the average EROI for an energy basket is complex. Nevertheless, there are some indications that the average EROI of the U.S. energy basket is close to 10 and that a lower EROI should induce negative economic impacts [29]. Hence, for the purpose of this discussion acceptable energy solutions should respect EROI > 10 or Enet > 9 × Einvested hence, energy solutions with a lower EROI should be discounted.
When a modification to a power plant or a device is carried out, the EROI can be evaluated. That is to determine whether or not the modifications lead to an increase level of energy production, ΔEproduced, is positive. This is always the case when a production project starts from scratch. There could nevertheless be projects for which the energy production after a modification is lower than what was previously obtained. Defined this way, the EROI is then:
Sustainability 04 01711 i004
with the obvious requirement that EROI > 1 to obtain a valid or sustainable modification.

2.4. Differences and Similarities in EROI

A practical problem arises when using the EROI metric in an energy savings application such as a building. There is a key difference between EROI calculated for energy sources and EROI calculated from energy saved. Hence, negajoules (J) and negawatt (W) are compared to joules (J) and watt (W) (to our knowledge no symbols exist for negawatt and negajoules. Hence, we propose to use these one).
Sustainability 04 01711 i005
While at first glance this change of definition might look only semantic, it involves much deeper consequences. The reason is that Esaved is an energy difference by itself whereas Eproduced is not. Moreover, savings are positive that is the desirable situation is that after implementation of the measures one looks for less consumption while the desirable situation for production after implementation calls for more production.
EROI was originally solely conceived for energy production or energy production technologies and equipment. Hence, in this scenario energy produced and energy invested are both expected to be positive. In consequence, EROI will be always positive. Even when, the net energy production, Enet, is negative, the EROI is still positive but smaller than 1. As mentioned in the above paragraph EROI could either be positive or negative.
For energy efficiency (or savings), the concept holds with minor differences. It was said that the energy saved is a positive quantity. In rare circumstances, a poorly designed intervention might increase the lifetime energy consumption, which corresponds to a negative EROI since energy saved is then negative.
This situation might also be caused by a strong rebound effect, the Jevons paradox [30], where the users adapt their energy consumption behavior in a way that they increases the consumption of a good or a service made more affordable due to the improved efficiency to a point that the new energy consumption could exceed the original one.
In this case, there cannot be a definition of EROI of gain as the energy saved is by definition a difference. However, Equation 4 corresponds to Equation 5 when the savings are negative.
There are also situation for which the definition does not hold. For instance, energy efficiency measures may cost nothing. Energy efficiency measures like changing thermostat settings, closing an interrupter or cooling by natural convection have zero or near zero costs which means that EROI→∞.
But, there is an even more favorable situation where an improvement of one aspect of a building has for consequence the optimization of the performance of others systems leading to an overall net negative energy cost. For instance, the improvements to the insulation of the building envelope produce a given EROI for the insulation addition alone, but it may also allow for the reduction of the size of the heating system and hence produce savings on its embodied energy. This could lead to an overall lower total energy cost for the whole building, compared with the version with less insulation. Nevertheless, since in practice energy must be always used to implement a project, this situation is restricted to two cases: when comparing two hypothetical situations and when embodied energy of the replaced components can be recovered to the point that the net energy invested is negative. In the following discussion, only the first situation occurs.
From the strict mathematical point of view, this would produce a negative EROI (positive energy saved over a total negative energy cost). Hence, there are two types of negative EROI, one which is negative in term of energy savings and undesirable, and one which is positive in term of energy saved and highly desirable. Actually, this situation is better than EROI = ∞ since the embodied energy is lower than that involved in the original situation! To distinguish these two cases, the symbol † is to be used instead of—for the case where the embodied energy is lower. The reader must be warned however that the value of this type EROI must be interpreted in a different way than the usual one. Indeed, a small EROI means that little operational energy is saved compared to the embodied energy, while a large EROI means that little embodied energy is saved compare to the operational. In consequence, EROI value does not provide information about the relative desirability of the technical solutions.

2.5. A Schematic Representation of the EROI Complete Concept

To complete the picture, it should be noted that there are also the situations where the investment cost is negative and where the energy return is also negative. This situation is symmetric with the classical EROI and is treated the same way. These situations are described in the following diagram (Figure 1).
Figure 1. Energy return on investment (EROI) class (classical definition is in the upper right corner).
Sustainability 04 01711 g001
In Figure 1, there are four areas: (1) in the upper right corner, the EROI is positive that is the return and the investment are positive (which is the classical case for energy production leading to positive return with a positive investment); (2) in the lower left corner, the return and the (net) investment are negative leading to a positive EROI (symmetry of case 1); (3) in the lower right corner, the EROI is negative as the return is negative (you spend more energy) after a net positive investment; and (4) in the upper left corner is the case of a positive return with a lower embodied energy after the implementation of the measures.

2.6. Additional Considerations

At last, there is another key difference between calculating EROI for energy efficiency application. The energy produced or saved is always calculated with reference to a given original condition. In both cases (production or savings), the EROI is always better when you start from scratch. For instance, adding extra insulation to a wall which is already well insulated will have a much lower EROI than adding the same insulation to a poorly insulated wall. Conversely, improving a combustion system by fine tuning the air-fuel ratio of a combustor with an added sophisticated control system will involve a lower EROI than changing and old coal-fired furnace with a modern gas combustor.
It is also important to note that EROI may stay negative for a very long time and nevertheless reaches values above 10 since the lifetime of buildings is quite long (>50 yr). Therefore, when analyzing the energy efficiency, the appropriate time scale must be used. This is why the energy payback time (EPT), which will be explained in more details in the next section, is also an important parameter to consider. Or, more generally, the context is always important and the analyst must be careful when interpreting an EROI value.
In practice, few studies have been done on an energy basis most of them have been carried out on monetary return. Since, monetary value of energy unit is sensible to the nature of the energy input, EROI calculations based on monetary inputs shall be used with care. In average, the energy content of a dollar of product and services is higher than its equivalent in energy, the EROI calculated in dollar, without correcting for this factor, is always smaller than the EROI calculated from energy units. For the data collected for these studies, this factor is typically between 6 and 10.
This is a crucial point of the discussion since most studies discuss the economical aspect of energy with respect to dollars not energy units. Almost all studies were not designed to calculate EROI, all needed information is not directly available: while the energy consumption is most of the time given in energy units, the energy invested is not. However, it is sometimes possible to gather the information on the embodied energy content from alternate sources such as the data contained in [31]. Nevertheless, this database is oriented to building analyses done in the UK context, which may create severe distortions for other countries. In few cases, numerical values of the initial investment were not explicitly given in the text and we had to rely on measurements made on published graphs to get the appropriate information.

2.7. The Energy Payback Time (EPT)

In several articles, the energy payback time (EPT) is given. The energy payback time is the period needed to recover the energy invested through energy saving or energy produced. By definition, it is the time after which the EROI reaches a value of one and the net energy is equal to zero. Hence, EROI over the life time is:
Sustainability 04 01711 i007
This brings the issue of the lifetime of components [32,33,34] and of the building itself, which are in general poorly defined. To handle this problem, it is often recommended to refer to the norm ISO 15686 Buildings and constructed assets service-life planning [35] or using a 50 years timeframe as a reference for major renovations, since it is acknowledged and used in many studies [36]. In the upcoming analysis, a 50 years period for the building life time and a 35 years period for the components lifetime are used.

2.8. Other Factors

There are other issues peculiar to building application. One of the key problems in building life cycle analysis arises from the long life of the buildings (30–100 yr). Over such a long period of time, the energy basket and even the climate are expected to change. This raises some concerns about the applicability of the standard life cycle analysis method for buildings [37,38,39,40,41].
Another peculiar aspect of the life cycle analysis of building is that it is possible to exhaust resources locally even if the global resource base is immense globally. This problem exists for building material since they are bulky and therefore often expensive to transport over long distances. Hence, while the depletion of bulk resources is negligible at global level [42,43] and hard to put in evidence at the scale of a country like France, depletion becomes clear in a relatively small region like Île-de-France, where depletion time scale is the same order of magnitude than quarries or buildings lifetimes [44,45]. This analysis does not convers this aspect of the problem.
Notwithstanding these weaknesses, the reader should be aware that the same formalism applies also to greenhouse gases or any other pollutants that are produced both in construction and operation of the building.

3. Discussion Related to Specific Applications: Insulation and Windows
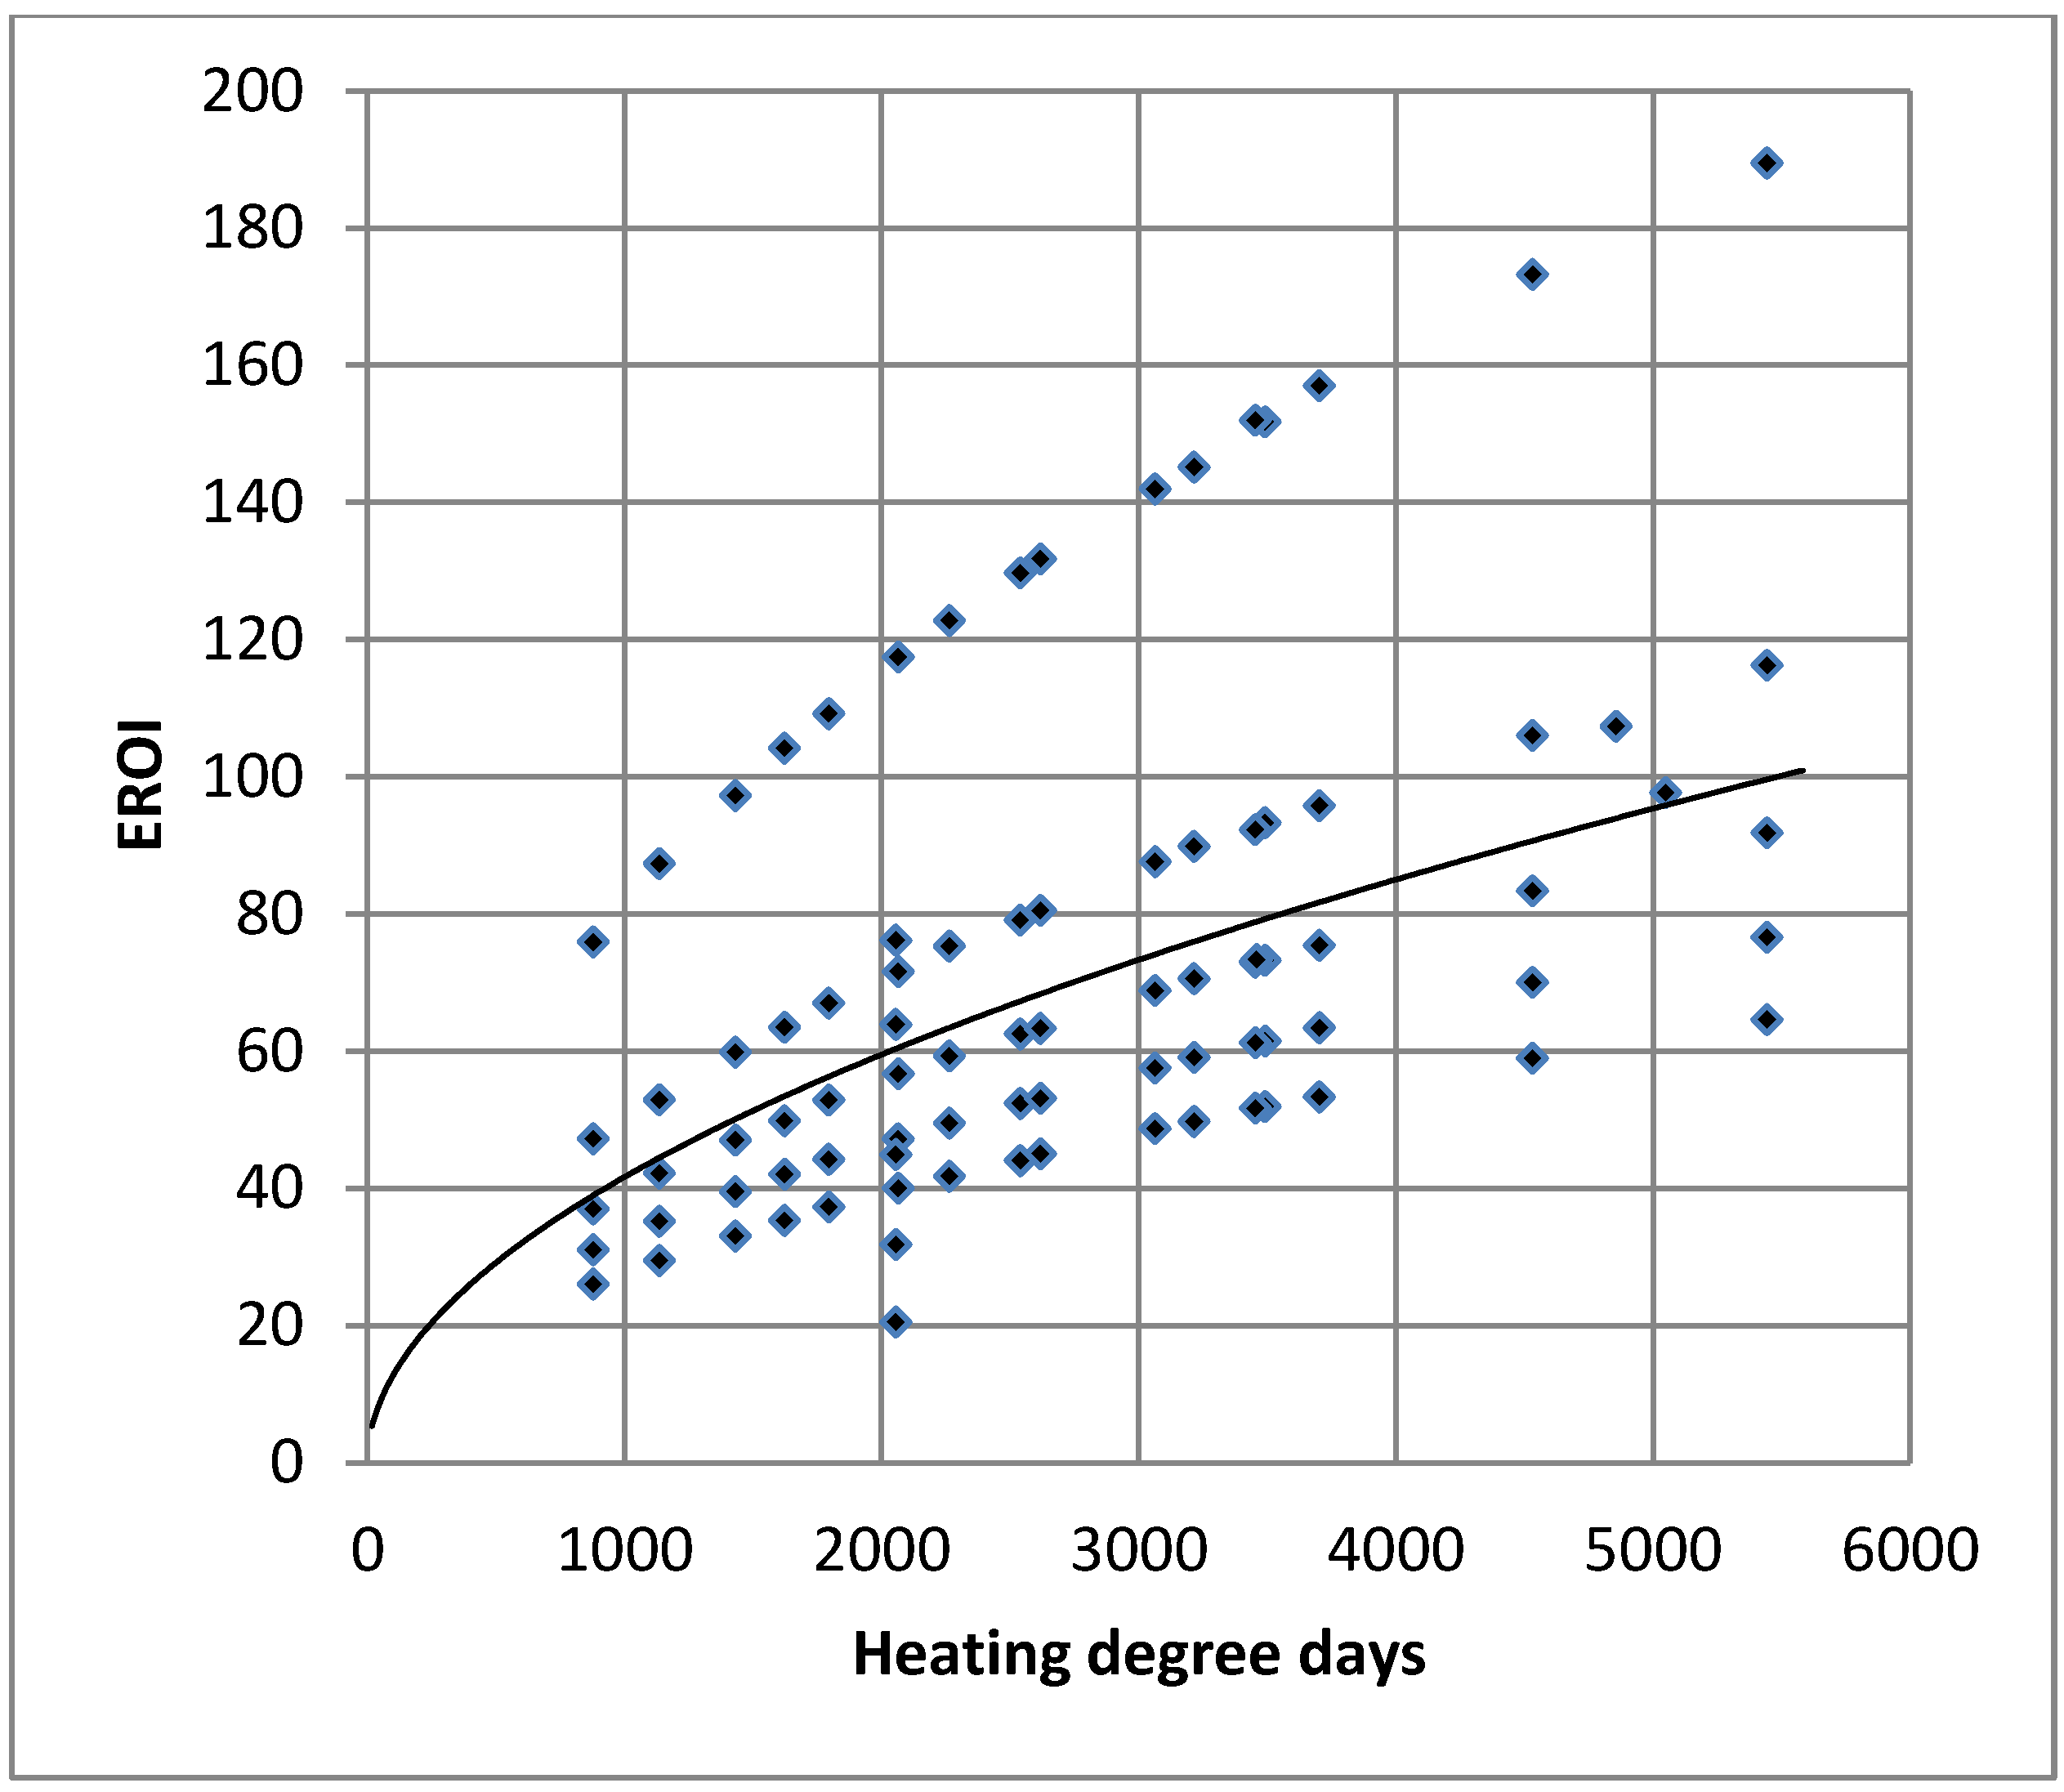
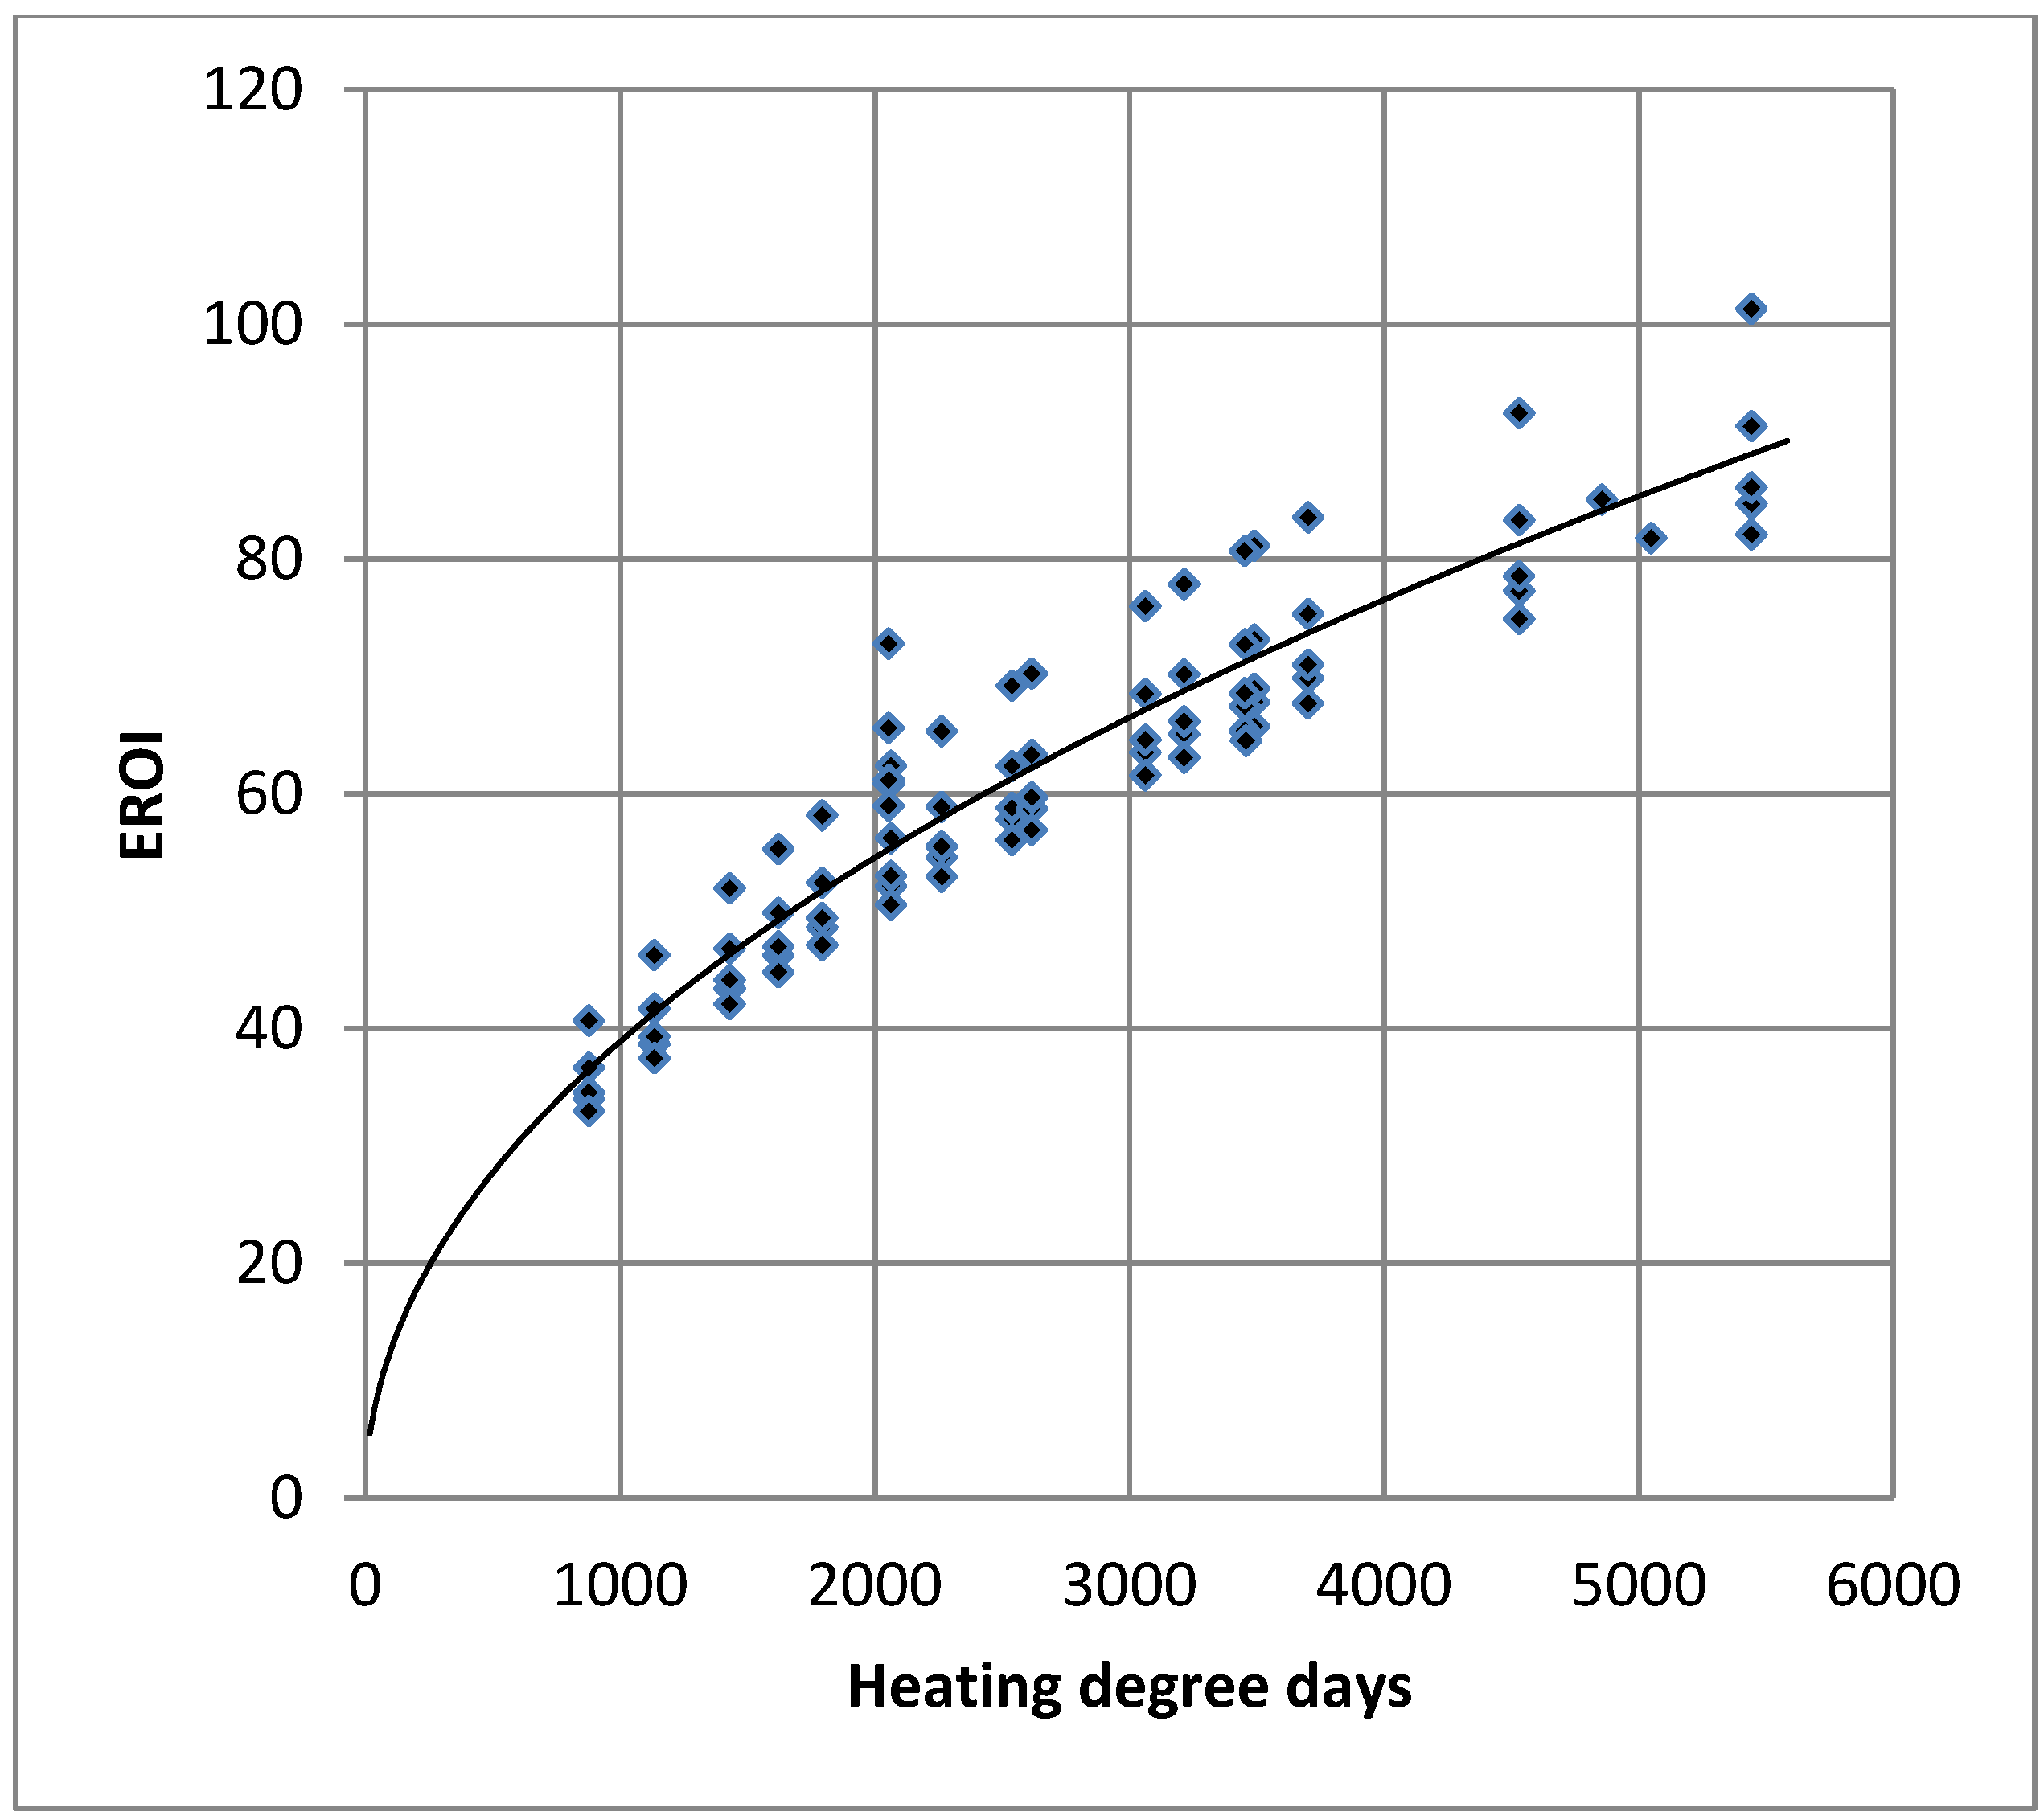
3.1. Insulation

Since a large fraction of the energy consumption in a building is used for space heating or cooling, optimization of the insulation is a critical issue. This is why optimization of insulation has been largely covered in the scientific literature and this is why the author chose to apply the above-mentioned concepts to this application.
The oldest paper known to us is the work of Muncey in 1955 [46], who worked on the optimization of insulation for Australian houses. This study has been followed by many others [47,48,49,50,51]. For all of them, the optimization was based on economic considerations. The first and only article performing optimization in term of energy uncovered by the current review has been written by Anani and Jibril in 1988 [52].
Insulation constitutes a classic case of diminishing return, since the impact of each new layer is inversely proportional to the insulation already provided by the existing layers. In consequence, it makes no sense to optimize the EROI, since the very first layer of insulation as a close to infinite EROI. This is why the objective is to minimize the total lifetime energy consumption and then calculate the EROI for this configuration.
For a simplest case, energy consumption for thermal control over the building lifetime takes the form [53,54]:
Sustainability 04 01711 i008
where U is the thermal conductance of the wall [W · K−1], DD is the number of degree-day [K ∙ d], A is the wall area [m2], η is the efficiency of the heating or cooling system, and N the lifetime of the building [yr]. The equation is valid both for heating and cooling, but these contributions must be calculated separately. They are also valid in a constant climate. An evolving climate can skew the results compare to this static model [55,56,57,58,59,60].
The thermal conductance takes the form:
Sustainability 04 01711 i009
where Rw stand for the thermal resistance of the original wall(or roof) and Ri is the thermal resistance of the added insulation. Since thermal resistance increase linearly with the thickness of the insulation (t), the previous equation can be rewritten as:
Sustainability 04 01711 i010
where k is the “effective” thermal conductivity of the insulation material. Energy consumption for temperature control is then equal to:
Sustainability 04 01711 i011
The energy cost of the insulation layer is defined simply as:
Sustainability 04 01711 i012
where ε is the energetic cost per unit of volume of the insulation. The total energy consumed by the building over its lifetime is then equal to:
Sustainability 04 01711 i013
where Eh and Ec are the energy use for heating and cooling, respectively. To minimize the total energetic cost, the derivative of Et with respect to t is set to be equal to zero. The optimal insulation thickness is then equal to:
Sustainability 04 01711 i014
From this expression, the energy saved for heating and cooling is simply
Sustainability 04 01711 i015
Substituting topt, yields
Sustainability 04 01711 i016
As the invested energy is equal to:
Sustainability 04 01711 i017
combining these two elements, leads to the following expression for the EROI:
Sustainability 04 01711 i018
In the previous equation, only insulation properties can be controlled by design. Hence, we define the insulation quality factor such that:
Sustainability 04 01711 i019
From this simple first order analysis, we can see that EROI is inversely proportional to the wall existing insulation, to the square root of the lifetime cumulative degree-day scaled by the efficiency, and inversely proportional to the square root of the product of the thermal conductivity. This simple relationship will be used to normalize the various reported return on investment analyses to a common DD, N, Rw and η. In addition, one shall note that the square root relationship between DD, EROI and optimum insulation thickness imply a smaller thickness and a larger energy consumption than that obtained by a simple linear relationship.
To the best knowledge of the authors, this behavior was not considered when translating the passivhaus standard [61] to other climate zones. Indeed, the standard in terms of kWh/m2 is kept constant, while this standard should be relaxed if the minimum lifetime energy consumption is the overall goal, as in the original passivhaus philosophy. This approach has the unfortunate consequence of increasing the overall energy consumption over the life time of the building compared to the optimal configuration by overinsulating it in the northern countries. A similar concern has been raised by Szalay [62] in the context of the European Building directive.
In recent times, optimization studies on insulation are mostly done in countries in economic transition. Especially, there are numerous studies done in Turkey ([63,64,65,66], among many). This is fortunate since this dataset is essentially internally consistent, which helps to point the underlying factor affecting the EROI.
The data from these studies [63,64,65] have been normalized to a 50 years lifetime (Figure 2). In addition, to reduce the dispersion of the data points, the analysis has been limited to the cases were polystyrene was used as an insulator. Therefore, in Figure 2, five curves from [64] can be found along with an extra vertical one that corresponds to an analysis with different fuel for on specific climate [65]; three others points come from [63]. The residual dispersion comes from the economic assumption at the basis of the optimization and the original uninsulated wall thermal resistance. From each set of points reported, the square root relation between heating degree-days and the EROI can easily be observed.
Starting with the overall results reported in Figure 2, the EROI for optimum total energy consumption has also been calculated based on the physical data provided in reference [63,64,65] (Figure 3). Since economic assumptions are now absent, the dispersion is much lower. It is dominated by the variation of the wall thermal conductivity in the absence of insulation and the efficiency of the heating system used. Overall, the optimum EROI tend to be lower than the published values from the literature since the economics optimization is done after for shorter lifetime (10 years) than the one we used for the energy optimization (50 years).
Figure 2. Calculated EROI economically optimum insulation thickness from literature.
Sustainability 04 01711 g002
Figure 3. EROI for energetically optimized of insulation layers.
Sustainability 04 01711 g003
It should be pointed out that air in a cavity is itself is a good insulator [66,67,68,69]. The EROI of an air insulating layer is infinite (as Qi = ∞ since it costs nothing (ε = 0)). Moreover, adding air may reduce the amount of embodied energy in a wall insulation solution thus lowering the denominator of Equations 4 and 17. However, in practice, the situation is more complex. For example, in the previous papers [66,67,68,69], an air cavity is left within a wall. In these cases, there is no additional cost associated to the air confinement. But, since the air cavity allows the utilization of a thinner insulation, its cost is negative, while improving the overall insulation and the net energy saved compared to a wall without the air gap. Hence, from the data of Mahlia and Iqbal [69], EROI of the air gap is between †0.7 and †8.7, since the air gap allows a reduction of the embodied energy in the insulation.
We note that a similar work has been carried independently by Harvey [70], who used the energy payback time and the marginal energy payback time to optimise the insulation layer of a building. He also used a quality factor for the insulation material, that is equivalent to 1/Qi2 (Qi is defined in the Equation 18). However, he did not notice the existence of an optimum insulation thickness excepted for greenhouse gas emission (Figure 6 of reference [70]).
It is worth noting that while studying the global energy optimization of a building, Bribián et al. [71] found that added insulation increased the cooling loads due to the increase difficulty in evacuating heat. This anti-insulation effect has been discussed extensively by Masoso and Grobler [72]. It is not captured in our simplified model, but is significant only in situation were the internal heat loads are comparable to external heat loads.
When optimizing the total energy consumption of a desert dwelling by optimizing its wall, Huberman [73] obtained an EROI of †0.97; the actual base case (reinforced concrete with 6 cm of expanded polystyrene and stone facing) having a larger embodied energy than the most efficient configuration (stabilized soil block with 6 cm expanded polystyrene and stone facing).
A comparative analysis was carried by Pulselli et al. [74] between 3 wall designs (reference, plus insulated and ventilated) in three cities (Berlin, Barcelona, Palermo). From the payback time given by the author the EROI varies from 8.2 to 13 for the plus-insulated design and from 9.7 to 15.8 for the ventilated wall.
Utama and Gheewala [75] studied the impact of using a double wall instead of a single one in a typical residential high rise building in Jakarta, Indonesia. They found that while the double wall had a larger embodied energy (79.5 GJ per apartment vs. 76.3 GJ), life cycle energy consumptions over 40 years were 283 GJ versus 480 GJ. Over this time period, this would translate in a EROI of 61.6. However, if we extend the lifetime at 50 years, maintenance for the double wall should be added (9 GJ). This was not include for the previous calculation due to its lower maintained compared to the single wall. Accordingly, this would bring the EROI over 50 years at 20.5. This analysis is a good example of the importance of the definition of the boundaries of the analysis.

3.2. Windows

Windows are the most critical components of the building envelope for energy efficiency. They are literally holes in the walls allowing heat or cold to enter or exit. In consequence, any improvement in their global insulating properties has a very large impact on energy consumption. This is why the energy return on investment is usually very high. On the other hand, windows provide natural daylight that largely reduces the energy consumption for lighting. Nevertheless, optimizing their area is a rather complicated tradeoff for the optimization of the overall building efficiency. For the sake of simplicity, in this article, we only concentrate our analysis on the insulating effect of windows.
The oldest article, found in the current review on the energy content of windows has been written by Saito and Shukuya in 1996 [76]. These authors studied three types of windows: single and double glazed with aluminum frame and double glazed with a wood frame. Calculations were done for a glazing of 1.02 m2. The mass of the aluminum frame was estimated to be 4.1 kg, while a single glazing panel 3 mm thick was estimated at 7.6 kg. Energy density of glass and aluminum was estimated to be 16.9 MJ/kg and 503 MJ/kg respectively. In absence of accurate data, they assumed that the wood frame embodied energy was one tenth of the aluminum one. Hence, for the three windows type the embodied energy was 2190 MJ, 2319 MJ and 463 MJ, respectively. Then, they calculated the heat transmission trough the frame and glazing to be equal to 8.0 W/K, 5.2 W/K, 3.7 W/K, respectively. In consequence, the energy savings for the Tokyo climate (1800 HDD) using the single window pane with aluminum frame as a reference is 436 MJ/yr for the double glazing, with an aluminum frame and 669 MJ/yr for the wood frame with double glazing. This translates in an energy payback of 108 days and −2.6 yr respectively using the single glaze window with an aluminum frame as reference. Based on a 35 years lifetime, the respective EROI are 118 and †13.6 since the wood frame has a negative energetic cost compare to an aluminum one.
While not described by the authors, single glazed wood framed window would have an embodied energy of 335 MJ and a conductivity of 6 W/K. Energy savings compared to this reference are, for double glazed window with aluminum and wood frames, 124 MJ/yr and 358 MJ/yr. In consequence, respective EROI are 2.2 and 98. Hence, this shows that it is the aluminum frame that kills the performance, illustrating the importance of analyzing the window as a system and not only focusing on the glazing.
An extensive study of life cycle analyses of windows has been carried by Weir in 1998 [77] in the British context [77,78]. She studied many aspect of the windows design. Especially, she studied the utilization of noble gas to fill the window gap. For a 1.2 m × 1.2 m window, the additional energy cost of filling the gap with argon, krypton, and xenon was estimated at 11.83 kJ, 502.2 MJ and 4.5 GJ respectively. These calculations were based on the optimum thickness of the window gap (distance between panes) that is 20 mm for air (used as a reference), 16 mm for argon, 12 mm for krypton, and 8 mm for xenon, respectively.
The window being based on a timber core with an aluminum cladding, the embodied energy of the windows excluding the gas was estimated at 1030.5 MJ. Addition of argon reduced the U-factor of the window from 1.63 W/m2 to 1.3 W/m2. Assuming 2810 heating degree-day (UK average [79]), energy saving over 35 years for the argon would be 2.8 GJ, which provides an EROI of 237,000! This extreme value raises the question about the estimated value of the embodied energy of argon. Values of the U-factors are not given for krypton- and xenon-based windows. Nevertheless, from the figures given in the article, the energy savings can be estimated to be respectively twice and triple that of the argon-based window. Accordingly, respective EROI are 11.2 and 1.9.
Later, the same authors produced a seminal study [80] on energy efficiency of windows. They examined the embodied energy and their impact on energy consumption of five configurations of windows to be used for the replacement of existing ones in four building sited south of Edinburg, UK. For this comparison, it is possible to calculate the impact of adding a layer of low-e coating, a glazing or including a buffer gas (argon or krypton). Accordingly, respective energy payback time and EROI over 35 years can be calculated:
  • • Addition of low-e coating on a double glazed window: EPT = 17–22 days, EROI = 592–758
  • • Addition of argon to a low-e coated and doubled glazed window: EPT < 1 day, EROI = 125,000–134,000
  • • Addition of krypton to a low-e coated and doubled glazed window: EPT = 4.25–11 yr, EROI = 3.2–8.2
  • • Addition of a third glazing and an additional low-e coating to a low-e coated and doubled glazed window with argon filling: EPT = 1.4–1.9 yr, EROI = 18–25
  • • Addition of a third glazing and an additional low-e coating and krypton to a low-e coated and doubled glazed window with argon filling: EPT = 9.6–12.8 yr, EROI = 2.7–3.6
From these numbers, it is clear that it makes little sense to use krypton as an insulating gas, while argon and low-e coating are very effective energy investments. Addition of a third glazing and additional low-e coating is also, though with a lesser impact, a good solution. Indeed, the authors concluded that double and triple argon filled windows are the best options in their climate [77,78,79,80].
Nevertheless, these values are calculated as an additional feature to a new window. Replacement of an existing window by a new one is much more costly in energy. Hence, replacement of an existing double glazed air filled window with the same window with low-e coating and argon insulation has a payback time between 4.2 and 4.9 years (EROI = 7.2–8.3). It should be noted that the frame of these replacement windows was made of aluminum cladded timber, which is among the less energy intensive type [81]. Others types would have an even lower payback. Loss of embodied energy of the original windows and upfront cost of the new ones raises, both in economic and ecologic sense, the question of the relevance of replacing the whole window instead of simply restoring it [82]. Alternatively, replacement should be done when the old windows reach their end of life to avoid wasting its embodied energy.
An interesting aspect of the Menzies and Wherrett paper [80] is that costs are calculated both in energy units and in monetary unit. Calculated monetary payback times are much larger than energy payback times. For low-e coating the ratio is about 90 and a staggering 30,000 for the addition of argon, while it is between 6 and 12 for the addition of an additional glass pane. These last ratios are expected since they are close to the average societal EROI [29]. However, large ratios for the argon and low-e coating can be caused by an erroneous life cycle analysis or simply by the fact that the vendors make a very large profit margin on these features. While this is difficult to prove for the low-e coating, it is much easier to test in the case of argon. From a local producer of argon (Air Liquide Canada), the authors of this study received estimates of the argon embodied energy broadly compatible with that of [80]. In the case of these figures too, the market price of argon is much larger than what would be expected from the embodied energy content. The source of this discrepancy is not known. It might be caused by a large profit of margin or the cost of the production and transport infrastructure, which might be significant compared to the production cost. Further investigation would be needed to clarify the situation.
Recio et al. [83] studied three different windows made of PVC, aluminum and wood. Windows with one and two glazing were studied for the wood frame. For the aluminum based-window, design with and without thermal break were studied. Energy consumption was studied for Prat Lobregat, Barcelona, Spain over a period of 50 years. In those mild climatic conditions, EROI of additional glazing is much lower (EROI = 11.9) than seen previously [76,77,78,79,80]. For the aluminium based-window, the addition of a thermal break reduced the energy consumption for operation by 618.5 kWh. Energy cost of the thermal break is not known, but since the energy involved in the fabrication of the window is 4.8 kWh, it is reasonable to assume that the cost is lower than 0.1 kWh. In these conditions, the EROI exceeds 6000.
Dahlstrøm [84] studied the energy budget of advance windows in the Norwegian context. They noted that the energy payback time of improving the insulation of a window from U = 1.2 to U = 0.8 by an additional glazing and low-e coating to a double window, with argon filling and one low-e coating was roughly a year. Over a 35 years lifetime, this would translate in an EROI ≈ 35, which is broadly consistent with previous values [77,78,79,80]. Also, he found that usage of kypton and xenon increased the environmental impacts by 5% and 20% respectively.

3.3. Whole Building

A brief review is carried out here to demonstrate that the proposed concepts can also be applied perform to whole buildings. This review is nevertheless concise due to space limitation.
Ramesh et al. [85] wrote a review about whole building studies. The EROI calculations are only possible for a fraction of them due to the format in which the results are presented. Nevertheless, this review is generally more useful than the original papers quoted since it provides numerical data instead of only figures. Derived, EROI value are generally good EROI > 10. However, since most of the references are comparative case studies, the original state are not always clearly defined, which makes the EROI value ambiguous.
For a U.S. residential home build in Michigan, Keolian et al. [86] obtained an EROI of 60 from a specific so-called “Energy-Efficient Home” over a period of 50 years. This high EROI can be credited to the numerous strategies for lowering life-cycle energy consumption used. These strategies mainly focused on methods to reduce utility-supplied energy, but the reduction of the embodied energy and increased product durability were also addressed. Uzsilaityte and Martinaitis [87] studied the impact of various rebuilding strategies on a school building in Vilnius, Estonia. The derived EROI values were between 11.9 to 55.5 as a function of the measures that were implemented.
Yohanis and Norton [88] discussed the total energy optimization for a building. They demonstrated that the glazing ratio can be optimized in a similar way as the insulation, since windows reduce the energy consumption on lighting but increase it for cooling and heating. Unfortunately, no exploitable numerical data are given. Therefore, it is not possible to derive precise EROI value. However, from figure inspection, we estimated it to be around †20 for the most favorable cases, because windows have a lower embodied energy density than the walls.
Verbeeck and Hens [89] developed a methodology to optimize low energy buildings simultaneously for energy, environmental impact and costs without neglecting the boundary conditions for thermal comfort and indoor air quality. Their study focuses on types of housing in the Belgian context (terraced house, semi-detached house, detached house and non-compact house). Numerous simulations were performed but only broad numerical ranges of values are given in the paper, therefore giving hard times to use the data meaningfully. Nevertheless, predicted EROI are all above 10 many of them exceeding 25.
Gustavsson and Joelsson [90] studied a wood building with a relatively high operational energy demand. One of the most effective measures to reduce the energy consumption was to insulate the attic and installing energy-efficient windows, with an EROI of 10. Ardente et al. [91] presented the results of an energy and environmental assessment of a set of retrofit actions implemented in the framework of the European Union project “BRITA in PuBs”. Six public buildings energy efficiency actions were investigated. Lifetime evaluated EROI for the proposed measures varied between 6 and 52 (lightning, insulation, ventilation, etc.).
Despite these former results, high EROI are not automatic for every energy efficient measure. For example, Fay et al. [92] obtained an EROI of 3.1 for added insulation to the “Green Home”, a two levels detached brick veneer house built in Melbourne, Australia. Acknowledging this poor gain, the authors suggested that alternative strategies would be more appropriate (high performance windows, reduced infiltration, wider thermostat settings and correctly sized windows oriented appropriately). In a similar way, data from Karlsson and Moshfegh [93] demonstrate that the EROI of the supplement energy investment required to obtain a low energy house with respect to a standard house in Sweden is equal to 6.3 over 50 years. Hernandez et al. [94] studied various energy efficiency strategies for a recent building build in Ireland. They evaluated the EROI for various technical options. Additional insulation EROI was highly dependent on the insulation material (polystyrene EROI = 16.4, cellulose EROI = 115). Triple glazed windows and photovoltaic panel had a low EROI (3.3 and 4, respectively). New boiler and solar water heating provided intermediate EROI (18.8 and 15).

4. Conclusions

This paper shed some light on the issue of energy sobriety by using appropriate definitions of the energy return on investment (EROI). The paper first discusses the intrinsic differences between a watt and a negawatt and how savings and production of energy lead to different interpretation of the EROI. The papers stresses that while production and savings are different from a point of view of positive and negative energy, EROI for savings is always with respect to an existing situation while for production it may concern a situation for which there is nothing to compare with. The paper also introduces the concept of net negative energy investment in the context of an implementation for which the reduction of intrinsic energy in the peripheral systems is higher that the investment required by the actual solution. The paper than defines 4 types of EROI according to the signs of the numerator and denominator.
Then the paper addresses these key concepts from the point of view energy savings as applied to three popular energy savings measures implemented in buildings: insulation, window optimization, and the integration of several measures into a whole building.
Estimated EROI in energy savings strategies are high compared to most energy production strategies [24]. This illustrates the strongly positive impact of energy conservation (savings) on the environment. In consequence, the motto “The cheapest energy is the energy not used” is true in most case we have observed. Nevertheless, in few cases, such as adding an extra foot of insulation on an already well insulated building, this affirmation might be questioned.
Nevertheless, the diminishing return of the adjunction of more insulation in building walls raises the question of the existence of a threshold above which one is better to produce the energy than try to save it. This question is especially important in the light of policies that, for instance, simply copy the passivhaus standard without further optimization with respect to the local climate. The same situation arises when extreme energy consumption reduction is sought at the expense of the embodied energy.
In an upcoming study, the authors will employ the concepts developed here but from the point of view of energy production (rather than savings). Several fashionable local energy production measures advocated for residential, commercial, or institutional buildings will be considered: solar walls, photovoltaic, wind, geoexchange, etc.

Conflict of Interest

The authors declare no conflict of interest.

References

  1. IPCC, Climate Change 2007: Mitigation; Contribution of Working Group III to the Fourth Assessment Report; Cambridge University Press: Cambridge, UK, 2007.
  2. Kesselring, P.; Winter, C.J. World Energy Scenarios: A Two-kilowatt Society, Plausible Future or Illusion? In Proceedings of the Energietage 94, Villigen, Switzerland, 10-12 November 1994.
  3. Pfeiffer, A.; Koschenz, M.; Wokaum, A. Energy and building technology for the 2000 W society—Potential of residential buildings in Switzerland. Energy Build. 2005, 37, 1158–1174. [Google Scholar]
  4. Schulz, T.F.; Kypreos, S.; Barreto, L.; Wokaum, A. Intermediate steps towards the 2000 W society in Switzerland: An energy-economic scenario analysis. Energy Policy 2008, 36, 1303–1317. [Google Scholar] [CrossRef]
  5. Dixit, M.K.; Fernández-Solís, J.L.; Lavy, S.; Culp, C.H. Identification of parameters for embodied energy measurement: A literature review. Energy Build. 2010, 42, 1238–1247. [Google Scholar] [CrossRef]
  6. Arena, A.P.; de Rosa, C. Life cycle assessment of energy and environmental implications of the implementation of conservation technologies in school buildings in Mendoza-Argentina. Build. Environ. 2003, 38, 359–368. [Google Scholar] [CrossRef]
  7. Horvath, A. Construction materials and the environment. Annu. Rev. Energy Environ. 2004, 29, 181–204. [Google Scholar]
  8. Urge-Vorsatz, D.; Novikova, A. Opportunities and Costs of Carbon Dioxide Mitigation in the Worlds Domestic Sector. In Proceedings of the International Energy Efficiency in Domestic Appliances and Lighting Conference ’06, London, UK, 21-23 June 2006.
  9. Langston, Y.L.; Langston, C.A. Reliability of building embodied energy modeling: An analysis of 30 Melbourne case studies. Constr. Manag. Econ. 2008, 26, 147–160. [Google Scholar] [CrossRef]
  10. Lippiatt, B.C. Selecting cost effective green building products: BEES approach. J. Constr. Eng. Manag. 1999, 125, 448–455. [Google Scholar] [CrossRef]
  11. Tommerup, H.; Rose, J.; Svendsen, S. Energy-efficient houses built according to the energy performance requirements introduced in Denmark in 2006. Energy Build. 2007, 39, 1123–1130. [Google Scholar] [CrossRef]
  12. Ding, G. The Development of a Multi-criteria Approach for the Measurement of Sustainable Performance for Built Projects and Facilities. Ph.D. Thesis, University of Technology, Sydney, Australia, 2004. [Google Scholar]
  13. Asif, M.; Muneer, T.; Kelley, R. Life cycle assessment: A case study of a dwelling home in Scotland. Build. Environ. 2007, 42, 1391–1394. [Google Scholar] [CrossRef]
  14. Campogrande, D. The European Construction Industry—Facts and Trends. In Proceedings of the ERA Convention; European Construction Industry Federation (FIEC), Berlin, Germany: 5-6 June 2007.
  15. European Parliament, Report on the Proposal for a Directive of the European Parliament and of the Council on the Energy Performance of Buildings (Recast); COM(2008)0780-C6-0413/2008-2008/0223(COD); European Parliament: Bruxelles, Belgium, 2009 April 6.
  16. Règlementation Thermique. 2012. Available online: http://www.rt-batiment.fr/batiments-neufs/reglementation-thermique-2012/presentation.html (accessed on 4 July 2012).
  17. A National Programme for Energy Efficiency and Energy-Smart Construction. Swedish Government Bill. 2005. Available online: http://www.regeringen.se/sb/d/574/a/63635 (accessed on 4 July 2012).
  18. Harvey, L.D.D. Reducing energy use in the buildings sector: Measures, costs, and example. Energy Effic. 2009, 2, 139–163. [Google Scholar] [CrossRef]
  19. Hall, C.A.S. Migration and metabolism in a temperate stream ecosystem. Ecology 1972, 53, 585–604. [Google Scholar] [CrossRef]
  20. Hall, C.A.S.; Cleveland, C.J. Petroleum drilling and production in the U.S.: Yield per effort and net energy analysis. Science 1981, 211, 576–579. [Google Scholar]
  21. Cleveland, C.J.; Costanza, R.; Hall, C.A.S.; Kaufmann, R. Energy and the U.S. economy: A biophysical perspective. Science 1984, 225, 890–897. [Google Scholar]
  22. Hall, C.A.S.; Cleveland, C.J.; Kaufmann, R. Energy and Resource Quality: The Ecology of the Economic Process; Wiley: New York, NY, USA, 1986. [Google Scholar]
  23. Hall, C.A.S.; Powers, R.; Schoenberg, W. Peak Oil, EROI, Investments and the Economy in an Uncertain Future. In Renewable Energy Systems: Environmental and Energetic Issues; Pimentel, D., Ed.; Elsevier: London, UK, 2008; pp. 113–136. [Google Scholar]
  24. Huijbregts, M.A.; Hellweg, S.; Frischknecht, R.; Hendriks, H.W.; Hungerbühler, K.; Hendriks, A.J. Cumulative energy demand as predictor for the environmental burden of commodity production. Environ. Sci. Technol. 2010, 44, 2189–2196. [Google Scholar]
  25. Ulgiati, S.; Raugei, M.; Bargigli, S. Overcoming the inadequacy of single-criterion approaches to Life Cycle Assessment. Ecol. Model. 2006, 190, 432–442. [Google Scholar] [CrossRef]
  26. Svensson, N.; Roth, L.; Eklund, M.; Mårtensson, A. Environmental relevance and use of energy indicators in environmental management and research. J. Clean. Prod. 2006, 14, 134–145. [Google Scholar] [CrossRef]
  27. Mulder, K.; Hagens, N.J. Energy return on investment: Toward a consistent framework. AMBIO 2008, 37, 74–79. [Google Scholar] [CrossRef]
  28. Gagnon, L. Civilisation and energy payback. Energy Policy 2008, 36, 3317–3322. [Google Scholar] [CrossRef]
  29. Hall, C.A.S.; Balogh, S.; Murphy, D.J.R. What is the minimum EROI that a sustainable society must have? Energies 2009, 2, 25–47. [Google Scholar] [CrossRef]
  30. Polimeni, J.M.; Mayumi, K.; Giampietro, M.; Alacott, B. The Myth of Resource Efficiency; Earthscan: London, UK, 2009. [Google Scholar]
  31. Hammond, G.; Jones, C. Embodied Carbon - The Inventory of Carbon and Energy (ICE); Lowrie, F., Tse, P., Eds.; University of Bath with BSRIA: Bath, UK, 2011. [Google Scholar]
  32. Hernandez, P.; Kenny, P. Zero Energy Houses and Embodied Energy: Regulatory and Design Considerations. In Proceedings of the American Society of Mechanical Engineering 2nd International Conference on Energy Sustainability; Jacksonville, FL, USA: 10-14 August 2008.
  33. Hernandez, P.; Kenny, P. Defining Zero Energy Buildings—A life cycle perspective. In Proceedings of the PLEA 2008—25th Conference on Passive and Low Energy Architecture, Dublin, Ireland, 22-24 October 2008.
  34. Kellenberger, D.; Althaus, H.G. Relevance of simplifications in LCA of building components. Build. Environ. 2009, 44, 818–825. [Google Scholar] [CrossRef]
  35. ISO, Buildings and Constructed Assets—Service-Life Planning—Part 8: Reference Service Life and Service-Life Estimation; ISO 15686-8:2008; International Organization for Standardization (ISO): Geneva, Switzerland, 2008.
  36. Sartori, I.; Hestnes, A.G. Energy use in the life cycle of conventional and low-energy buildings: A review article. Energy Build. 2007, 39, 249–257. [Google Scholar] [CrossRef]
  37. Massachusetts Institute of TechnologyEnergy LaboratoryEnergy Technology Availability: Review of Longer Term Scenarios for Development and Deployment of Climate-Friendly Technologies; Massachusetts Institute of Technology, Energy Laboratory: Cambridge, MA, USA, 1997.
  38. Gregory, A.N.; Yost, P. A transparent, interactive software environment for communicating life cycle assessment results: An application to residential windows. J. Ind. Ecol. 2002, 5, 15–28. [Google Scholar]
  39. Paulsen, J.H.; Borg, M. A building sector related procedure to assess the relevance of the usage phase. Int. J. Life Cycle Assess. 2003, 8, 142–150. [Google Scholar] [CrossRef]
  40. Johnston, D. A Physically Based Energy and Carbon Dioxide Emission Model of the UK Housing Stock. Ph.D. Thesis, Leeds Metropolitan University, Leeds, UK, 2003. [Google Scholar]
  41. Khasreen, M.M.; Banfill, P.F.G.; Menzies, G.F. Life-cycle assessment and the environmental impact of buildings: A review. Sustainability 2009, 1, 674–701. [Google Scholar] [CrossRef]
  42. Guinée, J.B. Life Cycle Assessment: An Operational Guide to the ISO Standards; Kluwer Academic Publishers: Dordrecht, The Netherlands, 2002. [Google Scholar]
  43. Van Oers, L.; de Koning, A.; Guinée, J.B.; Huppes, G. Improving Characterisation Factors for Abiotic Resource Depletion as Recommended in the New Dutch LCA Handbook; Roads and Hydraulic Engineering Institute: Leiden, The Netherlands, 2002. [Google Scholar]
  44. Habert, G.; Bouzidi, Y.; Chen, C.; Jullien, A. Development of a depletion indicator for natural resources used in concrete. Resour. Conserv. Recy. 2010, 54, 364–376. [Google Scholar] [CrossRef]
  45. Habert, G.; Castillo, E.; Morel, J.C. Sustainable Indicators for Resources and Energy in Building Construction. In Proceedings of the Second International Conference on Sustainable Construction Materials and Technologies, Ancona, Italy, 28-30 June 2010.
  46. Muncey, R.W. Optimum thickness of insulation for Australian houses. Aust. J. Appl. Sci. 1955, 6, 486–495. [Google Scholar]
  47. Molnar, J.; Armitage, J.B. Determination of economic thickness of insulation. J. Inst. Engng. Ans. 1968, 40, 129. [Google Scholar]
  48. Barnhart, J.M. Economic thickness of thermal insulation. Chem. Eng. Prog. 1974, 70, 50. [Google Scholar]
  49. Brundrett, G.W. Some effects of thermal insulation on design. Appl. Energy 1975, 1, 7–30. [Google Scholar] [CrossRef]
  50. Probert, S.D.; Giani, S. Economics of thermal insulation. Appl. Energy 1976, 2, 189–204. [Google Scholar] [CrossRef]
  51. Probert, S.D.; Thirst, T.J. Thermal insulation provided by triangular sectioned attic spaces. Appl. Energy 1977, 3, 41–50. [Google Scholar] [CrossRef]
  52. Anani, A.; Jibril, Z. Role of thermal insulation in passive designs of buildings. Sol. Wind Techchnol. 1988, 5, 303–313. [Google Scholar] [CrossRef]
  53. Hasan, A. Optimizing insulation thickness for buildings using life cycle cost. Appl. Energy 1999, 63, 115–124. [Google Scholar] [CrossRef]
  54. Gustafsson, G. Optimisation of insulation measures on existing buildings. Energy Build. 2000, 33, 49–55. [Google Scholar] [CrossRef]
  55. Chaumont, D.; Angers, J.-F.; Frigon, A.; Pacher, G.; Roy, R. Évolution des Conditions Climatiques au Québec, Développement d’un Scenario Climatique Utilisé à des Fins de Prévision de la Demande d’Électricité au Québec sur l’Horizon 2030 (in French); Consortium Ouranos: Montreal, QC, Canada, 2007. [Google Scholar]
  56. Frank, T. Climate change impacts on building heating and cooling energy demand in Switzerland. Energy Build. 2005, 37, 1175–1185. [Google Scholar] [CrossRef]
  57. Gaterell, M.R.; McEvoy, M.E. The impact of energy externalities on the cost effectiveness of energy efficiency measures applied to dwellings. Energy Build. 2005, 37, 1017–1027. [Google Scholar] [CrossRef]
  58. Wang, X.; Chen, D.; Ren, Z. Assessment of climate change impact on residential building heating and cooling energy requirement in Australia. Build. Environ. 2010, 45, 1663–1682. [Google Scholar] [CrossRef]
  59. De Wilde, P. The implications of a changing climate for buildings. Build. Environ. 2012, 55, 1–7. [Google Scholar] [CrossRef] [Green Version]
  60. De Wilde, P.; Tian, W. Management of thermal performance risks in buildings subject to climate change. Build. Environ. 2012, 55, 167–177. [Google Scholar] [CrossRef]
  61. Feist, W. Life-Cycle Energy Balances Compared: Low-Energy House,Passiv House,Self-Sufficient House. In Proceedings of the International Symposium of CIB W67, International Council for Building Research, Vienna, Austria, 4-10 August 1996; pp. 183–190.
  62. Szalay, A.Z.-Z. What is missing from the concept of the new European Building Directive. Build. Environ. 2006, 42, 1781–1769. [Google Scholar]
  63. Comaklı, K.; Yüksel, B. Optimum insulation thickness of external walls for energy saving. Appl. Therm. Eng. 2003, 23, 473–479. [Google Scholar] [CrossRef]
  64. Bolattürk, A. Determination of optimum insulation thickness for building walls with respect to various fuels and climate zones in Turkey. Appl. Therm. Eng. 2006, 26, 1301–1309. [Google Scholar] [CrossRef]
  65. Dombaycı, Ö.A.; Gölcü, M.; Pancar, Y. Optimization of insulation thickness for external walls using different energy-sources. Appl. Energy 2006, 83, 921–928. [Google Scholar] [CrossRef]
  66. Kurt, H. The usage of air Gap in the composite wall for energy saving and air pollution. Environ. Prog. Sustain. Energy 2011, 30, 450–458. [Google Scholar] [CrossRef]
  67. Daouas, N.; Hassen, Z.; Ben Aissia, H. Analytical periodic solution for the study of thermal performance and optimum insulation thickness of building walls in Tunisia. Appl. Therm. Eng. 2010, 30, 319–326. [Google Scholar] [CrossRef]
  68. Daouas, N. A study on optimum insulation thickness in walls and energy savings in Tunisian buildings based on analytical calculation of cooling and heating transmission loads. Appl. Energy 2011, 88, 156–164. [Google Scholar] [CrossRef]
  69. Mahlia, T.M.I.; Iqbal, A. Cost benefits analysis and emission reductions of optimum thickness and air gaps for selected insulation materials for building walls in Maldives. Energy 2010, 35, 2242–2250. [Google Scholar] [CrossRef]
  70. Harvey, L.D.D. Net climatic impact of solid foam insulation produced with halocarbon and non-halocarbon blowing agents. Build. Environ. 2007, 42, 2860–2879. [Google Scholar] [CrossRef]
  71. Bribián, I.Z.; Uséon, A.A.; Scarpellini, S. Life cycle assessment in buildings: State-of-the-art and simplified LCA methodology as a complement for building certification. Build. Environ. 2009, 44, 2510–2520. [Google Scholar] [CrossRef]
  72. Masoso, O.T.; Grobler, L.J. A new and innovative look at anti-insulation behaviour in building energy consumption. Energy Build. 2008, 40, 1889–1894. [Google Scholar] [CrossRef]
  73. Huberman, N. Life Cycle Energy Costs of Building Materials: Alternatives for a Desert Environment. M.Sc. Thesis, Ben-Gurion University of the Negev, Beer-Sheva, Israel, 2007. [Google Scholar]
  74. Pulselli, R.M.; Simoncini, E.; Marchettini, N. Energy and emergy based cost-benefit evaluation of building envelopes relative to geographical location and climate. Build. Environ. 2009, 44, 920–928. [Google Scholar] [CrossRef]
  75. Utama, A.; Gheewala, S.H. Indonesian residential high rise buildings: A life cycle energy assessment. Energy Build. 2009, 41, 1263–1268. [Google Scholar] [CrossRef]
  76. Saito, M.; Shukuya, M. Energy and material use in the production of insulating glass windows. Solar Energy 1996, 58, 247–252. [Google Scholar] [CrossRef]
  77. Weir, G. Life Cycle Assessment of Multi-Glazed Windows. Ph.D. Thesis, Napier University, Napier, Australia, 1998. [Google Scholar]
  78. Weir, G.; Muneer, T. Energy and environmental impact analysis of double-glazed windows. Energy Convers. Manag. 1998, 39, 243–256. [Google Scholar] [CrossRef]
  79. Baumert, K.; Selman, M. Heating and Cooling Degree Days; World Resources Institute: Washington, DC, USA, 2003. [Google Scholar]
  80. Menzies, G.F.; Wherrett, J.R. Multiglazed windows: Potential for savings in energy, emissions and cost. Build. Serv. Eng. Res. Technol. 2005, 26, 249–258. [Google Scholar] [CrossRef]
  81. Asif, M.; Muneer, T.; Kubie, J. Sustainability analysis of window frames. Build. Serv. Eng. Res. Technol. 2005, 26, 71–87. [Google Scholar] [CrossRef]
  82. Sedovic, W.; Gorrhelf, J.H. What replacement windows can’t replace: The real cost of removing historic windows. APT Bull. J. Preserv. Technol. 2005, 36, 25–29. [Google Scholar]
  83. Recio, J.M.B.; Narvaez, R.P.; Guerrero, P.J. Estimate of energy consumption and CO2 emission associated with the production, use and final disposal of PVC, aluminium, and wooden windows. Département de Projectes d’Engineyeria, Universitat Politecnica de Catalunya, Environmental Modelling Lab., Barcelona, Spain, 2005. Available online: http://www.pvcinfo.be/bestanden/Baldasano%20study_windows.pdf (accessed on 4 July 2012).
  84. Dahlstrøm, O. Modern Highly Effective Windows; Report; NTNU: Trondheim, Sweden, 2010. [Google Scholar]
  85. Ramesh, T.; Prakash, R.; Shukla, K.K. Life cycle energy analysis of buildings: An overview. Energy Build. 2010, 42, 1592–1600. [Google Scholar] [CrossRef]
  86. Keoleian, G.A.; Blanchard, S.; Reppe, P. Life-cycle energy, costs, and strategies for improving a single-family house. J. Ind. Ecol. 2001, 4, 135–156. [Google Scholar]
  87. Uzsilaityte, L.; Martinaitis, V. Impact of the Implementation Energy Saving Measure on the Life Cycle Energy Consumption of the Building. In Proceedings of the 7th International Conference Environmental Engineering, Vilnius Gediminas Technical University, Vilnius, Lithuania, 22-23 May 2008.
  88. Yohanis, Y.G.; Norton, B. Life-cycle operational and embodied energy for a generic single-storey office building in the UK. Energy 2002, 27, 77–92. [Google Scholar] [CrossRef]
  89. Verbeeck, G.; Hens, H. Life cycle inventory of buildings: A contribution analysis. Build. Environ. 2010, 45, 964–967. [Google Scholar] [CrossRef]
  90. Gustavsson, L.; Joelsson, A. Life cycle primary energy analysis of residential buildings. Energy Build. 2010, 42, 210–220. [Google Scholar] [CrossRef]
  91. Ardente, F.; Beccali, M.; Cellura, M.; Mistretta, M. Energy and environmental benefits in public buildings as a result of retrofit actions. Renew. Sustain. Energy Rev. 2011, 15, 460–470. [Google Scholar] [CrossRef]
  92. Fay, R.; Treloar, G.; Iyer-Raniga, U. Life-cycle energy analysis of buildings: A case study. Build. Res. Inf. 2000, 28, 31–41. [Google Scholar] [CrossRef]
  93. Karlsson, J.F.; Moshfegh, B. A comprehensive investigation of a low-energy building in Sweden. Renew. Energy 2007, 32, 1830–1841. [Google Scholar] [CrossRef]
  94. Hernandez, P.; Cavanagh, S.; Brophy, V.; Futcher, J.; Szalay, Z.; Kenney, P. The Challenge of Refurbishing recentely Built Apartments: A Life Cycle Perspective. In Proceedings of the Paper Presented at the SB10mad: International Sustainable Building Conference, Madrid, Spain, 28-30 April 2010.

