1. Introduction
Sustainability is a multidimensional concept covering environmental, social and economic dimensions. Operationalizing the qualitative concept of sustainability to practical quantitative measures has proved challenging due to the variety of meanings attached to sustainability [
1,
2,
3]. The sustainable value (SV) method [
4,
5] is one of the approaches measuring the contribution of an economic entity towards the sustainability (or sustainable development) and has been applied in a number of studies [
6,
7,
8,
9]. A firm creates a positive SV whenever it uses its bundle of resources more efficiently than another firm would have used it. In other words, it compares performance of a firm to a benchmark. The benchmark can be seen as a reference group that sets the performance target for the evaluated firm. The production technology available for the benchmark firm is the benchmark technology. It can be characterized by the production function, which indicates the maximum amount of output that the benchmark technology can produce using the given amounts of input resources.
The recent study by Kuosmanen and Kuosmanen [
10] shows that the conventional SV method rests on a number of strong and unrealistic assumptions. Building an explicit link between the SV method and frontier approach to environmental performance assessment, Kuosmanen and Kuosmanen develop the generalized sustainable value method (GSV). In this approach, a benchmark technology is estimated from empirical data using established econometric methods. Furthermore, they demonstrated mathematically that the SV and sustainable efficiency are the special cases of the standard efficiency indices known in the field of productive efficiency analysis for more than five decades. In the follow up study [
11], the GSV method was applied to firm level data to assess corporate contributions towards sustainability in agriculture. The study included a detailed examination and classification of alternative methods available for estimating the benchmark technology in the context of GSV, and demonstrated the use of GSV in estimating the benchmark technology by an empirical application to Finnish dairy farms.
Previous empirical applications of the conventional SV and GSV methods assess data of individual firms or aggregate entities such as industries, sectors, or countries (see [
6,
7,
8,
9,
11]). However, the connection between the firm level analysis and the aggregate level analysis has not been formally investigated. The results from the parallel literature on efficiency indices (see [
12,
13,
14]) suggest that consistent aggregation of SV and GSV indices is far from self-evident. In general, the coordination and efficient allocation of resources across individual firms is of critical importance for efficiency of an aggregate entity, such as a country or an industry, but the coordination does not play any role at the firm level efficiency assessment. Although industry data are obtained by summing the data of all firms operating in the industry, there is no guarantee that the SV or GSV indices of firms sum up to the industry level SV and GSV measures.
The objective of this paper is to develop a systematic framework for a consistent aggregation of the firm level GSV indices to a sectoral, a regional, or an industry levels. By consistent aggregation, we mean that the generalized sustainable value measures of individual firms can be added up to obtain the generalized sustainable value measure of the aggregate entity, and that the same result is obtained if we assess the generalized sustainable value of the aggregate entity directly. The main contribution of this study is to show that the GSV method proposed in [
10] is not restricted to the firm level, and that consistent aggregation is indeed possible.
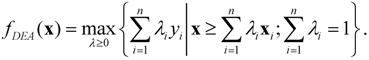
We first develop a consolidated theoretical framework for estimating an aggregate sustainability measure of firm’s performance for any group of firms in a specific sector, specialization, region, or any other group, such that resulting measures are consistent with the firm level estimates. We then apply data of the Farm Accountancy Data Network (FADN) for Finland and illustrate the proposed method by an empirical application to crop and dairy sectors. We estimate the benchmark technologies by data envelopment analysis (DEA) [
15,
16]. Finally, the results of the empirical application show that the aggregate GSV method can be usefully applied in a comparative analysis of different sectors.
The remainder of the paper is organized as follows.
Section 2 briefly reviews the generalized approach of estimating corporate contributions towards sustainability at the firm level.
Section 3 establishes a theoretical framework for estimating contributions towards sustainability at the aggregate level, such as a sector, region or an industry. In
Section 4 the proposed methodology is illustrated by an empirical application and
Section 5 concludes.
2. Measuring Contributions Towards Sustainability at Firm Level
Following the definition of the
generalized sustainable value (GSV) presented in [
10], assume firm
i transforms a vector of
R resources, including natural, physical, human, and intellectual capital,
![Sustainability 05 01568 i001]()
, into the economic output denoted by
![Sustainability 05 01568 i002]()
, for every
![Sustainability 05 01568 i003]()
, where
n is the number of firms in the sample. We assume that output
y is measured in monetary units (e.g., euros, dollars, pounds). GSV is defined as the difference between firm
i’s economic output,
![Sustainability 05 01568 i002]()
, produced by using a bundle of resources
![Sustainability 05 01568 i001]()
and their opportunity cost, denoted by
![Sustainability 05 01568 i004]()
:
The rationale behind Equation (1) is analogous to the conceptual definition of the conventional SV method proposed in [
4], but differs from its operational measure. Importantly, in (1), the opportunity cost can be a nonlinear function of resources, and the functional form does not need to be assumed
a priori.
Since opportunity cost of resources is not directly observable, it must be estimated in one way or another. In economics, the opportunity cost of using a resource for a specific activity refers to the income foregone by not using the resource in the best alternative activity. However, the best alternative use is not always self-evident: it generally depends on the technology and the other resources available for the alternative activity. In mathematical terms, the technology available to a firm is described by a neoclassical production function f(x), which is the maximum amount of output that can be obtained from the given amounts of input resources. We assume that function f is an increasing and concave function. Hence, without loss of generality, we may interpret the numerical value of the production function f(x) as the total opportunity cost of resource bundle x.
Applying the previous insights, the GSV measure (1) can be rewritten as:
Note that Equation (2) is not restricted to any particular functional form of the production function
f. It allows resources to be interdependent and allows non-substitutability between resources. Furthermore, it allows preserving some critical level of resources, which is in line with the strong sustainability concept. In (2), the production technology
f can be estimated from empirical data using well established econometric methods, such as stochastic frontier analysis (SFA) or data envelopment analysis (DEA), see e.g., [
17] for a review of these methods. In the context of the GSV, for a review of econometric approaches to estimating production functions and environmental performance can be found in [
11].
3. Measuring Contributions Towards Sustainability at the Aggregate Level
We next consider an aggregation of firm level GSV measures to a sector, region and an industry level. This exercise is not as straightforward as it might seem. Firstly, consider the following example.
Suppose there are two firms: A:
![Sustainability 05 01568 i007]()
and B:
![Sustainability 05 01568 i008]()
, where
x and
y are input resource unit and output unit, respectively. The production function is given by the equation:
![Sustainability 05 01568 i009]()
. Thus, total resource use is simply sum of the firms’ resource units,
![Sustainability 05 01568 i010]()
, and total output is
![Sustainability 05 01568 i011]()
. Note that both firms are technically efficient, which means that it is impossible to increase output at the given allocation of resources. However, it is possible to increase output by reallocating resources. For instance, if firm B is split into nine separate firms, each endowed with one unit of resource to produce 1 unit of output, the total output would increase from 4 to 10.
In theory, the optimal allocation in this example would involve creating an infinite number of infinitesimally small firms that use a positive but infinitesimally small quantity of resource, i.e.,
x approaches to 0 for all firms. This example demonstrates that even if firms are technically efficient at the firm level, there may be a lack of coordination, which shows as inefficiency at the aggregate level. Although the average inefficiency of the two firms is zero, the average vector:
is inefficient, because
![Sustainability 05 01568 i013]()
, and thus
![Sustainability 05 01568 i014]()
.
Hence, the average of the firm level GSV is different from the GSV of the average vector. Whether we use the firm level or the aggregate level data, it is important to ensure that the firm level GSV measures match with their counterparts at the aggregate level.
The purpose of the previous numerical example is to illustrate the importance of coordination and efficient allocation of resources across firms at the aggregate level efficiency assessment. In the previous example, the production function exhibits decreasing returns to scale, which favors small scale production. However, the example could be easily adapted to constant or increasing returns to scale. The main point of the example is to demonstrate that the SV or GSV statistics of the firm do not always add up to their counterparts at the industry level.
To develop a simple but systematic aggregation scheme, we propose the following aggregate GSV measure. Consider a group of firm
![Sustainability 05 01568 i015]()
, representing firms in a specific sector, specialization, region, country, or any other group. Assume that firms in group
I have access to the same production technology described by the production function
f(
x). The production function
f is increasing and concave function and indicates the maximum amount of output that can be obtained from the given amounts of input resources.
To pave the way for the aggregate GSV formulation, we introduce a
representative firm of group
I that is characterized by the average output and average resource vector. The average resource vector is calculated as:
where vector
![Sustainability 05 01568 i001]()
characterizes the resource use by firm
i.
The average output of group
I is calculated as:
Where
![Sustainability 05 01568 i002]()
is output of firm
i.
These average values
![Sustainability 05 01568 i018]()
and
![Sustainability 05 01568 i019]()
characterize the representative firm of group
I. The representative firm’s data are next included in the data set as an additional entity; and the production technology
f is estimated by some econometric method available (see e.g., [
11]).
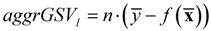
Given the production function
f, the aggregate GSV measure is calculated as the GSV of the representative firm of group
I, denoted as
![Sustainability 05 01568 i020]()
, multiplied by the number of firms in group
I:
where the sustainable value measure of the representative firm
![Sustainability 05 01568 i020]()
is the difference between the average output of group
I,
![Sustainability 05 01568 i019]()
(or output of the representative firm), and the numerical value of the production function
![Sustainability 05 01568 i022]()
in point
![Sustainability 05 01568 i018]()
:
Alternatively, the aggregate GSV can be presented as:
Note that the proposed aggregate GSV measure has a compelling profit interpretation. Define the profit function as:
Without loss of generality, the output price can be normalized as one, so that
y represents both the output quantity and the revenue. The profit function indicates the maximum profit obtainable at given input prices
w [
18]. The notion of profit efficiency was first introduced in [
19], where two alternative measures of profit efficiency were suggested: the ratio measure as a ratio of observed profit to maximum profit and the difference measure as a difference between observed and maximum profit. The ratio measure is generally ill-defined if the maximum profit equals zero. Moreover, it is difficult to interpret when maximum and/or actual profit levels are negative. In contrast, the difference measure has a natural interpretation in terms of chosen currency units, and it is allows managing negative or zero profits.
The aggregate GSV can be interpreted as the profit efficiency of the group I at the most favorable prices from the perspective of group I.
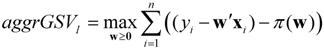
Theorem: The aggregate GSV measure ![Sustainability 05 01568 i024]() indicates the sum of profit efficiencies of the firms in group I at the most favorable non-negative input prices. Specifically:
indicates the sum of profit efficiencies of the firms in group I at the most favorable non-negative input prices. Specifically: The proof to the theorem is provided in the appendix.
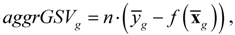
Formulation of the aggregate GSV can be extended to any group of firms, for example, firms located in a specific region. For estimating production frontier and aggregate GSV measures, the evaluated groups of firms should be sufficiently comparable, in the sense that all firms have access to the same production technology
f. For example, let the average output and the average resource vector of group
g be
![Sustainability 05 01568 i027]()
and
![Sustainability 05 01568 i028]()
. Then, the aggregate GSV of group
g is
where
n is the number of firms in group
g.
We next outline two extensions to the aggregation method developed above.
Firstly, suppose we observe a sample of
n firms, which form a subset of the population of
N firms. We can calculate the aggregate GSV measure for the observed sample by applying Equation (9). However, if we are interested in the GSV of the full population of
N firms, we need to assume that observed sample is representative enough for estimating the population averages
![Sustainability 05 01568 i027]()
and
![Sustainability 05 01568 i028]()
by using the sample means (e.g., the observed firms are randomly drawn from the population to the sample). If the sample is indeed representative of the population, then the aggregate GSV formula (9) can be adapted for calculating the GSV of the population by simply replacing the sample size
n by the size of the population
N.
Secondly, suppose the firms located in a specific region do not engage in a similar set of operations and have different production technology, e.g., dairy and crop farms. In this case, one can estimate the aggregate GSV of each group first. Since the GSV measure is expressed in monetary units (e.g., euros, dollars, or pounds), one can subsequently add together the resulting GSV measures. For example, the aggregate GSV of dairy and crop farms as two separate groups located in the same region can be calculated as the sum of the aggregate GSV measures of each group:
or:
where
k and
m are the number of farms in the groups of dairy and crop farms, respectively. In formula (10), the expressions within the brackets are the GSVs of the representative crop and dairy farms, respectively.
4. Empirical Application
This section presents two illustrative applications of estimating the aggregate GSV measure at sector level based on the data of 332 Finnish dairy farms and 142 crop farms. The data were extracted from the Farm Accountancy Data Network (FADN) database. According to [
20], there were 17,480 dairy farms and 28,979 crop farms in Finland in 2004.
The economic output of crop farms is the total revenue from crops and crop products and the economic output of dairy farms is the total revenue from milk and other products in euro. Economic resources include labor in hours, total utilized agricultural area (UAA) measured in hectares and farm capital, which is comprised of livestock, permanent crops, land improvements, buildings, machinery and equipment, circulating capital, and measured in euro. Environmental resources include the total energy cost and cost of fertilizers. An overview of the key characteristics of the data is presented in
Table 1,
Table 2 in the form of mean, standard deviation, minimum and maximum values .
Table 1.
Descriptive statistics for the sample of dairy farms; year 2004, sample size n=332.
Table 1.
Descriptive statistics for the sample of dairy farms; year 2004, sample size n=332.
| Variable | Mean | St. Dev. | Min | Max |
|---|
| Total output, € | 91,676 | 52,336 | 16,671 | 393,392 |
| Labor, hr | 5,123 | 1,719 | 399 | 13,458 |
| Farm capital, € | 261,150 | 191,099 | 18,779 | 1,481,375 |
| Energy, € | 5,843 | 3,561 | 713 | 25,541 |
| UAA, ha | 49.1 | 25.4 | 13.1 | 146.8 |
| Fertiliser, € | 4,746 | 3,558 | 0 | 22,922 |
Table 2.
Descriptive statistics for the sample of crop farms; year 2004, sample size n = 141.
Table 2.
Descriptive statistics for the sample of crop farms; year 2004, sample size n = 141.
| Variable | Mean | St. Dev. | Min | Max |
|---|
| Total output, € | 54,838 | 54,349 | 2,493 | 342,863 |
| Labor, hr | 2,139 | 1,286 | 160 | 6,807 |
| Farm capital, € | 228,020 | 162,428 | 32,599 | 997,866 |
| Energy, € | 7,074 | 4,770 | 692 | 34,973 |
| UAA, ha | 80.5 | 44.5 | 22.1 | 324.3 |
| Fertiliser, € | 7,018 | 5,209 | 0 | 28,535 |
Firstly, the average values for the
representative dairy ![Sustainability 05 01568 i032]()
and
crop farms ![Sustainability 05 01568 i033]()
were calculated. Next, the representative farms’ data were included in the data samples and the benchmark technologies for both sectors were estimated using output oriented DEA model with variable returns to scale:
The resulted efficiency score of the representative crop farm was 0.513, which means that the representative crop farm achieved only about half of its potential output. The efficiency score of the representative dairy farm was 0.649, that is, somewhat higher than for the representative crop farm. Next, the GSV values for both representative farms were calculated and resulted in about −52,102 euro for the representative crop farm and −49,615 euro for the representative dairy farm. The results are negative by construction, since in the DEA model, the frontier envelopes the observed data from above and only farms with GSV = 0 are diagnosed as efficient. This means that the loss due to inefficiency was about 50 thousand euro for both the representative crop and the representative dairy farm.
To obtain the aggregate GSV measures for dairy and crop sectors, the estimated GSV values of the representative farms were multiplied by the number of farms in the sectors (17,480 dairy farms and 28,979 crop farms). Thus, the aggregate GSV of the Finnish crop sector resulted in about −1,510 million euros in year 2004 and the aggregate GSV of the Finnish dairy sector resulted in about −876 million euros for the same year.
Finally, it is worth to recognize the limitations of the previous analysis, which is intended as an illustration of the methodological development. Firstly, the FADN sample is not a random sample, and hence not necessarily representative of the Finnish agriculture as a whole. We would expect the FADN farms to be on average more efficient than the non-FADN farms. Secondly, the environmental indicators considered in this application are very rough proxies. Thirdly, the DEA method used for estimating the frontier assumes away noise, which is a very restrictive assumption in the present application. Addressing these problems would provide a fruitful avenue for future research.


 , into the economic output denoted by
  , for every
  , where n is the number of firms in the sample. We assume that output y is measured in monetary units (e.g., euros, dollars, pounds). GSV is defined as the difference between firm i’s economic output,
  :
:
 and B:
  , where x and y are input resource unit and output unit, respectively. The production function is given by the equation:
  . Thus, total resource use is simply sum of the firms’ resource units,
  , and total output is
  . Note that both firms are technically efficient, which means that it is impossible to increase output at the given allocation of resources. However, it is possible to increase output by reallocating resources. For instance, if firm B is split into nine separate firms, each endowed with one unit of resource to produce 1 unit of output, the total output would increase from 4 to 10.
 , and thus
  .
.  , representing firms in a specific sector, specialization, region, country, or any other group. Assume that firms in group I have access to the same production technology described by the production function f(x). The production function f is increasing and concave function and indicates the maximum amount of output that can be obtained from the given amounts of input resources.
 and
and  characterize the representative firm of group I. The representative firm’s data are next included in the data set as an additional entity; and the production technology f is estimated by some econometric method available (see e.g., [11]).
  , multiplied by the number of firms in group I:
 in point
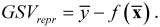
 .
.

 and
and  . Then, the aggregate GSV of group g is


 and crop farms
  were calculated. Next, the representative farms’ data were included in the data samples and the benchmark technologies for both sectors were estimated using output oriented DEA model with variable returns to scale: