Article

The Impact of Climate, CO2 and Population on Regional Food and Water Resources in the 2050s

Met Office Hadley Centre, Exeter, Devon EX1 3PB, UK
*
Author to whom correspondence should be addressed.
Sustainability 2013, 5(5), 2129-2151; https://doi.org/10.3390/su5052129
Submission received: 29 March 2013 / Revised: 19 April 2013 / Accepted: 2 May 2013 / Published: 10 May 2013
(This article belongs to the Special Issue 40th Anniversary of 'The Limits to Growth')

Abstract

:
Population growth and climate change are likely to impact upon food and water availability over the coming decades. In this study we use an ensemble of climate simulations to project the implications of both these drivers on regional changes in food and water. This study highlights the dominant effect of population growth on per capita resource allocation over climate induced changes in our model projections. We find a strong signal for crop yield reductions due to climate change by the 2050s in the absence of CO2 fertilisation effects. However, when these additional processes are included this trend is reversed. The impacts of climate on water resources are more uncertain. Overall, we find reductions in the global population living in water stressed conditions due to the combined effects of climate and CO2. Africa is a key region where projected decreases in runoff and crop productivity from climate change alone are potentially reversed when CO2 fertilisation effects are included, but this is highly uncertain. Plant physiological response to increasing atmospheric CO2 is a major driver of the changes in crop productivity and water availability in this study; it is poorly constrained by observations and is thus a critical uncertainty.

1. Introduction

In 1972, “Limits to Growth” [1] was published, which set about examining the future interactions of the global economy. It substantially influenced the sustainability debate and suggested the potential for “overshoot and collapse” in the economy. The World3 model, basis for the arguments set out in “Limits to Growth”, was one of the first integrated assessment models, in which feedbacks are permitted between different interacting components. In World3, among these were population, pollution and food production. Since the time of first publication, the emergence of climate change as a pre-eminent global issue has refined the scientific debate towards the interaction of climate change with population growth and food and water resources. A changing climate has been highlighted as a potential limiting factor in meeting the needs of a growing global population for food [2]. Agriculture consumes the vast majority—around 80%—of human-appropriated freshwater resources [3]. As a key driver of agricultural production, water resources are critical for future global food security [4]. Irrigated land accounts for 19% of the global land under cultivation, but disproportionately supplies 40% of the world’s food production [5]. Irrigation is often seen as a possible adaptation strategy for agriculture to climate change and population pressure [6]. However, regionally, freshwater resources are under pressure due to demographic, economic and climatic drivers which results in a large proportion of the global population currently living in water scarce conditions [7].
There have been recent climate-related pressures upon food markets, such as through the crop failures of the Russian heat wave of 2010 [8] or drought conditions in Australia or the United States. Episodes of severe hunger periodically affect several parts of the world, notably in Africa where food security can be fragile and readily disrupted. These events have brought into focus how weather and climate can contribute to volatility in food security for the contemporary global population. In turn, food insecurity can have a range of far-reaching social, economic and geopolitical consequences. Food security is a multi-dimensional issue of availability, stability, utilization and access, but the influence of climate extends across each aspect [9].
The response of the global climate system to increasing greenhouse gas concentrations is manifest through changes in regional climates around the world and spatially-varying impacts on interconnected natural and human systems. Many previous assessments of the impacts of climate change have focused on time horizons towards the end of the 21st century, illustrating the effects of following different emissions pathways. However, uncertainties in climate change projections expand in the second part of the century, which reflects in part the growing uncertainties in the assumptions underlying the emissions scenarios, including population growth. Even if emissions were to be stabilised now, the pre-existing and long lived greenhouse gases in the atmosphere, the thermal inertia of the climate system and the timescales of change in socio-economic systems required to influence greenhouse gas emissions mean that there is likely to be ongoing warming for the coming decades. Hence some level of adaptation to climate change is required in the near term.
In this study we focus on the 2050s as a timescale relevant to adaptation planning but still highlights potential changes in food and water resources under climate change. In addition, the analysis is carried out at the regional scale. Although food is a global commodity, and hence so is the embedded “virtual water”, the freshwater resources required in the production process are local. Moreover, there are regional differences in degree and nature of the engagement with global food markets, and so a global scale analysis may be inadequate for assessing the effects of the drivers considered here on food security. We use a large ensemble from the comprehensive HadCM3 climate model [10,11] to sample uncertainty in future climate and CO2 physiological response and the associated impacts on food and water resources. This ensemble also allows us to investigate the effects of CO2 on crop productivity and runoff through plant physiological response. The CO2 physiological response is fundamentally uncertain [12] and poorly constrained by observations, and so we sample this uncertainty within the modelling framework. The simulated changes in crop productivity and runoff are combined with population data to explore the important drivers of change and their interactions over the coming decades. Using simple metrics describing crop production and runoff per capita allows for the consideration of uncertainties and requirements for adaptation over the coming decades. Although this study aims to examine the large-scale uncertainties in potential food and water availability, more detailed work is required to make regional adaptation policy.

2. Methodology

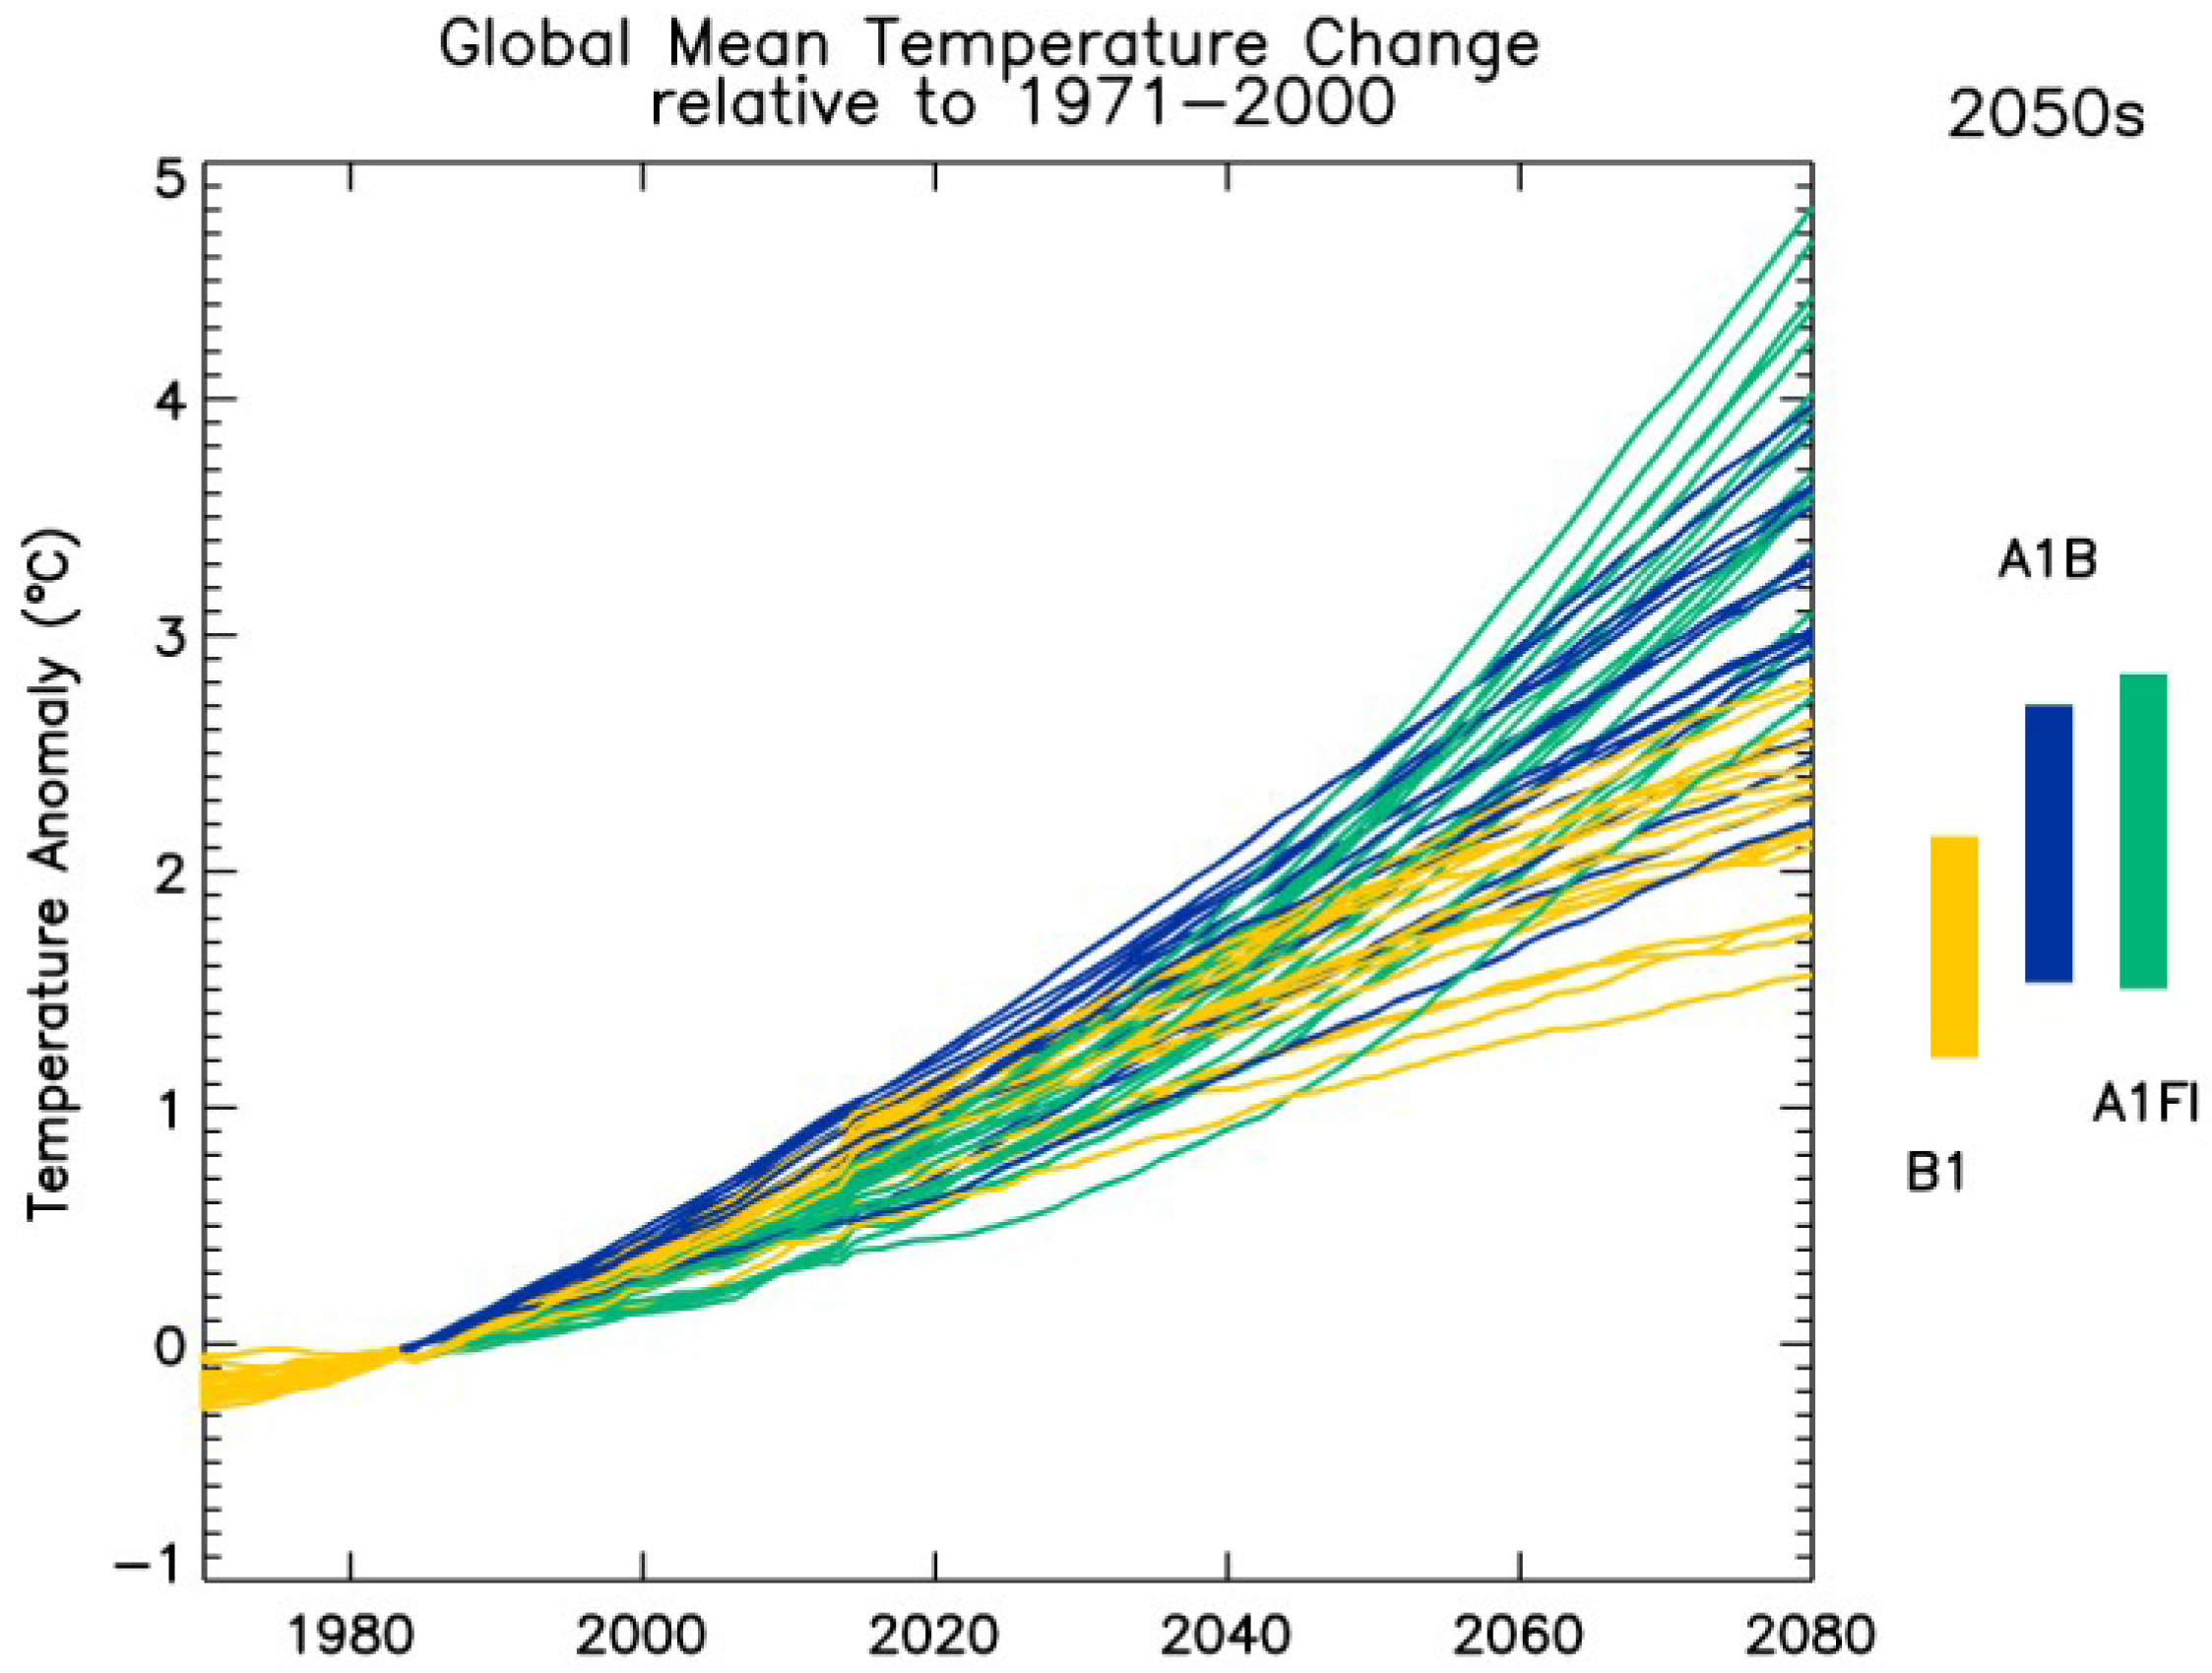
The study uses a Global Climate Model (GCM) with the capability of simulating changes in plant productivity and the hydrological cycle. To capture the uncertainty in 2050s climate and the uncertainty in processes relating to the food and water cycles we use a 17-member perturbed physics ensemble driven by historical and future SRES (Special Report in Emissions Scenarios) [13] scenarios, which include changes in greenhouse gases, volcanic events, solar and ozone changes and natural and sulphate aerosol emissions (described in Collins et al. [14]). The warming projected by the perturbed physics ensemble under the B1, A1B and A1FI scenarios is shown in Figure 1. The A1 scenario is characterised by rapid economic growth in a partially converging world, two subsets of the A1 scenario are used here: A1FI is the full intensity scenario with a strong emphasis on fossil-fuels as an energy source, and A1B is the balanced scenario with an emphasis on a range of energy sources. A second scenario, B1, is also used, which is characterised by a move away from carbon intensive industries to an information economy based on cleaner energy sources. By the 2050s the change in global mean temperature ranges from 1.2 to 2.8 °C, with the dominant uncertainty coming from the climate process modelling rather than the scenario uncertainty. Therefore, there is a clear need for socio-economic systems to adapt to future warming, independent of the particular scenario. As the scenario uncertainty is less than the physical climate uncertainty by the 2050s in this study we only look at the A1B scenario. It should be noted that none of these scenarios explicitly include efforts to mitigate future climate change: a future scenario which includes climate mitigation may have a significantly reduced level of warming by the 2050s.
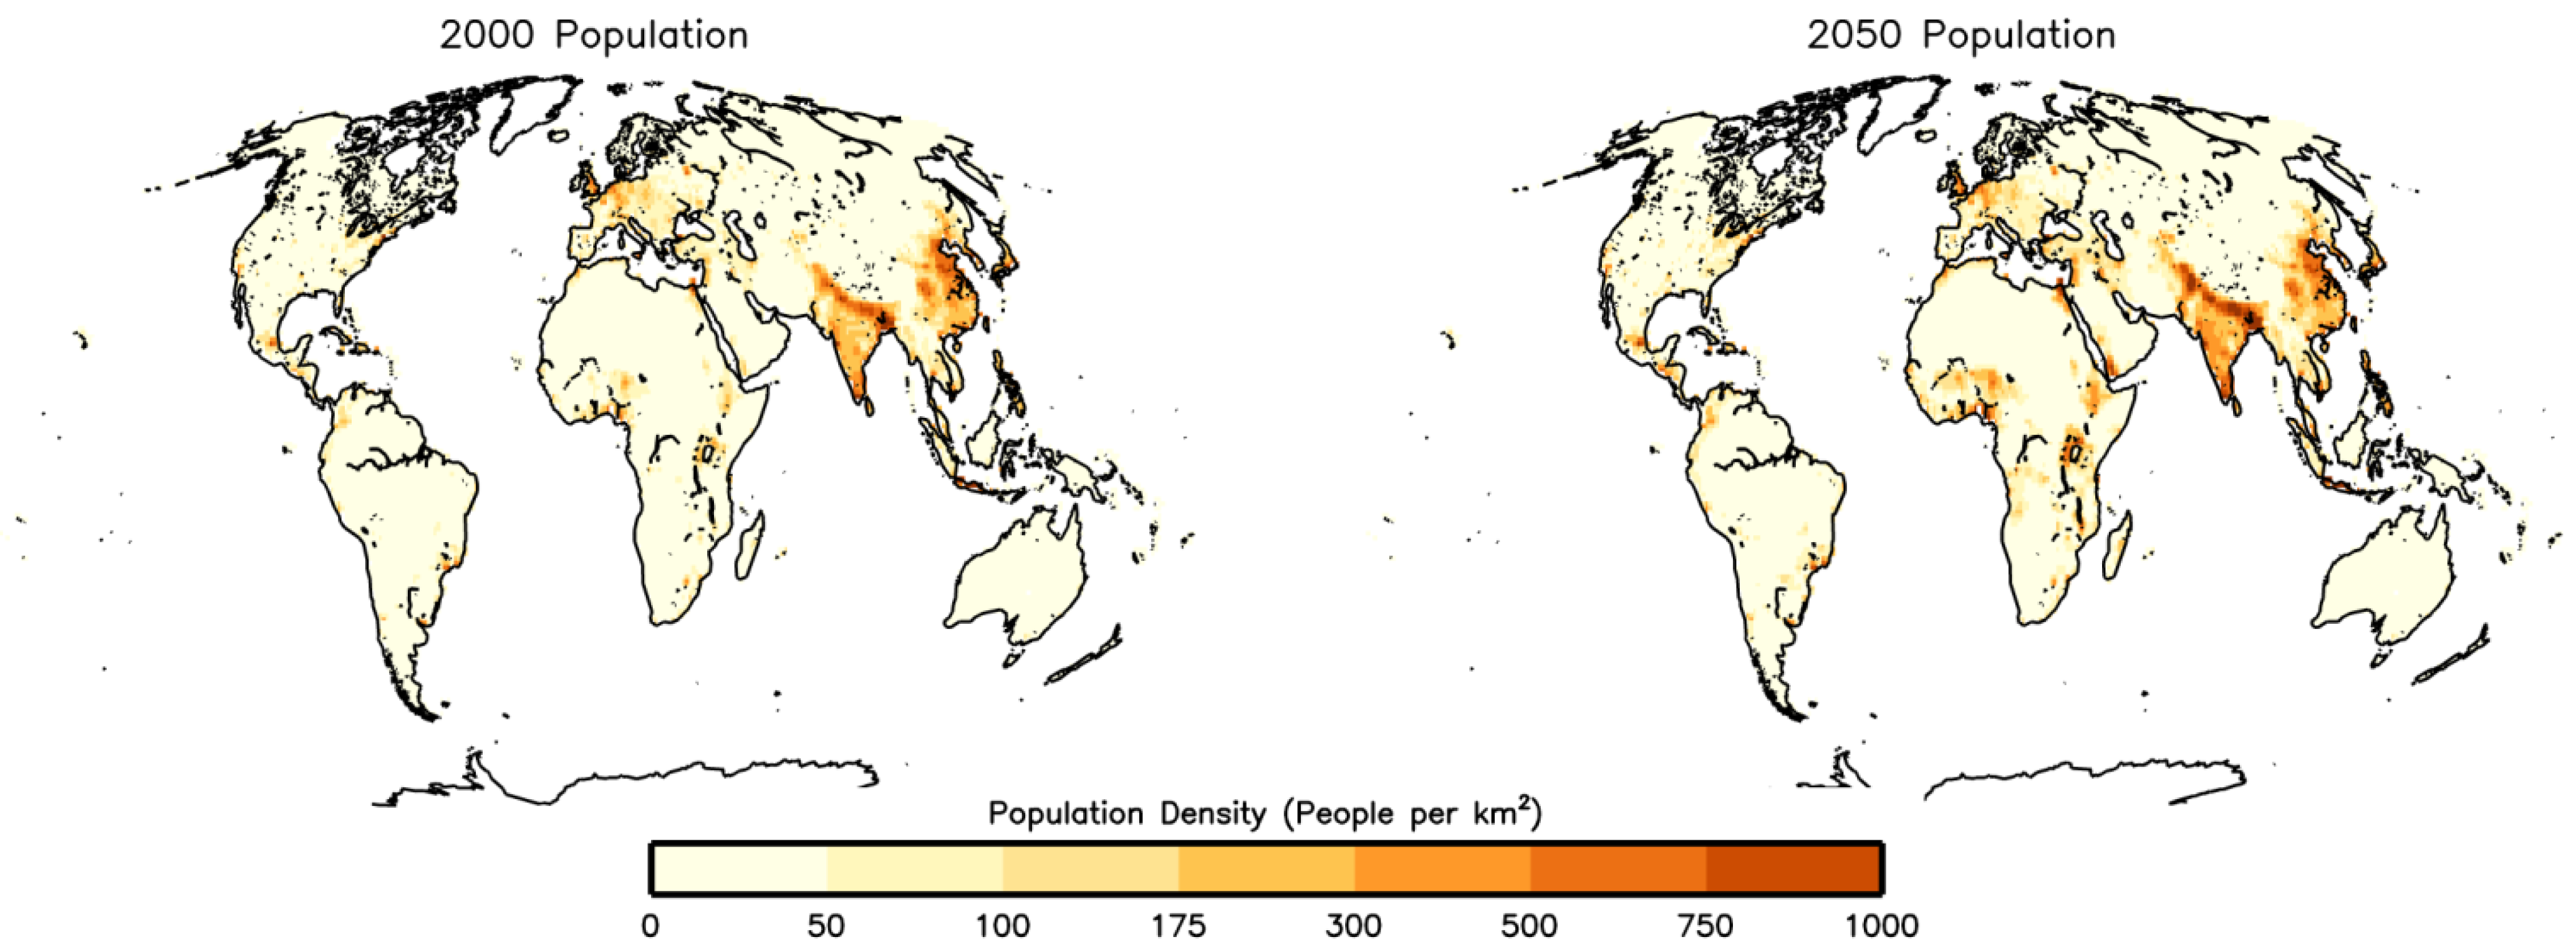
The A1B GCM simulations are used to make projections of future runoff and crop net primary productivity. This is combined with projected population data to make projections of food and water per capita as measures of stress. The population in 2050 is projected to be approximately 7.5 to 9.5 billion (10 and 90% confidence interval [15,16], with a central estimate of 8.69 billion by the 2050s. To account for regional change in population we use the downscaled population density data from van Vuuren [17] consistent with the A1B climate scenario (Table 1 and Figure 2).
Figure 1. Global mean temperature change projected under the B1, A1B and A1FI SRES scenarios (Special Report in Emissions Scenarios) [13] relative to 1971–2000. The bar plot shows the range in the 30-year climatology centred on the 2050s from the 17-member ensemble for each scenario.
Sustainability 05 02129 g001
Table 1. Projected regional population (billions) in 2000 and 2050s from van Vuuren [17].
Region20002050s
Global6.18.7
Africa0.781.9
Australia0.0190.02
Asia3.74.8
Europe0.770.85
North America0.360.49
South America0.420.64
Figure 2. The global distribution of population in 2000 and projected for 2050 [17].
Sustainability 05 02129 g002
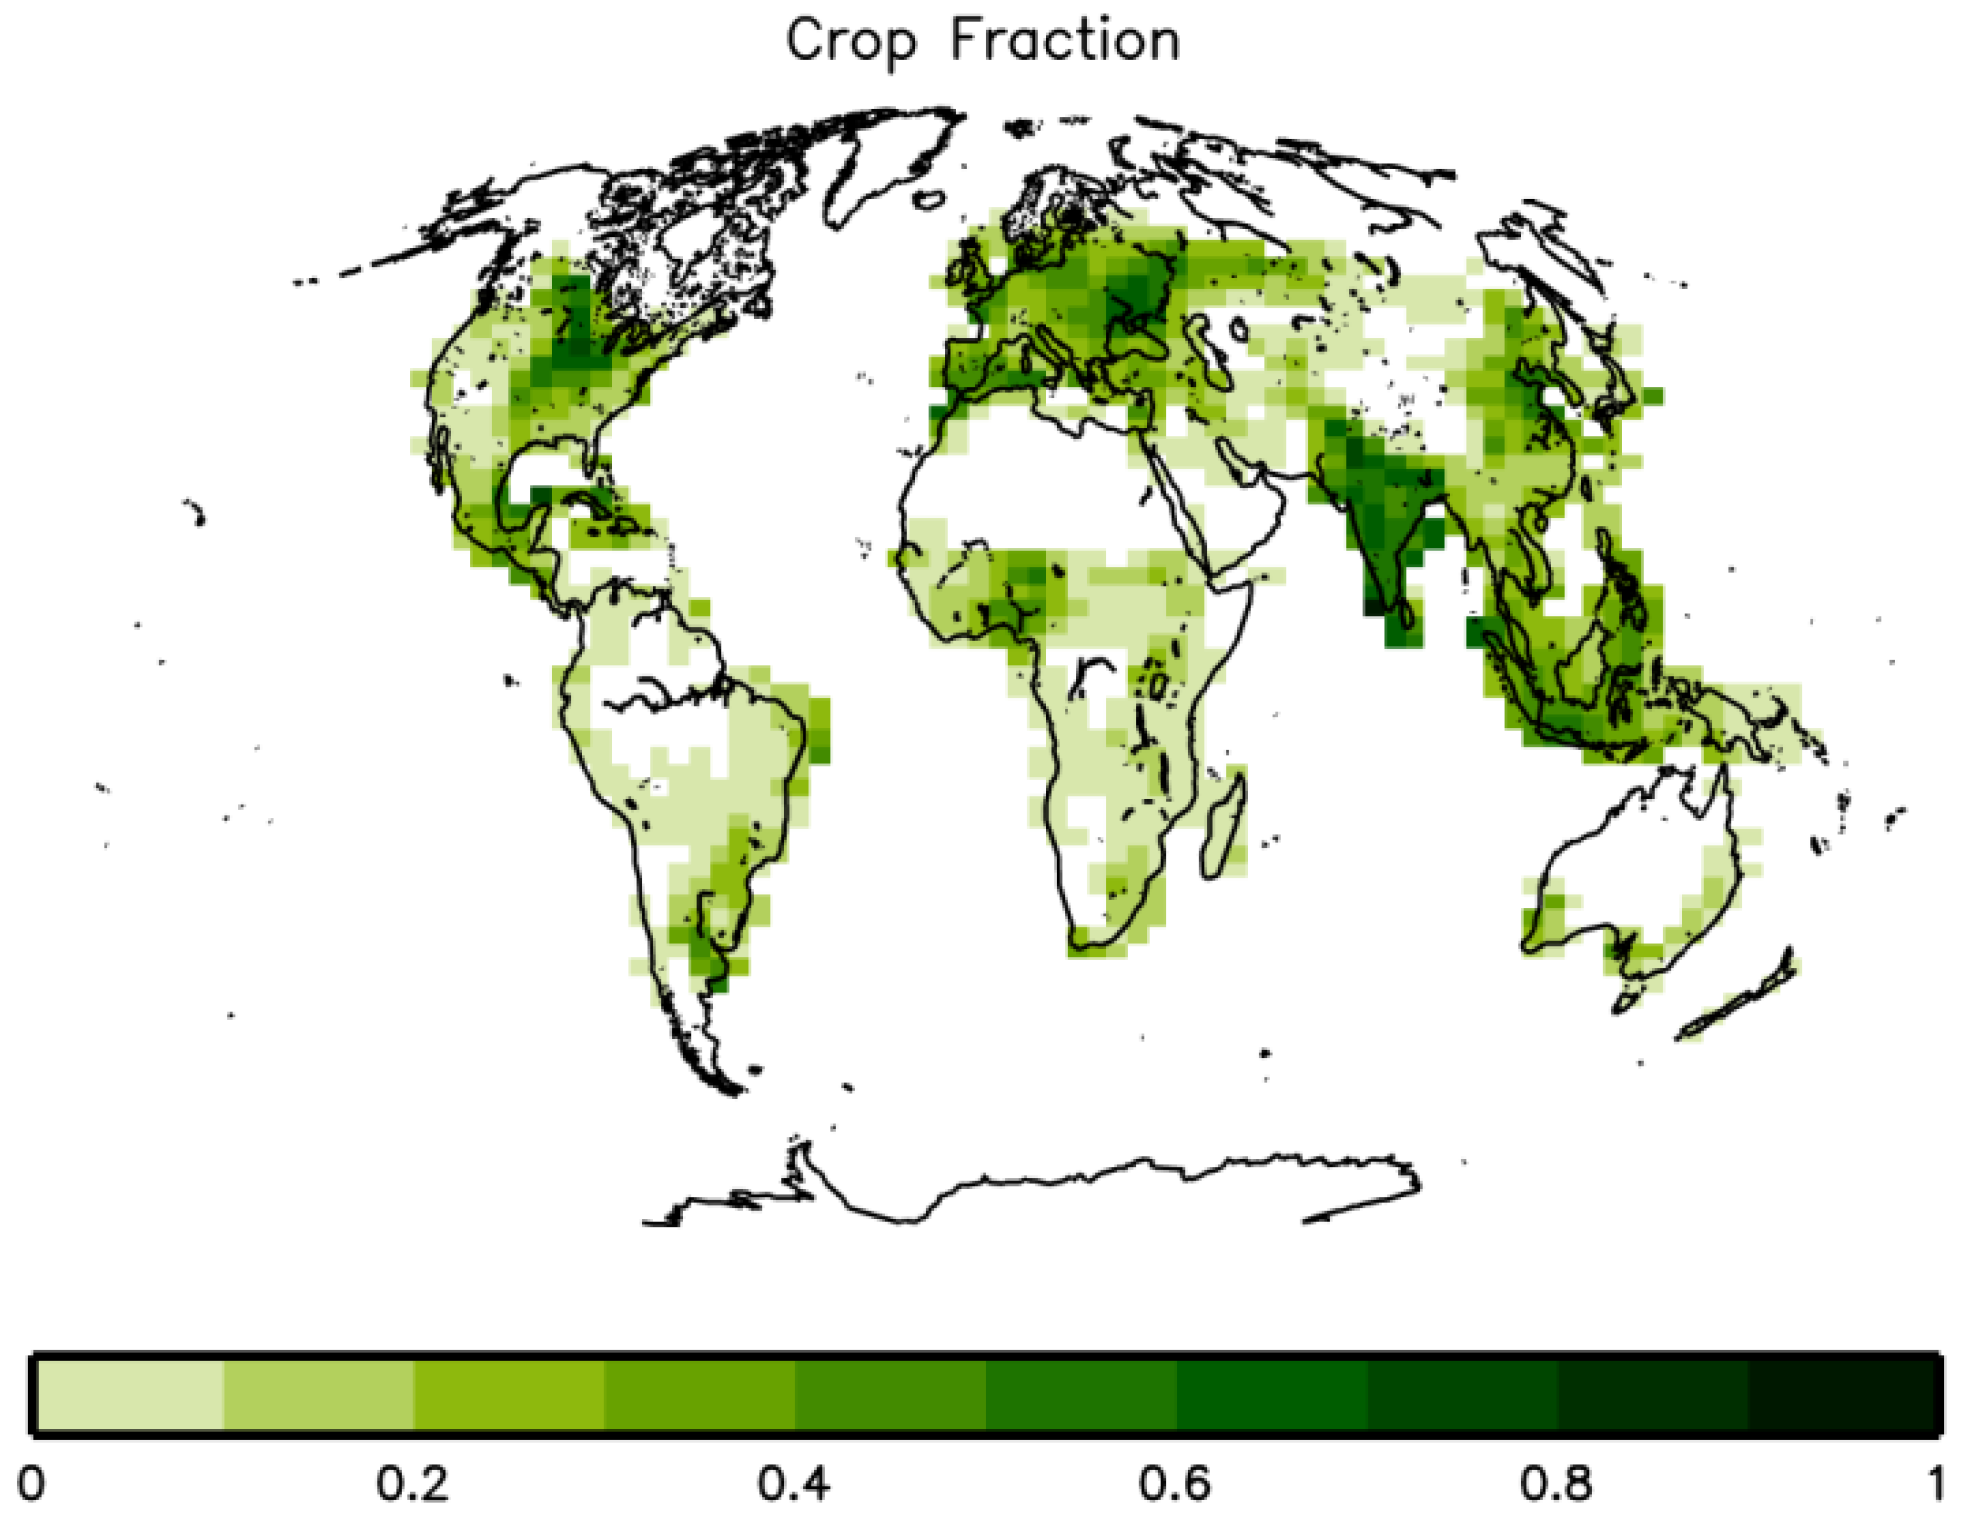
To account for the area under cultivation we use a cropped area mask (Figure 3) fixed for the year 2000 [18] and do not include any changes in land cover such as the expansion of cultivated area.
Figure 3. The global distribution of croplands in 2000 [18] re-gridded to the HadCM3 grid.
Sustainability 05 02129 g003
In this study, to elucidate the importance of population as well as climatic changes, we consider three scenarios: (1) Climate changes according to the A1B scenario, population is kept constant at year 2000; (2) population changes according to A1B scenario, climate is considered constant at 1971–2000 mean; (3) both population and climate follow the A1B scenario. In the climate change scenarios we consider both the radiative role of CO2 and its direct effects on crop productivity and runoff. Of the 17 member GCM ensemble, 9 models include the direct CO2 effect.

2.1. GCM Ensemble

Future climate projections are subject to inherent uncertainties in climate process modelling. A typical approach to sampling uncertainty is to use a multi-model ensemble of climate simulations. A complementary approach and the method used here is the perturbed physics approach, which uses a single model structure [19]. Uncertainties in climate model responses arise largely as a result of how models represent sub-grid scale processes (model parameterisation). The perturbed physics approach explores uncertainties in these sub-grid scale processes by running multiple simulations of the same model, each assigning different values to key model parameters with multiple parameters perturbed concurrently [19]. The perturbed physics ensemble provides a systematic framework in which to look at implications of parameter uncertainty for future climate projections. On the global and regional scales this ensemble explores a similar range as current multi-model (CMIP3) ensembles for temperature and precipitation [14,20,21].
Inherent regional climate biases in GCMs have to be accounted for when making projections of future impacts, particularly in the case of food and water stress in which the absolute availability is important to understanding the impact. To account for these biases we take the projected change in crop NPP and runoff from each of the simulations and add them to an observation-based present day baseline. This approach makes the assumption that the future model response is independent of the present-day bias. In some cases this may not be true where model errors are significant: for instance, the ability to capture the dynamics of the Indian Monsoon varies across the ensemble, and those members that perform less well may be less reliable in their simulation of the future change in the Monsoon.
In summary, the perturbed physics ensemble approach provides a tool that can provide information on regional projection uncertainty that goes significantly beyond a single model response. It provides a useful framework to investigate uncertainty in climate impacts. One such uncertainty is the direct vegetation fertilisation and physiological response to changing atmospheric CO2 concentration.

2.2. CO2 Fertilisation and Physiological Forcing

As well as influencing climate through radiative forcing, increasing atmospheric CO2 concentrations can also directly affect plant physiological processes of photosynthesis and transpiration [22]. Therefore any assessment of the impacts of CO2-induced climate change on crop productivity should account for the modification of the climate impact by the CO2 physiological impact. The CO2 physiological response varies between species, and in particular, two different pathways of photosynthesis (named C3 and C4) have evolved and these affect the overall response.
Elevated CO2 may also have the effect of increasing plant water use efficiency. Under higher CO2 concentrations, the degree of stomatal opening—and hence conductance—in plants can be reduced [22]. Therefore, for a given uptake of carbon, less water is transpired. The magnitude of this physiological forcing depends on the degree of stomatal control over evapotranspiration [23]. A number of field-based experiments have demonstrated the reduction of evapotranspiration in a CO2 enriched environment [24,25,26]. Reduced evapotranspiration allows a relatively higher proportion of water to form runoff, a renewable water resource. A recent modelling study [21] found that the effect of including the physiological response to carbon dioxide is to increase available water at the global scale, and by the 2080s is projected to reduce the number of people living in high water stress by around 200 million compared to the projected changes from climate alone. The CO2 physiological effect is of a similar order of magnitude to the climate effect [21].
Corresponding to the reduction in evapotranspiration is an increase in productivity. The increase in productivity due to the CO2 fertilisation effect is demonstrated across a range of experimental approaches including chamber experiments and free-air carbon dioxide enrichment (FACE) experiments [27]. Photosynthesis in these experiments has been shown to increase by 30–50% in C3 plants and 10–25% in C4 species for the doubling of atmospheric CO2 [28].
In the ensemble used here, one parameter switch controls whether or not plants see a direct physiological response to increased atmospheric CO2 concentration. This is possible due to a coupled canopy conductance photosynthesis model [29], which represents the exchange of water and carbon dioxide at the stomatal level scaled up to the whole canopy. In this version of the GCM feedbacks to vegetation structure and distribution are not included. The distribution of vegetation is therefore constant throughout the simulations. All 17 members include the radiative forcing of atmospheric CO2 on climate and 9 members (including the standard configuration) include the plant physiological forcing of CO2.
The selection of plant physiological response to CO2 was not explicitly selected for in the choice of ensemble member parameters in the 17 models used, but was a consequence of selecting ensemble members for their reproduction of present day variables and their range of climate sensitivities. We refer to the two sub-ensembles, the first of which represents CO2 radiative effects on climate and the second represents both CO2 radiative and plant physiological effects, as “RAD” and “RADPHYS” respectively. The RADPHYS configuration is the standard setup for HadCM3 in terms of the CO2 response. These ensembles both sample the case where the climate sensitivity to CO2 is low and hence the physiological effect, where it is permitted, would be expected to be relatively more pronounced than the radiative effect alone and vice versa.

2.3. Runoff and Water Resources

The approach used here follows that in Wiltshire et al. [21]. The runoff is taken directly from the GCM and used to force a 1 degree river routing model [30]. The simulated river flow is then bias corrected so the present day runoff matches a hybrid model observation global runoff data from Fekete et al. [31]. The projected river-flow is aggregated to the catchment and compared with population data to derive available water resource, which is defined as the climatological mean (2041–2070) annual catchment discharge per capita. This study uses the conventional thresholds based on Falkenmark et al. [32,33] to define differing levels of stress. Populations living with less than 1,700 m3 per capita per year are defined as water stressed, less than 1,000 as highly stressed and less than 500 as extremely stressed. The stress calculations are performed on a catchment by catchment basis as an appropriate spatial unit defining water availability.

2.4. Crop Productivity and Food Availability

In the GCM used here, crops are simulated as C3 and C4 grasses, and processes relating to crop phenology and grain production are not included. This plant functional type approach to capturing crop variety is aimed at capturing the large-scale response; however at the regional and local scales crop variety becomes more important, as do other factors such as pests, disease, soil quality and nutrient availability. In some cases, particularly regions of the world with strong land-atmosphere couplings [34], the use of generic parameterisations developed at the global scale or the lack of local processes such as irrigation [35] may lead to significant local to regional climate biases as a result of error propagation [36]. The regional climate biases in the GCM simulated climate lead to biases in the simulated present day crop Net Primary Productivity (NPP). This is adjusted for by taking the anomaly in crop NPP between the 2050s 30-year mean and 1971–2000 climatology and correcting to a new 1971–2000 baseline. As no consistent baseline observation data are available we use the JULES [37,38] land surface scheme which is similar to the scheme used in HadCM3 driven with an observation based model forcing dataset [39] to generate a new 1971–2000 crop NPP on the HadCM3 grid [39]. The area under crop production is for the year 2000 [18] and is aggregated up to a fraction of the HadCM3 grid (Figure 3). The present day fraction of C3 and C4 grasses is derived from a classification of the IGBP land-cover dataset. The area under cultivation is kept constant in the future and therefore we consider the implications of climate and population growth independent of any change in cultivated area.
Despite the simple approach to crop processes this method gives a total Human Appropriation of crop NPP (HANPP) of 10.7 Gt C per year, which is comparable to 8.18 [40] and 7.5 Gt C per year (Vitousek, [41] as reported in Haberl [40]) of human harvest. Imhoff et al. [42] reported a slightly higher range of 8 to 14.81 Gt C per year including wood harvest. Uncertainty within these numbers arises partly due to the assumed areas of crop coverage used in the calculation and the exact definition of HANPP used.
Taking global annual production as approximately 65 Gt C [40] per year, [40] reveals that cropland production accounts for around 16% of global production. Including other forms of HANPP, Haberl et al. [40] estimated the fraction to rise to 28% of potential production. This demonstrates the sheer magnitude of the current impact of the global population on terrestrial ecosystems and the potential difficulties of adapting agricultural production to growing population and a changing climate.
The measure of food used here is the regional cropland production per capita. This approach is limited as it only includes demand for food as a simple measure of population and food availability and therefore ignores the many socio-economic factors affecting food security. This is further complicated as crop production is not necessarily linearly related to crop yield or the nutritional value of the food produced. Furthermore, the use of two plant functional types to capture the full range in crop variety is also a limitation. However, the utility in the approach used here is that it allows a controlled assessment of the effects of three important drivers of change.

3. Results

In this study for the year 2000 we find the global cropland photosynthetic production of 10.7 Gt C (Table 2) combined with a global population of 6.09 billion (Table 1) gives a global per capita potential of 1,772 kg C. The regional per capita potential varies between 1,290 in Asia to 4,313 kg C in South America (Table 2). This spatial variation reflects the regional production and the population size, and indicates a role for the global trade in food. Asia has by far the greatest cropland production but has the smallest per capita production due to its 4.78 billion population. Europe on the other hand is one of the least productive regions at 1,410 kg C per capita but as one of the highest per capita consumers of food [43] is therefore likely to be a large importer of produce from other regions. Africa, despite having larger per capita production than the global mean, is still a net importer of food [44]. This discrepancy is revealing of the complexities of food security that go beyond potential production into socio-economics.
Table 2. Present day crop net primary production per capita.
RegionCrop total NPP (Gt C)Crop NPP (kg C per capita)
Global10.71,772
Africa1.792,290
Australia0.0562,942
Asia4.831,290
Europe1.091,410
North America1.183,323
South America1.84,313
In this study we find 3.1 and 2.6 billion people in the year 2000 living in moderate and high water stress, respectively (Table 3). This number is comparable to a range of 2.3 to 3.1, and 1.4 to 2.3 billion for moderate and high water stress as found in other studies [21,45,46,47,48]. The vast majority of the global water stressed population is found in Asia, where nearly 2 billion people are currently estimated to be experiencing high water stress. Europe has around 66% of its population living with some level of stress according to this definition. However, these figures do not include virtual water—the trade of water through products including food—which may allow offsetting of this stress in some water-scarce regions [45,49].
Table 3. Present day water stressed population.
RegionWater StressedHigh Water StressExtreme Water Stress
Global3.132.671.56
Africa0.290.190.12
Australia0.0130.00660.0063
Asia2.091.971.11
Europe0.490.290.19
North America0.0670.060.035
South America0.150.120.071

3.1. Climate Effect on Crop Productivity and Runoff
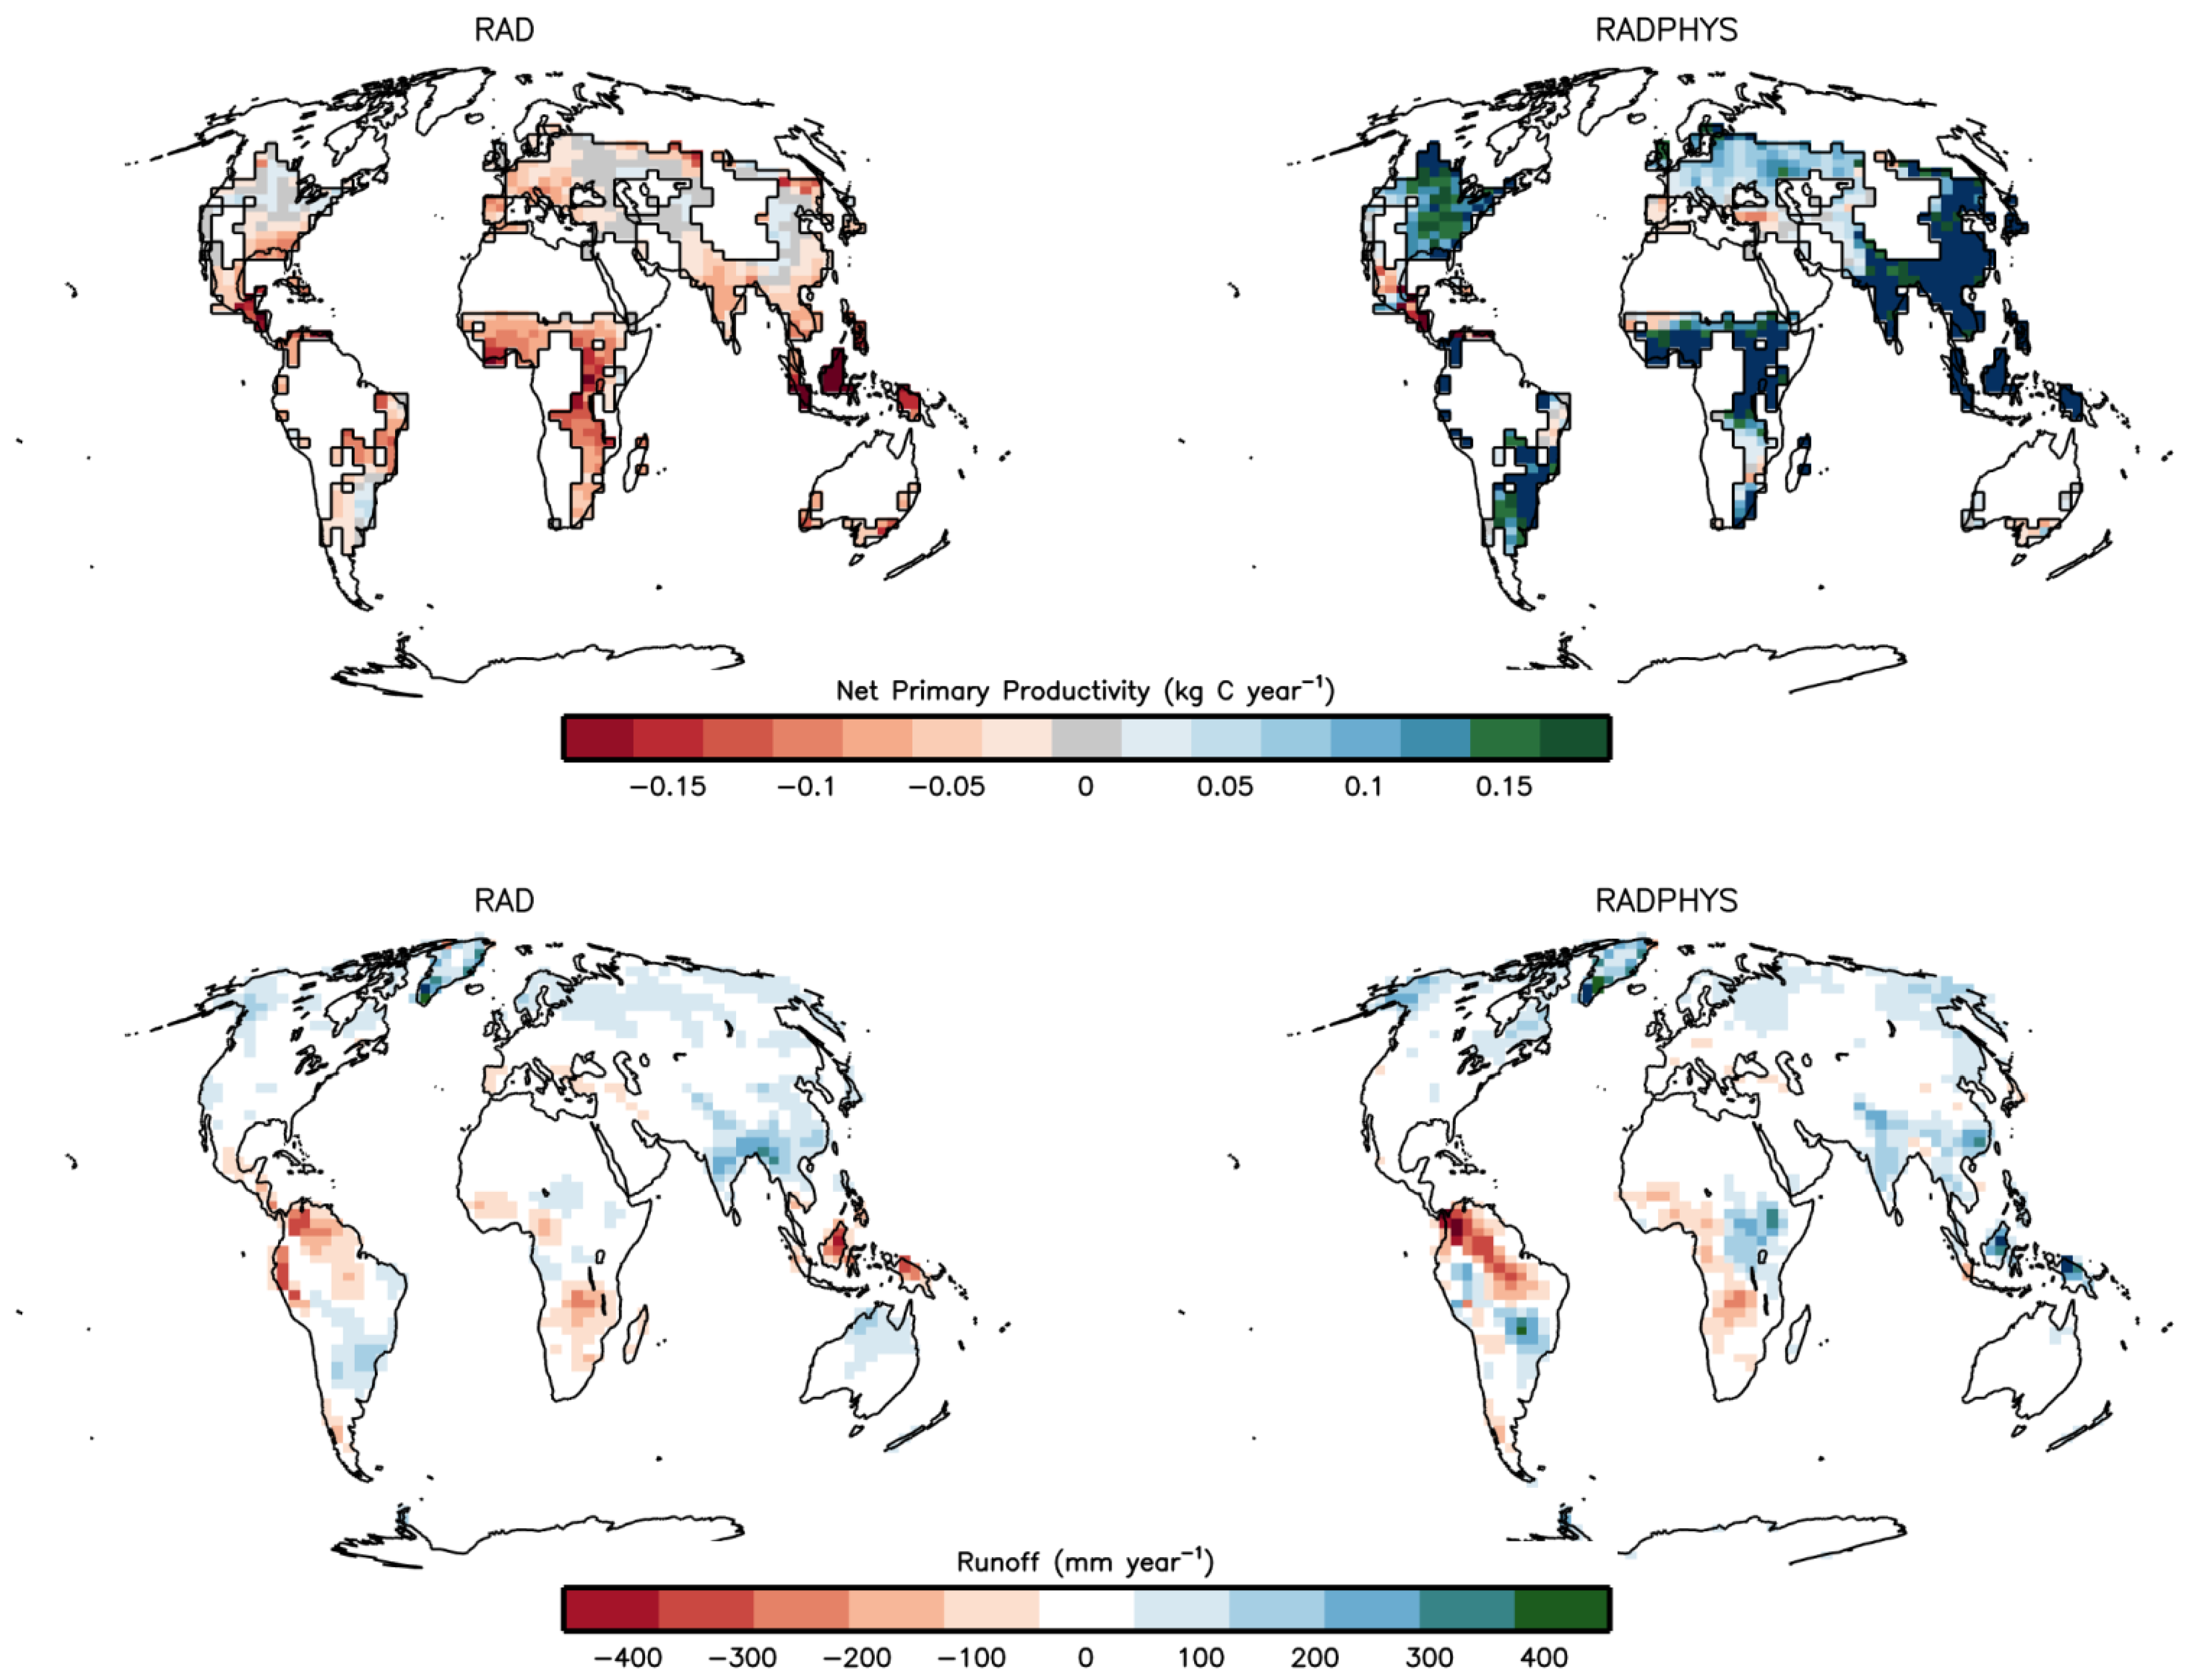
Under climate change alone (Figure 4, RAD ensemble, top left), there are reductions in crop NPP throughout much of the global croplands, with some of the stronger declines seen in the tropical regions. This corresponds to a reduction in crop production of around 0.67 Gt C per year (Table 4) or approximately 6% of current production. However, this result is not just reduced but reversed by CO2 fertilisation (Figure 4, RADPHYS ensemble, top right). Most regions display strong increases in crop production by the 2050s in RADPHYS, corresponding to a median increase of 2.1 Gt C per year. The increase in production in RADPHYS is global with strong increases particularly in South and East Asia, and tropical cropland areas of Africa. There is considerable uncertainty in the RADPHYS ensemble ranging from an increase of 1.8 to 2.7 Gt C per year.
The effect of climate change on runoff is variable across the globe, reflecting changing atmospheric circulation patterns, precipitation and evapotranspiration. Across large areas, projections are for little change or for increasing runoff by the 2050s (Figure 4, bottom panel) in the median global ensemble member. However, in tropical central and South America as well as western and southern Africa and parts of Southeast Asia, there are large decreases in runoff projected. The dual effects of CO2 (RADPHYS) as opposed to climate change alone (RAD) on runoff gives more mixed results than for crop NPP. However, in all regions we find increased runoff in RADPHYS with two exceptions: Australia has a smaller increase in RADPHYS relative to RAD but is still positive; South America has an overall decrease in runoff but this is smaller in RADPHYS than RAD.
In Africa the decrease in runoff is not only reduced but reversed. In South America we find an overall decrease in runoff of −413 m3 s−1 in RADPHYS but a larger decrease of −13,781 m3 s−1 in the RAD ensemble. Globally, the RADPHYS median increase in runoff (108,225 m3 s−1) is half as great again as in the RAD case (68,097 m3 s−1).
Figure 4. The change in crop net primary productivity (masked for present day cropped areas) and runoff for the RAD and RADPHYS sub-ensembles. The data plotted is the median member of each sub-ensemble derived from the area-averaged global mean change. The data are 30-year mean climatologies centered on the 2050s relative to 1971–2000.
Sustainability 05 02129 g004
Table 4. Median projected changes in crop net primary production and runoff by the 2050s.
RegionCropland Production Change (Gt C per year)Runoff Change (m3 s−1)
RADRADPHYSRADRADPHYS
Global−0.672.1468,097108,225
Africa−0.140.39−9,7765,900
Australia−0.0160.0032,670619
Asia−0.251.0940,30955,839
Europe−0.0530.141,6182,950
North America−0.0260.2934,21443,482
South America−0.10.16−13,781−413
In some ensemble members, we find stronger decreases in runoff in RADPHYS at the sub-continental scale where the direct physiological effect on plant stomata is offset by corresponding changes in circulation patterns which lead to reduced precipitation. However, in most cases and in all cases at the continental scale we find that water availability in RADPHYS is higher than in RAD.

3.2. Future Impacts on Food and Water Availability

3.2.1. Climate Change

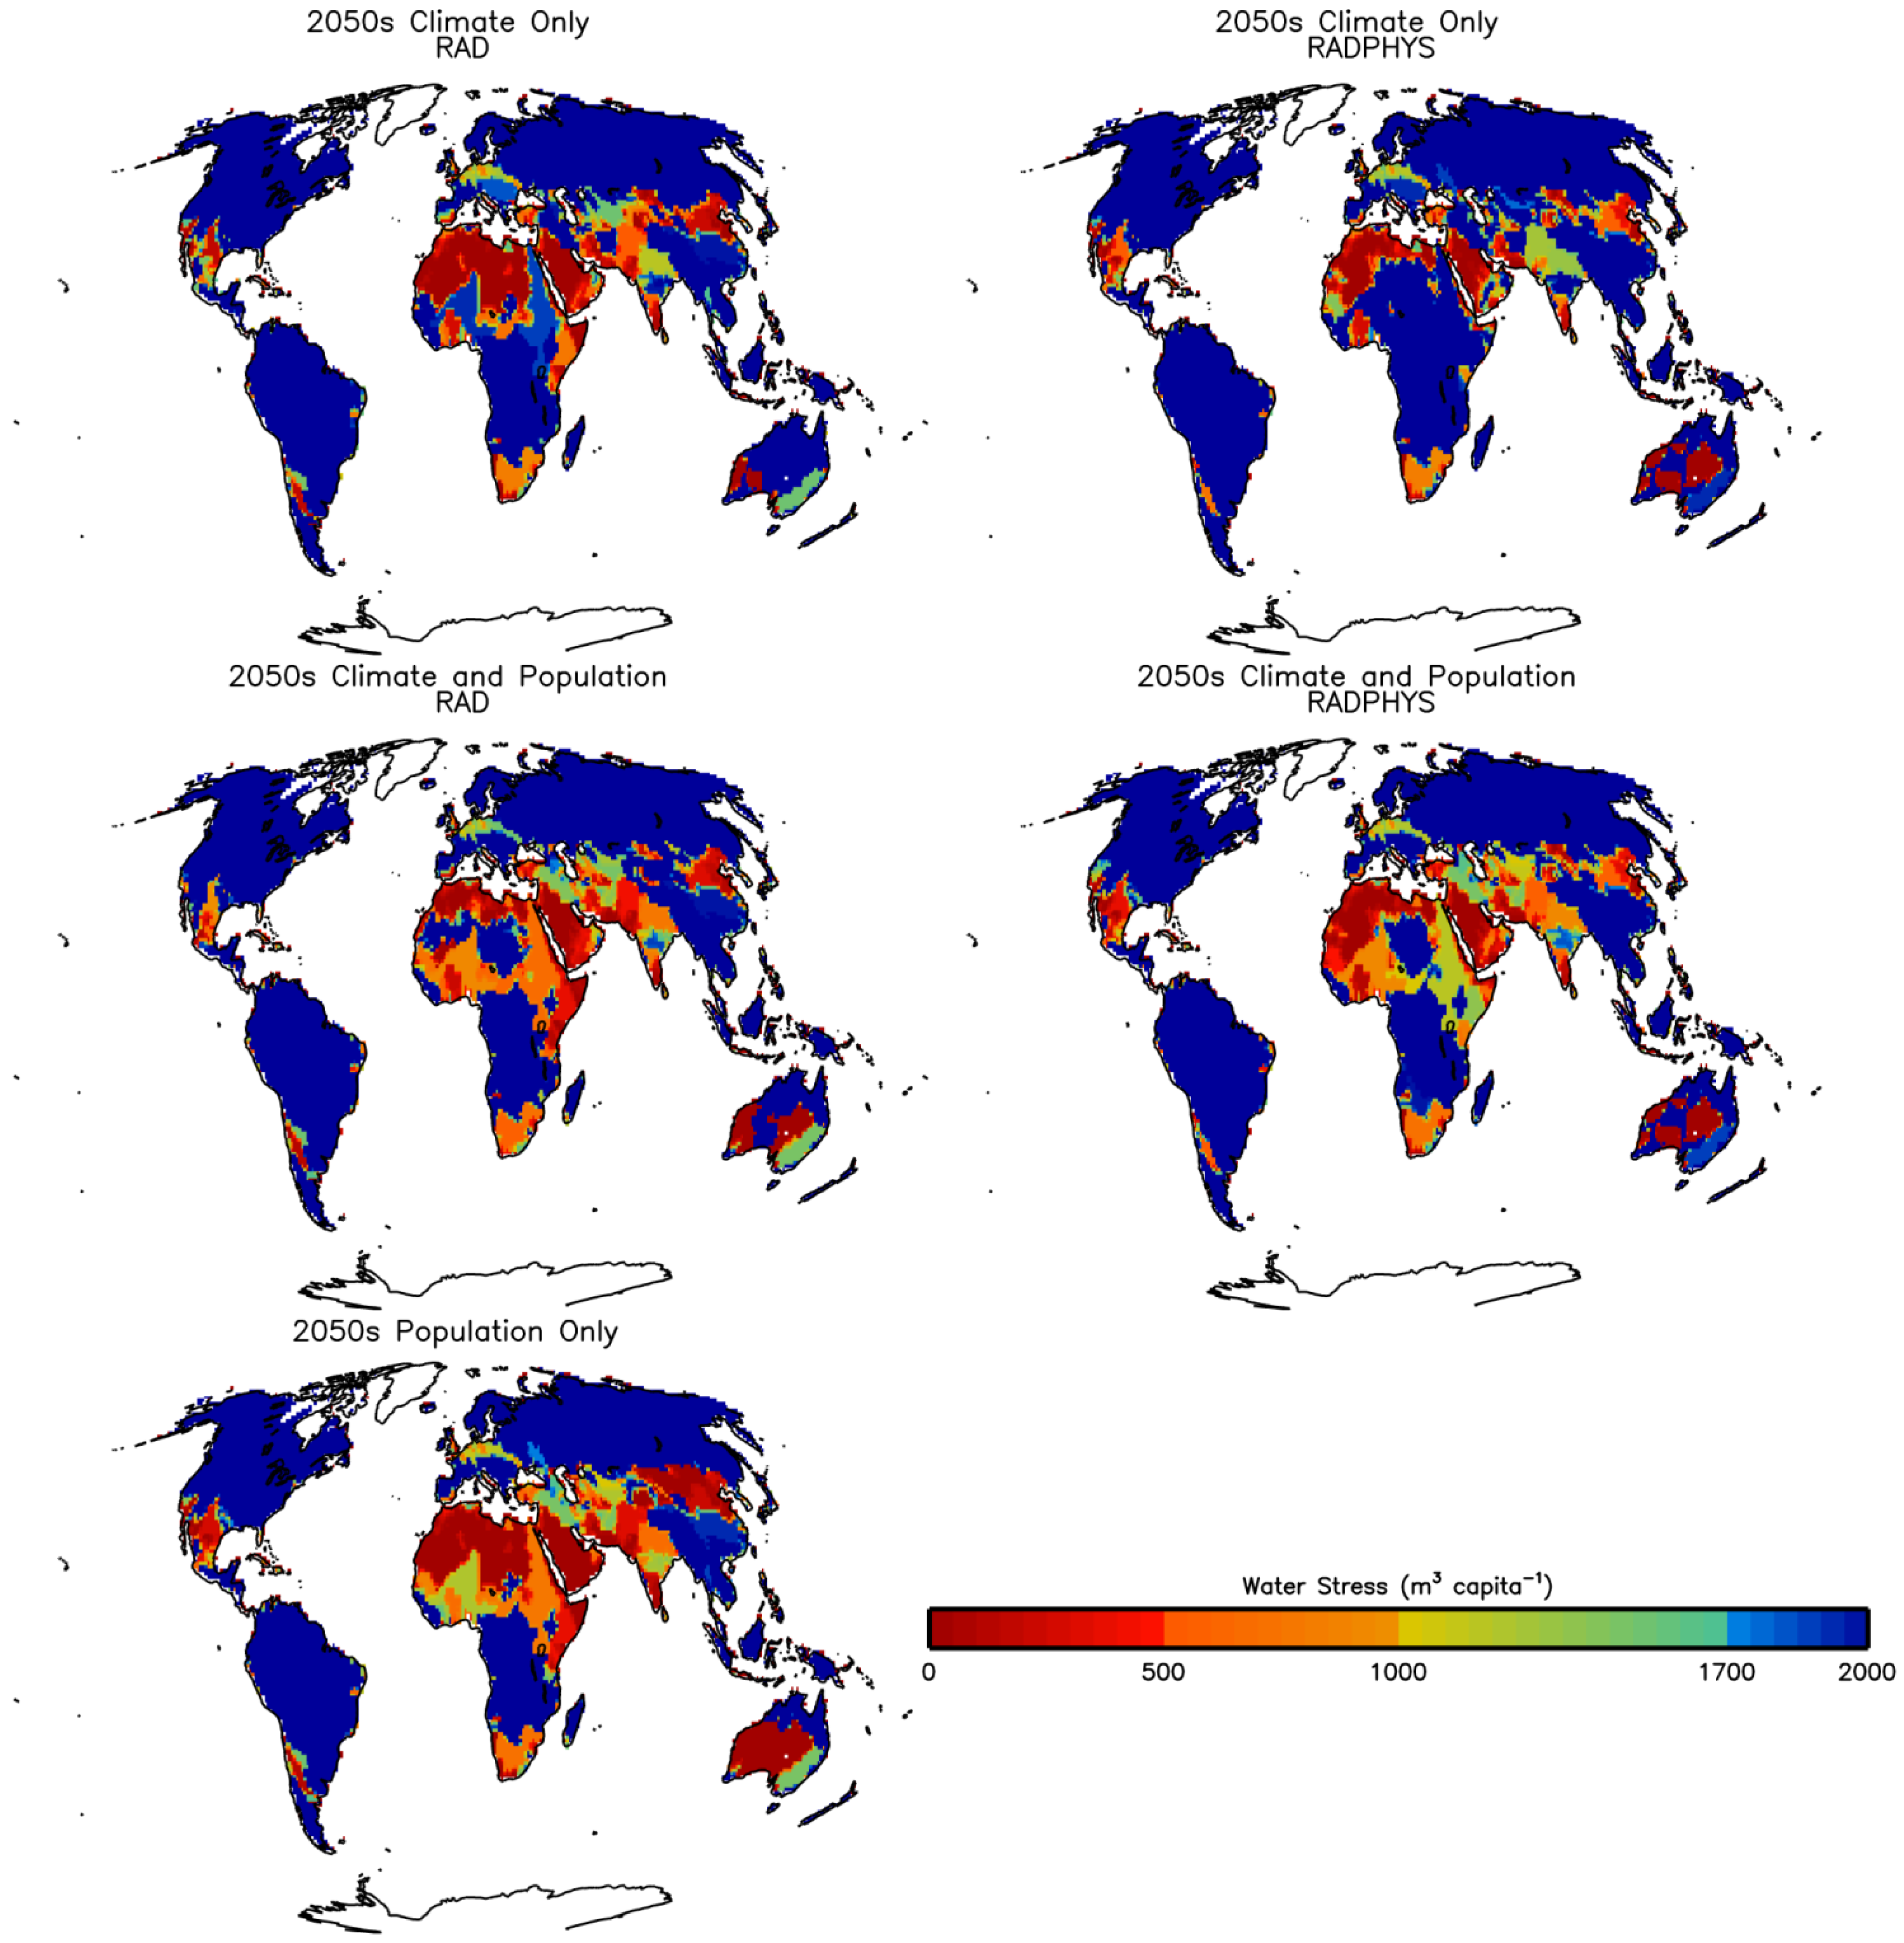
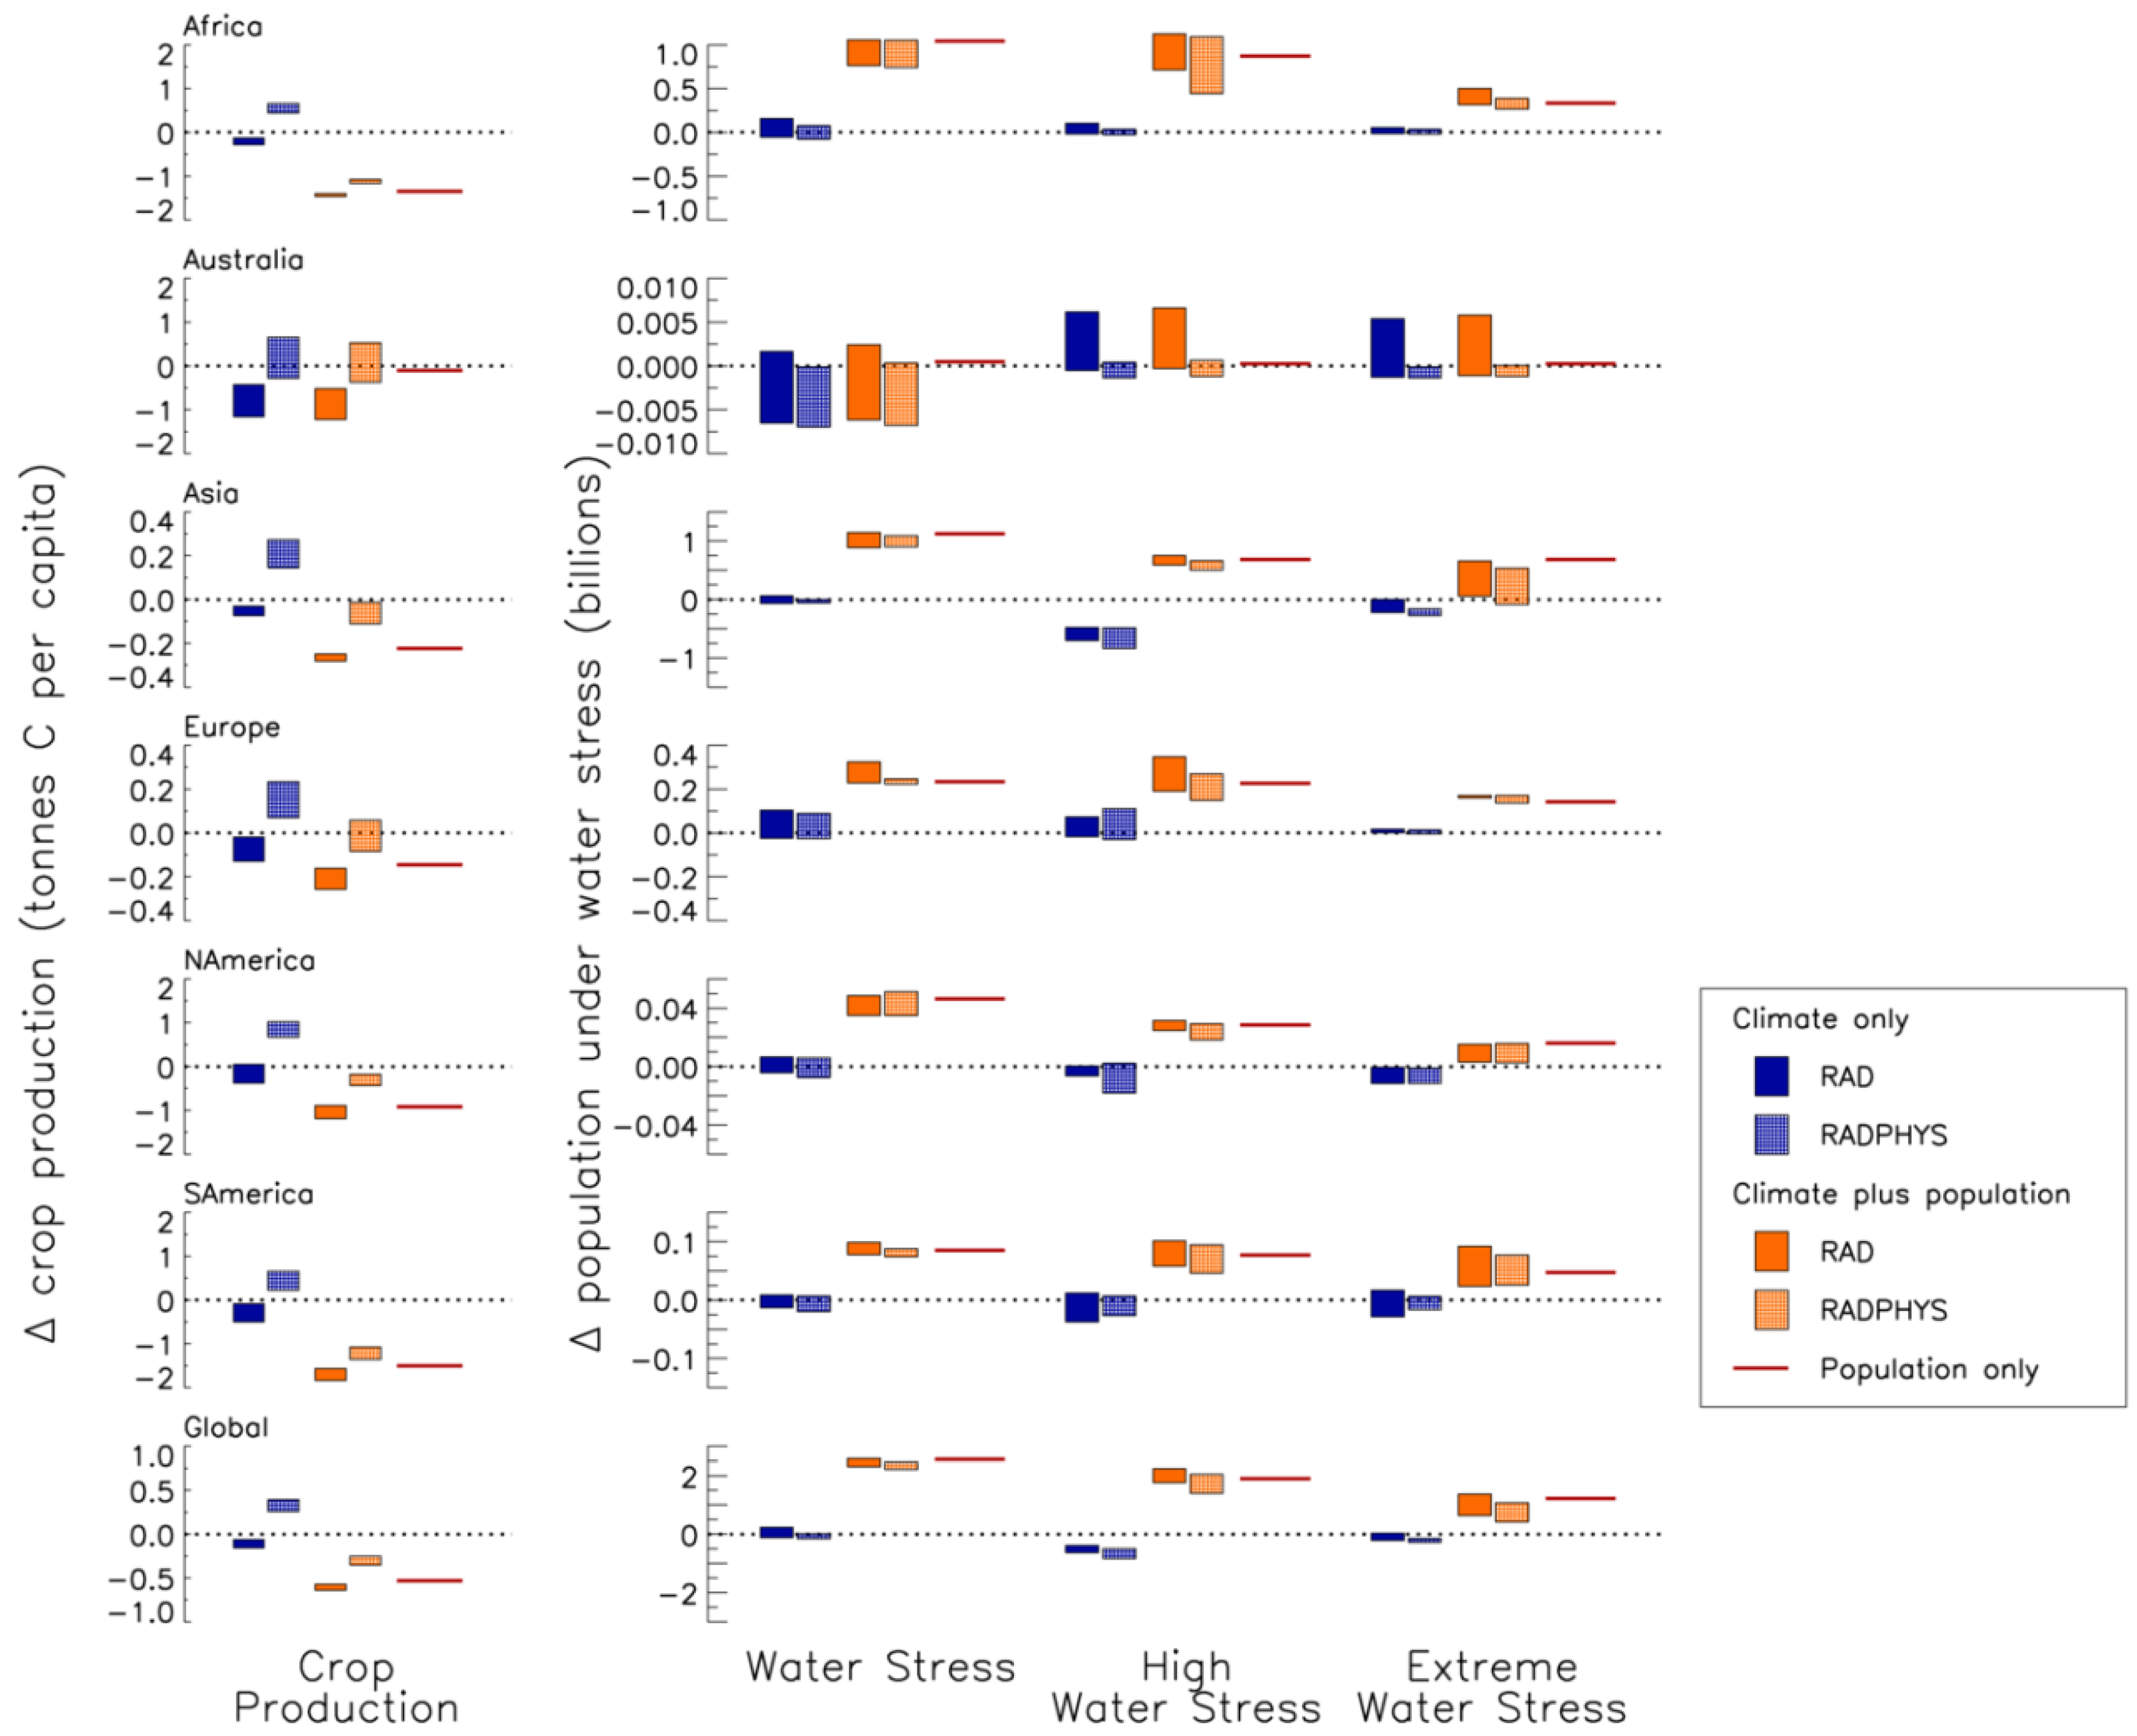
Some of the regions where the largest magnitude changes in runoff are projected are in the wet tropics, which already have high runoff. Added to this, regions where population density is low (Figure 2) the per capita water resource allocation is higher. Therefore, even a large decrease in runoff does not necessarily limit the water resource of the people within that region. Hence areas such as northern South America that have plentiful water and low populations are projected to remain free from water stress in the future—at least at the scale of the 30-year mean—even though decreases in runoff are projected under climate change. Conversely, smaller magnitude changes can have large impacts in regions that currently have lower levels of runoff, particularly where population density is high. Thus, a different picture of water stress (Figure 5) and changes in water stress (Figure 6) can emerge from the projections of runoff (Figure 4). There are differences in projections of water stress that include the dual effects of CO2 compared with climate change alone (Figure 5, top right and top left, respectively) that may be explained by the increased water use efficiency of plants under higher levels of CO2 and hence upon runoff and water stress. We find in the RAD ensemble the global stressed population increases (by 119 million), but those experiencing high or extreme stress decreases (by 107 million). In the RADPHYS case stress is projected to decrease in all instances for the ensemble median (Table 5). The complexity and uncertainty in these results is apparent at the regional scale (Figure 6). The blue bars of the “climate only” simulations show that there is considerable uncertainty in the impacts of climate change on the population under different levels of water stress. Africa is projected to experience increases in water stress at all levels, although the direct effects of CO2 (hatched bars) mitigate this to some degree, while in Asia, there are large decreases in high and extreme water stress, and the direct effects of CO2 enhance these potential benefits. The variation in response of different regions to climate change is reflected in the global averages, although the general reductions in high and extreme water stress, as well as the beneficial effects of improved water use efficiency are dominated by the signal in Asia.
The trends in food availability are much more consistent across all regions (Figure 6). There are uniform decreases in crop production (RAD), but this trend is reversed by the additions of direct CO2 effects on plant physiology (RADPHYS), which leads to a generally strong positive impact on food resources. The median result is for a projected decrease of 6% in food per capita in RAD by the 2050s and an increase of 19% in RADPHYS.

3.2.2. Population Change

Regional population is projected to increase in every region of the world (Table 1), with the greatest increases occurring in Africa and Asia making those regions particularly vulnerable to climate change. Globally we expect population growth to significantly decrease the per capita cropland production by around 30% (Table 5) in the absence of changes to cultivated area or adaptation or climate change. Africa is particular severely hit with a greater than 50% decline in crop production per capita. There are similar implications for water security, with a projected global increase of 2.5 billion people (Table 6) experiencing some level of stress in the future. The proportion of the global population experiencing extreme stress increases from 18% to 32% by the 2050s, an overall increase of 1.2 billion people.
Figure 5. Projected water stress in the 2050s for the RAD and RADPHYS sub-ensembles. The data plotted show the effect of climate change only (2050s climate and year 2000 population distribution), climate change and population (2050s climate and 2050s population distribution), and population change only (1971–2000 climate and 2050s population).
Sustainability 05 02129 g005
Figure 6. Projections of change in food and water availability per region driven by climate change (blue bars), population change (red line), and a combination of the two (orange bars). The climate component is divided into the two sub-ensembles RAD (solid) and RADPHYS (hatched) ensembles to show the effects of CO2. The range of the bars represents the extremes of the two sub-ensembles.
Sustainability 05 02129 g006
Table 5. Median projected changes in food availability by 2050 in the RAD and RADPHYS ensembles with and without population change (Gt C per capita).
RegionClimate onlyClimate plus populationPopulation only
RADRADPHYSRADRADPHYS
Global−0.110.35−0.61−0.28−0.53
Africa−0.190.50−1.42−1.14−1.35
Australia−0.860.15−0.930.050−0.10
Asia−0.0680.29−0.33−0.053−0.28
Europe−0.0680.18−0.24−0.021−0.18
North America−0.0740.81−0.98−0.33−0.92
South America−0.250.40−1.67−1.25−1.51
For both food and water population growth is the dominant driver of decreased resources relative to climate change. This is shown in Figure 6 (red lines) which demonstrates that population change is in most cases larger than any of the ensemble members of the climate simulations. The exception to this is Australia, which has low projected population growth but vulnerability to climate.
Table 6. Median projected changes in water stressed population by 2050 in the RAD and RADPHYS ensembles with and without population change (Billions).
RegionWater stress levelClimate onlyClimate plus populationPopulation only
RADRADPHYSRADRADPHYS
GlobalWater Stressed0.12−0.0732.412.322.54
High Water Stress−0.48−0.691.951.551.90
Extreme Water Stress−0.11−0.241.161.031.23
AfricaWater Stressed0.053−0.0431.041.001.04
High Water Stress0.011−0.0071.020.630.87
Extreme Water Stress0.0079−0.00170.370.290.34
AustraliaWater Stressed−0.0003−0.00620.0002−0.00570.0005
High Water Stress0.0005−0.00040.0008−0.00020.0002
Extreme Water Stress−0.0003−0.00050.0000−0.00030.0002
AsiaWater Stressed−0.014−0.0391.081.021.13
High Water Stress−0.49−0.700.660.640.68
Extreme Water Stress−0.09−0.220.550.500.68
EuropeWater Stressed0.004−0.0180.240.230.23
High Water Stress0.018−0.00420.240.200.23
Extreme Water Stress0.0140.00620.170.150.14
North AmericaWater Stressed−0.0010−0.00080.0400.0360.046
High Water Stress−0.0005−0.00340.0280.0270.029
Extreme Water Stress−0.0036−0.00900.0130.00810.016
South AmericaWater Stressed0.0054−0.00100.0870.0840.085
High Water Stress−0.00020.00100.0880.0780.077
Extreme Water Stress0.0026−0.00420.0650.0580.047

3.2.3. Climate, CO2 and Population Change

The strong effects of population growth on per capita production and water resources dominate the combined impacts (Figure 6, orange bars). With the possible exception of Australia, in all cases the population drives the combined impacts to a more resource-poor state for both food and water. The complex effect of climate and CO2 can act to exacerbate or reduce the impacts of climate change. Globally, in the RAD ensemble we find food resource decreases, but increases in the RADPHYS ensemble relative to population only. This result holds for all regions except Australia.
Non CO2 driven climate change (RAD) is beneficial to water resources as water stress decreases relative to population change only, with the greatest decrease when CO2 is included (RADPHYS). Even in the instances where climate change or CO2 are projected to bring benefits, the effect of population reverses those potential gains.

3.3. CO2 Implications for Food and Water Resources
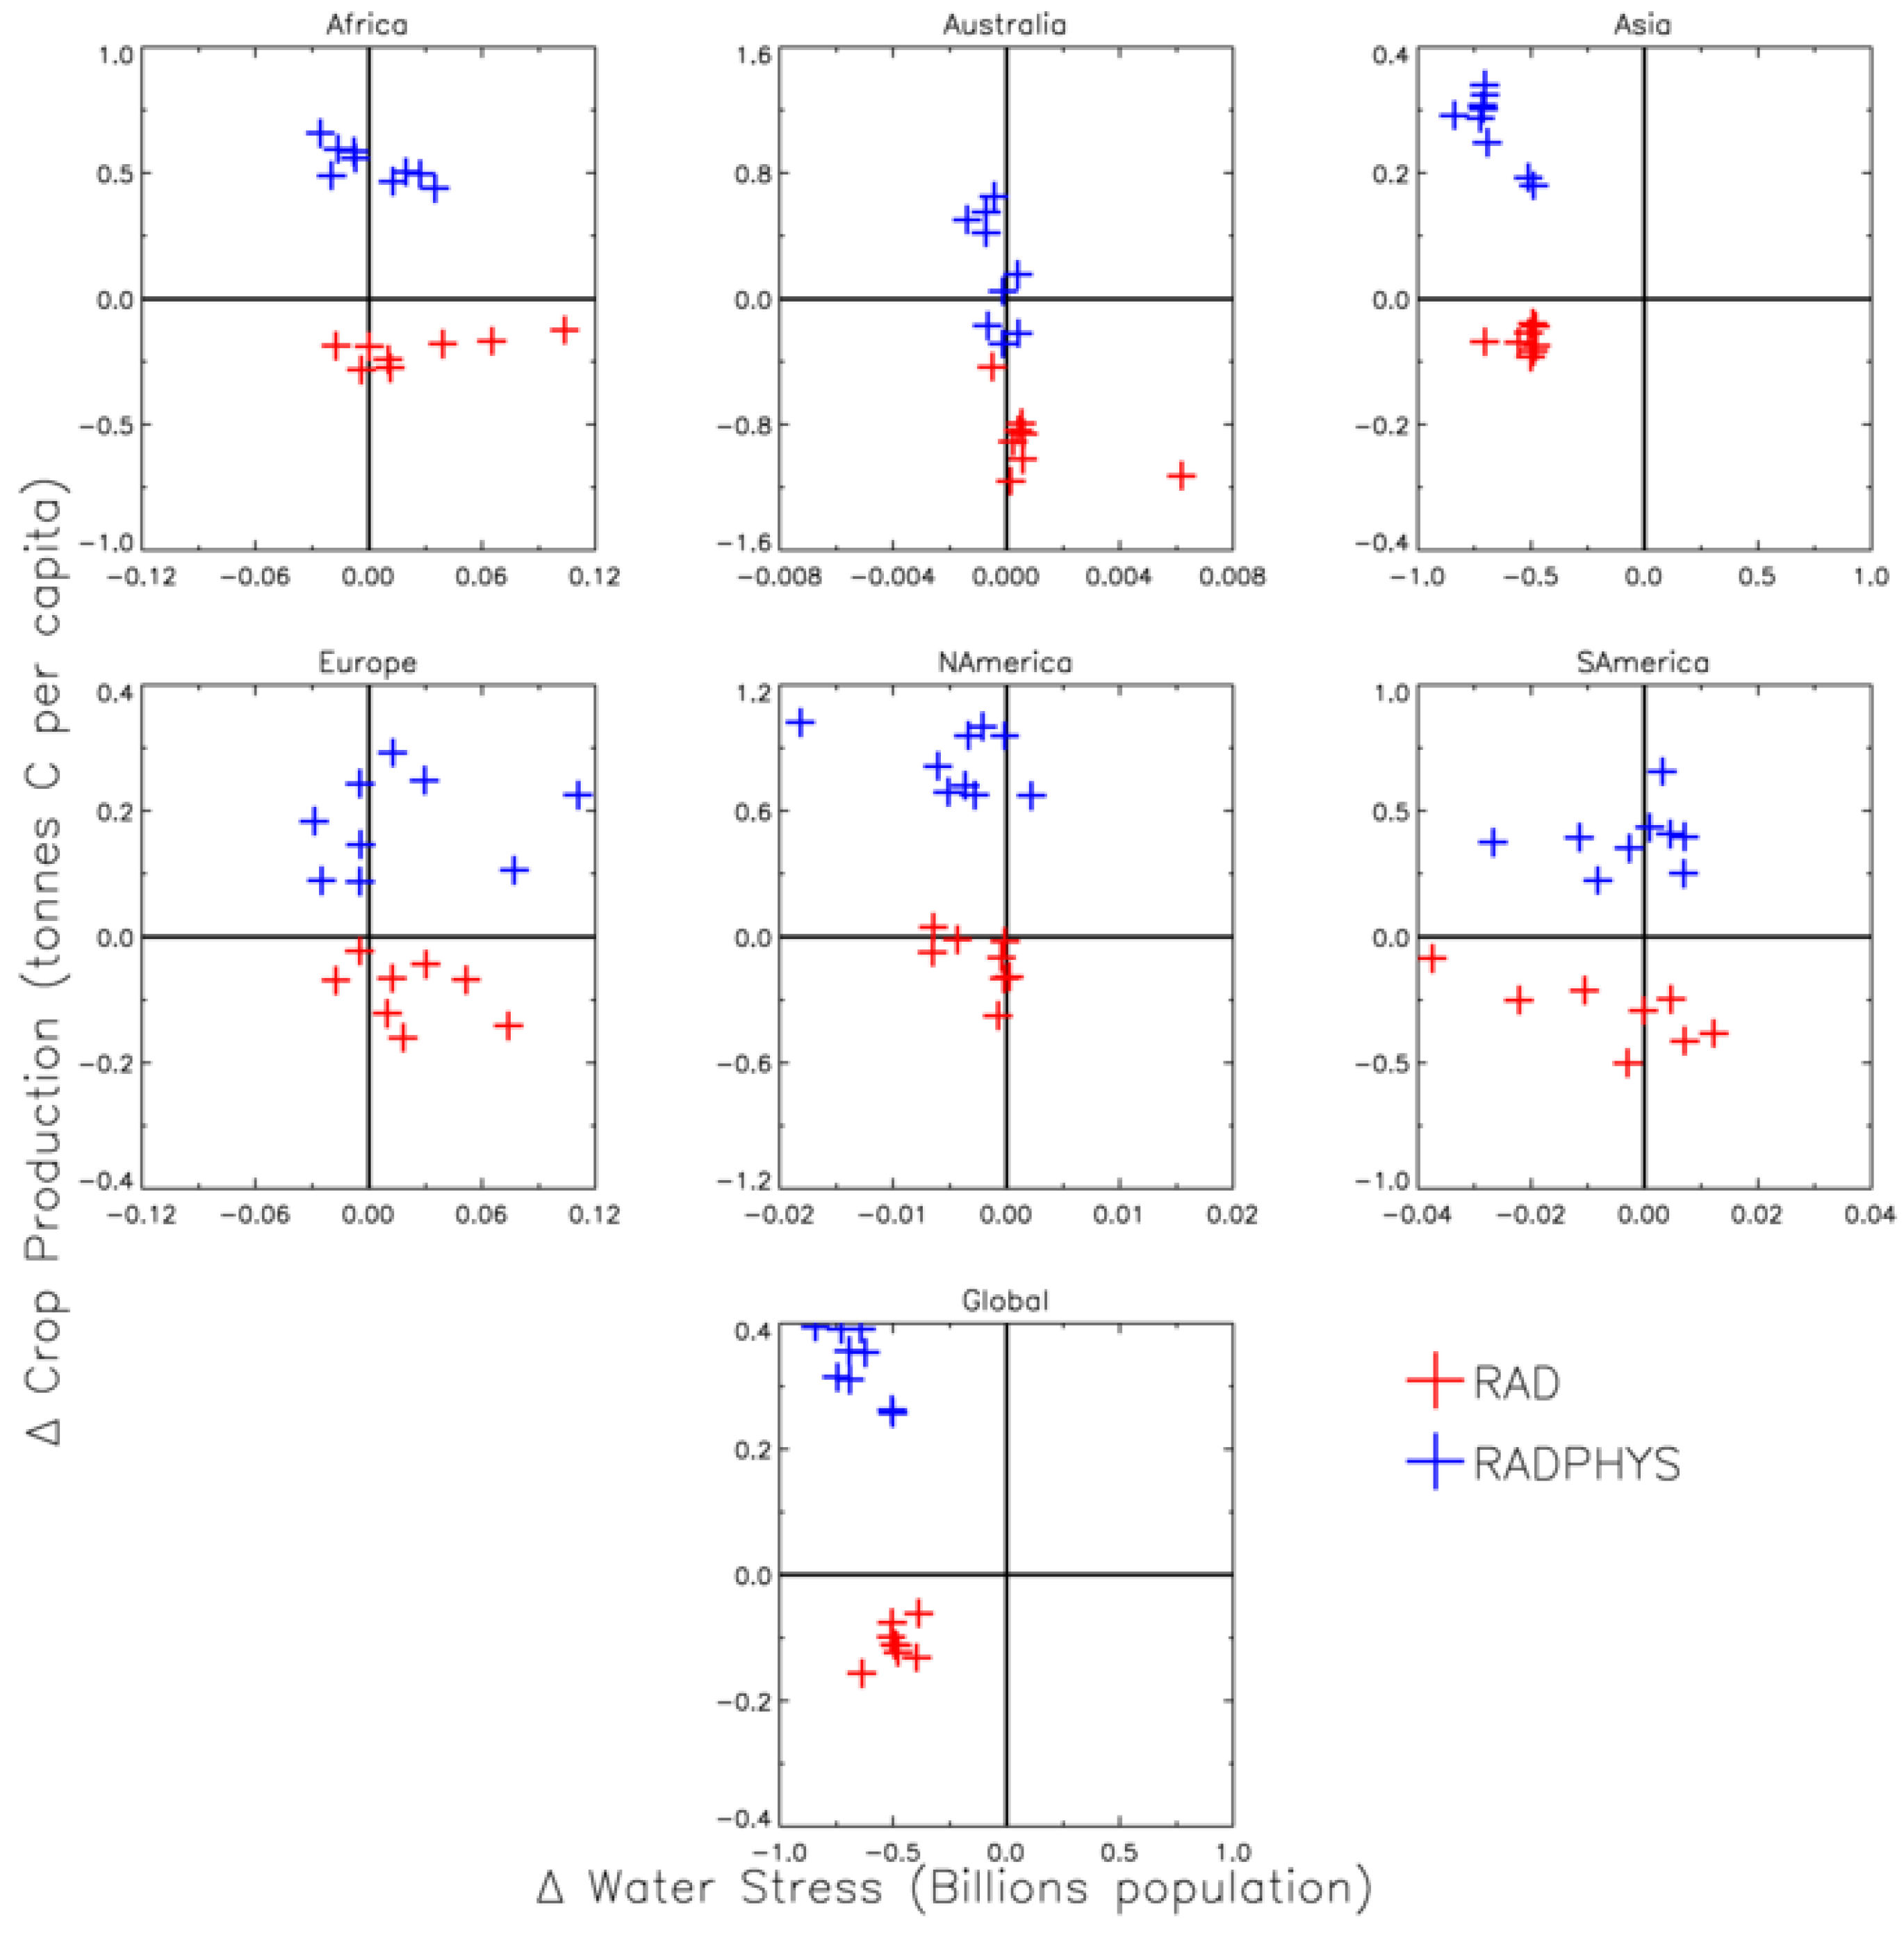
The results presented here show a strong sensitivity to CO2 fertilisation. Climate and CO2 exert a strong positive effect on crop production and a less certain, but on average positive, effect on water stress. Figure 7 shows the regional impact of climate change on the population (fixed at year 2000 levels) living in high water stress against our measure of food resource. The lower right quadrant is the “worst case” space—describing an increase in high water stress and a decrease in available NPP—and “best case” is the upper left quadrant. Projections by each member of the ensemble are displayed, giving the spread of the ensemble rather than just the mean. The two sub-ensembles generally form two distinct groups along the food axis, which reflects the role of CO2. The positive influence of CO2 fertilisation on plant productivity moves the projections of NPP per capita from a reduction (RAD) to an increase (RADPHYS) in all regions apart from Australia, where the RADPHYS ensemble spans zero. As Figure 6 previously demonstrated, the projections of change for water stress tend to be more uncertain (horizontal spread in Figure 7) and span zero in several regions. There is no clear separation between the two sub-ensembles along the water stress axis, but the global scale signal, dominated by projections for Asia, is for reductions in the population living under high water stress in the RADPHYS compared with the RAD ensemble. This indicates the potential trade-off between global-scale benefits of climate and CO2 to regional variation in response as well as the trade-off between food and water resources. Climate change and CO2 may well increase food security to the detriment of water security in some regions. This result is important as it demonstrates that food and water resources need to be evaluated in an integrated way when investigating the potential impacts of climate and climate mitigation. It should be noted that including population change would shift the whole ensemble into the lower right quadrant.
Figure 7. The regional impact of climate change (year 2000 population) on the population living in high water stress versus the change in Human Appropriation of NPP per capita, for the 2050s climate relative to 1971–2000. Two RAD and RADPHYS sub-ensembles are shown in red and blue respectively.
Sustainability 05 02129 g007

4. Discussion

Using the metrics considered here, population growth is main driver of change [50] in food and water resources and there is clearly a need to adapt food and water systems to these pressures [2,51,52,53]. Adaptation of food systems through the extensive deployment of irrigation technology is likely to be difficult due to the simultaneous increases in water stress, thus increasing competition for water.
A possible adaptation option is to expand the area currently under cultivation. The FAO (Food and Agriculture Organisation) estimates that approximately 1.6 billion hectares of land are currently cultivated, with the possibility that 2.4 billion hectares of land in total are suitable for cultivation. However, land-use change is one of the biggest sources of carbon emissions and competition for land is likely to be highly limiting to the options for further land conversion. Furthermore, agriculture is a major source of Greenhouse Gases (GHGs) and account for around half of methane and nitrous-oxide emissions. Inappropriate intensification of agriculture may therefore have significant implications for climate mitigation targets [53]. Any further intensification or extensification of agriculture is also likely to have significant negative impacts on ecosystem services such as biodiversity and carbon storage [54].
This study finds that CO2 fertilisation and physiological forcing may have significant benefits and in some cases reverse the negative effects of climate on food and water systems. However, this makes the assumption that crop productivity can be translated into changes in yield and the nutritional quality of food. The generic approach to crop productivity used here accounts for the effect of heat waves and drought on vegetation productivity but not on specific crop mortality. Changes in drought may therefore have significant impacts that are not accounted for here [12]. Modelling work on African food security has found that the crop climate of the primary cereal crops—maize, millet and sorghum—is likely to shift away from the regions in which they are currently cultivated making adaptation even more challenging [55].

Carbon Dioxide

In the results presented here we find a strong effect of CO2 fertilisation on crop production. Our median estimate is for a 20% increase in global production compared to the present day by the 2050s under the A1B SRES scenario corresponding to an atmospheric CO2 concentration of around 550 ppmv. This compares to a theoretical 40% increase in photosynthesis for C3 crops [56]. The lower estimate derived here includes the possibly negative effects of climate change as well as a fraction of global crops having a C4 photosynthetic pathway, which derive little benefit from increased atmospheric CO2 but may benefit from increased temperatures. This response includes secondary processes to the direct fertilisation effect on photosynthesis, in which plants become more water-use efficient in high CO2 environments. This physiological forcing allows plants to use their available water more conservatively and may therefore reduce water stress leading to a secondary marginal increase in production.
Importantly, the increase in photosynthesis is not necessarily matched by increases in yield. Increases of atmospheric CO2 to 550 ppm would on average increase C3 and C4 crop yields by 10–20% and 0–10% respectively [28,56,57]. In our model, the increase in production assumes that the vegetation is not nutrient limited. Therefore, to achieve the increases in productivity, application of fertilisers would also have to increase with likely implications for the emissions of GHGs.
Furthermore, the CO2 benefits as simulated by the climate model here may be reduced by the many other limiting factors including pests, disease, soil quality and nutrient availability. Other factors show that the higher yields may not be translated into higher nutritional qualities: for instance elevated CO2 is detrimental to the protein content of wheat flour [58].
Global-scale analysis of climate and CO2 interactions have shown that the strength of the CO2 effect is a critical factor in determining whether yields will increase or decrease [59,60]. In the experiments performed here we find that CO2 is critical to increasing crop productivity by the 2050s. However, when accounting for population change we find that CO2 is important in mitigating the population-driven decline in per capita productivity of every region. Globally, we find that the median decline in per capita production is 34% (uncertainty 32 to 36%) due to climate (without direct CO2 effects), reduced to 16% (uncertainty 14 to 20%) if CO2 fertilisation is included. This results runs contrary to a number of experiments [9,59,61] that have shown CO2 physiological forcing to have a negligible effect on future food resources.
The response of water stress to climate change in the absence of population growth is more mixed, with both increases in the global population experiencing stress but reductions in the numbers experiencing high or extreme stress, as well as some regional winners and losers. The addition of CO2 fertilisation and physiological forcing is able to reduce regional increases in water stress but not reverse the change with the exception of Australia. Here, the increase of numbers of people under high and extreme stress under climate change projections is changed to a decrease with the addition of the CO2 effects. When factoring in population change, like food, water resources are reduced by the 2050s. However, for all regions and for moderate, high and extreme water stress, the additional direct effect of CO2 reduces the numbers of people experiencing that level of stress compared to population growth alone. The magnitude of the CO2 effect appears to be a key factor in determining future water stress. Overall, water stress increases by the 2050s because of population growth, as has been found elsewhere [46,62].
In the analysis presented here the results for food production and water stress are presented together and implicit within the water stress assumptions is agricultural demand for water. However, the requirements for increased food production for a growing population is likely to increase agricultural demand for water, and water may become the limiting factor [63]. Currently agriculture is the dominant consumer of water accounting for around 80% of global water consumption [3]. Modelling studies have found that climate mitigation reduced agricultural water requirements by around 40% in the 2080s [64]. Adapting agricultural food production to climate change and increasing demand through technological solutions like irrigation [6,65] is therefore likely to increase demand for fresh water and consequently increase levels of water stress.
We therefore find some benefits of climate change (without direct CO2 effects) in the absence of population growth to water resources, but not for crop productivity unless the climate change is driven by increasing atmospheric CO2 as opposed to other GHGs. A future dominated by the radiatively equivalent concentrations of non-CO2 gases such as CH4, NOx and CFCs may have much stronger implications for food and water availability. The differential impacts of GHGs climate forcing is often missed in policy discussions using the UNFCCC standard of comparing CO2 equivalents in terms of their Global Warming Potentials. The lack of a one-to-one correspondence between CO2 and global warming (climate sensitivity) has important implications. The IPCC Fourth Assessment report gave climate sensitivity a likely range of 2–4.5 °C [66]. A low climate sensitivity would suggest less warming for a given CO2 concentration as the impacts of global warming are non-linearly linked to global warming, as demonstrated in this study. The climate sensitivity could therefore be crucial to whether crop productivity and water resources increase or decrease under CO2 driven climate change, with the benefits of CO2 higher at lower climate sensitivities [67]. Recent observation-based paleoclimate reconstructions imply climate sensitivity could be on the low side of the IPCC assessment with a likely range of 1.7 to 2.6 °C [68].
Other greenhouse species such as ozone are known to have direct negative impacts on crop and vegetation productivity [69] in addition to their contribution to climate change. This raises the possibility that reducing some of the short-lived greenhouse species, such as ozone, black carbon and methane, which exert a strong radiative forcing, may help offset some of the warming on the decadal timescale [70,71,72]. The co-benefits of this are the reductions in some of their negative effects on vegetation productivity, whilst maintaining CO2 fertilisation. A focus on short-term mitigation on CO2 at the expense of other greenhouse gases may lead to the loss of some of the potential CO2 benefits whilst still getting the decadal warming. However, atmospheric CO2 is the main greenhouse gas, and without any CO2 mitigation it will be impossible to meet climate targets such as the UNFCCC 2 °C target under the Copenhagen Accord [73]. The implications go beyond climate mitigation discussions to Geo-Engineering of the climate system. For instance, the use of solar radiation management (SRM) (e.g., [74]) to offset the warming of GHGs will not interfere with the effect of CO2 fertilisation and physiological forcing. Pongratz et al., [75] based on a climate model demonstrated that SRM generally caused crop yields to increase due to CO2 fertilisation and the offsetting of temperature effects.

5. Conclusions

This study uses simple metrics of food and water stress to explore the interaction between food and water, climate uncertainty and CO2 effects. The results of climate model simulations presented here combined with projected increases in population show the need to fully consider climate and population change in developing adaptation strategies over the coming decades. Population is likely to be the main driver of decreasing food and water security, with Africa vulnerable to increasing population and climatic change. The effects of CO2 through fertilisation and physiological forcing have been shown to potentially increase food and water resources in the future. Climate change itself is likely to have negative effects on crop productivity if the climate change is not associated with increasing CO2. Africa is a key region where climate with CO2 fertilisation potentially reverses a decrease in runoff and a decrease in crop productivity from climate change alone, but this is highly uncertain. Of particular note in this study is that the impacts of GHGs should not be considered only through climate, but their direct effects on food and water should also be included.
The magnitude of the CO2 effect within the climate model is not well constrained through the approach used here to sample uncertainty, or through experimental evidence. Translating crop production into food security is further complicated by the uncertain relationship between crop productivity, nutritional quality and yield [12]. Assessments such as this one which are necessarily based on modelling studies are therefore highly uncertain.

Acknowledgments

This work was supported by the Joint DECC/Defra Met Office Hadley Centre Climate Programme (GA01101).

Conflict of Interest

The authors declare no conflict of interest.

References and Notes

  1. Meadows, D.H.; Meadows, D.L.; Randers, J.; Behrens, W.W., III. The Limits to Growth: A Report for the Club of Rome’s Project on the Predicament of Mankind; Universe Books: New York, NY, USA, 1972. [Google Scholar]
  2. Beddington, J.R.; Asaduzzaman, M.; Clark, M.E.; Bremauntz, A.F.; Guillou, M.D.; Howlett, D.J.B.; Jahn, M.M.; Lin, E.; Mamo, T.; Negra, C.; et al. What next for agriculture after durban? Science 2012, 335, 289–290. [Google Scholar]
  3. Molden, D.; Oweis, T.Y.; Steduto, P.; Kijne, J.W.; Hanjra, M.A.; Bindraban, P.S.; Bouman, B.A.M.; Cook, S.; Erenstein, O.; Farahani, H.; et al. Pathways for increasing agricultural water productivity. In Agriculture, Water for Food, Water for Life: A Comprehensive Assessment of Water Management in Agriculture; Molden, D., Ed.; International Water Management Institute: London, UK, 2007. [Google Scholar]
  4. Hanjra, M.A.; Qureshi, M.E. Global water crisis and future food security in an era of climate change. Food Policy 2010, 35, 365–377. [Google Scholar] [CrossRef]
  5. Molden, D.; Oweis, T.; Steduto, P.; Bindraban, P.; Hanjra, M.A.; Kijne, J. Improving agricultural water productivity: Between optimism and caution. Agric. Water Manage 2010, 97, 528–535. [Google Scholar] [CrossRef]
  6. Rosenzweig, C.; Parry, M.L. Potential impact of climate change on world food supply. Nature 1994, 367, 133–138. [Google Scholar] [CrossRef]
  7. World Water Assessment Programme, The United Nations World Water Development Report 3: Water in a Changing World; UNESCO: London, UK, 2009.
  8. Barriopedro, D.; Fischer, E.M.; Luterbacher, J.; Trigo, R.; Garcia-Herrera, R. The Hot summer of 2010: Redrawing the Temperature record map of europe. Science 2011, 332, 220–224. [Google Scholar] [CrossRef]
  9. Schmidhuber, J.; Tubiello, F.N. Global food security under climate change. Proc. Natl. Acad. Sci. USA 2007, 104, 19703–19708. [Google Scholar] [CrossRef]
  10. Pope, V.D.; Gallani, M.L.; Rowntree, P.R.; Stratton, R.A. The impact of new physical parametrizations in the Hadley Centre climate model: HadAM3. Clim. Dynam. 2000, 16, 123–146. [Google Scholar] [CrossRef]
  11. Gordon, C.; Cooper, C.; Senior, C.A.; Banks, H.; Gregory, J.M.; Johns, T.C.; Mitchell, J.F.B.; Wood, R.A. The simulation of SST, sea ice extents and ocean heat transports in a version of the Hadley Centre coupled model without flux adjustments. Clim. Dynam. 2000, 16, 147–168. [Google Scholar] [CrossRef]
  12. Gornall, J.; Betts, R.; Burke, E.; Clark, R.; Camp, J.; Willett, K.; Wiltshire, A. Implications of climate change for agricultural productivity in the early twenty-first century. Philos Trans. R. Soc. B 2010, 365, 2973–2989. [Google Scholar] [CrossRef]
  13. Nakicenovic, N.; Alcamo, J.; Davis, G.; de Vries, B.; Fenhann, J.; Gaffin, S.; Gregory, K.; Grübler, A.; Jung, T.Y.; Kram, T.; et al. IPCC Special Report on Emissions Scenarios; Cambridge University Press: Cambridge, UK, 2006. [Google Scholar]
  14. Collins, M.; Booth, B.B.B.; Harris, G.R.; Murphy, J.M.; Sexton, D.M.H.; Webb, M.J. Towards quantifying uncertainty in transient climate change. Clim. Dynam. 2006, 27, 127–147. [Google Scholar] [CrossRef]
  15. Lutz, W.; Sanderson, W.; Scherbov, S. The coming acceleration of global population ageing. Nature 2008, 451, 716–719. [Google Scholar] [CrossRef]
  16. Lutz, W.; Sanderson, W.; Scherbov, S. IIASA’s 2007 Probabilistic World Population Projections, IIASA World Population Program Online Data Base of Results. Available online: http://www.iiasa.ac.at/Research/POP/proj07/index.html?sb=5/ (accessed on 1 February 2012).
  17. Van Vuuren, D.P.; Lucas, P.L.; Hilderink, H. Downscaling drivers of global environmental change: Enabling use of global SRES scenarios at the national and grid levels. Global Environ. Change 2007, 17, 114–130. [Google Scholar] [CrossRef]
  18. Ramankutty, N.; Evan, A.T.; Monfreda, C.; Foley, J.A. Farming the planet: 1. Geographic distribution of global agricultural lands in the year 2000. Glob. Biogeochem. Cycles 2008. [Google Scholar] [CrossRef]
  19. Murphy, J.M.; Sexton, D.M.H.; Barnett, D.N.; Jones, G.S.; Webb, M.J.; Collins, M. Quantification of modelling uncertainties in a large ensemble of climate change simulations. Nature 2004, 430, 768–772. [Google Scholar]
  20. Collins, M.C.M.; Booth, B.B.; Bhaskaran, B.; Harris, G.R.; Murphy, J.M.; Sexton, D.M.H.; Webb, M.J. Climate model errors, feedbacks and forcings: a comparison of perturbed physics and multi-model ensembles. Clim. Dynam. 2011, 36, 1737–1766. [Google Scholar] [CrossRef]
  21. Wiltshire, A.J.; Gornall, J.; Booth, B.B.B.; Dennis, E.; Falloon, P.; Kay, G.; McNeall, D.; Betts, R.A. The importance of population, climate change and CO2 plant physiological forcing in determining future global water stress. Global Environ. Change 2013. submitted. [Google Scholar]
  22. Field, C.B.; Jackson, R.B.; Mooney, H.A. Stomatal responses to increased CO2—Implications from the plant to the global-scale. Plant Cell Environ. 1995, 18, 1214–1225. [Google Scholar] [CrossRef]
  23. Jarvis, P.G.; McNaughton, K.G. Stomatal control of transpiration—Scaling up from leaf to region. Adv. Ecol. Res. 1986, 15, 1–49. [Google Scholar] [CrossRef]
  24. Bernacchi, C.J.; Kimball, B.A.; Quarles, D.R.; Long, S.P.; Ort, D.R. Decreases in stomatal conductance of soybean under open-air elevation of CO2 are closely coupled with decreases in ecosystem evapotranspiration. Plant Physiol. 2007, 143, 134–144. [Google Scholar]
  25. Hungate, B.A.; Reichstein, M.; Dijkstra, P.; Johnson, D.; Hymus, G.; Tenhunen, J.D.; Hinkle, C.R.; Drake, B.G. Evapotranspiration and soil water content in a scrub-oak woodland under carbon dioxide enrichment. Glob. Change Biol. 2002, 8, 289–298. [Google Scholar] [CrossRef]
  26. Li, J.H.; Erickson, J.E.; Peresta, G.; Drake, B.G. Evapotranspiration and water use efficiency in a Chesapeake Bay wetland under carbon dioxide enrichment. Glob. Change Biol. 2010, 16, 234–245. [Google Scholar] [CrossRef]
  27. Tubiello, F.N.; Amthor, J.S.; Boote, K.J.; Donatelli, M.; Easterling, W.; Fischer, G.; Gifford, R.M.; Howden, M.; Reilly, J.; Rosenzweig, C. Crop response to elevated CO2 and world food supply—A comment on “Food for Thought...” by Long et al., Science 312: 1918–1921, 2006. Eur. J. Agron. 2007, 26, 215–223. [Google Scholar]
  28. Ainsworth, E.A.; Long, S.P. What have we learned from 15 years of free-air CO2 enrichment (FACE)? A meta-analytic review of the responses of photosynthesis, canopy. New Phytol. 2005, 165, 351–371. [Google Scholar] [CrossRef]
  29. Cox, P.M.; Huntingford, C.; Harding, R.J. A canopy conductance and photosynthesis model for use in a GCM land surface scheme. J. Hydrol. 1998, 213, 79–94. [Google Scholar] [CrossRef]
  30. Oki, T.; Sud, U.C. Design of Total Runoff Integrating Pathways (TRIP)—A global river channel network. Earth Interact. 1998, 2, 1–36. [Google Scholar]
  31. Fekete, B.M.; Vorosmarty, C.J.; Grabs, W. High-resolution fields of global runoff combining observed river discharge and simulated water balances. Glob. Biogeochem. Cycles 2002. [Google Scholar] [CrossRef]
  32. Falkenmark, M. Meeting water requirements of an expanding world population. Philos. Trans. R. Soc. B Biol. Sci. 1997, 353, 929–936. [Google Scholar] [CrossRef]
  33. Falkenmark, M.; Lundqvist, J.; Widstrand, C. Macro-scale water scarcity requires micro-scale approaches. Nat. Resour. Forum 1989, 13, 258–267. [Google Scholar] [CrossRef]
  34. Koster, R.D.; Dirmeyer, P.A.; Guo, Z.C.; Bonan, G.; Chan, E.; Cox, P.; Gordon, C.T.; Kanae, S.; Kowalczyk, E.; Lawrence, D.; et al. Regions of strong coupling between soil moisture and precipitation. Science 2004, 305, 1138–1140. [Google Scholar] [CrossRef]
  35. Harding, R.J.; Blyth, E.M.; Tuinenberg, O.; Wiltshire, A.J. Land atmosphere feedbacks and their role in the water resources of the Ganges basin. Sci. Total Environ. 2013, in press. [Google Scholar]
  36. Pijanowski, B.; Moore, N.; Mauree, D.; Niyogi, D. Evaluating error propagation in coupled land-atmosphere models. Earth Interact. 2011, 15, 1–25. [Google Scholar]
  37. Clark, D.B.; Mercado, L.M.; Sitch, S.; Jones, C.D.; Gedney, N.; Best, M.J.; Pryor, M.; Rooney, G.G.; Essery, R.L.H.; Blyth, E.; et al. The Joint UK Land Environment Simulator (JULES), model description—Part 2: Carbon fluxes and vegetation dynamics. Geosci. Model Dev. 2011, 4, 701–722. [Google Scholar] [CrossRef]
  38. Best, M.J.; Pryor, M.; Clark, D.B.; Rooney, G.G.; Essery, R.L.H.; Menard, C.B.; Edwards, J.M.; Hendry, M.A.; Porson, A.; Gedney, N.; et al. The Joint UK Land Environment Simulator (JULES), model description—Part 1: Energy and water fluxes. Geosci. Model Dev. 2011, 4, 677–699. [Google Scholar] [CrossRef]
  39. Weedon, G.P.; Gomes, S.; Viterbo, P.; Shuttleworth, W.J.; Blyth, E.; Österle, H.; Adam, J.C.; Bellouin, N.; Boucher, O.; Best, M. Creation of the WATCH Forcing Data and its use to assess global and regional reference crop evaporation over land during the twentieth century. J. Hydrometeorol. 2011, 12, 823–848. [Google Scholar] [CrossRef]
  40. Haberl, H.; Erb, K.H.; Krausmann, F.; Gaube, V.; Bondeau, A.; Plutzar, C.; Gingrich, S.; Lucht, W.; Fischer-Kowalski, M. Quantifying and mapping the human appropriation of net primary production in earth’s terrestrial ecosystems. Proc. Natl. Acad. Sci. USA 2007, 104, 12942–12945. [Google Scholar] [CrossRef]
  41. Vitousek, P.M.; Ehrlich, P.R.; Ehrlich, A.H.; Matson, P.A. Human appropriation of the products of photosynthesis. Bioscience 1986, 36, 368–373. [Google Scholar] [CrossRef]
  42. Imhoff, M.L.; Bounoua, L.; Ricketts, T.; Loucks, C.; Harriss, R.; Lawrence, W.T. Global patterns in human consumption of net primary production. Nature 2004, 429, 870–873. [Google Scholar] [CrossRef]
  43. FAO. Food Balance Sheets—FAOSTAT. Available online: http://faostat.fao.org/default.aspx/ (accessed on 1 December 2012).
  44. Rakotoarisoa, M.A.; Lafrate, M.; Paschali, M. Why Has Africa Become a Net Food Importer? Explaining Africa Agricultural and Food Trade Deficits; Trade and Markets Division, Food and Agriculture Organization of the United Nations: Rome, Italy, 2011. [Google Scholar]
  45. Islam, M.S.; Oki, T.; Kanae, S.; Hanasaki, N.; Agata, Y.; Yoshimura, K. A grid-based assessment of global water scarcity including virtual water trading. Water Resour. Manage 2007, 21, 19–33. [Google Scholar]
  46. Arnell, N.W. Climate change and global water resources: SRES emissions and socio-economic scenarios. Global Environ. Change 2004, 14, 31–52. [Google Scholar] [CrossRef]
  47. Revenga, C.; Brunner, J.; Henniger, N.; Kassem, K.; Payne, R. Pilot Analysis of Global Ecosystems: Freshwater Systems; World Resources Institute: Washington, DC, USA, 2000. [Google Scholar]
  48. Kummu, M.; Ward, P.J.; de Moel, H.; Varis, O. Is physical water scarcity a new phenomenon? Global assessment of water shortage over the last two millennia. Environ. Res. Lett. 2010. [Google Scholar] [CrossRef]
  49. Hoff, H.; Falkenmark, M.; Gerten, D.; Gordon, L.; Karlberg, L.; Rockstrom, J. Greening the global water system. J. Hydrol. 2010, 384, 177–186. [Google Scholar] [CrossRef]
  50. Gornall, J.L.; Betts, R.A.; Wiltshire, A.J. Anthropogenic Drivers of Environmental Change. In Handbook of Environmental Change; Matthews, J., Ed.; SAGE: London, UK, 2012. [Google Scholar]
  51. Beddington, J. Food security: Contributions from science to a new and greener revolution. Philos. Trans. R. Soc. B 2010, 365, 61–71. [Google Scholar] [CrossRef]
  52. Godfray, H.C.J.; Beddington, J.R.; Crute, I.R.; Haddad, L.; Lawrence, D.; Muir, J.F.; Pretty, J.; Robinson, S.; Thomas, S.M.; Toulmin, C. Food security: The challenge of feeding 9 billion people. Science 2010, 327, 812–818. [Google Scholar] [CrossRef]
  53. Godfray, H.C.J.; Pretty, J.; Thomas, S.M.; Warham, E.J.; Beddington, J.R. Linking policy on climate and food. Science 2011, 331, 1013–1014. [Google Scholar]
  54. Tilman, D.; Reich, P.B.; Knops, J.; Wedin, D.; Mielke, T.; Lehman, C. Diversity and productivity in a long-term grassland experiment. Science 2001, 294, 843–845. [Google Scholar] [CrossRef]
  55. Burke, M.B.; Lobell, D.B.; Guarino, L. Shifts in African crop climates by 2050, and the implications for crop improvement and genetic resources conservation. Global Environ. Change 2009, 19, 317–325. [Google Scholar] [CrossRef]
  56. Long, S.P.; Ainsworth, E.A.; Rogers, A.; Ort, D.R. Rising atmospheric carbon dioxide: Plants face the future. Annu. Rev. Plant Biol. 2004, 55, 591–628. [Google Scholar] [CrossRef]
  57. Gifford, R.M. The CO2 fertilising effect—Does it occur in the real world? The International Free Air CO2 Enrichment (FACE) Workshop: Short- and long-term effects of elevated atmospheric CO2 on managed ecosystems, Ascona, Switzerland, March 2004. New Phytol. 2004, 163, 221–225. [Google Scholar] [CrossRef]
  58. Sinclair, T.R.; Pinter, P.J.; Kimball, B.A.; Adamsen, F.J.; LaMorte, R.L.; Wall, G.W.; Hunsaker, D.J.; Adam, N.; Brooks, T.J.; Garcia, R.L.; et al. Leaf nitrogen concentration of wheat subjected to elevated [CO2] and either water or N deficits. Agric. Ecosyst. Environ. 2000, 79, 53–60. [Google Scholar] [CrossRef]
  59. Parry, M.L.; Rosenzweig, C.; Iglesias, A.; Livermore, M.; Fischer, G. Effects of climate change on global food production under SRES emissions and socio-economic scenarios. Global Environ. Change 2004, 14, 53–67. [Google Scholar] [CrossRef]
  60. Long, S.P.; Ainsworth, E.A.; Leakey, A.D.B.; Nosberger, J.; Ort, D.R. Food for thought: Lower-than-expected crop yield stimulation with rising CO2 concentrations. Science 2006, 312, 1918–1921. [Google Scholar] [CrossRef]
  61. Fischer, G.; Shah, M.; Tubiello, F.N.; van Velhuizen, H. Socio-economic and climate change impacts on agriculture: An integrated assessment, 1990–2080. Philos. Tran. R. Soc. B 2005, 360, 2067–2083. [Google Scholar] [CrossRef]
  62. Vorosmarty, C.J.; Green, P.; Salisbury, J.; Lammers, R.B. Global water resources: Vulnerability from climate change and population growth. Science 2000, 289, 284–288. [Google Scholar] [CrossRef]
  63. Brown, M.E.; Funk, C.C. Climate—Food security under climate change. Science 2008, 319, 580–581. [Google Scholar] [CrossRef]
  64. Fischer, G.; Tubiello, F.N.; van Velthuizen, H.; Wiberg, D.A. Climate change impacts on irrigation water requirements: Effects of mitigation, 1990–2080. Technol. Forecast. Soc. Change 2007, 74, 1083–1107. [Google Scholar] [CrossRef]
  65. Betts, R.A.; Falloon, P.D.; Gornall, J.; Kaye, N.; Wiltshire, A.; Wheeler, T. Climate Change and Food Security. In Climate Sense; Asrar, G.R., Ed.; Tudor Rose: Leicester, UK, 2009. [Google Scholar]
  66. IPCC, Climate Change 2007: Synthesis Report; Cambridge University Press: Cambridge, UK, 2007.
  67. Betts, R.A.; Arnell, N.W.; Boorman, P.M.; Cornell, S.E.; House, J.I.; Kaye, N.R.; McCarthy, M.P.; McNeall, D.J.; Sanderson, M.G.; Wiltshire, A.J. Climate change impacts and adaptation: An earth system view. In Understanding the Earth System; Cornell, S.E., Prentice, I.C., House, J.I., Downy, C.J., Eds.; Cambridge University Press: Cambridge, UK, 2012; p. 296. [Google Scholar]
  68. Schmittner, A.; Urban, N.M.; Shakun, J.D.; Mahowald, N.M.; Clark, P.U.; Bartlein, P.J.; Mix, A.C.; Rosell-Mele, A. Climate sensitivity estimated from temperature reconstructions of the last glacial maximum. Science 2011, 334, 1385–1388. [Google Scholar] [CrossRef] [Green Version]
  69. Sitch, S.; Cox, P.M.; Collins, W.J.; Huntingford, C. Indirect radiative forcing of climate change through ozone effects on the land-carbon sink. Nature 2007, 448, 791–794. [Google Scholar]
  70. Bond, T.C.; Doherty, S.J.; Fahey, D.W.; Forster, P.M.; Berntsen, T.; DeAngelo, B.J.; Flanner, M.G.; Ghan, S.; Kärcher, B.; Koch, D.; et al. Bounding the role of black carbon in the climate system: A scientific assessment. J. Geophys. Res. Atmos. 2013. [Google Scholar] [CrossRef]
  71. Shindell, D.; Kuylenstierna, J.C.I.; Vignati, E.; van Dingenen, R.; Amann, M.; Klimont, Z.; Anenberg, S.C.; Muller, N.; Janssens-Maenhout, G.; Raes, F.; et al. Simultaneously mitigating near-term climate change and improving human health and food security. Science 2012, 335, 183–189. [Google Scholar]
  72. Kopp, R.E.; Mauzerall, D.L. Assessing the climatic benefits of black carbon mitigation. Proc. Natl. Acad. Sci. USA 2010, 107, 11703–11708. [Google Scholar] [CrossRef]
  73. UNFCCC. Decision 2/CP.15 Copenhagen Accord, 2009. Available online: http://unfccc.int/resource/docs/2009/cop15/eng/11a01.pdf (accessed on 1 February 2012).
  74. Robock, A.; Marquardt, A.; Kravitz, B.; Stenchikov, G. Benefits, risks, and costs of stratospheric geoengineering. Geophys. Res. Lett. 2009. [Google Scholar] [CrossRef]
  75. Pongratz, J.; Lobell, D.B.; Cao, L.; Caldeira, K. Crop yields in a geoengineered climate. Nat. Clim. Change 2012, 2, 101–105. [Google Scholar]