Establishment of Alleycropped Hybrid Aspen “Crandon” in Central Iowa, USA: Effects of Topographic Position and Fertilizer Rate on Aboveground Biomass Production and Allocation

Abstract
:1. Introduction
2. Materials and Methods
2.1. Tree Materials
2.2. Study Site and Experimental Design
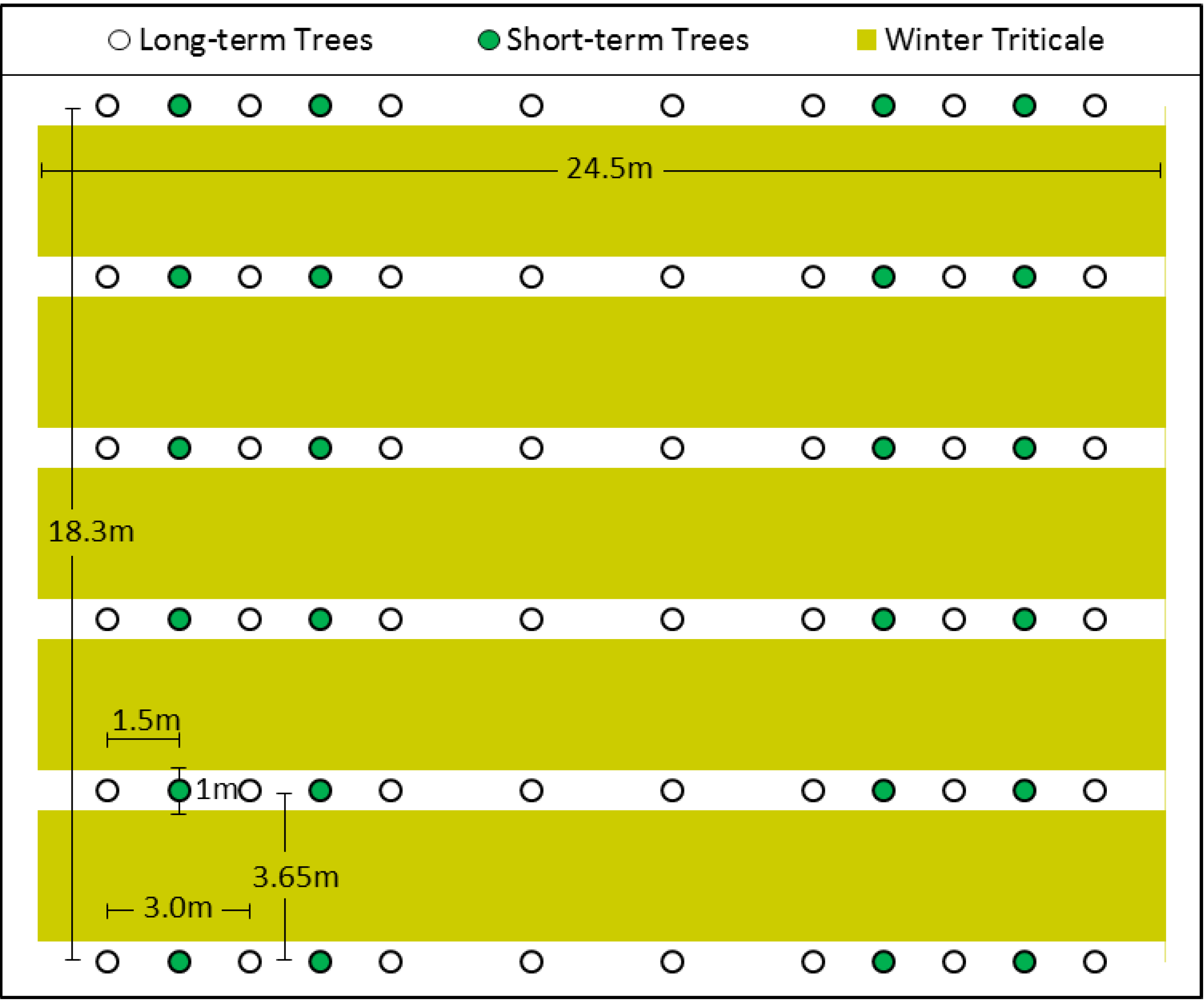
2.3. Site Preparation, Planting, and Harvest
2.4. Data Analysis
3. Results and Discussion
3.1. Analysis of Variance (ANOVA)

| Effects | BT | BB | BS | AB:S |
|---|---|---|---|---|
| Block | 0.0044 | 0.0082 | 0.0044 | 0.3147 |
| Position | 0.7234 | 0.7362 | 0.5854 | 0.1968 |
| Fertilizer | <0.0001 | <0.0001 | 0.0012 | 0.1244 |
| Year | <0.0001 | <0.0001 | <0.0001 | 0.2658 |
| Fertilizer × Year | 0.2515 | 0.4008 | 0.3552 | 0.7438 |
| Position × Fertilizer | 0.7287 | 0.8617 | 0.6711 | 0.9083 |
| Position × Year | 0.0005 | 0.0018 | 0.0074 | 0.5097 |
| Position × Fertilizer × Year | 0.6691 | 0.7393 | 0.9712 | 0.7721 |
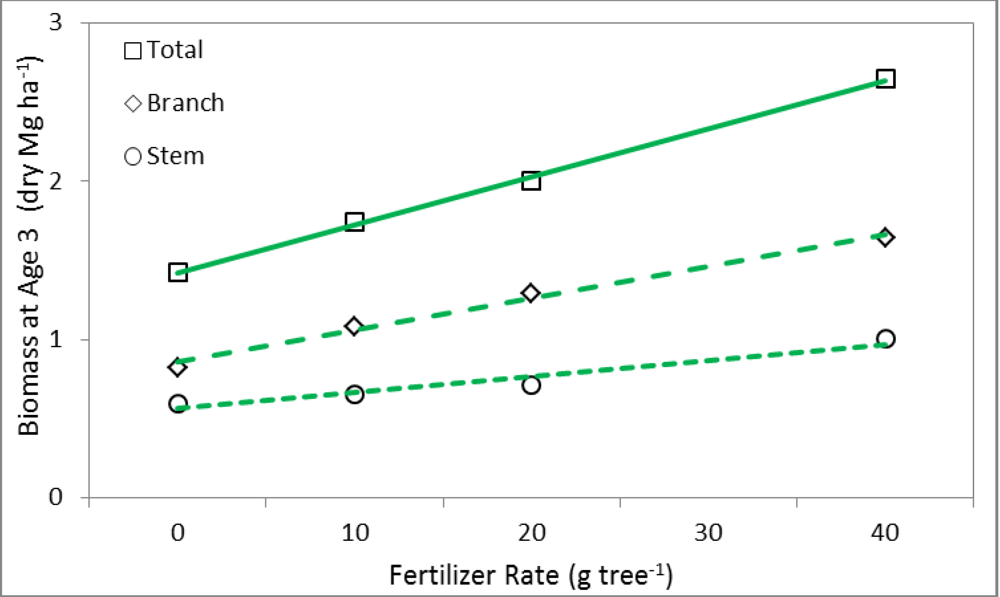
| Fertilizer Rate (g tree−1) | BT (g tree−1) | BB (g tree−1) | BS (g tree−1) | |||
|---|---|---|---|---|---|---|
| 0 | 102 | c | 43 | c | 54 | c |
| 10 | 132 | bc | 60 | bc | 62 | bc |
| 20 | 162 | ab | 81 | ab | 71 | abc |
| 40 | 200 | a | 98 | a | 89 | a |
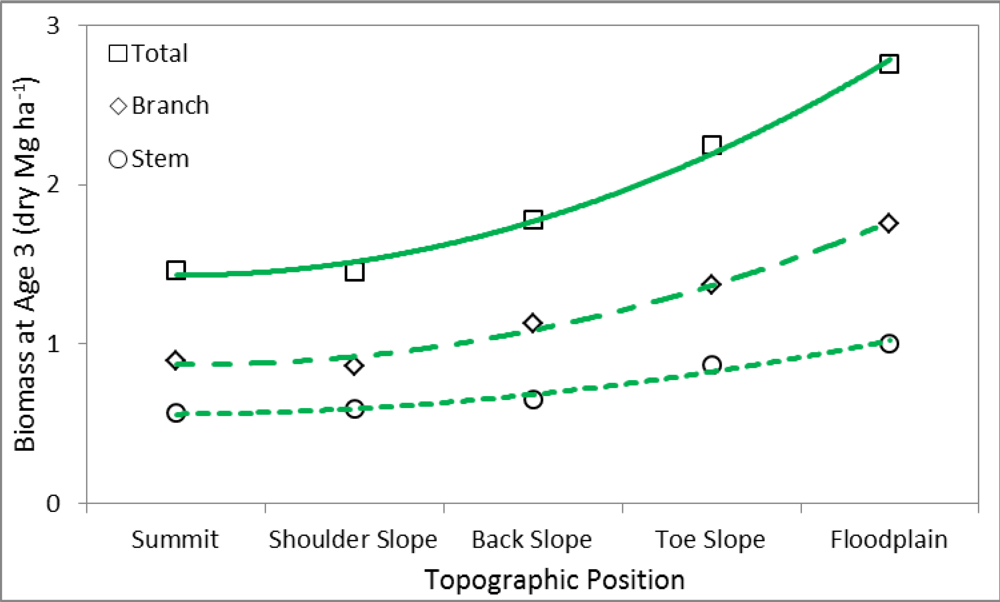
| Position × Year Combinations | BT (g tree−1) | BB (g tree−1) | BS (g tree−1) | |||
|---|---|---|---|---|---|---|
| Year 1 | ||||||
| Summit | 25.7 | d | 10.7 | de | 13.5 | de |
| Shoulder Slope | 25.1 | d | 11.5 | d | 12.6 | de |
| Back Slope | 25.7 | d | 7.8 | de | 15.8 | d |
| Toe Slope | 24.0 | d | 8.5 | de | 13.2 | de |
| Floodplain | 9.8 | d | 3.0 | e | 6.2 | e |
| Year 2 | ||||||
| Summit | 178 | c | 93 | c | 76 | c |
| Shoulder Slope | 158 | c | 76 | c | 74 | c |
| Back Slope | 129 | c | 52 | c | 72 | c |
| Toe Slope | 240 | bc | 110 | bc | 115 | bc |
| Floodplain | 195 | c | 93 | c | 85 | c |
| Year 3 | ||||||
| Summit | 646 | ab | 372 | ab | 251 | ab |
| Shoulder Slope | 676 | a | 380 | ab | 288 | ab |
| Back Slope | 813 | a | 479 | a | 316 | ab |
| Toe Slope | 891 | a | 537 | a | 331 | a |
| Floodplain | 1202 | a | 724 | a | 447 | a |

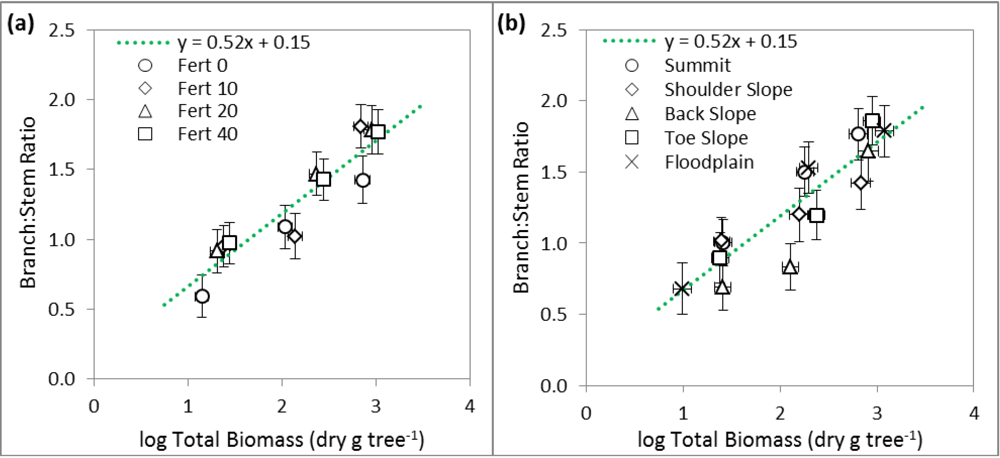
3.2. Linear Regression
| Component | a | b | c | R2 |
|---|---|---|---|---|
| BT | 2.040 | 0.769 | −0.174 | 0.97 |
| BB | 2.985 | 0.055 | 0.820 | 0.90 |
| BS | 1.548 | 1.153 | 1.202 | 0.98 |
4. Conclusions
Acknowledgments
Conflict of Interest
References and Notes
- U.S. Department of Energy, Billion-ton Update: Biomass Supply for a Bioenergy and Bioproducts Industry; ORNL/TM-2011/224; Perlack, R.D.; Stokes, B.J. (Eds.) Oak Ridge National Laboratory: Oak Ridge, TN, USA, 2011; p. 227.
- Boehmel, C.; Lewandowski, I.; Claupein, W. Comparing annual and perennial energy cropping systems with different management intensities. Agr. Syst. 2008, 96, 224–236. [Google Scholar] [CrossRef]
- Netzer, D.A.; Tolsted, D.; Ostry, M.E.; Isebrands, J.G.; Riemenschneider, D.E.; Ward, K.T. Growth, yield, and disease resistance of 7- to 12-year-old poplar clones in the north central United States; North Central Research Station General Technical Report NC-229; U.S. Forest Service: St. Paul, MN, USA, 2002; p. 31. [Google Scholar]
- Zalesny, R.S., Jr.; Hall, R.B.; Zalesny, J.A.; McMahon, B.G.; Berguson, W.E.; Stanosz, G.R. Biomass and genotype × environment interactions of Populus energy crops in the midwestern United States. BioEnergy Res. 2009, 2, 106–122. [Google Scholar] [CrossRef]
- Huang, H.J.; Ramaswamy, S.; Al-Dajani, W.; Tschirner, U.; Cairncross, R.A. Effect of biomass species and plant size on cellulosic ethanol: A comparative process and economic analysis. Biomass Bioenerg. 2009, 33, 234–246. [Google Scholar] [CrossRef]
- Blanco-Canqui, H. Energy crops and their implications on soil and environment. Agron. J. 2010, 102, 403–419. [Google Scholar] [CrossRef]
- Goerndt, M.E.; Mize, C. Short-rotation woody biomass as a crop on marginal lands in Iowa. North. J. Appl. For. 2008, 25, 82–86. [Google Scholar]
- Palma, J.H.N.; Graves, A.R.; Burgess, P.J.; Keesman, K.J.; van Keulen, H.; Mayus, M.; Reisner, Y.; Herzog, F. Methodological approach for the assessment of environmental effects of agroforestry at the landscape scale. Ecol. Eng. 2007, 29, 450–462. [Google Scholar] [CrossRef] [Green Version]
- Zamora, D.S.; Jose, S.; Napolitano, K. Competition for 15N labeled nitrogen in a loblolly pine-cotton alley cropping system in the southeastern United States. Agr. Ecosyst. Environ. 2009, 131, 40–50. [Google Scholar] [CrossRef]
- Dougherty, M.C.; Thevathasan, N.V.; Gordon, A.M.; Lee, H.; Kort, J. Nitrate and Escherichia coli NAR analysis in tile drain effluent from a mixed tree intercrop and monocrop system. Agr. Ecosyst. Environ. 2009, 131, 77–84. [Google Scholar] [CrossRef]
- Peichl, M.; Thevathasan, N.V.; Gordon, A.M.; Huss, J.; Abohassan, R.A. Carbon sequestration potentials in temperate tree-based intercropping systems, southern Ontario, Canada. Agrofor. Syst. 2006, 66, 243–257. [Google Scholar] [CrossRef]
- Stamps, W.T.; McGraw, R.L.; Godsey, L.; Woods, T.L. The ecology and economics of insect pest management in nut tree alley cropping systems in the Midwestern United States. Agr. Ecosyst. Environ. 2009, 131, 4–8. [Google Scholar] [CrossRef]
- Tsonkova, P.; Bohm, C.; Quinkenstein, A.; Freese, D. Ecological benefits provided by alley cropping systems for production of woody biomass in the temperature region: A review. Agrofor. Syst. 2012, 85, 133–152. [Google Scholar] [CrossRef]
- Reynolds, P.E.; Simpson, J.A.; Thevathasan, N.V.; Gordon, A.M. Effects of tree competition on corn and soybean photosynthesis, growth, and yield in a temperate tree-based agroforestry intercropping system in southern Ontario, Canada. Ecol. Eng. 2007, 29, 362–371. [Google Scholar] [CrossRef]
- Manceur, A.M.; Boland, G.J.; Thevathasan, N.V.; Gordon, A.M. Dry matter partitions and specific leaf weight of soybean change with tree competition in an intercropping system. Agrofor. Syst. 2009, 76, 295–301. [Google Scholar] [CrossRef]
- Rivest, D.; Cogliastro, A.; Bradley, R.L.; Olivier, A. Intercropping hybrid poplar with soybean increases soil microbial biomass, mineral N supply and tree growth. Agrofor. Syst. 2010, 80, 33–40. [Google Scholar] [CrossRef]
- Beaudette, C.; Bradley, R.L.; Whalen, J.K.; McVetty, P.B.E.; Vessey, K.; Smith, D.L. Tree-based intercropping does not compromise canola (Brassica napus L.) seed oil yield and reduces soil nitrous oxide emissions. Agric. Ecosyst. Environ. 2010, 139, 33–39. [Google Scholar] [CrossRef]
- Delate, K.; Holzmueller, E.; Frederick, D.D.; Mize, C.; Brummer, C. Tree establishment and growth using forage ground covers in an alley-cropped system in Midwestern USA. Agrofor. Syst. 2005, 65, 43–52. [Google Scholar] [CrossRef]
- Rivest, D.; Cogliastro, A.; Olivier, A. Tree-based intercropping systems increase growth and nutrient status of hybrid poplar: A case study from two Northeastern American experiments. J. Environ. Manag. 2009, 91, 432–440. [Google Scholar] [CrossRef]
- Devine, W.D.; Harrington, C.A.; DeBell, D.S. Intra-annual growth and mortality of four Populus clones in pure and mixed plantings. New For. 2010, 39, 287–299. [Google Scholar] [CrossRef]
- Hegenstaller, A.H.; Anex, R.P.; Liebman, M.; Sundberg, D.N.; Gibson, L.R. Productivity and nutrient dynamics in bioenergy double-cropping systems. Agron. J. 2008, 100, 1740–1748. [Google Scholar] [CrossRef]
- Jemison, J.M., Jr.; Darby, H.M.; Reberg-Horton, S.C. Winter grain—short season corn double crop forage production for New England. Agron. J. 2012, 104, 256–264. [Google Scholar] [CrossRef]
- Goff, B.M.; Moore, K.J.; Fales, S.L.; Heaton, E.A. Double-cropping sorghum for biomass. Agron. J. 2010, 102, 1586–1592. [Google Scholar] [CrossRef]
- Coleman, M.; Tolsted, D.; Nichols, T.; Johnson, W.D.; Wene, E.G.; Houghtaling, T. Post-establishment fertilization of Minnesota hybrid poplar plantations. Biomass Bioenerg. 2006, 30, 740–749. [Google Scholar] [CrossRef]
- Coyle, D.R.; Coleman, M.D. Forest production responses to irrigation and fertilization are not explained by shifts in allocation. For. Ecol. Manag. 2005, 208, 137–152. [Google Scholar] [CrossRef]
- Van den Driessche, R. First-year growth response of four Populus trichocarpa × Populus deltoides clones to fertilizer placement and level. Can. J. For. Res. 1999, 29, 554–562. [Google Scholar]
- Guillemette, T.; DesRochers, A. Early growth and nutrition of hybrid poplars fertilized at planting in the boreal forest of western Quebec. For. Ecol. Manag. 2008, 255, 2981–2989. [Google Scholar] [CrossRef]
- Manatt, R.K.; Hallam, A.; Schulte, L.A.; Heaton, E.A.; Gunther, T.; Hall, R.B.; Moore, K.J. Farm-scale costs and returns for 2G cropping systems in the U.S. Corn Belt. Environ. Res. Lett. 2013. submitted for publication. [Google Scholar]
- Welsh, W.W. Root zone water quality and soil moisture dynamics of biomass cropping systems and landscape positions. Master Thesis, Iowa State University, Ames, IA, USA, 2012; p. 89. [Google Scholar]
- Wilson, D.M.; Gunther, T.P.; Heaton, E.A.; Schulte, L.A.; Hall, R.B.; Headlee, W.L.; Moore, K.J.; Maier, M.; Boersma, N.N. Establishment and productivity of annual and perennial biomass crops across a landscape gradient. in preparation.
- Littell, R.C.; Stroup, W.W.; Freund, R.J. SAS® for Linear Models, 4th ed.; SAS Institute Inc.: Cary, NC, USA, 2002; p. 466. [Google Scholar]
- Ontl, T.A.; Hofmockel, K.S.; Cambardella, C.A.; Schulte, L.A.; Kolka, R.K. Topographic and soil influences on root productivity of three bioenergy cropping systems. New Phytol 2013. [Google Scholar] [CrossRef]
- Avery, T.E.; Burkhart, H.E. Volumes and Weights of Standing Trees. In Forest Measurements, 5th ed.; McGraw-Gill: New York, NY, USA, 2002; pp. 168–195. [Google Scholar]
- Hall, R.B. Use of the crown competition factor concept to select clones and spacings for short-rotation woody crops. Tree Physiol. 1994, 14, 899–909. [Google Scholar] [CrossRef]
- Krajicek, J.E.; Brinkman, K.A.; Gingrich, S.F. Crown competition—a measure of density. For. Sci. 1961, 7, 35–42. [Google Scholar]
© 2013 by the authors; licensee MDPI, Basel, Switzerland. This article is an open access article distributed under the terms and conditions of the Creative Commons Attribution license (http://creativecommons.org/licenses/by/3.0/).
Share and Cite
Headlee, W.L.; Hall, R.B.; Zalesny, R.S., Jr. Establishment of Alleycropped Hybrid Aspen “Crandon” in Central Iowa, USA: Effects of Topographic Position and Fertilizer Rate on Aboveground Biomass Production and Allocation. Sustainability 2013, 5, 2874-2886. https://doi.org/10.3390/su5072874
Headlee WL, Hall RB, Zalesny RS Jr. Establishment of Alleycropped Hybrid Aspen “Crandon” in Central Iowa, USA: Effects of Topographic Position and Fertilizer Rate on Aboveground Biomass Production and Allocation. Sustainability. 2013; 5(7):2874-2886. https://doi.org/10.3390/su5072874
Chicago/Turabian StyleHeadlee, William L., Richard B. Hall, and Ronald S. Zalesny, Jr. 2013. "Establishment of Alleycropped Hybrid Aspen “Crandon” in Central Iowa, USA: Effects of Topographic Position and Fertilizer Rate on Aboveground Biomass Production and Allocation" Sustainability 5, no. 7: 2874-2886. https://doi.org/10.3390/su5072874