1. Introduction
Strategic Environmental Assessment is a process aimed at supporting decision making in the planning process and at helping policy makers in comparing alternatives for local intervention based on potential environmental impacts. In the European Union (EU), Strategic Environmental Assessment (SEA) has been introduced by Directive 2001/42/EC, recognizing that spatial planning processes need to be supported by the evaluation of medium- and long-term effects of policies, plans or programs. Moreover, 25 countries in the world have formally set up the SEA system in the form of legislation and developed the SEA framework to some extent [
1].
The experience gained during the last two decades of SEA practice in the EU raised some concerns about the real effectiveness of SEA implementation procedures to comprehensively assess the environmental sustainability of interventions [
2,
3]. One of the main debated issues is the necessity to enlarge the perspective of the assessment in order to enhance discriminating power between alternatives and to support decision making. This requires also to resolve possible conflicts between environmental protection and social and economic development objectives in a proficient way [
1].
According to [
4], sometimes, SEA fails at influencing decisions, and there are few successful experiences documented at the policy level, mainly because it usually follows the Environmental Impact Assessment (EIA) approach, which is structured for projects, trying to adapt it to policies, programs and plans (PPPs). Indeed, there is one main difference between projects and PPPs, which lies in the fact that PPPs entail political decisions that are necessarily influenced by non-rational aspects, such as the economic and social conditions of the community where the planning takes place [
5]. In this perspective, policy makers may have to make decisions based not only on data about the environmental conditions, but also on the possible influence of external factors and trends [
6,
7], such as, for instance, the lifestyle,
i.e., consumption behavior and patterns, of the citizens living in the area under investigation.
The last two decades of Strategic Environmental Assessment (SEA) practices in Europe and worldwide have been partially criticized, due to limited comprehensiveness in assessing environmental impacts, due to socioeconomic drivers. In fact, traditionally, only socioeconomic drivers related to specific land use (viz. infrastructure, building and industrial development) are appraised in terms of environmental impacts.
As indicated by the EU directive and national legislation, the SEA process has to include quantitative evaluation about the current situation and the foreseen effects of the PPPs under investigation. For this reason, SEA is usually performed through a set of environmental indicators, which represent current and foreseeable environmental conditions in the area [
8].
However, if we consider that the main objective of the planning process should be to ensure sustainable development for the area,
i.e., to improve the quality of life and of services for the local community, respecting the quality of environment, SEA shall balance the three components of sustainable development (social, economic and environmental pillars) and cannot be a mere environmental impact assessment applied to plans and policies [
2]. Some authors (see, for instance, [
4]) suggested moving from a rationalist approach to a decision-centered approach for the evaluation, which takes into account, also, the non-deterministic aspects of decisions in policy making. In this perspective, an environmental assessment, which is based only on environmental indicators, can be useful for identifying areas of concerns, but could be insufficient to support decision making.
Besides, others socioeconomic drivers, such as lifestyles (determining household consumption), contribute to the overall local impacts in a given region or city, but are usually neglected in SEA [
9]. Therefore, during the planning process and its assessment, the object of evaluation should entail not only interventions in infrastructure, new buildings and/or industrial area deployment, but also other socioeconomic drivers, related to citizens’ consumption patterns. Those are particularly challenging, as the private consumption component of the socioeconomic drivers and related impacts are very heterogeneous and could be difficult to depict [
10].
Another important aspect to be considered in the evaluation of PPPs is that, in order to be really sustainable, the planning should take into account the limits of local resources (
i.e., being resource efficiency oriented, [
11]). Therefore, the concept of limit is the basis upon which all the indicators considered should be developed. In addition, the most recent trends in SEA requires the integration of environmental limits as a reference for the evaluation and the inclusion of climate change as one of the most relevant issues for environmental sustainability [
3].
In order to address these issues, in the present paper, we chose to perform the assessment through a traditional set of environmental indicators combined with composite sustainability indicators, able to take into account the impacts of consumption behavior linked to citizens’ lifestyle, with reference to limits of resources. The chosen composite indicators are the carbon balance (CB) and the ecological footprint (EF). CB and EF take into account a sustainability threshold (limit of resources) and are more focused than traditional environmental indicators on the consumption perspective and on the role of responsible behaviors from all the stakeholders of the community.
A more comprehensive range of aspects in the evaluation should aim at:
evaluating the effects with reference to the existing limits of resources [
12] and testing the self-sustainment of the area (in terms of resource provision and emissions uptake);
quantifying the effects generated by the actions of the plans: trying to calculate quantitative variation in the sustainability state of the area under investigation (not only a class of state, e.g., the overshoot or credit of resources and positive or negative carbon balance, but a quantitative measure of effects in terms of the increase or decrease of EF, BC, emissions and uptake capacity);
including in the evaluation not only the direct macro effects (e.g., degradation of natural land or building materials consumption, due to the construction of new dwelling areas), but also indirect ones, such as, for instance, the increase of electricity and other household consumption following the increase in the number of residents in a given area;
evaluating sustainability in a broader perspective, assessing the contribution from the area under investigation to global environmental problems, such as climate change and resource depletion.
The present work illustrates a case study of SEA in which the traditional set of environmental performance indicators are integrated with two sustainability indicators. In fact, SEA is complemented with EF assessment of citizens’ consumption and a CB of the area under investigation. The idea is to broadly assess socio-economic drivers related to consumption, as well as to include in the evaluation some issues of global concern, such as resource depletion and climate change, reinforcing the use of the carrying capacity concept within the local planning [
13]. Apart from legislative thresholds, in the authors’ opinion, a focus on the ratio between consumption and impact at the local scale is really crucial [
10].
The EF assessment, and its comparison with local biocapacity, helps decision makers to understand if the level of consumption of the local community (determined by citizens’ and other city users’ lifestyles) exceeds the limits of the natural resources of the area (in a perspective of self-sustainment at the local scale) or if there is an overshoot between the footprint and the biocapacity, i.e., if the local consumption is the cause of excessive land use in other areas.
The evaluation of CO2 balance is aimed at focusing the attention on the climate issue (which is relevant both at the local and the global scale), in order to highlight disequilibrium between direct and indirect emissions of greenhouse gases, due to local activities and the uptake capacity of the area. This evaluation can help to identify the role of spatial planning choices in determining the sustainability of the entire system both in the CO2 reduction strategy and in conservation of the uptake capacity of the territory.
Three types of carrying capacity can be defined and applied in defining policies at the local scale: quantitative, qualitative and operational carrying capacity. These three analyses are aligned with a concept of a plurality of “sustainabilities”, as a univocal solution for planning sustainability actions is not feasible. According to the slogan “think global act local”, each country, region and municipality has to define a pathway to sustainability according to: local socio-economic conditions, local environmental quality and quantity of resources, culture and stakeholders’ behavior in production and consumption of goods and services [
14]. Moreover, this site-dependent pathway to sustainability should take into account both local boundaries, as well as planetary ones [
15].
Table 1 illustrates the sustainability assessment methodologies that can be used to evaluate the three levels of carrying capacity. In the present study, tools for quantitative and qualitative carrying capacity are discussed, since operational carrying capacity for PPPs needs to be evaluated in the implementation stage, in relation to the specific technical projects designed for the actions foreseen in the plans.
Table 1.
The three levels of carrying capacity and examples of methodologies for evaluation thereof.
Table 1.
The three levels of carrying capacity and examples of methodologies for evaluation thereof.
| Carrying capacity | Methodologies |
|---|
| Quantitative carrying capacity (how much can be consumed in the perspective of self-sustainability and as a way to reduce the overall impact on environment and resources) | Carbon balance (how far the local context is from a balance between emission and absorption of CO2);ecological footprint (how the local pattern of consumption affects the availability of resources) |
| Qualitative carrying capacity (how, where and when a new action may affect the quality of an environmental system). | Set of indicators, entailing different environmental compartments, evaluated against sustainability thresholds, to compare intervention at the local scale with actual conditions |
| Operational carrying capacity (economic and social feasibility related to the specific socio-economic context and technological options towards higher efficiency and effectiveness level). | Cost benefit analysis;
technology assessment |
2. Methodology
As introduced before, the study refers to the implementation of a SEA process adopting different levels and indicators for the appraisal: (1) environmental performance indicators (chosen from the EU sets of environmental indicators developed at the EU and worldwide level); (2) ecological footprint and biocapacity; and (3) carbon balance. The choice of (2) and (3) was driven by the need to apply land related indicators capable of appraising local consumption patterns and addressing a potential self-sustainability of the studied system (municipality or region, etc.). In fact, EF translates consumption pattern in hectares of land needed for producing the consumed product/services, whereas the carbon balance at the local scale addresses mainly consumption patterns in terms of energy consumption.
2.2. CO2 Balance at the Local Scale
CO
2 balance is generally based on comparison between emission and uptake of CO
2. In spatial planning, the assessment of CO
2 is usually limited to a local carbon footprint [
20] (inventory of local or shadow emission) without assessing the capability of the territory for offsetting the emissions. In this paper, a methodology developed by Pennati and colleagues [
21] is applied as a basis for estimating and mapping the CO
2 balance at the local scale, providing a tool for the investigation of the local situation with reference to the achievement of CO
2 emissions reduction objectives. The first step is the assessment of the gap between emission and uptake at the local scale. The second step is the decision support for spatial planning towards choices that can assure a reduction of the emission and a higher uptake capacity of the territory. Hence, the policy objective at both the local and global scale can be reached, also considering the gap at the local scale and reducing emissions and/or planning land use to increase the amount of local uptake of CO
2.
The methodology proposes to compare data of direct and indirect emission with data of uptake referring to specific land uses, which were collected from the literature and optimized for the local conditions.
For emission, direct emissions are the emission related to activities that take place in the area under investigation (the source of the data is the Italian national inventory of emission, based on [
22]), whilst indirect or indirect emissions are related to emissions that occur outside the area under investigation, but that were caused by the production and consumption pattern in the area under investigation (e.g., electric consumption or waste production).
In the literature, there are several methodologies for estimating CO2 emission from different sources, whilst there are only a few comprehensive studies about the role of vegetation and soil for CO2 absorption at local scales.
In this study, the balance is calculated considering various rates of uptake, due to several kinds of actual land use. In [
21], the rates of uptake resulting from the literature review are presented. In the calculation of the balance, those values are divided by an average and precautionary factor of two in order to take into account that the data from the review refer only to the CO
2 fixed during the day and not to the plant respiration during the night. This precautionary factor accounts for potential variability of data, also. In fact, experimental studies often present different results, because of the difficulty in measuring uptake and of the influence by meteorological and climatic conditions.
In this paper, an example of the application in four municipalities in northern Italy is presented. Land uses leading to emission and uptake are mapped with Geographical Information Systems (GIS), enabling us to highlight the uptake deficit and the role of sustainable land use planning.
2.3. Ecological Footprint and Biocapacity
Ecological footprint (EF) is an aggregated index that correlates the lifestyle of a population with the amount of natural resources needed to support it (the “life-supporting natural capital”) [
23]. Among the different footprint indicators developed [
24], it is an indicator whose underpinning concept is quite simple and easy to be communicated. The EF is measured by a quite intuitive parameter: the extent of the natural bio-productive area (measured in hectares per capita) needed to satisfy the consumption and to absorb the waste of a population. The assessment of EF is based on an evaluation of consumption, clustered in five components: food, housing, transportation, goods and services. Any of these components is responsible for an EF, which is measured in a specific unit that is equal to one hectare of the mean productivity of the Earth. To determine if the EF of a community is sustainable or not, it is necessary to compare the local extension of bio-productive land (biocapacity, BC) with local demand of land (EF), defining an environmental balance of the local system. Assuming that to be sustainable, a system has to be self-sustaining, the amount of deficit or overshoot of natural resources emerging from the environmental balance represents an estimation of the level of sustainability of the area considered.
The EF role as an indicator for supporting spatial planning has been evaluated in the context of several studies, some of them focusing on the suitability of different methods in providing useful insight for decision makers. Despite some limitations of EF [
25], it may integrate a traditional reductionist approach with indicators with more holistic views of the overall production and consumption patterns at the local scale.
More detailed methodologies (such as material flow analysis [
26] or lifecycle assessment, [
27]) could be useful, as well, but in some cases, may undermine the proportionality approach of impact assessment. In other words, the computational effort for applying those at the local scale could be too high and the details provided by the PPPs not enough for a robust evaluation.
The ecological footprint of the area object of the SEA has been calculated firstly referring to the current state and, then, trying to predict the foreseen effect of the actions included in the plans.
The methodology used is the bottom-up approach [
28], which allows for sub-national EF assessment and permits us to consider the changes in consumption patterns caused by the implementation of the plans, but it is not well integrated, so far, in formal spatial planning [
29].
The bottom-up method first establishes the amount of activity undertaken by a population in five categories of consumption and one category of emission (transportation, food, goods, services, building and waste). Activities are then converted into energy and direct land use. Finally, this amount is converted into global area units to allow comparison with the global biocapacity (the amount of ecological supply provided by a given area), assumed as the natural constraint for sustainability of consumption [
30].
The evaluation consists in:
- (1).
Assessment of EF based on consumption by local households;
- (2).
Assessment of BC of the area;
- (3).
Comparison between EF and BC, to evaluate the sustainability of the area in the present condition.
This evaluation has the aim of identifying the more relevant areas of consumption and the types of land that experience higher pressure from human activities.
To fulfil the aim of the study, which has a local focus, data collection for calculation of EF of the current state has been performed, giving priority to sources that can ensure the availability of primary data, such as the municipality councils or local statistics offices (e.g., for data about waste and housing) and using provincial or regional data (e.g., for mobility and food consumption) as a proxy, only when local data were not available.
The calculation of EF for the foreseen evolution of local conditions following the implementation of the plans is not always possible, because of the detailed amount of information needed to perform the evaluation: due to the fact that SEA takes place during the definition of the plans, it follows that some of the action included in the planning is not sufficiently detailed to provide adequate data for calculating the exact increase or decrease of the EF after the implementation of the plans. Nevertheless, it can be useful to predict possible variations of the EF through the development of scenarios that take into account the evolution of consumption, due to the set of actions included in the plans. This approach, even if represents a rough outline of the evaluation, can constitute an early warning for decision makers and provide information useful to address more detailed analysis before and during the implementation phase. Moreover, it offers the possibility to evaluate the situation in a comprehensive manner, considering the effects of the actions as contributing in a cumulative way to the final sustainability conditions of the area.
To evaluate the result of EF assessment of a specific area, it is necessary to compare this value, representing the human demand of nature for that area, with the amount of natural capital stock that the area can supply. In this perspective, local BC represents the reference value to determine if human consumption is in a condition of deficit or overshoot in comparison with natural resource availability.
The BC of the area is evaluated assigning factors of bio-productivity (equivalence factors) to each type of land considered in the EF method (energy land and forests, pasture, cropland, built-up land and fisheries). The first step in the evaluation of BC at the local scale is, then, the comparison between the classes of soil use available in local classification (in this case, the DUSAF—Destinazione d’Uso dei Suoli Agricoli e forestali/Land use in agricultural and forest areas—database by Lombardy Region, based on Corine land cover classes, [
31]) with the six classes of land of the EF method. The result of this comparison is summarized in
Table 3.
Table 3.
Comparison between land classes in the ecological footprint (EF) model and in the DUSAF database.
Table 3.
Comparison between land classes in the ecological footprint (EF) model and in the DUSAF database.
| Land in Ecological Footprint model | DUSAF classes of land use | Equivalence factor |
|---|
| Energy land and forest | Natural vegetation, woodland, woody plants | 1.34 |
| Pasture | Pasture and meadows | 0.49 |
| Cropland | Primary | land under cultivation (arable crops, orchards, vineyards, horticultural land) | 2.21 |
| Marginal | Uncultivated land | 1.79 |
| Built up land | serviced and built up land, urban decay, mining land | 2.21 |
| Fisheries | Lakes, basins, river beds and artificial watercourse | 0.36 |
| | Infertile soils, sandy lands, gravelly soil, beaches, deposits of detritus, rocky outcrop without plant cover | 0.00 |
The class “non productive land” integrated the model developed by redefining progress: some classes of land use in the DUSAF database have no correspondence with land classification in the EF model and, moreover, they have productivity equal to zero. For this reason, this new class was created, with an equivalence factor equal to zero. Assigning equivalence factors to the areas included in the respective DUSAF classes associated in the table, it is possible to estimate total biocapacity of the area considered. Every kind of land has a different bio-productivity. To have EF results expressed in a unique measure—the global hectare—the model normalizes the values of the bio-productivity of the areas in different nations and of different kinds of land.)].
Following the same approach, it is possible to calculate variation in BC that can follow the implementation of the plans, considering the transformation in land use, i.e., land cover illustrated in the plans (e.g., transformation from agricultural land to urban areas, due to the expansion of dwelling areas in the municipalities). This kind of calculation can be more precise than the prediction of EF variation, because data needed for the assessment are less complex and regards only land use, which is one of the core issues in spatial plans (i.e., they are well detailed in the plan).
3. The Case Study Context
The case study presented refers to the development of urban master plans (UMPs) in four municipalities in northern Italy, (Novate Mezzola, Samolaco, Verceia and Gordona) in Lombardy Region. It is an interesting area from the SEA perspective, because it allows for evaluation at the sub-regional scale, but is not limited to one single municipality (i.e., it has a wider range of interventions).
This methodology has been applied for the ex-ante assessment, aimed at identifying potentially critical issues, which need to be carefully considered during the planning and, subsequently, for the evaluation of possible effects of the planned actions. Due to the fact that SEA has to be performed during the definition of the urban master plan (UMP), some actions are not yet specifically planned at the stage of the evaluation, and this affects the possibility to quantify the predicted effects in terms of change in the carbon balance of EF; nevertheless, we tried to develop possible scenarios based on the available data, aimed at predicting a range of variation and at exploring the magnitude of the effects with respect to the previous condition.
The SEA regards the urban master plans (UMP) of the four municipalities that are developed jointly, starting from common development objectives for the entire area. The choice of the four municipalities to work together relies on the substantial homogeneity of the areas and arises from the willingness to build up a common strategy for the development of the territory and to overcome the economic difficulties related to the realization of a detailed SEA (as highlighted also by [
32]).
The main objectives of the UMPs are:
- (1).
Recovery of a former industrial area (Falk industries);
- (2).
Valorization of natural and cultural heritage;
- (3).
Promotion of sustainable tourism in guest accommodation solutions (e.g., agritourism and B&B);
- (4).
Development of pedestrian and cycle routes;
- (5).
Improvement of services;
- (6).
Identification of areas for new residential dwellings, trying to avoid urban sprawl.
In 2008, the average population per municipality was between 1,103 (in Verceia) and 2,941 (in Samolaco). Only in the municipality of Verceia, there has been a slight decline in population between 2000 and 2008, while in the remaining municipalities, there has been an upward trend, with a maximum of 11% in Novate Mezzola.
Land use shows absolute prevalence of forests, which cover percentages ranging from 51.4% of Novate Mezzola to 68.9% of Verceia, while the areas designated for urban settlements and residential and production use are very limited in all four municipalities. Moreover, there are some protected areas, belonging to the Natura 2000 network, whose area falls within two or more municipalities’ boundaries.
Indeed, the area and the UMPs of the four municipalities have interesting characteristics for testing the approach presented in this paper, because it is a rather natural territory and actions of the plans do not imply significant interventions in terms of new infrastructure or industrial activities.
Therefore, in the evaluation of current and future conditions, it becomes relevant to include the contribution of the actions to household consumption and services for the local community (e.g., mobility), rather than to assess only the environmental impacts of the main actions (e.g., construction of new buildings or infrastructures) from an Environmental Impact Assessment (EIA) point of view.
4. Results
The results of the methodology’s implementation are related to: the set of environmental performance indicators applied to the local context, as well as to the carbon balance and the ecological footprint at the local scale.
4.2. Carbon Balance
The assessment of the CB at the local scale is performed in three steps: assessment of direct emission, assessment of indirect emission and assessment of the local uptake capacity related to land use.
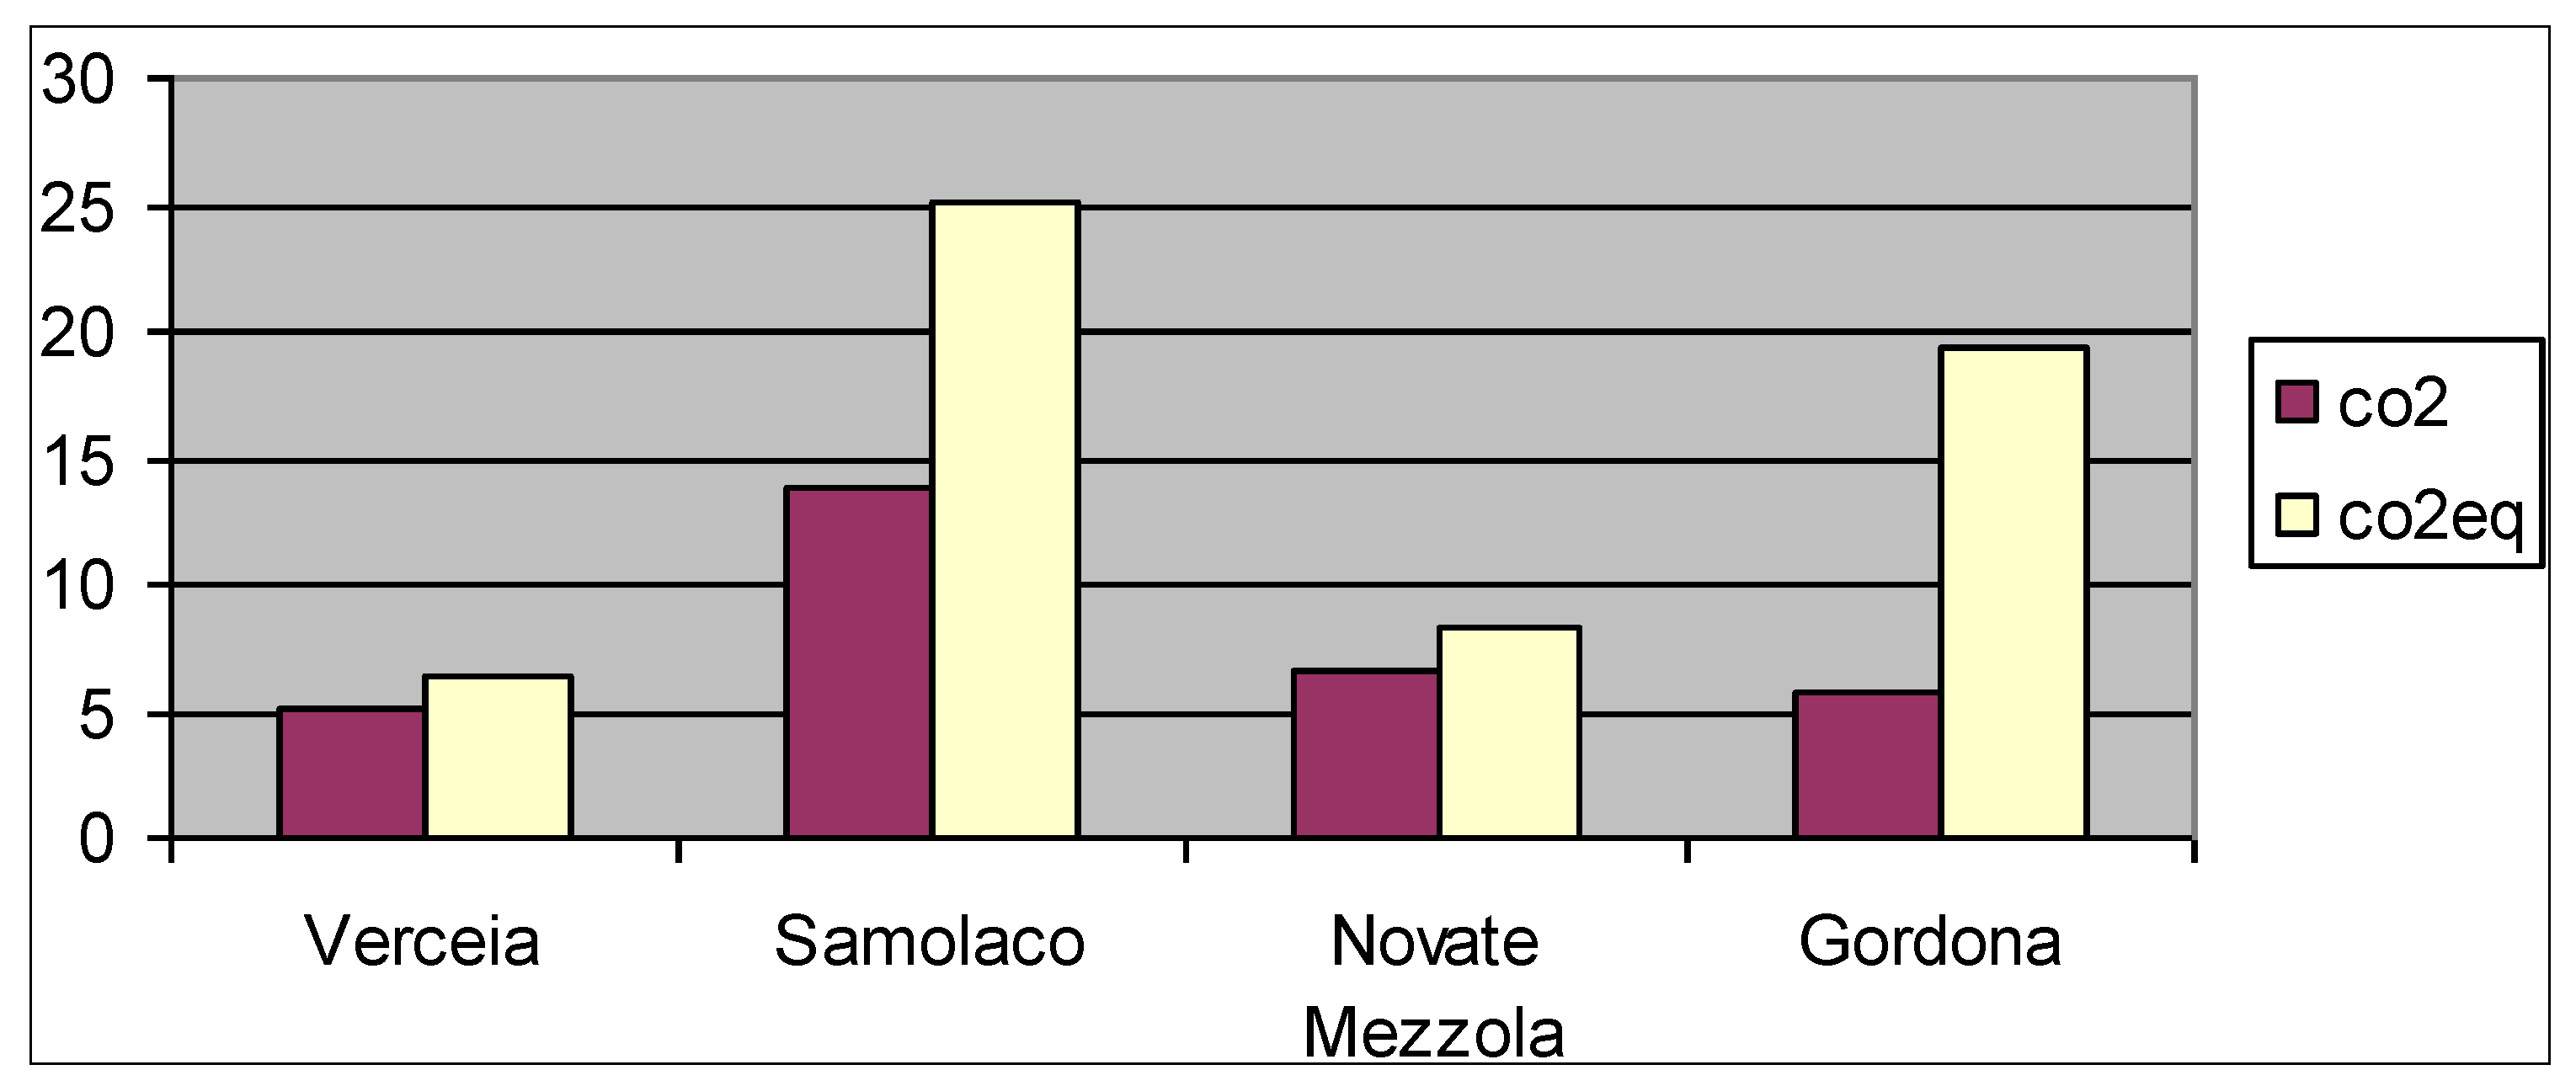
4.2.1. Direct Emissions of CO2
The regional inventory of CO
2eq emissions was used to calculate direct emissions [
33]. The main source of emission in the area of the four municipalities under investigation are: agriculture (especially cattle for Gordona and Samolaco), transport (especially for a main road along the lake) and domestic heating. For heating, it is worthy of consideration that the emission is mainly related to the use of wood as an energy fuel in Novate Mezzola and Samolaco. In
Figure 1, the contribution of CO
2 on the total CO
2eq value is shown.
The total amount of direct emission of CO2eq is 58.88 kton CO2eq per year.
Figure 1.
Direct emission for the four municipalities, in kton of CO
2 and CO
2eq per year (reference year: 2005, [
33]).
Figure 1.
Direct emission for the four municipalities, in kton of CO
2 and CO
2eq per year (reference year: 2005, [
33]).
4.2.2. Indirect Emissions of CO2
Indirect emissions were calculated attributing emissions to local electric consumption and waste production. In
Table 5, an overview of the indirect emissions from electric consumption and waste production is shown.
The overall indirect emissions related to electric consumption are 4.46 kton CO2eq/year, and the overall indirect emissions related to waste production are 5.3 kton CO2eq. Indeed, these two emission sources are strongly related with household consumption patterns, not only with local policies.
4.2.3. CO2 Uptake
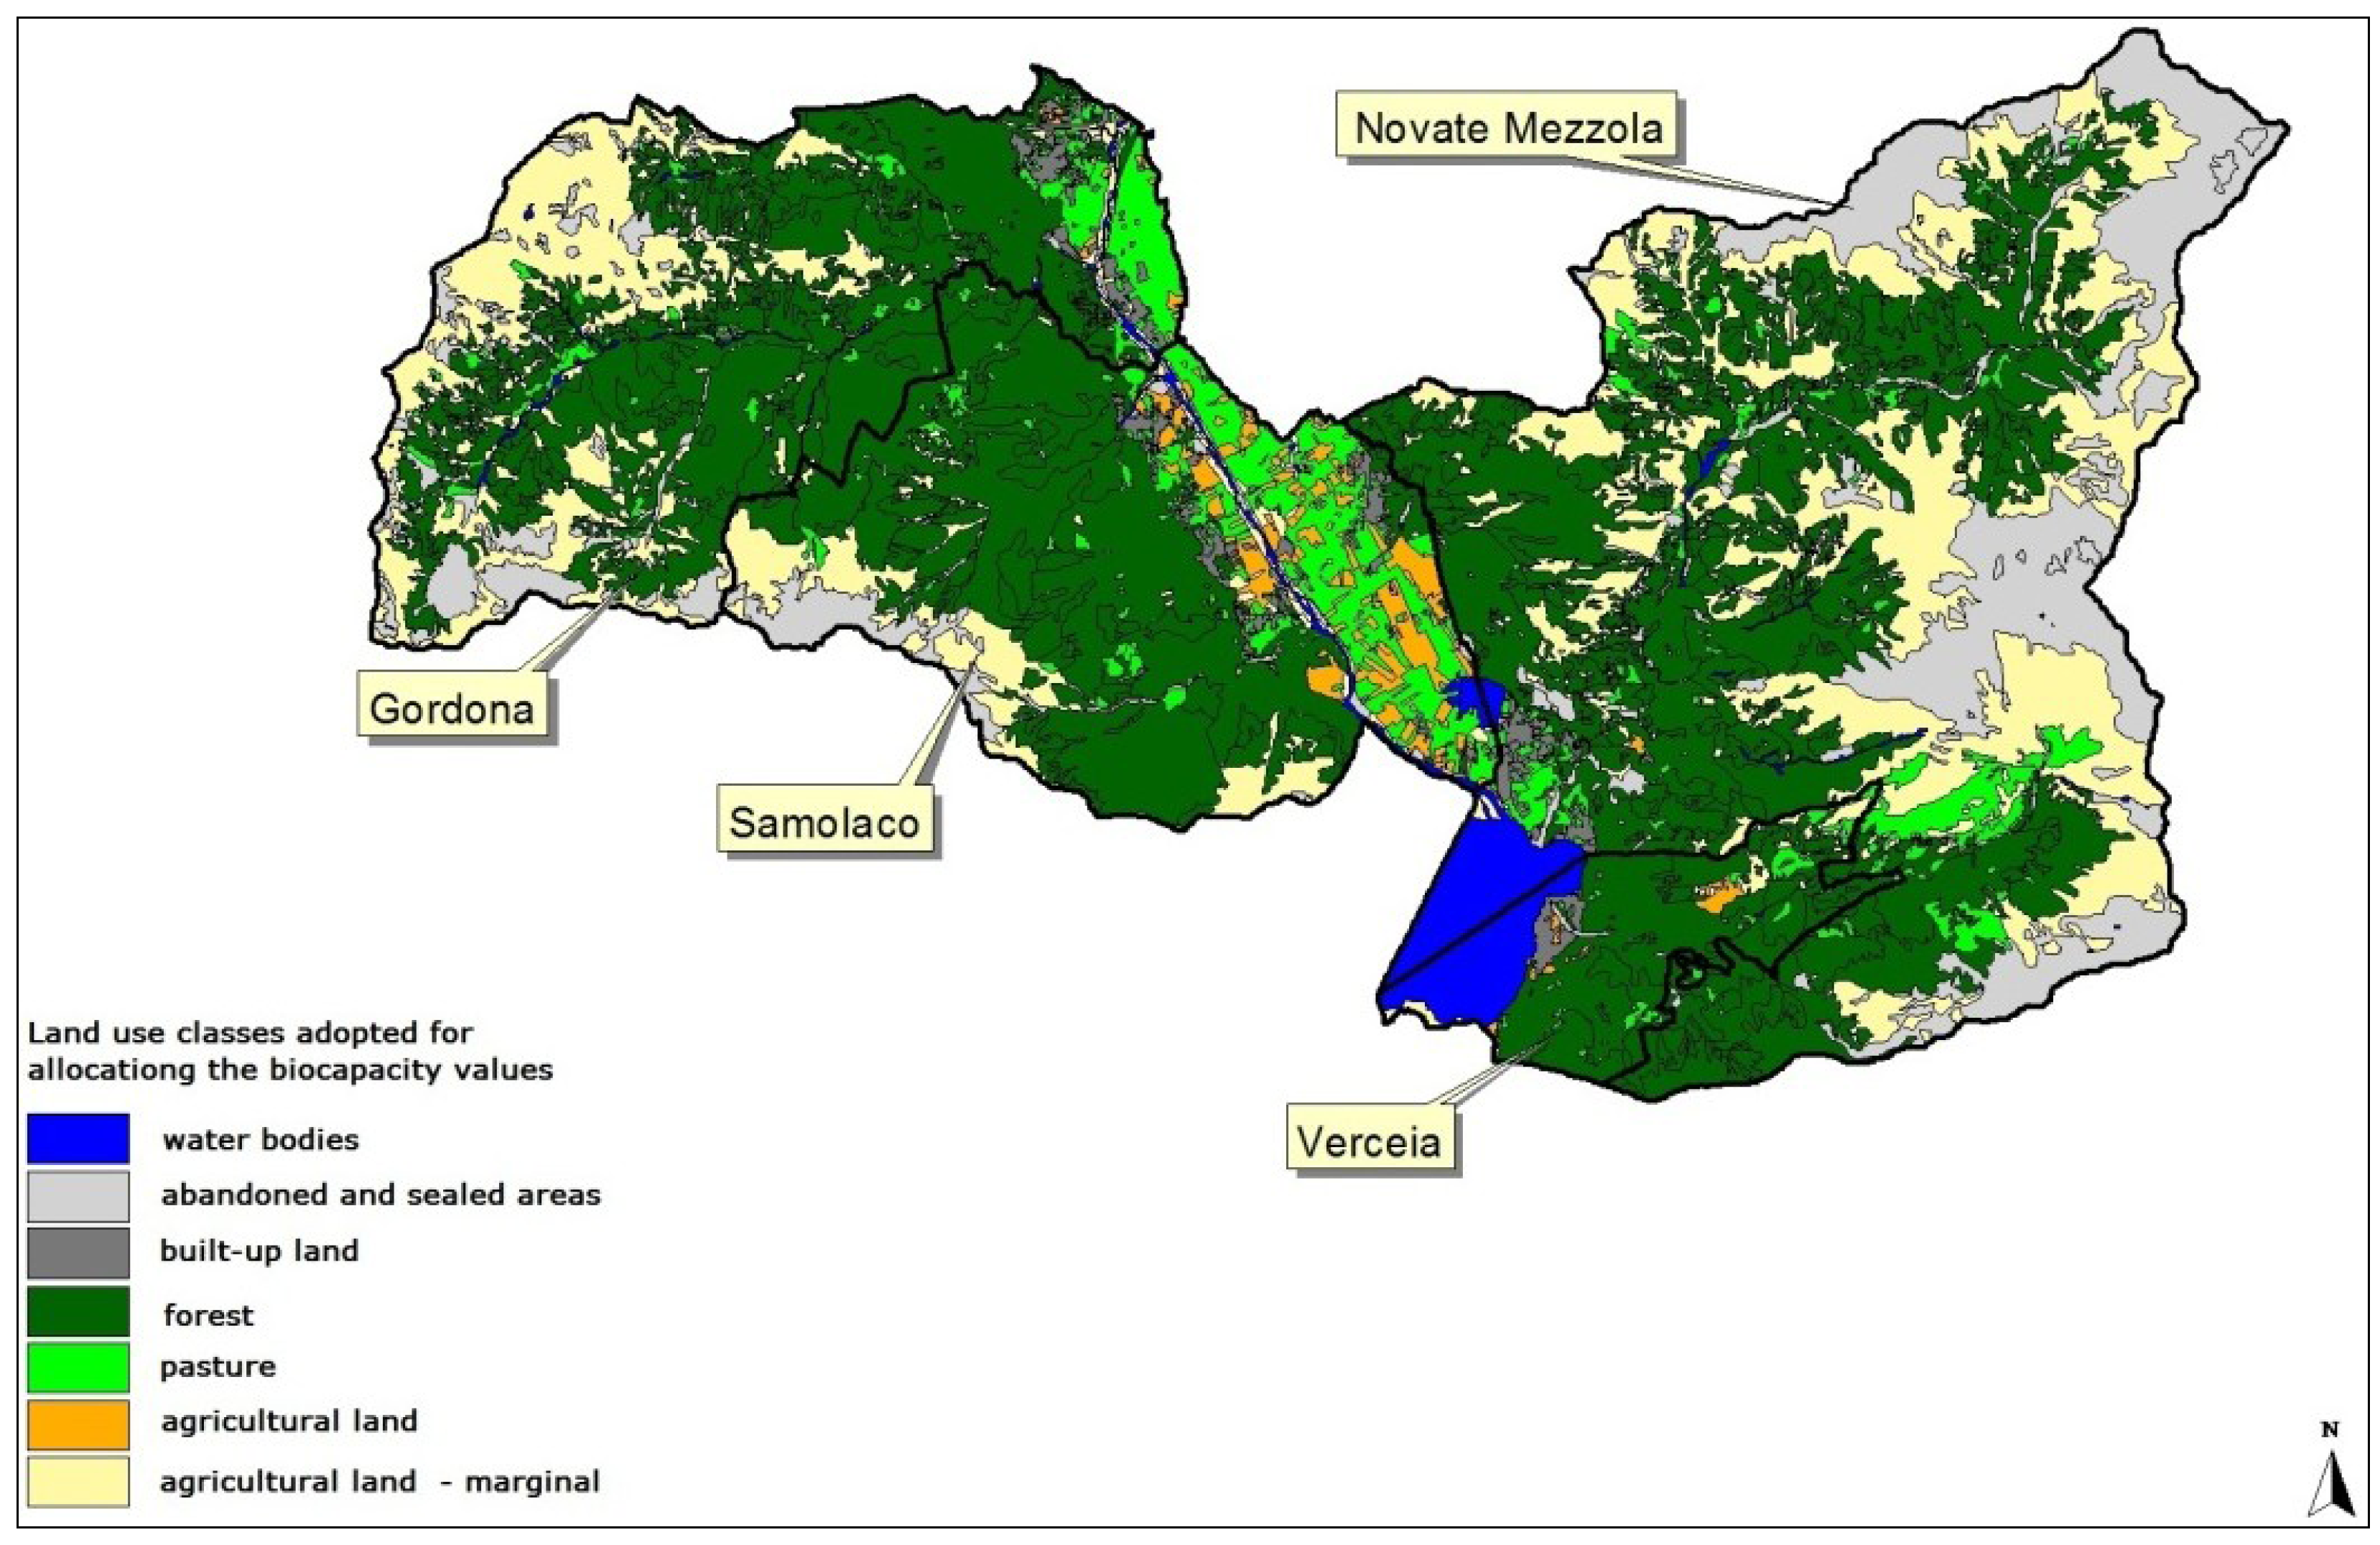
CO
2 uptake was calculated mapping the actual land use (DUSAF) and applying the values reported in [
21]. In
Figure 2, all the areas in green contribute to the uptake, whilst the areas in grey and orange contribute to the emission (urban areas, agricultural areas, industrial areas, infrastructures).
The overall uptake of the area is 292.78 kton/year. Applying the precautionary principle mentioned before to take into account the CO2 exchange of vegetation and the variability of the data, the final estimated values are equal to 145 kton CO2/year.
4.2.4. CO2 Balance
To assess the CO
2 balance and the impact of the actions in the SEA, total emissions were considered. The analysis of that emission represents also a basis for setting further strategic policies for CO
2 reduction at the local scale. The total emissions (68.63 kton CO
2eq/year) are the result of the direct emissions (58.88 kton CO
2eq), the indirect emissions related to electric consumption (4.46 kton CO
2eq) and the indirect emission related to waste production (5.3 kton CO
2eq). Accounting for the local uptake, the balance is positive. In fact, the annual uptake in the area is equal to 145 kton CO
2, whereas the emission is equal to 68.63 kton CO
2eq, with a balance of 76.36. This result is mainly due to the presence of a dense forested area. In a study applied to areas that are more densely populated, the balance is negative and the overall emissions are one order of magnitude more than the uptake (see [
21]).
Figure 2.
Land use in the area of study, according to clusters of uses to assign a biocapacity value. The green areas are also those for which the CO2 uptake is more than zero.
Figure 2.
Land use in the area of study, according to clusters of uses to assign a biocapacity value. The green areas are also those for which the CO2 uptake is more than zero.
Nevertheless, even if the balance in this area is positive, the emissions per capita are quite high (17 ton/year per capita). Hence, the SEA has to take into account policies focused on the reduction of CO2 within the main drivers of emission (cattle, transport, heating system) and policies for natural capital conservation, especially referring to forested areas (to maintain the uptake capability of the area).
4.3. Ecological Footprint and Biocapacity
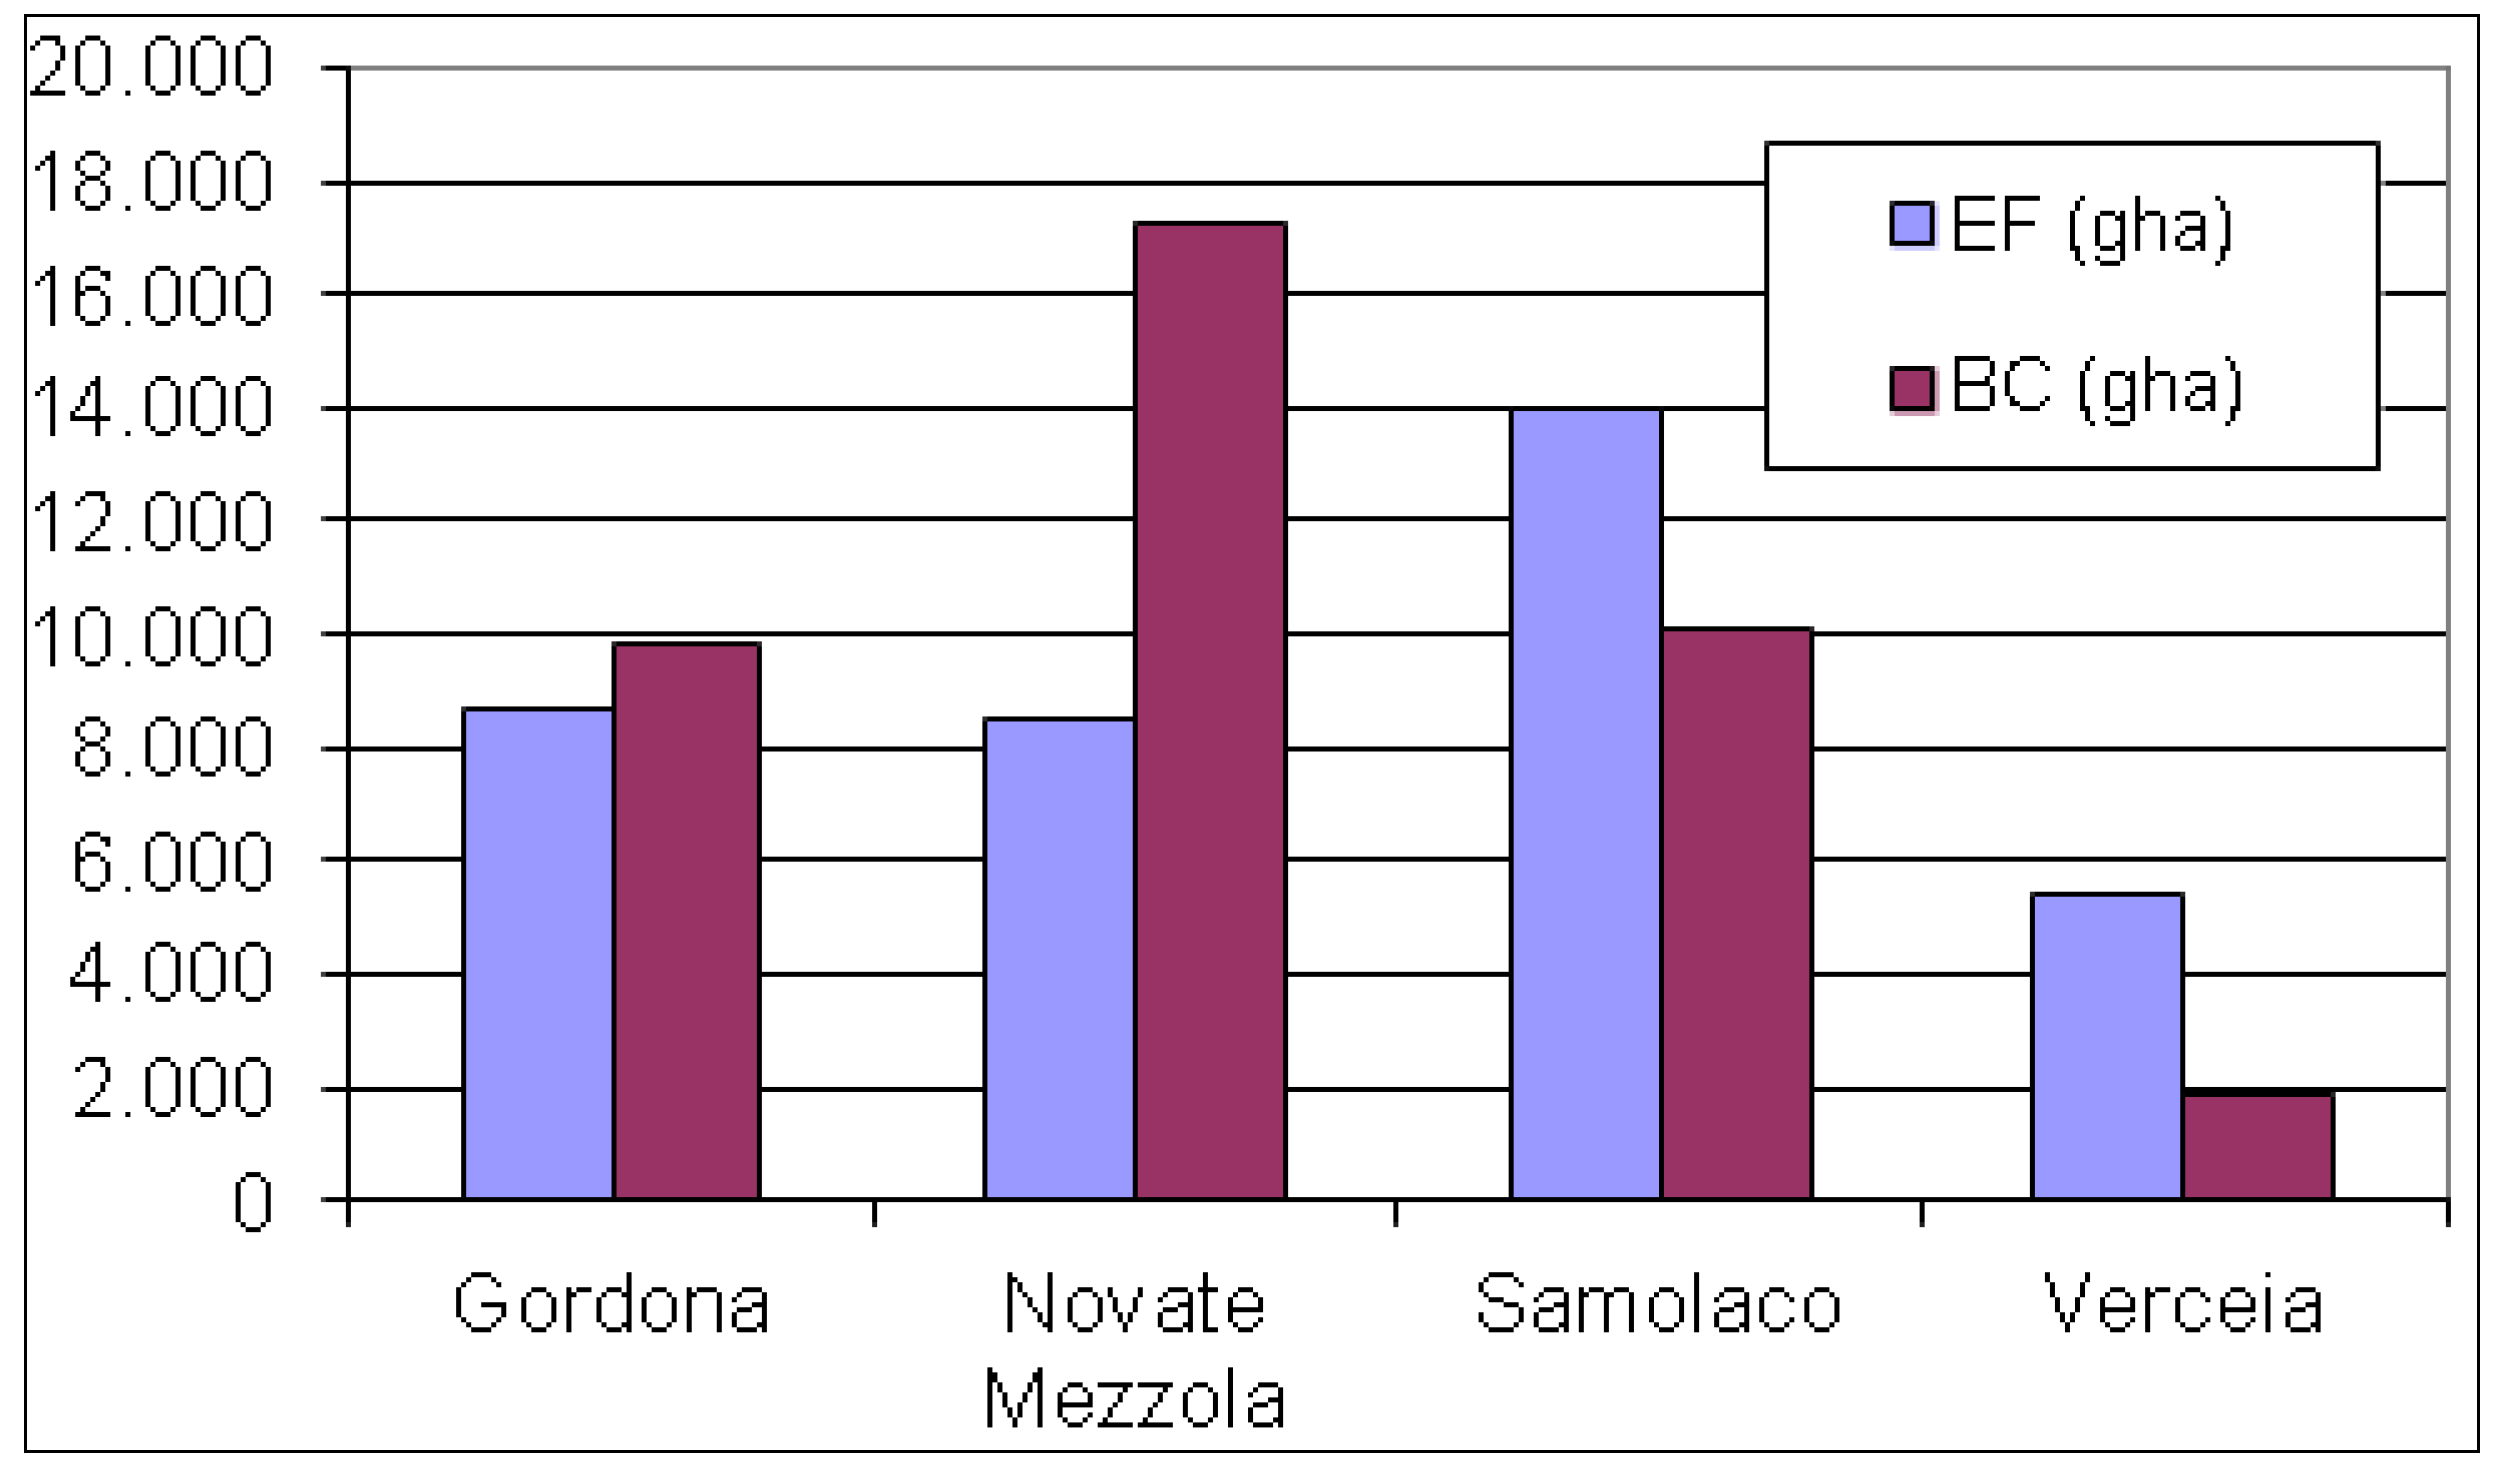
The biocapacity of the area of study is 39.090 gha, and it is higher than the real extent of the area (20.570 ha). This result reflects the distribution of land cover types in the area and the abundance of green areas (more productive) with respect to urban ones (unproductive). The detailed distribution of land cover, which represents the basis for BC calculation, is illustrated in
Figure 3, and the results of EF and BC for each municipality are illustrated in
Table 6.
Table 6.
EF and biocapacity (BC) of the four municipalities in the area of study.
Table 6.
EF and biocapacity (BC) of the four municipalities in the area of study.
| Municipality | EF per-capita | Residents | Total EF | BC (gha) |
|---|
| Gordona | 4.8 | 1,810 | 8,688 | 9,872 |
| Novate Mezzola | 4.9 | 1,732 | 8,487 | 17,222 |
| Samolaco | 4.8 | 2,913 | 13,982 | 10,132 |
| Verceia | 4.9 | 1,104 | 5,410 | 1,865 |
| Total | | | 36,567 | 39,090 |
Figure 3.
Comparison of EF and BC in the area of study (current condition, before the implementation of the urban master plans (UMPs)).
Figure 3.
Comparison of EF and BC in the area of study (current condition, before the implementation of the urban master plans (UMPs)).
EF from household consumption is 4.8 gha/person in Gordona and Samolaco and 4.9 gha/person in Novate Mezzola and Verceia. The result is in line with the average Italian EF (4.8 gha/person in 2008) and represents a high level of consumption that, if extended to the entire world, cannot be sustained by the Earth capacity. However, at the local scale, this result can be considered quite good, because almost in all municipalities, the EF does not overshoot the local BC (
Figure 3).
The most significant categories of consumption, which determine the total amount of EF, are “food” and “transport”. As a general indication for the planning, it can be said that EF from food consumption is mainly related to the transportation of food from foreign countries, i.e., it can be reduced, increasing the share of local products consumed; EF from transport is related to CO2 emission, so it can be reduced through sustainable mobility solutions alternative to the use of private cars by citizens.
As mentioned in
Section 2.3., it is not possible to forecast the exact variation in EF that should follow the implementation of the plans, because the UMPs will be followed by a detailed planning of single interventions. Nevertheless, it can be useful to make some considerations about the possible effects of the actions on the total EF of the area under investigation, based on the data available from the plans.
The main lines of intervention of the plans do not include actions that are supposed to cause significant variations in the EF: sustainability criteria preferring the use of existing buildings instead of building new ones to fulfil the need of new dwelling areas, the valorization of the natural and cultural heritage for tourism purposes and the conservation of agricultural areas should help to prevent the conversion from more productive lands (e.g., croplands) to less productive ones (e.g., built up lands).
However, there are some specific actions, which need to be further investigated to predict their effective contribution to EF; these issues are discussed in the following paragraph.
Firstly, the identification of possible new dwelling areas, even if it is planned in a way that tries to avoid urban sprawl and to limit the construction of new buildings, necessarily implies an increase in the number of people that live in the area, i.e., an increase of the total household consumption affecting all the categories of EF (food, energy, transportation, waste, etc.). The rise in population foreseen by the UMPs in the four municipalities (due to the expansion of residential areas) is 2,271 new inhabitants (+30%). Therefore, in case the new dwelling capacity is totally exploited, the total EF would increase by 11,014 gha, overshooting biocapacity by 8,491 gha.
Moreover, the construction of new buildings has a relevant impact on EF in terms of material and energy consumption (from about 6,000 gm
2 for a detached house to about 9,000 m
2 for a condominium; [
34]. It is not possible to predict the EF of new buildings, since it would require one to have detailed data about the main features of these buildings, such as total volume, type of construction materials and energy performance. Therefore, these are parameters that need to be carefully taken into account in the phase of the detailed planning of the new construction, in order to reduce the potential increase in EF.
The same concept applies to the actions regarding the expected increase in the number of tourists: it is important that, as mentioned in the plans, the actions are oriented to the promotion of guest accommodation structures, which help to prevent the construction of new buildings and can ensure a lower footprint during the use phase. Tourism represents an issue that has to be taken carefully into account, because the footprint from this kind of activity can be a relevant share of the total footprint existing in the area [
35,
36]; moreover, there can be a significant difference between the EF of a night spent in a B&B (about 60 gm
2 × person-1 × night-1) and in a three- or four-star hotel (about 140 gm
2 × person-1 × night-1) [
37].
Regarding the effects of the plans on the BC of the area, it is possible to quantify the variation on the basis of the detailed information about the area concerning the transformations foreseen by the UMPs. The variation in BC can be calculated multiplying the extent of the area concerned by the transformation for the correspondent equivalent factor. For instance, if there is agricultural land of 1 ha that will be transformed into built up land (e.g., in the case of the construction of a new residential district), the BC will be reduced from 2.21 gha to 0 gha.
In the area of study, there is only one municipality that will benefit from an increase in BC, due to the restoration of a former industrial area that will be transformed from built up land to meadows. All the other actions imply a reduction in BC due to the transformation from productive land to unproductive land, even if the variation is not significant if compared to the total BC of the area (reduction of 19 gha out of 39,000 gha). The details of the variation are illustrated in
Table 7.
Table 7.
Prediction of BC variation due to the actions of the plans.
Table 7.
Prediction of BC variation due to the actions of the plans.
| Municipality | Action (code) | Transformation | Area (ha) | BC Variation |
|---|
| Before | After |
|---|
| Gordona | M-AT1 | Pasture | Built up | 329 | ˗16.21 |
| Novate Mezzola | N-AT1a | Built up | Pasture | 38.5 | 1.88 |
| N-AT1b | Pasture | Built up | 1 | ˗0.49 |
| N-AT2 | Pasture | Built up | 0.79 | ˗0.38 |
| N-AT4 | Pasture | Built up | 0.80 | ˗0.39 |
| N-AT5 | Pasture | Built up | 0.53 | ˗0.25 |
| N-AT6 | Pasture | Built up | 0.42 | ˗0.20 |
| Samolaco | S-AT1 | Cropland | Built up | 0.85 | ˗1.87 |
| Verceia | V-AT1 | Pasture | Built up | 0.70 | ˗0.34 |
| V-AT2 | Pasture | Built up | 1.31 | ˗0.64 |
| V-AT3 | Pasture | Built up | 0.78 | ˗0.38 |
5. Discussion
The presented case study highlights that the use of sustainability indicators in the context of spatial planning may support the integration of consumption pattern evaluation within decision-making processes at the local scale. Although this is theoretically useful, it is important to evaluate the implications of applying such indicators.
The carbon balance and the ecological footprint are composite indicators developed for assessing the impact of local consumption patterns considering:
different drivers: energy consumption, transport, dwellings, etc.
different perspectives, e.g., energy consumption: in the case of the CO2 balance, energy consumption affects both the direct and the indirect emissions. Indeed, energy consumption for heating implies direct emission of CO2, whereas energy consumption for electricity may imply indirect emission related to where the energy production occurs; energy in the context of EF is considered mainly in order to assess carbon emission and the necessity of forest to absorb it.
Therefore, when applied at the local scale, as proposed in this paper, EF and carbon balance show a number of weaknesses and strengths to be taken into account both by decision makers and by SEA assessors (
Table 8).
Table 8.
Strengths and weaknesses of the methodology proposed.
Table 8.
Strengths and weaknesses of the methodology proposed.
| Weakness | Strengths |
|---|
| Availability of data at the local scale, with a temporal and spatial consistency. | Ability to capture drivers of impact that generally are not taken into account in local planning. In many cases, two thirds of the total amount of CO2 emission at the local scale are due to transport and domestic combustion (in Italy, the household and service sectors account for 34.4% of consumption, followed by the transportation and industrial sectors, at 34.2% and 29%, respectively; ISPRA, 2009). It is important to support local decision making, assessing the influence of citizen behavior with respect to overall emission. |
| Direct link with local policy at the level of the assessment. | Possibility of creating scenarios of sustainable production and consumption patterns. |
| Necessity to have a detailed description of each action in order to derive reliable input data for the calculation (or, at least, to develop possible scenarios). | Focus and link with land use, which is a central theme in urban planning. |
| The balance at the local scale, in some cases, is driven by factors that cannot be planned by local authorities (e.g., considering a municipality, the presence of a power plant that provides energy for a certain region affects the balance negatively; in this case, the regional strategic planning plays a role in smoothing the hot spots of emissions). | Indicators that are easily presented to decision makers and local stakeholders. Being based on a balance, those indicators allow a synthetic assessment of the performance of production and consumption patterns in a specific context. |
6. Conclusion
Researcher and practitioners highlighted the necessity to identify ways of making SEA more effective as a decision supporting tool, evolving from an EIA perspective, oriented to impact prediction, to a more comprehensive sustainability evaluation, which allows for the comparison of alternatives and that takes into account a wider range of issues.
In the case of urban master plans, especially when they refer to small areas without significant industrial activities or infrastructures, household lifestyles can play a relevant role in determining the environmental impacts of the local community, i.e., the effects of the actions included in the UMP. Nevertheless, a traditional set of environmental indicators is not sufficient to include these effects in the evaluation made through SEA. The implementation of sustainability indicators, in which the concept of limit (i.e., carrying capacity) is integrated, and considering the impacts from citizens’ lifestyle can help to overcome this shortcoming.
Generally, if the plans’ objects of SEA do not include significant infrastructure constructions or industrial activity establishment, the evaluation can appear as not useful and made only for legal compliance. Nevertheless, the absence of big actions does not entail, necessarily, the absence of any environmental impact, especially if considered in the long-term and, consequently, the impossibility for SEA to provide useful information for sustainability improvement to decision makers.
Therefore, it is important to include in the SEA process suitable tools for this purpose, able to consider a wider range of aspects, referring to the concept of quantitative and qualitative carrying capacity (as illustrated in the Introduction). Following this perspective, the methodology presented in the paper is composed by a set of environmental indicators, evaluated against sustainability thresholds, aimed at providing a detailed picture of the current and future state of the environmental compartments. In addition, the evaluation is performed also through composite indicators, EF and BC, and the carbon balance, aimed at providing a more comprehensive picture that considers, also, the effects of “non traditional” SEA issues (e.g., household lifestyles as drivers for consumption and related environmental impacts) and allows for the creation of scenarios based on direct and indirect effects of the actions of the plan.
As discussed in
Section 5, this approach presents some strengths, but also some weaknesses. The main features are the reference to the physical limits of the resources and the inclusion of both public and private stakeholders as responsible for consumption patterns and related impacts. Moreover, the methodology is deeply oriented to land use evaluation, which is a focal point in urban planning.
Finally, being based on a balance, those indicators allow us to a synthetic assessment of the performance of consumption patterns in a specific context (and to develop scenarios when only non-detailed information is available from the plan) and can be easily presented to policy makers and local stakeholders to support decision making.
The direction for SEA further development should aim at a shift from integrated assessment methodologies towards sustainability assessment methodologies able to assess the policy, but also the consumption patterns influencing the local environmental quality, to capture the different dimensions of the local carrying capacity, being quantitative, qualitative and operational, and, prospectively, introducing lifecycle thinking in methodological approaches to spatial planning.

