1. Introduction
Large regional differences in natural conditions in China and the rapid development of its economy since the inception of the opening-up policy have made the imbalances in population distribution and economic development more pronounced. As a result, the correspondence between population distribution and economic development has attracted increasing attention. Changes in population distribution are often caused by economic factors and there is a temporal lag between them. Although a deviation in population distribution and economic development is inevitable, it is best if the deviation can be contained within a reasonable range. If the deviation is outside this range and increases over time, it will lead to a series of issues in regional development, such as a loss of space efficiency, increased population pressure and a widening of the economic gap. Research on correspondence between population distribution and economic development can therefore aid in understanding of deviation in the establishment of related policies for coordinated regional development.
Due to the complexity of studying this correspondence, and in light of the need to coordinate the two systems simultaneously, most current research in China simply focuses on the relationship between population and economic development. The disciplines of demography, economics, and geography have long focused on this relationship, approaching it using different methods. Methods used by scholars to analyze the coupling characteristics of population and economy include a regional gravity center, a geographic concentration index, and an exploratory spatial data analysis (ESDA) [
1,
2,
3]. However, this research is primarily quantitative, and the proposed causes of the deviation between population distribution and economic development are weak. Additionally, these studies analyze just the deviation, not allowing for the possibility that the deviation could lead to population migration. The studies have also been primarily at a national-level or city-level scale [
1,
4], with some recent studies at the county (The administrative level of “county” is lower than “city” in China. A city may have several counties and those counties are under the administrative jurisdiction of the city. Administrative rankings in China from high to low are as follows: province, prefecture city (whose name is omitted in this paper), county (or county-level city) and village.) level [
2,
3,
5]. Provinces or prefecture cities are large in China, and regional differences are great within them, both of which affect the accuracy of the study results. For these reasons, we analyze the data at the county level to provide more details regarding regional internal changes.
The economic gap is an important reason people migrate, and the speed of this population migration affects the value of the CPE. Since the mid-1980s, China’s economic growth has been driven primarily by rapid industrialization and urbanization, especially in coastal regions. Currently, rapid structural change, wherein laborers leave the agriculture sector for higher returns in non-agricultural sectors is commonplace in China [
6]. In 2012, there were 236 million migrants in China, accounting for 17% of the total population. The proportion of China’s population living in cities has risen steadily since the 1970s [
7].
The literature on population migration has focused on this phenomenon and on the reasons for the migration [
8,
9], and has considered special factors affecting migration such as networks [
10], social demands and environmental change [
11] and natural disasters [
12]. Some studies have looked at the migration of particular groups such as young adults [
13], women [
14], and mixed-ethnic unions [
15]. With an increase of return migration, the studies have attracted attention [
16,
17,
18,
19]. Other studies have focused on return migration and the effects of migrants’ remittances on their hometowns [
6,
20,
21]. However, research scales have been mainly at the province level [
9,
22,
23]. Migration studies are mainly concerned with large cities in eastern China [
24]. Relatively few studies on migration in China have examined migration between counties, especially poor areas where out-migration has been the major migration form. In this paper, we examine inter-county migration and analyze its driving forces. We then analyze the relationship between CPE and migration.
We chose Sichuan province—a highly heterogeneous mega-region—as a case study. It is the largest province in western China in terms of GDP and permanent residents, but it is low in per capita GDP, ranking 25th in China. There were 13.6 million people in poverty in the province in 2010, the second highest in China. The province is the second largest in terms of number of migrants, only surpassed by Anhui province. The terrain is complex. The province is dominated by plateaus and mountains (76% of the total area), with a smaller proportion of plains and hills (24% of the total area), similar to China as a whole. Due to differences in natural conditions, regional development is unbalanced. This has led to large differences in population distribution and economic development.
This paper is organized into five sections, with this introduction serving as the first section. The second section describes the study area and explains our methodology. In the third section, we present our results on spatial correspondence between population distribution and economic development, as well as the regression equation of net-migrants (net-migrants = in-migrants−out-migrants). Conclusions and a discussion are presented in the fourth and fifth sections.
2. Methodology
2.1. Study Area
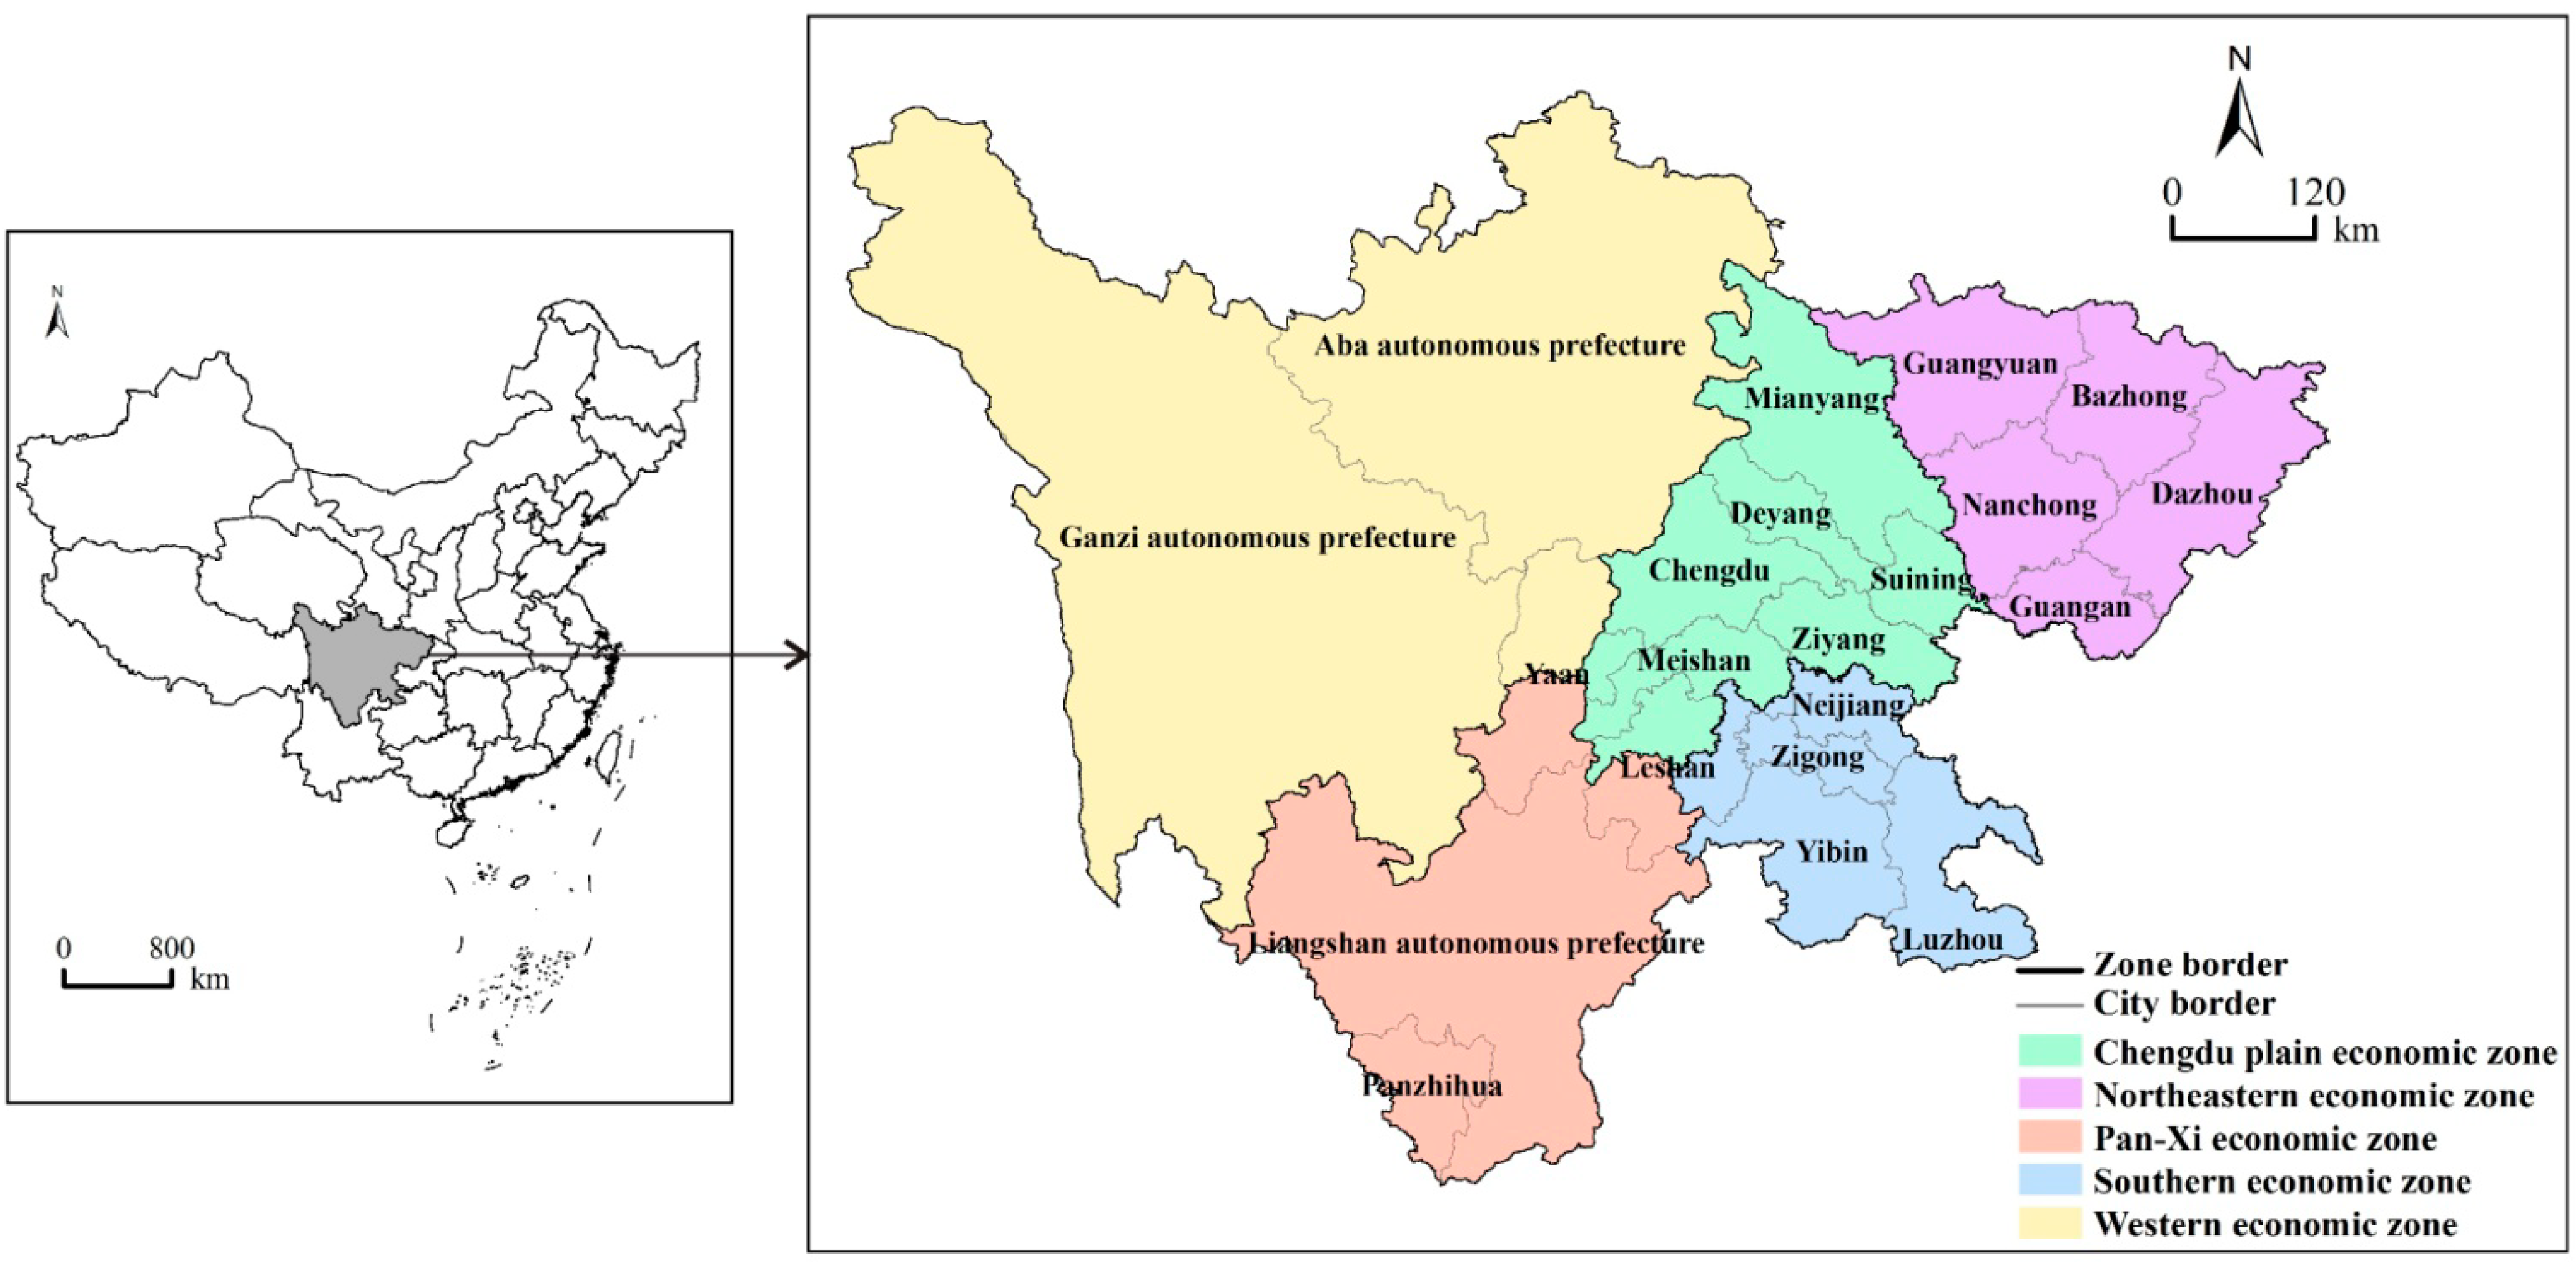
Sichuan is an important traffic hub connecting southwestern and northwestern China. The fourth largest province in terms of population in China, the province had 81 million permanent residents in 2012, which accounted for 6% of China’s total population. There are 155 county-level study-units (18 cities (These “cities” are composed of the districts under their administrative jurisdiction. For example, “Chengdu” refers to a prefecture city that controls 10 districts, six counties and four county-level cities, whereas “Chengdu city” only includes the 10 districts.), 14 county-level cities (“County-level city” is, in essence, a county although it is named “city” in Chinese.), 119 counties, and 4 autonomous counties).
The areas at the county level can be classified according to landform type into 15 counties located on the Chengdu plain, 47 hilly counties, 24 mountainous counties and 51 ethnic minority counties (mainly on the plateau). Owing to the variety in its landscape, population distribution and economic development are highly unequal within the province. In the “12th five-year” Development Plan for Towns, Sichuan was divided into five economic zones by the development and reform commission: the Chengdu plain, the Northeastern, the Southern, the Pan-Xi and the Western economic zones (
Figure 1). The population and economic data for the five zones are shown in
Table 1.
Sichuan has 17 million migrants, of whom 2 million are in-migrants and 15 million are out-migrants, and the migration population has been on the rise in recent years. Most in-migrants come from Sichuan itself, accounting for 85% of the in-migrants and indicating that the county’s economic development and urbanization derives from the local population. Most out-migrants have moved out of Sichuan, which accounts for 79% of the out-migrants. The out-migrants are mostly concentrated in eastern China, which accounts for 72% of the out-migrants. The out-migrants are concentrated in the Yangtze River Delta and the Pearl River Delta specifically, areas that account for 33% and 27% of the out-migrants.
Figure 1.
Location map and five economic zones of Sichuan province.
Figure 1.
Location map and five economic zones of Sichuan province.
Table 1.
The five economic zones of Sichuan province (2012).
Table 1.
The five economic zones of Sichuan province (2012).
| Economic Zone | Area (sq.km) | Permanent Residents (10,000 Persons) | GDP (100 Million Yuan) | Population Density (People per sq.km) | Per Capita GDP (Yuan) |
|---|
| Chengdu plain economic zone | 64,881 | 3421.05 | 13,193.79 | 527 | 38,566 |
| Northeastern economic zone | 64,027 | 2084.73 | 3928.59 | 326 | 18,845 |
| Southern economic zone | 38,874 | 1607.92 | 4354.29 | 414 | 27,080 |
| Pan-Xi economic zone | 82,066 | 671.22 | 2069.64 | 82 | 30,834 |
| Western economic zone | 233,403 | 233.38 | 455.43 | 10 | 19,515 |
Regarding migration within the province, inter-city migrants account for 62% while inter-county migrants account for 21%, indicating that central cities attract more migrants. There are more out-migrants within the province than in-migrants in most of the cities, with the exception of Chengdu, Panzhihua, Aba autonomous prefecture and Ganzi autonomous prefecture. Fifty-one percent of in-migrants are concentrated in Chengdu, where economic well-being is high. Chengdu is preferred by most migrants, attracting 36% of in-migrants from other provinces and 54% from other prefecture cities in Sichuan.
2.2. Data
We selected population and economic data at the county level in 2005 and 2012 from the China Statistical Yearbook (2006–2013), the Sichuan Statistical Yearbook (2006–2013) and the Statistical Yearbook for each city in Sichuan (2013).
In China, there are two types of population statistics: permanent residents and household population. They are both taken from the annual reports of the Bureau of Public Security. While “permanent resident” refers to people who stay in the administrative region for six months or longer, “household population” includes people who have household registration (hukou) in the administrative region. In 2012, 10 million people in Sichuan were working and living in other provinces, but count in the census of its household population. Because of its statistical consistency, we use permanent residents rather than household population as the primary population indicator to calculate the distribution of the population in the province.
2.3. Methodology
2.3.1. Correspondence of Population and Economy
Of existing methods for determining the correspondence between population distribution and economic development, the regional gravity center method can reflect the overall change, but it is unable to reflect specific changes for each county. A method that calculates and expresses the concentration of population and of economic activity indexes in different figures can reflect the population distribution and economic development separately, but it also cannot reveal the correspondence of population and economy for each county. Feng (2013) proposes an—the Correspondence of Population and Economy (CPE) [
5]—which is a combination of the two geographic concentrations (concentration of population divided by concentration of economic activity), and which is able to reflect relative concentrations of population and economic performance of a region simply and intuitively. We therefore chose Feng’s CPE index for our analysis.
CPE refers to the ratio of population to GDP for a certain administrative region, which in turn reflects the degree of correspondence of the population distribution and economic development in this region. The CPE formula is expressed as follows:
where
n is the number of spatial units;
pi is the level of concentration of population in a spatial unit
i;
gi is the level of concentration of economic activity in a spatial unit
i, which represents GDP;
Pi is the population in a spatial unit
i;
Gi is the GDP in a spatial unit
i.
If CPE > 1, the concentration of population is higher than the concentration of economic activity. If CPE < 1, the concentration of population is lower. When CPE is closer to 1, the correspondence of population and economy is better, suggesting better coordination between a population and an economy. The further away CPE is from 1, the lower the balance of population and economy. The advantage of CPE as a measurement is that it can reflect the correspondence (CPE closest to 1) or deviation (CPE deviates from 1) of population distribution and economic development intuitively, providing guidance for regional development that better accounts for different situations and regions.
The value of CPE can be classified into three groups, and then divided into five categories [
5]. The specific classification standards are shown in
Table 2.
Table 2.
Evaluation criteria of Correspondence of Population and Economy (CPE).
Table 2.
Evaluation criteria of Correspondence of Population and Economy (CPE).
| Group | Category | CPE |
|---|
| concentration of population lower than concentration of economic activity | CP far below CE | CPE ≤ 0.50 |
| CP slightly below CE | 0.50 < CPE < 0.80 |
| concentrations of population and economy in relative balance | balance | 0.80 ≤ CPE ≤ 1.20 |
| concentration of population higher than concentration of economic activity | CP slightly above CE | 1.20 < CPE < 2.0 |
| CP far above CE | CPE ≥ 2.0 |
2.3.2. Linear Regression Analysis
In a field study from July to August 2013, we investigated population distribution and economic and social conditions for all 21 prefecture cities in Sichuan. In-depth interviews of residents revealed that migration was primarily driven by economic disparity and education, and the economic gap between out-migration and in-migration by region had more influence. This paper chooses a series of indexes for economy, population and employment, and uses a linear regression model to examine the factors contributing to migration from a macroscopic point of view.
We choose net-migrants (NM) as the dependent variable. Independent variables are classified into three categories (
Table 3): (1) Economic factors. These include the output value of primary industry (OVPI), the output value of secondary industry (OVSI) and the output value of tertiary industry (OVTI), per capita GDP (PCGDP), per capita local public financial revenue (PCLPFR), total investment (TI), average wages (AW), and per capita retail sales of consumer goods (PCRSCG). These six variables reflect the economic development level of the province. The last two variables mainly reflect the income and consumption level of residents; (2) Population and employment factors. These contain the proportion of agricultural population (PAP), rural employed persons (REP), secondary industry employment (SIE), and tertiary industry employment (TIE). We choose these variables because the agricultural population is currently an important source of migration in China and employment in different industries reflects the employment structure in different regions; (3) Infrastructure and public services factors. These contain total number of hospitals (HOSP), student-teacher ratio (S-T Ratio), and length of highways (LH). These variables are chosen because good infrastructure and public services are the pull force of migration.
There is a temporally lagged relationship between the independent variables and net-migration. In the study period, however, there is a stable trend of population migration in Sichuan, with migration occurring primarily out to the southeast coastal areas of China. The spatial pattern of economic development forms and rarely changes. The inequality of infrastructure and public services scarcely changed, and neither did net-migration in 2012, which already includes most of the early migration, reflecting the high rate of migrants who work out of Sichuan each year. The effect of the temporally lagged relationship between the independent variables and net-migration is relatively weak, as are all of the independent and dependent variables in 2012.
Table 3.
The indicator system of factors influencing net-migration.
Table 3.
The indicator system of factors influencing net-migration.
| Category | Independent Variable | Mean | Std. Deviation |
|---|
| economic factors | OVPI (10,000 yuan) | 20.86 | 17.45 |
| OVSI (10,000 yuan) | 82.37 | 168.61 |
| OVTI (10,000 yuan) | 53.36 | 234.53 |
| PCGDP (yuan) | 21,134.58 | 10,371.64 |
| PCLPFR (yuan) | 1293.87 | 964.77 |
| TI (10,000 yuan) | 112.05 | 255.10 |
| AW (yuan) | 40,406.74 | 6619.04 |
| PCRSCG (yuan) | 7612.82 | 4491.36 |
| population and employment factors | PAP (%) | 0.77 | 0.13 |
| REP (10,000 persons) | 25.71 | 20.97 |
| SIE (10,000 persons) | 8.42 | 13.42 |
| TIE (10,000 persons) | 11.45 | 20.49 |
| infrastructure and public services factors | Hosp (unit) | 44.50 | 74.29 |
| S-T Ratio | 16.54 | 3.94 |
| LH (km) | 1895.86 | 1077.65 |
3. Results
3.1. Characteristics of Population Distribution
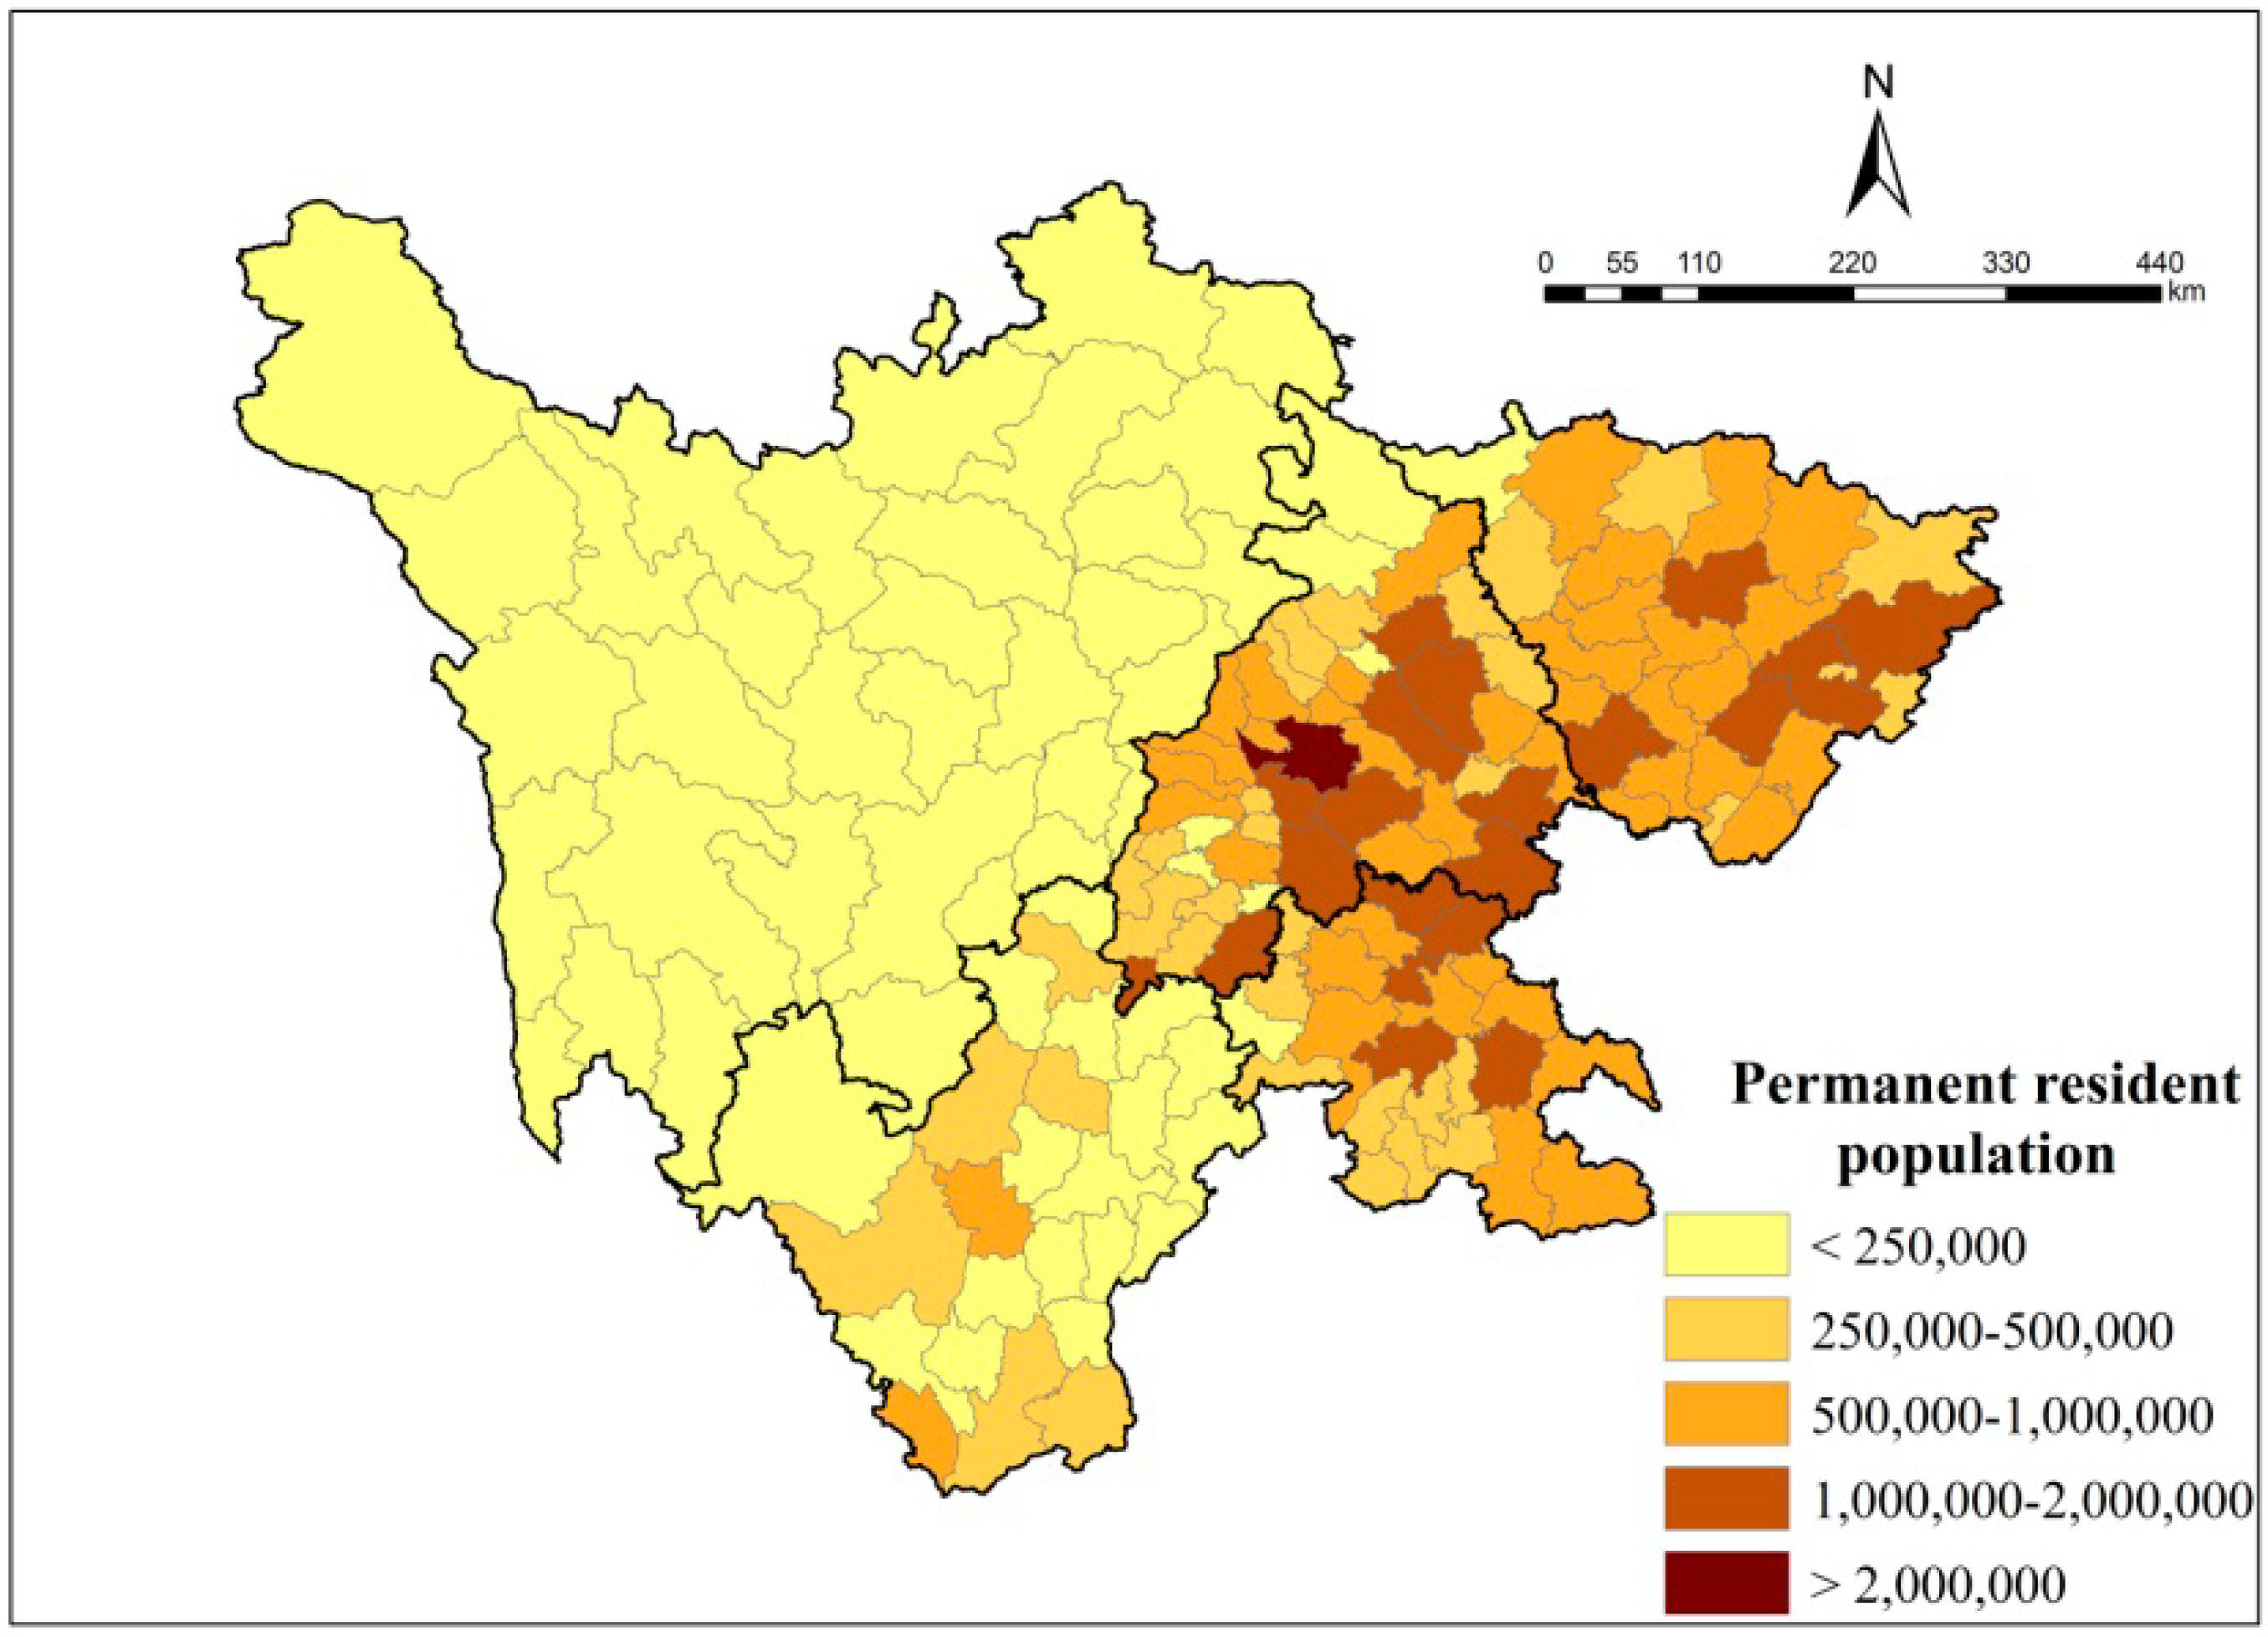
Permanent residents are unevenly distributed in Sichuan. The county with the largest population has 46 times more residents than the county with the lowest population.
The current spatial distribution of population (
Figure 2) shows that the population is largely located in eastern of Sichuan. Within the five economic zones, the population is mainly concentrated in the Chengdu plain, and in the northeastern and southern economic zones, which are mostly covered by hills and plains and have good natural conditions. The zones with the lowest population are the western and Pan-Xi economic zones, which are covered by plateaus and mountains and made up of ethnic minorities.
Population density is approximately 163 persons per square kilometer in Sichuan. In general, the distribution of population density is similar to the distribution of population. The Chengdu plain, northeastern and southern economic zones are 3, 2 and 2.5 times higher than the mean value, respectively. The Pan-Xi and western economic zones are just 49% and 6% of the mean value of population density, respectively.
Sichuan exports the second-largest amount of labor in China; consequently, the number of permanent residents declined from 82.1 million in 2005 to 80.8 million in 2012. The post-quake recovery and reconstruction in 2009, however, led to an increase in the resident population of 0.5 million over the previous year. In addition, after 2010, following rapid economic development, an increasing number of migrant workers returned to the province.
Figure 2.
Population distribution map for Sichuan province (2012).
Figure 2.
Population distribution map for Sichuan province (2012).
The annual growth rates of permanent residents in the province vary dramatically across counties (
Figure 3). The counties with more rapid population growth are mainly concentrated in the western economic zone, in Chengdu city and in a few other regional core cities. Counties in the western economic zone have the highest annual growth rate of permanent residents because of a preferential policy in terms of child bearing for ethnic minorities, with the exception of some counties that are susceptible to the influence of geological disasters. The regional core cities significantly influence the concentration of population because of their solid economic foundation, quality infrastructure, and availability of public services.
Figure 3.
Permanent resident population growth rates per annum in Sichuan province (2005–2012).
Figure 3.
Permanent resident population growth rates per annum in Sichuan province (2005–2012).
The areas with decreasing populations are found mostly in the eastern part of the Chengdu plain economic zone and the northeastern and southern economic zones. People in the counties bordering Chengdu city and Chongqing city (Chongqing city is on the east of Sichuan.) are largely attracted to these cities, and the rural population has increasingly moved to the surrounding cities, which explains the decreased migration trend in these counties. Only some of the counties along the traffic lines in the northeastern and southern economic zones have experienced growth in population. That is to say, traffic is an important factor that influences changes in population.
Though the annual growth rates of permanent resident population are highly unequal within Sichuan, the annual growth rates of the non-agricultural population are positive in the five economic zones from 2005 to 2012. The annual growth rates of permanent residents are either slow or negative in the Chengdu plain, northeastern and southern economic zones, but the annual growth rates of the non-agricultural population are 3.7%, 3.2% and 2.4%, respectively. This indicates that the highest outflow of population is among the agricultural population, which moved to the cities or other provinces, representing a major contributing factor to the population decline in these three economic zones. In addition, we find that the cities in these zones have remained attractive, and most migration occurs to a higher or equivalent level administrative division within Sichuan.
3.2. Characteristics of Economic Development
Table 1 shows that the western economic zone accounts for nearly half (48%) of the area, while 55% of GDP in Sichuan is concentrated in the Chengdu plain economic zone, and there are large differences between internal regions. The county with the highest GDP has a GDP that is 167 times greater than the lowest.
From the perspective of the spatial distribution of GDP (
Figure 4), higher GDP areas are mainly concentrated in the hilly and plain counties in eastern Sichuan, which is similar to the distribution of population (
Figure 2) and population density. The minority counties in the western and Pan-Xi economic zones and mountainous counties in the northeastern and southern economic zones have weaker GDP.
Per capita GDP is highest in the Chengdu plain economic zone, which is twice that of the zone with the lowest GDP. The northeastern economic zone has a large population, but is low in GDP, which makes its per capita GDP the smallest. Though the Pan-Xi economic zone accounted for just 9% of GDP in Sichuan, it is high in per capita GDP because of its small population and developed vanadium, titanium and steel industries. The southern economic zone is in the middle range of per capita GDP, relying on traditional industry. The western economic zone is weak both in GDP and in per capita GDP. Higher per capita GDP counties are mainly concentrated in the Chengdu plain and southern economic zones, the Pan-Xi economic zone along Anning valley, and east of the western economic zone; these counties either have a well-developed economy or have an abundance natural resources.
GDP growth is largest in Chengdu city, and increases by 333.5 billion yuan in the period 2005–2012. GDP growth is primarily concentrated in the Chengdu plain economic zone, the northern part of the southern economic zone and the southern part of the northeastern economic zone (
Figure 5a).
Figure 2,
Figure 4 and
Figure 5a show the similarity of the distribution of population and GDP. Looking at the growth rate (
Figure 5b), however, the southern, Pan-Xi and northern economic zones can be seen to have grown rapidly, and their GDP grows by more than three times in the period 2005–2012. GDP growth is slow in the minority counties of the northwestern part of Sichuan. The Chengdu plain economic zone has a moderate GDP growth rate because its original GDP is very high, and it is still the largest economic zone in terms of GDP.
Figure 4.
GDP distribution map in Sichuan province (2012).
Figure 4.
GDP distribution map in Sichuan province (2012).
Figure 5.
GDP growth (a) and GDP growth rates per annum (b) in 2005–2012.
Figure 5.
GDP growth (a) and GDP growth rates per annum (b) in 2005–2012.
3.3. Spatial Correspondence between Population Distribution and Economic Development
Using the population and economic data for 2005 and 2012, we calculate CPE in Sichuan. Based on the evaluation criteria in
Table 2, the results are shown in
Table 4 and
Table 5.
Table 4.
Correspondence of population and economy in Sichuan province (2005).
Table 4.
Correspondence of population and economy in Sichuan province (2005).
| Category | County | Permanent Residents | GDP |
|---|
| Number | Proportion | 10,000 Persons | Proportion | 100 Million Yuan | Proportion |
|---|
| CP far below CE | 8 | 5.16% | 984.45 | 12.31% | 2370.55 | 31.97% |
| CP slightly below CE | 15 | 9.68% | 884.36 | 11.05% | 1219.61 | 16.45% |
| balance | 30 | 19.35% | 1180.95 | 14.76% | 1128.25 | 15.22% |
| CP slightly above CE | 59 | 38.06% | 3567.97 | 44.60% | 2151.08 | 29.01% |
| CP far above CE | 43 | 27.74% | 1382.19 | 17.28% | 545.81 | 7.36% |
Table 5.
Correspondence of population and economy in Sichuan province (2012).
Table 5.
Correspondence of population and economy in Sichuan province (2012).
| Category | County | Permanent Residents | GDP |
|---|
| Number | Proportion | 10,000 Persons | Proportion | 100 Million Yuan | Proportion |
|---|
| CP far below CE | 97 | 62.58% | 6059.45 | 75.57% | 21162.15 | 88.17% |
| CP slightly below CE | 43 | 27.74% | 1659.98 | 20.70% | 2536.78 | 10.57% |
| balance | 12 | 7.74% | 276.27 | 3.45% | 286.96 | 1.20% |
| CP slightly above CE | 3 | 1.94% | 22.61 | 0.28% | 15.84 | 0.07% |
| CP far above CE | - | - | - | - | - | - |
There were only 30 counties in Sichuan that were balanced in population distribution and economic development in 2005 (
Table 4), while 125 counties were unbalanced. Among these, 102 counties had a higher concentration of population than concentration of economic activity. This indicated that Sichuan had a weak balance in population distribution and economic development, and had a greater concentration of population than concentration of economic activity.
Table 5 shows that only 12 counties are balanced in population distribution and economic development in 2012. There are 143 counties with unbalanced population distribution and economic development, 18 counties more than in 2005. One hundred forty counties had a lower population concentration than concentration of economic activity. Compared with 2005, the changes are dramatic. The areas with concentration of population higher than concentration of economic activity decreased, and no area has a concentration of population significantly higher than the concentration of economic activity. This indicates that concentration of population is lower than concentration of economic activity in Sichuan, that is, regional concentration of economic activity rises faster than the concentration of population.
According to the spatial distribution of CPE in 2005 (
Figure 6a), areas with balanced concentrations of population and economy are mainly concentrated in the central part of Sichuan, primarily along the junction of the Chengdu plain and the western economic zone and the Anning river valley in the Pan-Xi economic zone. Areas with concentrations of population that are lower than the concentration of economic activity are also mainly concentrated in central Sichuan; areas with concentrations of population that are higher than concentrations of economic activity are mainly concentrated in east and west Sichuan.
In 2012 (
Figure 6b), the areas where concentrations of population and economy are balanced are mainly concentrated in western Sichuan, where the populations are primarily ethnic minorities. The concentration of population is mostly lower than the concentration of economic activity in Sichuan and is only higher than the concentration of economic activity in the three counties in the western portion of the western economic zone.
Comparing CPE values for 2012 and 2005, the more recent values are lower and all are dropping to varying degrees, indicating that the growth rate of the concentration of population is slower than the growth rate of the concentration of economic activity in Sichuan. The areas where the concentration of population is lower than the concentration of economic activity trend toward outward expansion from Chengdu city.
Figure 6.
The distribution of correspondence of population and economy in (a) 2005 and (b) 2012 in Sichuan province.
Figure 6.
The distribution of correspondence of population and economy in (a) 2005 and (b) 2012 in Sichuan province.
3.4. Characteristics of Population Migration
Population migration data are shown in
Table 6. Four economic zones have negative net-migrants. Although the Pan-Xi economic zone has positive net-migrants, in-migrants in this economic zone are concentrated in its two regional central cities. Excluding these two cities, average net-migrants for the remaining counties is −6990.
Table 6.
Migrants of the five economic zones in Sichuan province (2012) (10,000 persons).
Table 6.
Migrants of the five economic zones in Sichuan province (2012) (10,000 persons).
| Economic Zone | In-Migrants | Out-Migrants | Net-Migrants |
|---|
| Chengdu plain economic zone | 131.04 | 468.11 | −337.07 |
| Northeastern economic zone | 10.76 | 524.83 | −514.07 |
| Southern economic zone | 23.14 | 389.09 | −365.96 |
| Pan-Xi economic zone | 25.11 | 24.36 | 0.75 |
| Western economic zone | 5.18 | 6.14 | −0.96 |
Only 36 counties, which are concentrated in the Chengdu plain, Pan-Xi and western economic zones, have positive net-migrants in Sichuan, among which 26 are in the western economic zone. In these 36 counties, however, the Chengdu plain and Pan-Xi economic zones have average rates of net-migration that are much higher than in the western economic zone. Chengdu city, Panzhihua city and Xichang city, for example, have much higher rates than the other counties.
The average number of net-migrants for the remaining 118 counties is −111,897; 52 counties have fewer than −100,000. In the 118 counties, the northeastern economic zone has the fewest net-migrants, followed by the southern, Chengdu plain, western and Pan-Xi economic zones. Thousands of people migrate from their residences to live in these counties.
Figure 7 shows that in-migration regions are mostly concentrated in five cities and in the two counties around Chengdu city. The out-migrants and net-migrants are distributed in a “C” shape; from east to west out-migrants declined while net-migrants increased. This means that the northeastern, southern, and Chengdu plain economic zones have a large number of out-migrants leading to a decline in permanent residents. However, either central cities or the two important counties around Chengdu city have positive net-migrants. The strong association of out-migrants and net-migrants suggests that a strong positive correlation exists between in- and out-migration within economically buoyant areas.
Figure 7.
The distribution of (a) in-migrants; (b) out-migrants and (c) net-migrants in Sichuan province (2012).
Figure 7.
The distribution of (a) in-migrants; (b) out-migrants and (c) net-migrants in Sichuan province (2012).
Comparing
Figure 6 and
Figure 7, we can see that the CPE declined in most areas of Sichuan, especially in the eastern part, where there are a large number of out-migrants. This large number combined with the growth of GDP (
Figure 5) causes the decrease of
pi and increase of
gi, leading to the decline of CPE. In other words, in addition to economic development, the high rate of out-migration is an important reason leading to the decrease in the CPE.
3.5. Results of Multiple Linear Regression Analysis
With the aid of a multiple linear regression analysis, we choose the independent variables by using stepwise regression. The results are shown in
Table 7.
The regression equation is as follows:
From the equation, net-migrants decrease with an increase in rural employment persons, with an elasticity of −0.4868. Total investment, average wages, output value of tertiary industry, and per capita local public financial revenue have positive relationships with net-migrants, with an elasticity of 0.0117, 0.0002, 0.0280 and 0.0014, respectively.
Table 7.
Linear regression results of effect indicators of net-migration.
Table 7.
Linear regression results of effect indicators of net-migration.
| Independent Variable | B |
|---|
| constant | −6.1591 *** |
| Rural Employed Persons (REP) | −0.4868 *** |
| Total Investment (TI) | 0.0117 * |
| Average Wages (AW) | 0.0002 *** |
| Output Value of Tertiary Industry (OVTI) | 0.0280 *** |
| Per Capita Local Public Financial Revenue (PCLPFR) | 0.0014 *** |
| R square | 0.911 |
| Adjusted R square | 0.908 |
| F-value | 299.935 |
4. Discussion
4.1. Explanation of the Changes in CPE
The results show that the CPE was imbalanced in 2005, with population levels higher than economic activity throughout much of Sichuan, except in the economic hot spots of the Chengdu plain economic zone and the southern industrial area. By 2012, however, this situation was substantially inverted, with a much closer fit between population and economic activity across the province. The changes in CPE are the result of population and economic development.
Because of natural conditions, available resources, traffic, and economic factors, people are more concentrated in the east than in the west of Sichuan. There is some movement out of eastern Sichuan, which causes a decline in permanent residents, but compared to the total population, it is tiny. In western Sichuan, although its population growth rate is high, the population total is low. The population gap between eastern and western Sichuan is still large. For these reasons, population distribution does not change greatly during the study period.
Eastern Sichuan has higher GDP and GDP growth than western Sichuan, so it would be expected to have increasing economic polarization. The region has developed rapidly because it has a good economic foundation and convenient transportation. Western Sichuan, in contrast, has a relatively poor original economic foundation and inconvenient transportation, as well as vulnerable ecological conditions in the plateau; all of these limit its economic development.
Economic polarization combined with little change in population distribution caused gi to grow faster than pi in most areas of Sichuan, which is ultimately reflected in a reduced CPE that decreased over the period 2005–2012.
4.2. Explanation of Regression Equation
Of the five independent variables in the regression equation, four are economic factors. This indicates that net-migration on an inter-county level in Sichuan is mainly driven by the economy and the employment structure. According to our analysis of data from the Fifth and Six censuses, migration to work for business rose from 20% to 36%. This surplus labor was transferred from village to town causing the drop in the agricultural population.
The rural employed persons index is negatively associated with net-migration, while the four economic indexes have positive influences. We assume an increase in rural employed persons, but according to the statistical yearbook, we find that rural employed persons engaging in agriculture have experienced a decreasing trend since 1991. This indicates a transfer of the rural population to other regions or to other non-agriculture trades, or that out-migration is growing and net-migration is decreasing. More total investment can promote stronger economic development; a higher average wage attracts more labor; a higher output value of tertiary industrial products means better economic development, better living conditions and greater employment opportunities; and greater per capita local public financial revenue shows that the government has more money and can play a greater role in social and economic development. All these economic factors benefit regional economic development and attract populations.
Infrastructure and public service factors have not been included in our equation. Chinese highly value the education of their children, and they do migrate to better education conditions. However, this type of migration usually happens at a local level within the county. In other words, people in search of better educational opportunities migrate from their village to a higher administrative division within their own county; they rarely migrate to other counties, and this type of migration was not calculated in our data. Education as a factor thus has little effect on the net-migration analyzed for this paper, and the same is true for the medical care factor. Traffic influences migration in two different ways. On the one hand, convenient traffic conditions allow for the use of infrastructure and public services or provide the ability to find jobs nearby without migration. On the other hand, convenient traffic conditions can lower the cost of migration. Specifically in a region with relatively good economic conditions, convenient transportation promotes regional economic development and fewer people migrate out, while less-convenient transportation limits regional economic development and leads people to migrate out to find jobs. In areas with poor economics, convenient and low-cost traffic conditions increase migration, while less convenient traffic conditions reduce migration due to the high cost of migration. These effects cancel each other out, rendering traffic insignificant to the analysis; therefore traffic was not included in the regression equation.
4.3. Relationship between CPE and Regression Equation
CPE has a weak and insignificant negative correlation with net-migration. When CPE is lower, meaning that the concentration of economic activity is rising more quickly than is the concentration of population, net-migration is greater. Conversely, when CPE is higher, net-migration is smaller. In fact, CPE decreased from 2005 to 2012 in all counties in Sichuan, especially in eastern Sichuan. This suggests that gi is faster than pi. In eastern Sichuan, CPE decreased and the value was less than 1, indicating that with continuous economic development, this region has become increasingly vigorous and more attractive, which will lead to an eventual increase in net-migrants. However, net-migration in the counties of eastern Sichuan, especially in counties with relatively poor economic performance or located on the border between Chengdu city and Chongqing city, is currently reduced. This is explained by the large economic gaps between these counties and the core cities; the negative influence of their geographic position attracts people to those core cities, reducing the net-migrants to these counties. A few counties in the western economic zone are exceptions, where CPE and net-migrants have a positive correlation, and which are affected more by their high natural population growth rate than by migrants. Therefore, CPE and net-migrants have a weak negative correlation that is not significant in the regression equation.
4.4. Comparison to Other Results
CPE was reduced in areas with better economic performance, which indicates that in this area the concentration of economic activity is higher than the concentration of population, so the pattern is similar to that at the national level. Therefore, population policies should be adopted in eastern Sichuan to reduce the outflow of population and absorb the people work within the province. Western Sichuan cannot develop industry on a large scale because of its vulnerable ecological condition; however, we can exploit tourism resources and develop agriculture to speed up regional economic development.
In research at the city level, Sichuan follows a pattern in which the concentration of economic activity lags behind concentration of population, a pattern unchanged from 1990 to 2010 [
4]. We find, however, that CPE shows inequality in Sichuan and that it has changed significantly from 2005 to 2012. Research at the county level can thus reveal a greater level of details regarding internal changes.
Research on migration has shown that populations are mainly moving into eastern China [
23,
25], where the terrain and economic development are better than in the source locations [
6]. However, the main out-migration location in our research is in the east of Sichuan, where development conditions are also good.
Population density in eastern Sichuan is high. A high volume of people living in a small land area creates conflict. Eastern Sichuan has a relatively higher level of economic wellbeing, but from a national perspective, there are still some economic gaps between Sichuan and eastern China. People migrate easily to improve their economic status. Coupled with relatively convenient transportation and a migration cost that is low compared to western Sichuan, people are more likely to move out of eastern Sichuan. Therefore, Sichuan in western China is a source of out-migration in eastern China.
Western Sichuan, which mainly consists of ethnic minority counties, has a lower population and low population density. Traffic is inconvenient, increasing the cost of migration. Due to their underdeveloped economy, the state and provincial government have provided many subsidies to the region and its population. In addition, the culture of ethnic minorities does not encourage migration. For example, people in the plateau do not adapt to life in the plain area because their nomadic life is different from a farming life. The emotional attachment to their hometown also reduces enthusiasm for migration.
5. Conclusions
Though population and economic development have occurred at a rapid pace in China, the spatial distribution of the development is uneven. Disparities in economic levels will lead to migration. Population distribution and economic development should be coordinated simultaneously. The deviation between them should be controlled within a reasonable range, or it will block regional harmonious development. In this paper, we take Sichuan province as a case, and select CPE to measure the correspondence between population distribution and economic development. For analyzing net-migration, we establish a regression equation by selecting 15 indicators, which are classified into three categories—economic factors, population and employment factors, and infrastructure and public service factors. Our primary conclusions are provided below:
The distribution of population, population density, GDP, and GDP growth all are similar, with high value areas mainly concentrated in eastern Sichuan, specifically in the Chengdu plain economic zone, the southern part of the northeastern economic zone, and the northern part of the southern economic zone. Note that the counties surrounding Chengdu city and the border of Sichuan and Chongqing have relatively higher values. This indicates that, driven by the two core cities of Chengdu and Chongqing, these areas are currently experiencing more population and economic benefits. However, with the exception of the counties with good traffic conditions or national resources, counties face some challenges because of the large economic gap between them and the core cities.
In 2005, 30 counties were balanced in their concentrations of population and economic performance and were concentrated primarily in the central part of Sichuan. Among the 125 unbalanced counties, 102 counties had given priority to concentration of population over concentration of economic activity. In 2012, the number of balanced counties dropped to 12, and these were mainly concentrated in western Sichuan and did not overlap with the balanced counties of 2005. Among the 143 unbalanced counties, the main type of imbalance became a concentration of population that was lower than the concentration of economic activity. The reduced CPE from 2005 to 2012 indicates that the growth rate in concentration of population is slower than growth rate in the concentration of economic activity. It is this economic polarization combined with little change in population distribution that caused the CPE to drop.
As the second largest Chinese province in terms of migration, 88% of migrants are moving out of Sichuan and most of these are moving into eastern China. In-migrants from other provinces and in other counties of the same province account for 18% and 82%, respectively. Most of the in-migrants thus came from Sichuan itself, indicating that the county’s economic development and urbanization derives from the local population. The in-migrants are mainly concentrated in some cities, indicating that central cities are the main in-migration regions for the inter-county migration.
The out-migrants are coming from eastern Sichuan, which has better terrain and economic conditions. The large number of out-migrants is an important contributor to the decrease in CPE. The number of net-migrants is equal to the number of in-migrants minus that of out-migrants, and the number of out-migrants is much greater than that of in-migrants in Sichuan; therefore, the distributions of net-migrants and out-migrants are similar. The out-migrants and net-migrants are distributed in a “C” shape, with out-migrants declining from east to west while net-migrants increased. The small number of in-migrants and out-migrants combined with the culture of ethnic minorities does not encourage migration; therefore, the number of net-migrants is positive in most area of western Sichuan. However, Chengdu city, as the capital of Sichuan, is a special case and draws 51% of the in-migrants. This indicates that Chengdu city has great appeal to in-migration. Nevertheless, on the national level, Sichuan has a large economic gap compared to eastern China. The gap can be directly connected to the out-migration in Sichuan. Due to the unique way of life and the cost of migration, there is less out-migration in western Sichuan.
A multiple linear regression analysis demonstrated that economic factors, including total investment, average wages, output value of secondary industry, and per capita local public financial revenue, have positive correlations with net-migration. Rural employment, however, has a negative influence on the net-migration.
CPE has a weak negative correlation with net-migrants. A lower CPE means that the concentration of economic activity is higher than the concentration of population and that the net-migrants are greater. In fact, however, net-migrants are currently decreasing in eastern Sichuan where CPE decreased, and there is a positive correlation between CPE and net-migrants in a few counties in the western economic zone, where the correlation of CPE and net-migration is not significant.


