Article

Ecotourism Environmental Protection Measures and Their Effects on Protected Areas in China

Institute of Geographical Sciences and Natural Resources Research, China Academy of Science, Beijing 100101, China
*
Author to whom correspondence should be addressed.
Sustainability 2014, 6(10), 6781-6798; https://doi.org/10.3390/su6106781
Submission received: 15 July 2014 / Revised: 22 September 2014 / Accepted: 23 September 2014 / Published: 29 September 2014
(This article belongs to the Section Environmental Sustainability and Applications)

Abstract

:
Ecological and environmental protection is the core content of ecotourism development. A quantitative evaluation of the effects of ecotourism environmental protection (hereinafter referred to as EEP) measures on protected areas is conducive to a deeper understanding of the key issues related to ecotourism development in China, thus providing the theoretical basis for formulating the relevant national policies of sustainable ecotourism development in China. This paper first discusses the evaluation index system and then establishes an index evaluation model of EEP measures and their effects on protected areas. Using surveys of more than 1110 protected areas in 27 provinces (autonomous regions or municipalities), we evaluated the EEP measures and their effects from a quantitative and spatial perspective. The completeness of EEP measures for Chinese protected areas was moderately effective, and the implementation status of the protection measures varied with the protection region. The effectiveness of EEP measures in different provinces and regions showed significant differences. The effectiveness decreased from east to west. The evaluation index values of the environmental protection measures displayed a high correlation with the effects of environmental protection on protected areas. The ecological protection measures should be further improved and strengthened according to their regional differences during ecotourism development.

1. Introduction

Ecotourism has obtained global attention since it was officially coined in an international environmental conference held in Mexico in 1986 [1,2]. It has become a popular section of the tourism industry in many countries [3]. Some countries, including Australia, Laos and Bulgaria, developed a national ecotourism development strategy or policy [4]. According to predictions by the United Nations and the World Trade Organization, ecotourism will become one of the largest industries in the world in the future [5].
The fundamental differences between ecotourism and mass tourism lie in the emphasis of the prior one on the nature of tourism activities, on enhancing public awareness of environmental protection, reducing the negative impacts on the environment and increasing local residents’ living standards [6,7,8]. Ecological and environmental protection is the core component of ecotourism. The relationship between ecotourism and eco-environmental protection has been studied intensively [9,10,11,12,13]. Joseph Obua [14] analyzed the impacts of ecotourism development on the local ecological environment in Cherbel National Park in Uganda. Ecotourism helps to ease environmental pressures generated by traditional tourism. Antje [15] believed that although ecotourism helped to protect the habitats of wild animals, it also affected their stress responses, thus resulting in significant negative impacts. Since the concept of ecotourism was introduced to China in the mid-1990s [16], plenty of research on its definition, function, characterization and development has been conducted [17,18,19,20,21,22]. Many researchers have also explored the environmental protection role played by ecotourism development. For example, the impacts of ecotourism on the nature reserves’ environment were analyzed in the Jigong Hill area [23]. Liu Xiao [24] explored the issues and principles in the development of ecotourism in the nature reserve from a theoretical perspective and then proposed environmental protection strategies for ecotourism development. Overall, the ecotourism studies in China have primarily focused on theoretical explorations and analyses. Few empirical research studies have been reported using empirical analysis on a certain type of protected area or a single landscape. Few research studies have been conducted on the comprehensive empirical analysis of the ecotourism environmental protection measures and their effects at a national level, which is of great importance to ecological protection and economic development.
China has a vast territory and complex topography and climate, as well as rich and diverse types of protected areas. The climate of the protected areas in China ranges from subtropical to arid. According to the properties of the regional resources, protected areas in China can be classified into nature reserves, forest parks, national parks, wetland parks, geological parks and water conservancy scenic areas. A majority of these protected areas have not been intensively utilized for industrialization and urbanization, and they cover the major types of ecosystems in China. Until now, a national ecotourism framework has yet to emerge [25], and serious “generalization” problems of ecotourism development have appeared in China in recent years. The generalization of ecotourism provided a “golden signboard” and economic benefits to some tour operators and local governments [26,27]. However, it has caused irreparable ecological damage and serious misconceptions of ecotourism by the society [28,29]. Therefore, the reputation of the tourism industry and the healthy development of ecotourism have been affected [30]. Ecotourism is a new concept in China. Understanding and perfection of its connotations could be a gradual process. The practice of ecotourism should be adapted to the reality in China according to the characteristics of China’s ecotourism resources and the overall demand of the tourist market. As the essence and core philosophy of ecotourism, environmental protection is also a basic benchmark to measure the level and quality of ecotourism development. A comprehensive and quantitative evaluation of Chinese ecotourism environmental protection (EEP) measures and their corresponding effects on protected areas will help to improve our understanding of China’s ecotourism development level and the status of the ecotourism philosophy from a macroscopic perspective. This theoretical foundation will help to promote a comprehensive and coordinated development of China’s ecotourism industry, further enhancing its development quality and benefits.
In this paper, we investigated the current situation of EEP in protected areas and their spatial differences in China. Three major objectives were integrated into this study: (1) empirically assess the overall status of EEP in the protected areas of China; (2) analyze the differences in EEP in China from a regional and provincial perspective; and (3) provide theoretical support and suggestions for ecotourism development to policymakers.

2. Research Methods

2.1. Questionnaire Design and Index System Establishment

The questions in the questionnaire were designed from the perspective of comprehensively evaluating the ecotourism development situation in the protected areas of China. Six major principles proposed by the International Ecotourism Society were considered as the basis to design the questionnaire, which are to minimize the impact of tourism activities, to foster environmental awareness and respect for culture, to promote natural and cultural understanding and appreciation through an interpretation system, to invest part of the tourism revenue directly in protection, to protect community interests and to improve the socio-economic and ecological environment sensitivity of the destination. Fifteen experts in tourism, geography, ecology, resources and environment fields were invited to design a total of 70 questions, covering the basic situation of ecotourism, ecotourism interpretation and education, infrastructure eco-compatibility, resources and environmental protection, community involvement and ecotourism management.
The environmental protection measures and their effects on the protected areas were the core content of the entire questionnaire. The questions in the questionnaire about the environmental protection measures and their effects can be divided into three sections. First, ten questions in the form of radio buttons and multiple-choice items were designed to investigate the basic information and background information of the protected areas. The questions included the names, opening times, operating conditions (reception trips, travel scale, ticket sales, etc.) and types of tourists. Second, various environmental protection measures regarding ecotourism planning, construction, operation and management of the protected areas were included in some questions. The protection measures are the efforts and behaviors aimed at protecting environmental and natural resources. For such a type of question, whether the appropriate environmental protection measures had been taken or not needed to be filled out. We had two options (i.e., “Yes” or “No”). Third, the effects of ecological environmental protection were considered in other questions. These effects include two aspects: ecological environmental quality and environmental devastation. For questions about ecological environmental quality, the actual number needs to be filled in based on the corresponding standard. For questions about environmental devastation, it was required to make sure that there was a corresponding phenomenon of environmental pollution and destruction, or not, in the protected area. On the whole, the evaluation index system of the EEP measures and their effects on China’s protected areas were constructed according to the contents of the questionnaire (Table 1).
Table 1. Evaluation index system of ecotourism environmental protection (EEP) measures and effects.
Target layer (A)Decomposition layer (B)Guideline layer (C)Indicator layer (D)
Evaluation of EEP measures and effectsEnvironmental protection measures (B1)Planning (C1)(D1) Development of the local social and cultural environmental protection program? (D2) Has environmental interpretation system planning been implemented, or not? (D3) Does the explanation system show the value of the local natural ecological environment, or not? (D4) Does the explanation system show the value of the local cultural environment and tradition, or not? (D5) Has the protected area created a protection partition to protect the ecology and the environment, or not?
Construction (C2)(D6) The main building standards in the protection area. (D7) Layout of the catering accommodation facilities. (D8) The relationship between tourism projects and the theme of nature conservation. (D9) Methods of traffic movement in protected areas. (D10) Coordination of facilities and environment. (D11) The implementation rate for environmental impact assessments of construction projects.
Operation and management (C3)(D12) Lighting modes of the road, corridors and surroundings. (D13) Monitoring system of tourism’s ecological environment. (D14) Ecological planning. (D15) Disposal methods of road construction waste. (D16) The control of tourists flow. (D17) Inputs of environmental cost. (D18) Taking effective protection measures for local cultural sites. (D19) Warning signs of animal passages. (D20) Water-saving measures. (D21) Pollution-free cleaning agents. (D22) Is a forest fire prevention system established, or not? (D23) Are there established resource files of rare animals and plants, or not? (D24) Are protection measures for old and valuable trees working effectively, or not?
Environmental protection effects (B2)Ecological environmental quality (C4)(D25) Air quality. (D26) Surface water quality. (D27) Vegetation cover and the bottom value. (D28) Situation of soil erosion. (D29) Qualified rate of water discharge. (D30) Disposal of solid waste. (D31) Utilization of reclaimed water. (D32) Utilization of clean energy. (D33) Usage of ecological toilets.
Phenomenon of environmental damage (C5)(D34) The negative impact on the environment caused by tourism. (D35) Does the sale of endangered species or goods made from rare species occur, or not? (D36) Does the phenomenon of random rock blasting occur? (D37) Events of unauthorized sand removal. (D38) Does the area have graffiti on rocks or not? (D39) Does the unauthorized construction of graves exist? (D40) Does deforestation exist? (D41) Do overfishing and indiscriminate killing of wildlife occur? (D42) Does excessive digging of herbs occur? (D43) Does casual grazing occur? (D44) Is there graffiti or carvings on tree trunks? (D45) Are there invasive biological species?

2.2. Data Collection

Data required in this study were obtained by site interviews of ecotourism operators and managers of the protected area. For protected areas where eco-tourism was developed and operated by the government itself, we conducted interviews with the person in charge to fill out the questionnaire. The survey objects primarily include the following seven types of protected areas that have ecotourism activities in China: nature reserves, forest parks, national parks, wetland parks, geological parks, national water parks and ecological communities. Ecological communities, protected areas characteristic of a local culture based on environmental features, were also investigated. The survey was implemented over 10 months from July 2009 to April 2010. The survey covered 27 provinces, autonomous regions and municipalities directly under the Central Government. The survey was organized by the Department of Environmental Protection or the tourism management sectors of each province (municipalities and autonomous regions). The survey samples in each province were extracted in accordance with the sandwich sampling model [31]. In principle, the environmental protection and tourism departments of the prefecture-level cities (regions, autonomous prefectures) arranged the investigators for the survey. Before being assigned to the protected areas, the investigators were trained to understand accurately the meaning of each question in the questionnaire and how to complete the questionnaire according to the interview. After the interview, they would validate the survey results through field inspection of the planning, facilities, environmental condition and other aspects of the protected area. The protected areas with poor accessibility were surveyed by mail.
In total, 1200 questionnaires were distributed (85% were returned from the field survey) and 1110 completed questionnaires were received, with a response rate of 92.50%. After the investigation, we performed a statistical analysis on the questionnaire using SPSS software according to the F-test methods at a significance level p < 0.05. The survey time and question content of the questionnaire are the main considerations of the traditional approach in a reliability analysis. A common questionnaire reliability test is to simultaneously detect the comprehensive reliability of the timing and questions using the Cronbach’s coefficient (α) [32]. Generally, the higher the coefficient is, the higher the reliability of the study tools is. For basic research, the reliability shall be no less than 0.80, and 0.70 can be accepted in an exploratory study. A reliability lower than 0.35 indicates that the study tool has a low confidence and should be rejected. Based on the study questionnaire analysis, we obtained a coefficient α of 0.870, indicating the high reliability of the questionnaire data.
During the survey samples selection, the quantity of protected areas in various regions of China was considered. Eastern China holds the largest sample size, accounting for 29.6% of the total sample size (as shown in Table 2). Central, western, northeastern and northern China accounted for 28.6%, 23.2%, 10% and 10% of the total sample size, respectively. According to the composition of the sample type, 411 national parks is the largest group, accounting for 37% of the total sample size. The 235 forest parks, 216 ecological communities, 139 nature reserves, 46 wetland parks, 33 geological parks and 30 national water parks accounted for 21.2%, 19.5%, 12.5%, 4.1%, 3% and 2.7% of the total sample size, respectively.
Table 2. Basic status of the sampled regions.
RegionProvinces and municipalitiesQuantityPercentages (%)
North ChinaBeijing151.4
Tianjin100.9
Hebei151.4
Shanxi100.9
Inner Mongolia686.4
North-eastJilin70.7
Heilongjiang797.4
East ChinaShanghai60.6
Jiangsu908.5
Zhejiang615.8
An’hui363.4
Jiangxi514.8
Shandong383.6
Fujian474.2
Central ChinaHenan555.2
Hubei736.9
Hubei464.3
South ChinaGuangdong767.2
Guangxi535.0
Hainan151.4
South-westChongqing80.8
Sichuan928.7
Guizhou807.5
Yunan474.4
Xizang80.7
North-westXinjiang100.9
Ningxia141.3
Total1110100.0

2.3. Analysis Model and Methods

In this paper, we first determined the weights of the 49 evaluation indicators of the index layer in the evaluation system for the 1110 protected areas according to the multi-objective linear weighted function method. Then, we calculated the index value of EEP measures and their effects on the protected areas of China separately. Lastly, a quantitative evaluation and functional partition were made.
The specific model used is as follows:
Sustainability 06 06781 i001
Sustainability 06 06781 i002
where S1 refers to the index of EEP measures in Chinese protected areas, S2 refers to the index reflecting the EEP effects on Chinese protected areas, Ii and Pi are the standardized scoring value of index i of the environmental protection measures and protection effects in protected areas, respectively, and Wi and Wp are the weights of index i.
To effectively avoid the dimensional difference of the original data, the rating value of item I was obtained through the standardization of the questionnaire data. Here, we adopted the model of maximum-minimum standardization. The calculation formula is given as:
Z = ( X i X min ) / ( X max X min )
where Z is the score after standardization, Xi is the original value of the sample, Xmax is the maximum score of the sample group and Xmin is the minimum value.
The weights of Wi, Wp and their sub-index were obtained by the Delphi expert scoring method, combined with the AHP(Analytic Hierarchy Process) analysis method (this study invited 10 experts who majored in tourism, environment, resources, ecology, geography and urban or rural planning).
The total score of every province and region was obtained from the average score of the protection index multiplied by the weight of the region. The weight is equal to the number of protected areas divided by the total sample.
The index scoring was performed using spatial analysis and correlation analysis via Arcgis9.3 and Spss16.0, respectively. To analyze the status of ecotourism environmental protection in the protected areas, combined with the Likert scale evaluation methods, the level of environmental protection in the protected areas was divided into five basic stages based on a comprehensive evaluation score: ≤0.3, indicating a very poor level; 0.3–0.5, indicating a poor level; 0.5–0.7, indicating a moderate level; 0.7–0.9, indicating a high level; and ≥0.9, indicating a very high level. For example, if a protected area gets a comprehensive evaluation score of 0.95, this means that its environmental protection measures and their effects in the process of ecotourism development are in a very good condition and close to the ideal state and would be included in the best stage.

3. Results

3.1. Analysis and Evaluation of the EEP Measures in Protected Areas

3.1.1. Comprehensive Index Analysis of the EEP Measures in Protected Areas of China

In China, the overall rating score of the EEP measures in protected areas is 0.572, indicating that the implementation of the EEP measures is at a moderate level. However, the implementation of each type of measure varied with region.

3.1.1.1. Analysis of the EEP Measures in Terms of Planning

In terms of protected area planning, 63.1% of protected areas had appropriate socio-cultural and environmental protection plans or programs; 27.7% of protected areas had specialized environmental interpretation planning; 50.1% had a special section of environmental interpretation planning included in tourism planning; 20.8% of protected areas had no plan related to ecotourism environmental protection. In the existing interpretation planning system, only 37.2% of the interpretation systems accounted for the local natural ecological value; 49.3% accounted for local social and cultural values, systematically; 8.7% did not account for local social or cultural values. In addition, functional partitioning was implemented in 75.1% of the protected areas in the ecotourism development process, and the ratio was the highest (83.7%) in northwestern China and the lowest (59.3%) in northern China.

3.1.1.2. Analysis of the EEP Measures in Terms of Construction

In terms of construction in protected areas, the buildings were in harmony with the local architectural style and characteristically simple and practical in 54.9% of the protected areas; 6.4% of the protected areas had luxurious reception facilities with heavy environmental loads and a heavy use of resources. In 44.7% and 29.7% of the protected areas, accommodations and catering facilities were arranged outside and inside the protection area, respectively. In terms of internal transportation, in 28% of the protected areas, environmental-friendly tour buses and hiking were selected as the primary avenue of transportation; in 9.8% of the protected areas, ordinary cars, yachts and cable cars with a heavy environmental load were used. In terms of the relationship between construction projects and environmental protection, tourism projects and activities within protected areas are closely related to environmental protection in a majority of protected areas, accounting for 88.2% of the entire sample. In addition, the 100% implementation rate of the environmental impact evaluation of construction projects was carried out in 57.5% of the protected areas.

3.1.1.3. Analysis of the EEP Measures in Terms of Operation and Management

In terms of ecotourism operation and management, 44% of the protected areas invested more than 10% and 36% invested 4%–10% of the annual revenue in ecological environmental protection. This investment proportion is under 3% in 20% of the protected areas and was above 4% in most protected areas. Thirty five percent of the protected areas implemented flow control according to the capacity of the protected areas during peak tourist periods. Thirty six percent of the protected areas established their own independent ecological environmental monitoring systems, whereas 49.5% of the protected areas had no independent ecological environmental monitoring system. Fourteen percent of the roads incorporated energy-saving measures. Seventy three percent of the protected areas had an ecological contingency plan, indicating that the majority of protected areas had strong ecological awareness. The waste disposal met the environmental requirements during road construction in 54.1% of the protected areas. In 82.6% of the protected areas, effective protective measures were adopted for local cultural heritage sites. In 18.2% of the protected areas, animal channels were built. Water saving is an important aspect in terms of ecological and environmental protection. Sixty one percent of the protected areas have various levels of water-saving measures. In using detergents, pollution-free detergent was used in 42.9% of the protected areas. In approximately 97% of the protected areas, a forest fire prevention system was established. Files were prepared for rare animal and plant resources in 91.8% of the protected areas. In 96.4% of the protected areas, effective protective measures were adopted for old and valuable trees.

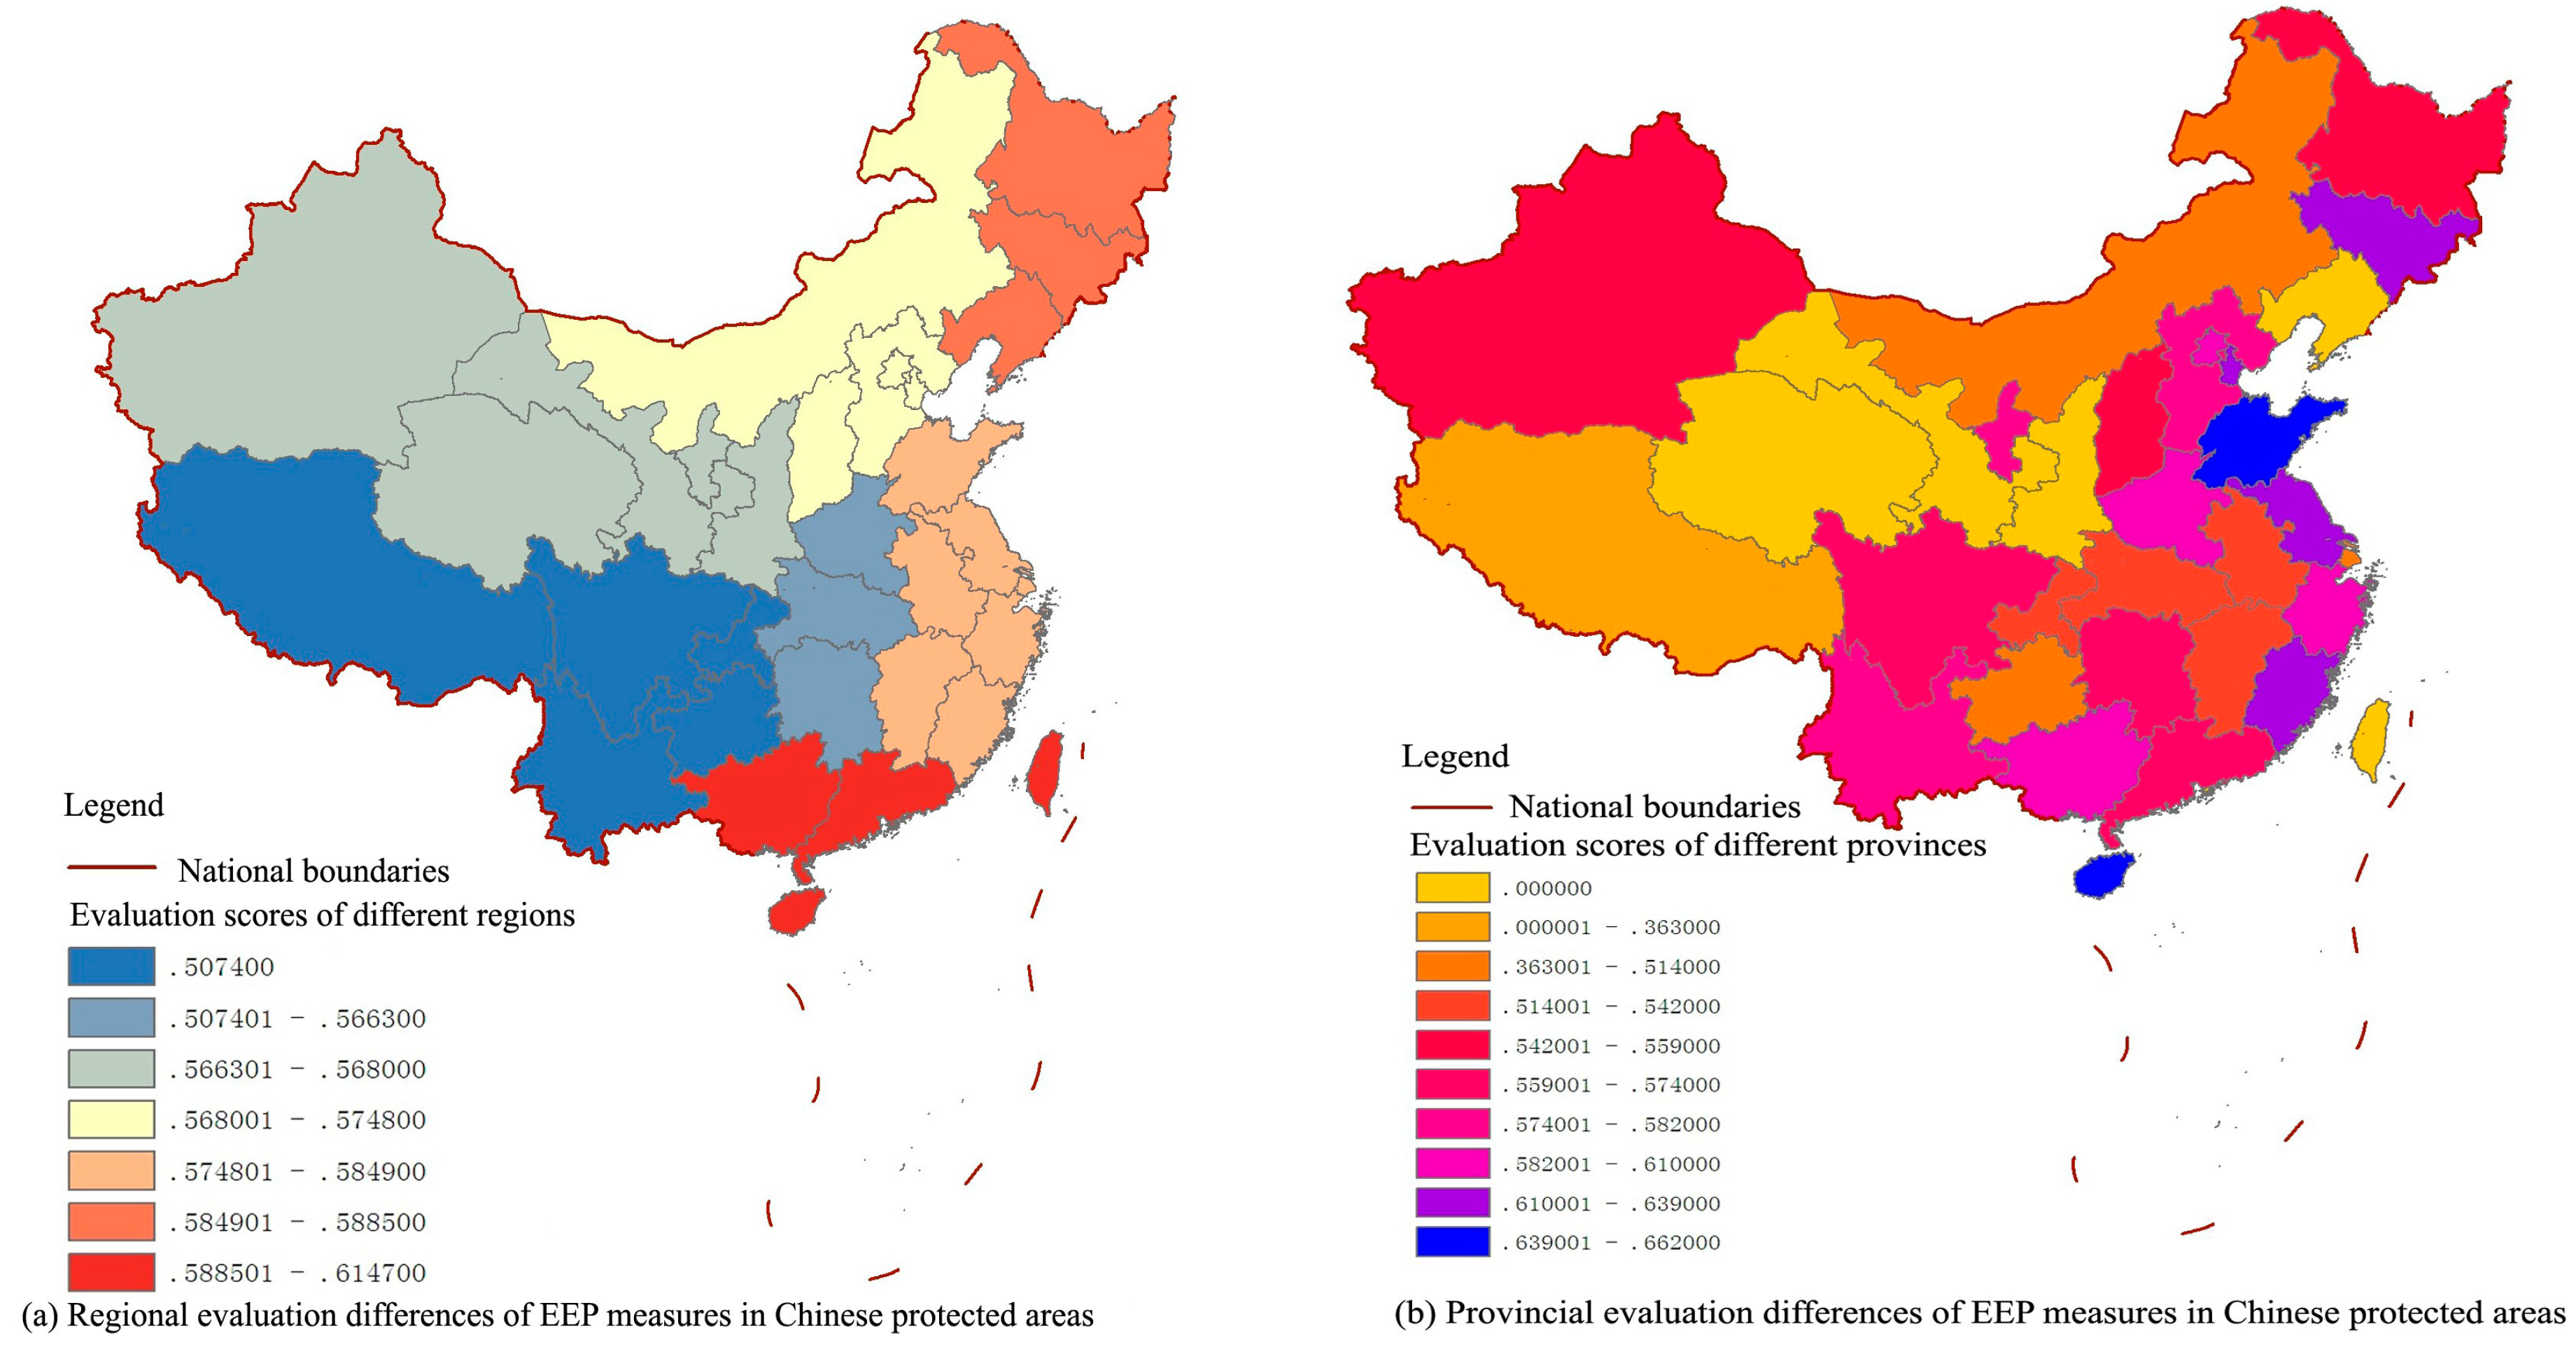
3.1.2. Regional Analysis of the EEP Measures in Protected Areas of China

In terms of the regional differences in implementing the EEP measures in the protected areas, southern China and northwestern China received the highest scores, with values of 0.615 and 0.589, respectively. The scores for eastern China, northern China and northwestern China were 0.585, 0.566 and 0.507, respectively. The regions where the EEP measures were poorly implemented were central China and southwestern China, whose rating score was 0.566 and 0.507, respectively. As shown in Figure 2a, the regional scores were at a moderate level. The evaluation scores of indicators varied fundamentally across different regions, and the indicators of the advantage and disadvantage of each region are summarized in Table 3 below.
Table 3. Regional analysis of the EEP measures in protected areas.
RegionAdvantage indicator (rating score)Disadvantage indicator
Northeastern China
  • Relationship between project construction and environmental protection contingency, 0.942.
  • Ecological plan, 0.824.
Indicator of facility layout.
Northern China
  • Cultural value, 0.808.
  • Input of ecological protection, 0.623.
  • Establishment of an environmental detection system.
  • Ecological plan of contingencies.
Eastern China
  • Environmental protection investment, 0.69.
  • Establishment of environmental protection monitoring systems, 0.491.
Southern China
  • Interpretation system planning, 0.563.
  • Tourist control measures, 0.413.
The interpretation system of cultural connotation.
Central China
  • Ecotourism planning, 0.977.
  • Traffic signs, 0.236.
  • Ecological toilet usage.
  • Project layout.
  • Development of cultural values.
Northwestern China
  • Construction and environmental coordination, 0.958.
  • Embodiment of cultural values, 0.688.
  • Implementation of environmental assessments, 0.896.
Indicator of tourist control.
Southwestern China
  • Layout of building facilities, 0.592.
  • Ecological protection investment, 0.558.
  • Water saving measures, 0.659.
  • Ecological value.
  • Coordination between projects and environment.
  • Execution of environmental impact assessments.
Northeastern China is one of the major forested areas. The ecotourism development in northeastern China primarily depends on a large number of forest parks (including national and provincial parks) and nature reserves. In recent years, the Chinese government has started a natural forest protection project to strengthen the protection of natural forests and nature reserves. Thus, the implementation of ecotourism protection measures in China has become quite stringent. Due to the lower level of economic development, tourism development in southwestern China is changing the status of local poverty and increasing income. Therefore, through ecological tourism development in the protected areas of southwestern China, more attention has been given to the construction of infrastructure or entertainment activities with high economic value. However, some environmental protection measures, such as the division of environmental functions and interpretation system improvements, were neglected. Water-saving measures were widely adopted in the northwest region. The northwest region is arid, and water-saving technologies were adopted in all protected areas during ecotourism development. According to the provincial evaluation of EEP differences, Hainan Province, Shandong Province and Tianjin Province obtained the highest scores, with values of 0.662, 0.661 and 0.639, respectively. The Tibet Autonomous Region and Guizhou Province received the lowest scores, with values of 0.363 and 0.486, respectively (Figure 1b).
Figure 1. Regional and provincial evaluation differences of EEP measures in Chinese protected areas.
Sustainability 06 06781 g001

3.2. Analysis and Evaluation of the EEP Effects in Protected Areas

3.2.1. Comprehensive Index Analysis of the EEP Effects in Protected Areas of China

During ecotourism development, it is required to adopt ecologically sustainable practices in project management to prevent environmental degradation. The protection effect of EEP directly reflects the state of ecotourism development and policy. The average evaluation score of the Chinese EEP effects was 0.511. The differences among regions and provinces were very significant.

3.2.1.1. Analysis of the EEP Effects in Terms of Ecological Environmental Quality

From the perspective of the ecological environmental quality, 91% of the protected areas could maintain a minimum vegetation coverage. In 79.2% of the protected areas, the state of water and soil protection was adequate to prevent water loss and soil erosion. In eastern China, soil and water conservation was in good condition in 85.2% of the protected areas, and the lowest proportion of protected areas with soil and water conservation in good condition was in the southwest region (only 69.5%). This finding indicated that the soil and water conservation conditions of protected areas in China were in a good condition.
According to the environmental quality survey, air quality reached the primary standard in 71% of the surveyed areas. The overall condition in southern China was the best, where the air quality reached the standard level in 84.1% of the protected areas, whereas in northwestern China, only 58.3% of the protected areas attained the air quality standard. All of the surveyed area’s surface water quality was good, attaining the Class-III water quality standard. The surface water quality in 56% of the protected areas was classified as Class-I. The qualified sewage emission rate was 100% in 40% of the protected areas. The proportion of the protected areas with Class-I surface water quality was the highest (70.8%) in the northwest, medium (69.7%) in southern China and relatively low (47.8%) in northern China. The water utilization rate in 35.9% of the protected areas was above 80%. The protected areas with a rate higher than 60% accounted for 66.5% of the total sample. In 79.4% of the protected areas, the clean energy utilization rate was above 50%. Among the protected areas with higher than 80% of water utilization, the proportion in northwestern China was the highest (45.8%) due to natural water shortages, whereas the proportion in the southwestern region, which has rich water resources, was only 29.7%. In terms of solid waste treatment, 57.3% of the protected areas had a good effect, 36.3% of the protected areas had a general effect and only 5.8% of the protected areas had a poor effect, implying that the overall environmental quality was good. Furthermore, in 52.9% of the protected areas, solid waste management was performed properly. Spatially, 73.8% of the protected areas in southern China had a good solid waste treatment effect. The satisfaction rate in southwestern China was the lowest, with a value of 43.6%. In 24.6% of all protected areas, ecological toilets were used. The highest percentage (39.1%) was in the northeastern region, followed by southern China (37.2%), and the lowest (only 17.1%) was in central China.

3.2.1.2. Analysis of the EEP Effects in Terms of Environmental Damage Phenomena

The phenomena of environmental damages in protected areas are negative indications of EEP effects. In the surveyed sample, garbage problems had the highest selection ratio among the main negative environmental effects. Garbage problems were as high as 53.3% in some areas, followed by damage to conservation objects (23%) and air pollution problems (22%). The issues of graffiti and other environmental damage were observed in 5.9% of the protected areas. In 6.2% of the protected areas, goods made from endangered species or rare species were sold. The proportion of protected areas with the issues of random rock blasting, random sand sampling, casual tomb building, deforestation and trapping and hunting of wild animals was 6.4%, 9.4%, 6.5%, 6.8% and 5.5%, respectively. In 10.5% of the protected areas, the phenomena of indiscriminate digging of herbs and ornamental plants were observed. In 11.9% of the protected areas, the phenomenon of free grazing was observed, and there was graffiti on the trees in 14% of the protected areas. The phenomenon of alien species invasion was observed in 4% of the protected areas, primarily in northern China. The phenomenon of visitors feeding wild animals was popular in 3.2% of the protected areas. In 15.2% of the protected areas, garbage and waste water was dumped directly into rivers. Motorboats in 6.6% of the protected areas dumped or leaked oil into the waters. In 5.7% of the protected areas, natural water was freely changed, which was very serious in northern and central China. The phenomenon of selling wild protected animals persisted in some protected areas. This issue was most severe in northeastern china, where 12.7% of the protected areas experienced this phenomenon, followed by central and southern China. Fortunately, such illegal practices were not found in the research sample of northwestern China.

3.2.2. Regional Analysis of the EEP Effects in Protected Areas of China

It was concluded through comprehensive evaluation that the provinces with better EEP effects were Hainan Province, Hebei Province, Guangdong Province and Shanxi Province, whose scores for EEP effect were 0.591, 0.590, 0.578 and 0.576, respectively. The provinces with bad EEP effects included Tibet (0.193) and Guizhou province (0.402). The areas with better EEP conditions were primarily distributed in southern China (0.575), northern China (0.549), northeastern China (0.542), eastern China (0.519) and northwestern China (0.517). The EEP conditions in central and southwestern China were fairly bad, with values of 0.478 and 0.422, respectively (Figure 2a). The phenomenon of industrial gradient transfer showed that excessive development and excessive construction facilities are generally transferred from eastern China to central and southwestern China. Therefore, environmental protection of protected areas is facing a great challenge in central and southwestern China.
Figure 2. EEP level differences among regions and provinces in China.
Sustainability 06 06781 g002

3.3. Correlation Analysis of the EEP Measures and Effects in Protected Areas

The Spearman analytical method was primarily used to analyze the correlations between linear variables. Generally, it is considered that there is no correlation among the variables when the correlation coefficient is less than 0.09. A coefficient between 0.1 and 0.3 indicates a low correlation. A coefficient between 0.3 and 0.5 indicates a moderate correlation. A coefficient greater than 0.5 indicates a strong correlation. Through an analysis on the 1100 protected areas sampled, the correlation coefficient between ecotourism indicators of EEP measures and their effects is 0.538, which indicates a significant correlation. Thus, these two indicators have a close correlation (Table 4). The EEP measures and their implementation degrees will directly influence the effects of EEP in the protected areas.
Table 4. The correlation coefficient among ecotourism indicators.
The correlation coefficient
The index of protection measureThe index of protection effect
the rho of SpearmanThe index of protection measurethe correlation coefficient1.0000.538 **
Significant (bilateral) -0.000
N11101110
The index of protection effectthe correlation coefficient0.538 **1.000
Significant (bilateral) 0.000-
N11101110
Note: ** When the confidence level (bilateral) is 0.01, the correlation is significant.
To further analyze the relationship between the EEP effect and the sub-index of the EEP measures, we analyzed the correlation between the EEP effects and the indicators of planning, construction and management. As shown in Table 5, there are significant correlations between the three sub-indexes of environmental protection measures and their effects. The correlation between the indicators of planning and environmental protection effects in protected areas is the highest, with a value of 0.355. Therefore, a scientific and reasonable ecotourism plan plays an important role in improving the ecological environmental protection effects in ecotourism development. The correlation coefficient between the sub-index of the management of the protected areas and the environmental protection effect was 0.299. The correlation coefficient between the sub-index of the construction of the protected areas and the environmental protection effect was 0.293.
Table 5. The correlation coefficient among ecotourism indicators.
Operation and managementProtective constructionProtective planningEnvironmental protection effect
Operation and managementPearson correlation10.091 **0.338 **0.299 **
Significance (double side) 0.0020.0000.000
N1110111011101110
Protective constructionPearson correlation0.091**10.111 **0.293 **
Significance (double side)0.002 0.0000.000
N1110111011101110
Protective planningPearson correlation0.338 **0.111 **10.355 **
Significance (double side)0.0000.000 0.000
N1110111011101110
Environmental protection effectPearson correlation0.299**0.293 **0.355 **1
Significance (double side)0.0000.0000.000
N1110111011101110
Note: ** When the confidence level (bilateral) is 0.01, the correlation is significant.

4. Conclusions and Discussion

4.1. Discussion

Protected areas are an essential part of China’s natural ecosystem. With the development of China’s tourism industry, an increasing number of visitors are attracted to protected areas, which facilitates local economic development, while resulting in adverse impacts on the ecological environment [33]. Tourism, even ecotourism, can produce negative impacts on the natural environment through a wide variety of mechanisms at a range of scales [34,35,36,37,38]. Taking effective environmental protection measures helps to prevent or mitigate the negative impacts caused by tourism activity. A comprehensive understanding and evaluation of the past EEP measures and their effects during the process of ecotourism development is the basis for formulating effective measures in the future. In China, analogous research at a small scale, such as a single scenic area or within a county, has been carried out by some researchers. However, few studies have been conducted at the national level, due to the difficulty of data acquisition. In this study, we conducted a preliminary exploration to evaluate the ecotourism environmental protection measures and their effects on protected areas in China.
Based on the findings of this study, ecological environmental protection in each region should have a different focus throughout China. The ecological and environmental condition of northeastern China was generally better than that in other areas. A series of useful methods, such as ecological protection plans and ecological toilets, have already been adopted. In the future, the following aspects should be strengthened: management of a project’s construction plan, wildlife protection and the prevention of invasive species. The protected areas in northern China received high rating scores for the cultural value component of the interpretation systems, ecological protection investment and the use of clean energy. Future work should focus on the coordination between architecture and environment, the establishment and perfection of environmental detection systems, eco-plans of infrequent events, surface water protection and the management of rock blasting and deforestation. Developed eastern China had the advantages of adequate environmental protection investment, the use of clean energy and the establishment of environmental monitoring systems. This area should focus on coordination between construction projects and natural conservation and should avoid destroying the original landscape, such as making modifications to natural water systems. Southern China has made great efforts in interpretation system planning, tourist control measures, waste disposal and air quality measures in protected areas. Southern China should strengthen the cultural connotation of the interpretation system and the coordination between construction projects and the environment in future work. Central China concentrated more attention on ecotourism planning, traffic signs and the usage of ecological toilets. Project layout and the exploration of cultural values should be the future focus. Northwestern China was rated well in the localization of architectural styles, the manifestation of cultural values, the implementation of environmental assessments, in sewage treatment and the use of mid-water. However, some issues remain to be solved, such as perfection of the interpretation systems, tourist management and control, air quality measures and investment in environmental protection. During the development of EEP in protected areas, southwestern China should fully reflect local ecological values. This area should be focused on coordination between construction projects and the environment, implementation of strict environmental impact assessments and improvement of surface water quality in protected areas.
Above all, to practice the concept of ecotourism and to protect the ecological environment effectively during ecotourism development, the following measures should be pursued and strengthened. First, protected areas need comprehensive and scientific planning. It is more important to enhance the planning execution and to monitor their effects. The ultimate goal is to adopt the planning theories and principles for the whole process of project construction and routine management. Second, strict implementation of environmental impact assessments and establishment of multi-directional and 24-h tourism environmental warning and monitoring systems are key to ecotourism project construction and routine management in protected areas. To protect the ecotourism environment and promote the sustainable use of resources, as well as sound development of ecotourism in protected areas, it is necessary to obtain a macroscopic understanding of the spatial differences and temporal variations of ecotourism development in China’s protected areas and to make customized environmental protection policies and practices for different protected areas in different ecosystems.

4.2. Conclusions

Based on the field survey of more than 1110 protected areas in 27 provinces (autonomous regions and municipalities) directly under the Central Government, an analysis on the situation of the Chinese EEP was performed. The main conclusions are provided as follows.
The overall implementation condition of Chinese EEP measures is still in the initial stage. Through decades of development, Chinese protected areas have been established, and the consciousness of the ecological environmental protection has been strengthened in the development of ecotourism. In terms of the effectiveness of environmental protection measures during ecotourism development from the perspective of ecotourism planning, interpretation system planning, project construction, ecotourism management, etc., initial progress has been achieved in northeastern China, Hainan Province and Shandong Province. Positive practice experiences have been accumulated in these areas. In recent years, the EEP measures became stricter in the protected areas of northeastern China due to the vigorous implementation of the “Protection Project of Natural Forests”. With the implementation of the national strategy “Hainan International Tourism Island”, the EEP in Hainan Province gradually became normative. The EEP measures of Shandong Province and Tianjin were in a better condition because of their ample financial resources and strict governmental enforcement.
The quality of the ecological environment and the phenomena of environmental damages are the two performance indicators that measure the EEP effects in protected areas. The EEP effects showed significant differences among each province in China. The conservation conditions of Hainan Province, Fujian Province, the Xinjiang Uygur Autonomous Region and Hebei Province were the best, whereas the autonomous region of Tibet, Guangdong Province and the Inner Mongolia Autonomous Region were in poor condition. The EEP of protected areas in southern China and northeastern China were in good condition, whereas those in central China and the southwestern regions were in quite poor conditions. With the transformation of the economic structure and an industrial gradient transfer, excessive development and excessive facility construction are shifting from eastern China to central and southwestern China. Therefore, the EEP of the protected areas in central and southwestern China are facing a great challenge.
Using correlation analysis, we observed a high correlation between the indicators of the EEP measures and their effects in the protected areas. The perfection degree and implementation status of the existing protection measures directly affected the EEP effects in the protected areas.

Acknowledgment

This work was supported by the National Natural Science Foundation of China (Grant No. 41171435) and China Postdoctoral Science Foundation (Grant No. 2014M561041).

Author Contributions

This paper represents a result of teamwork. Ling-en Wang performed the data analyses and wrote the manuscript; Linsheng Zhong contributed significantly to analysis and manuscript preparation; Yangjian Zhang helped perform the data analyses and revised the manuscript; Bin Zhou helped perform the analysis with constructive discussions. All authors have read and approved the final manuscript.

Conflicts of Interest

The authors declare no conflict of interest.

References

  1. Buckley, R. (Ed.) Impacts Positive and Negative: Links Between Ecotourism and Environment. In Environmental Impacts of Ecotourism; Commonwealth Agricultural Bureaux International: Wallingford, CT, USA, 2004; pp. 5–14.
  2. Li, W.; Zhong, Y. Review about Ecotourism Environmental Education Abroad. Tour. Trib. 2009, 24, 90–94. (In Chinese) [Google Scholar]
  3. Jaafar, M.; Maideen, S.A. Ecotourism-related products and activities, and the economic sustainability of small and medium island chalets. Tour. Manag. 2012, 33, 683–691. [Google Scholar]
  4. Zhong, L.; Wang, J. Investigation and Analysis on Situation of Ecotourism Development in Protected Areas of China. Acta Ecol. Sinica 2011, 31, 7450–7457. (In Chinese) [Google Scholar]
  5. Kaur, C.R. National Ecotourism Plan: Assessing Implementation of the Guidelines for Marine Parks. Available online: http://www.mima.gov.myon (accessed on 12 December 2008).
  6. Wallace, G.N.; Pierce, S.M. An evaluation of ecotourism in Amazonas, Brazil. Ann. Tour. Res 1996, 23, 843–873. [Google Scholar]
  7. Page, S.J.; Dowling, R.K. Ecotourism (Themes in Tourism); Longman Group: London, UK, 2002. [Google Scholar]
  8. Honey, M. Ecotourism and Sustainable Development, Second Edition: Who Owns Paradise? Island Press: Washington, DC, USA, 2008; pp. 29–31. [Google Scholar]
  9. Valentine, P.S. Ecotourism and nature conservation: A definition with some recent developments in Micronesia. Tour. Manag. 1993, 14, 107–115. [Google Scholar]
  10. Ceballos-Lascurain, H. Tourism, Ecotourism, and Protected Areas: The State of Nature-Based Tourism around the World and Guidelines for Its Development; International Union for Conservation of Nature: Cambridge, UK, 1996. [Google Scholar]
  11. Tisdell, C. Ecotourism, Economics, and the Environment: Observations from China. J. Travel Res. 1996, 34, 11–19. [Google Scholar]
  12. Buckley, R. Evaluating the net effects of ecotourism on the environment: A framework, first assessment and future research. J. Sustain. Tour. 2009, 17, 643–672. [Google Scholar]
  13. Hong, T.; Wang, Y.; He, D.; Chen, B.; Yu, J.; Hu, X. The Comprehensive Evaluation of Ecotourism Environment Quality in Wuyishan Scenery District of World Nature and Culture Heritage. Areal Res. Dev. 2009, 2, 117–122. (In Chinese) [Google Scholar]
  14. Obua, J. The Potential, Development and Ecological Impact of Ecotourism in Kibale National Park, Uganda. J. Environ. Manag. 1997, 50, 27–38. [Google Scholar]
  15. Shang, T.; Gao, J.; Guo, J.; Peng, Y.; Hu, S. Research on Ecotourism. J. Tianjin Univ. Soc. Sci. 2011, 13, 505–510. (In Chinese) [Google Scholar]
  16. Wen, Y.; Xue, X. The Differences in Ecotourism between China and the West. Curr. Issues Tour. 2008, 11, 567–586. [Google Scholar]
  17. Zhang, G.R. Theory and Practice on Ecotourism. Tour. Trib. 1999, 1, 51–55. (In Chinese) [Google Scholar]
  18. Zhao, H. Ecotourism-The Only Way of China’s Tourism Sustainable Development. Acad. Exch. 2002, 4, 99–101. (In Chinese) [Google Scholar]
  19. Feng, Q.X. Ethical Implication in Ecotourism. Think. Front. 2003, 4, 73–75. (In Chinese) [Google Scholar]
  20. Yang, G.H. Research on the Responsibility Model of Ecotourism. Tour. Trib. 2004, 4, 53–56. (In Chinese) [Google Scholar]
  21. Cheng, Z.H.; Kong, D.A. Rethinking the Concept of Eco-tourism. Shanxi Univ. Philos. Soc. Sci. 2005, 1, 24–26. (In Chinese) [Google Scholar]
  22. Jian, P. Tourism Studies: Ecological Theory and Practice of Tourism; Hong Kong China Tourism Press: Hong Kong, China, 2001. (In Chinese) [Google Scholar]
  23. Huang, X. Ecotourism and Environmental Protection in Jigong Mountain. J. An’hui Agric. Sci. 2011, 39, 6132–6133. (In Chinese) [Google Scholar]
  24. Liu, X. Discussion on Ecotourism and Environmental Protection of Nature Reserve. Environ. Sci. Surv. 2008, 27, 50–52. (In Chinese) [Google Scholar]
  25. Donohoe, H.M.; Lu, X. Universal tenets or diametrical differences? An analysis of ecotourism definitions from China and abroad. Int. J. Tour. Res. 2009, 11, 357–372. [Google Scholar]
  26. Cheng, F.M.; He, X.; Wang, J. Cold thinking of “ecotourism hot”. J. Xiangtan Univ. Philos. Soc. Sci. 2007, 31, 153–156. (In Chinese) [Google Scholar]
  27. Cheng, L.; Wang, T. Analysis on the Future Policy Tendency of Ecotourism Management Based on the Appropriation of Benefits in Western China. Soc. Nat. Resour. 2009, 23, 128–145. [Google Scholar]
  28. Chen, B.; Nakama, Y. Thirty years of forest tourism in China. J. For. Res. 2013, 18, 285–292. [Google Scholar]
  29. Wang, G.; Innes, J.; Wu, S.; Krzyzanowski, J.; Yin, Y.; Dai, S.; Zhang, X.; Liu, S. National Park Development in China: Conservation or Commercialization? AMBIO 2012, 41, 247–261. [Google Scholar] [CrossRef]
  30. Liu, D. Choices for Ecotourism Development in China. Tour. Trib. 2003, 18, 63–68. (In Chinese) [Google Scholar]
  31. Wang, J. Space Sampling and Statistical Inference; Science press: Beijing, China, 2009. (In Chinese) [Google Scholar]
  32. Zhong, L.N. Reliability and Validity of Tourism Research. Tour. Trib. 2010, 10, 10–11. (In Chinese) [Google Scholar]
  33. Li, W.; Ge, X.; Liu, C. Hiking Trails and Tourism Impact Assessment In Protected Area: Jiuzhaigou Biosphere Reserve, China. Environ. Monit. Assess. 2005, 108, 279–293. [Google Scholar] [PubMed]
  34. Liddle, M. Recreation Ecology: The Ecological Impact of Outdoor Recreation and Ecotourism; Chapman & Hall Ltd.: London, UK, 1997. [Google Scholar]
  35. Manning, E.W.; Dougherty, T.D. Planning Tourism in Sensitive Ecosystems. In Tourism Development in the Critical Environments; Singh, T.V., Ed.; Cognizant Communication Corporation: Elmsford, NY, USA, 1998; pp. 1–20. [Google Scholar]
  36. Buckley, R. Environmental Impacts. In The Encyclopedia of Ecotourism; Weaver, D.B., Ed.; Commonwealth Agricultural Bureaux International: Cabazon, CA, USA, 2001; pp. 379–394. [Google Scholar]
  37. Sustainable Tourism in Protected Areas: Guidelines for Planning and Management. Available online: http://www.iucn.org/about/work/programmes/gpap_home/gpap_capacity2/gpap_bpg/?2167/Sustainable-tourism-in-protected-areas-guidelines-for-planning-and-management (accessed on 25 September 2014).
  38. Newsome, D.; Moore, S.A. Natural Area Tourism: Ecology, Impacts and Management; Channel View Publications: Bristol, UK, 2012. [Google Scholar]

