1. Introduction
Water is an essential resource for guaranteeing socio-economic development and maintaining healthy ecosystems. Attention is increasingly being paid to water resources because of extreme pressure from economic growth and corresponding changes of life patterns, as well as the serious water scarcity induced by climate change and anthropogenic activities. Less than 1% of the world’s fresh water (~0.007% of all water on earth) is accessible for direct human uses [
1]. The growing scarcity of fresh water has been caused by a rapid increase in water demand to develop economies, improve the environment, support people’s daily life, and sustain development in many regions of the world [
2]. The contradiction between the decrease in water supply and the increase in water demand has posed a new challenge to sustainable development, although a number of international institutions have issued some water-related policies to keep a tradeoff between maintaining water supply for economic development and meeting ecological water demand [
3]. The hypothesis that industrial transformation is an important source of economic growth was initially developed in Lewis’s classical model of a dual economy, which will reallocate production factors [
4]; the efficiency of factor allocation plays a substantial role in influencing economic growth through pushing productivity upward [
5]. Consequently, industrial transformation is recognized as a key factor in the sustainable use of natural resources in economic development.
Most economic activities require water as a factor of production, but the economic transaction of water is not usually available. Moreover, economic value of water use for any sector does not be in well-estimated either by national accounting or regional statistics. For this reason, it is hard to analyze water productivity within a set of economic models. Previous studies have tried to evaluate the impact of water use efficiency on hydrology and economy [
6,
7]. Particularly, some researchers adopted stochastic programming models to investigate the contradiction between water supply and water demand; the analysis of water demand was carried out with some trend forecast methods [
8,
9]. The change in water demand is closely related to changes of the industrial structure in the economic system [
10]. As for the economic models that allocate water resources across sectors, there are two general approaches to estimate water use value,
i.e., market-based valuation techniques and non-market based valuation techniques [
11]. Non-market approaches include the inferential valuation method and the stated preference method [
8,
12]. The inferential valuation method refers to the shadow price estimation when individual consumption occurs, while the stated preference method estimates users’ willingness to use water resources under various pre-designed conditions. Some scholars have conducted fruitful research with these non-market methods, but generally with high uncertainty [
8,
13]. When it comes to the market-based valuation methods, the computable general equilibrium (CGE) model is a typical one that is widely used to evaluate the impact of external shocks on water utilization efficiency at different scales, especially the impacts of socio-economic policies on water flow across sectors [
14]. Most studies of the CGE model mainly focused on the effects of shifting water rights and water allocation across sectors [
15], regulation of surface and ground water resources, and water resource management [
16]. There are also some studies that used specific CGE models to evaluate the short-term effects of natural disasters [
17].
Burgeoning economic development, in combination with urbanization, is exerting more and more pressure on national water resources in China. Improving water use efficiency is widely considered an effective way to achieve significant water savings. In this paper, we attempted to evaluate the impacts of industrial transformation on water flow across sectors under different scenarios with the CGE model. The rest of this paper is structured as follows. We firstly give a brief review of the principles and structure of the CGE model that embeds water as a primary factor of production (
Section 2). Next, we introduced the study area, Zhangye in the midstream of the Heihe River Basin (
Section 3), and built up a CGE model with the water resource embedded to analyze water consumption under different industrial transformation scenarios (
Section 4). Thereafter the empirical analysis results were presented and discussed (
Section 5). Finally, we highlighted the major findings of this paper (
Section 6).
2. Review of CGE Modeling on Water Utilization
Water is widely regarded as one of the most valuable primary factors of production in economic activities. The intrinsic link between water and economies is usually ignored in most existing economic models. But without the water market, this important natural resource is usually used for free or at an underestimated price, which makes it difficult to conserve and allocate water efficiently. All the discrepancies between availability and demand, as well as sectoral and regional conflicts, bring water issues to the fore. Effective tools, such as partial and general equilibrium models, are frequently used to augment economic benefit and social welfare with limited water resources [
18,
19,
20]. The conceptual water flow in a CGE model is presented in
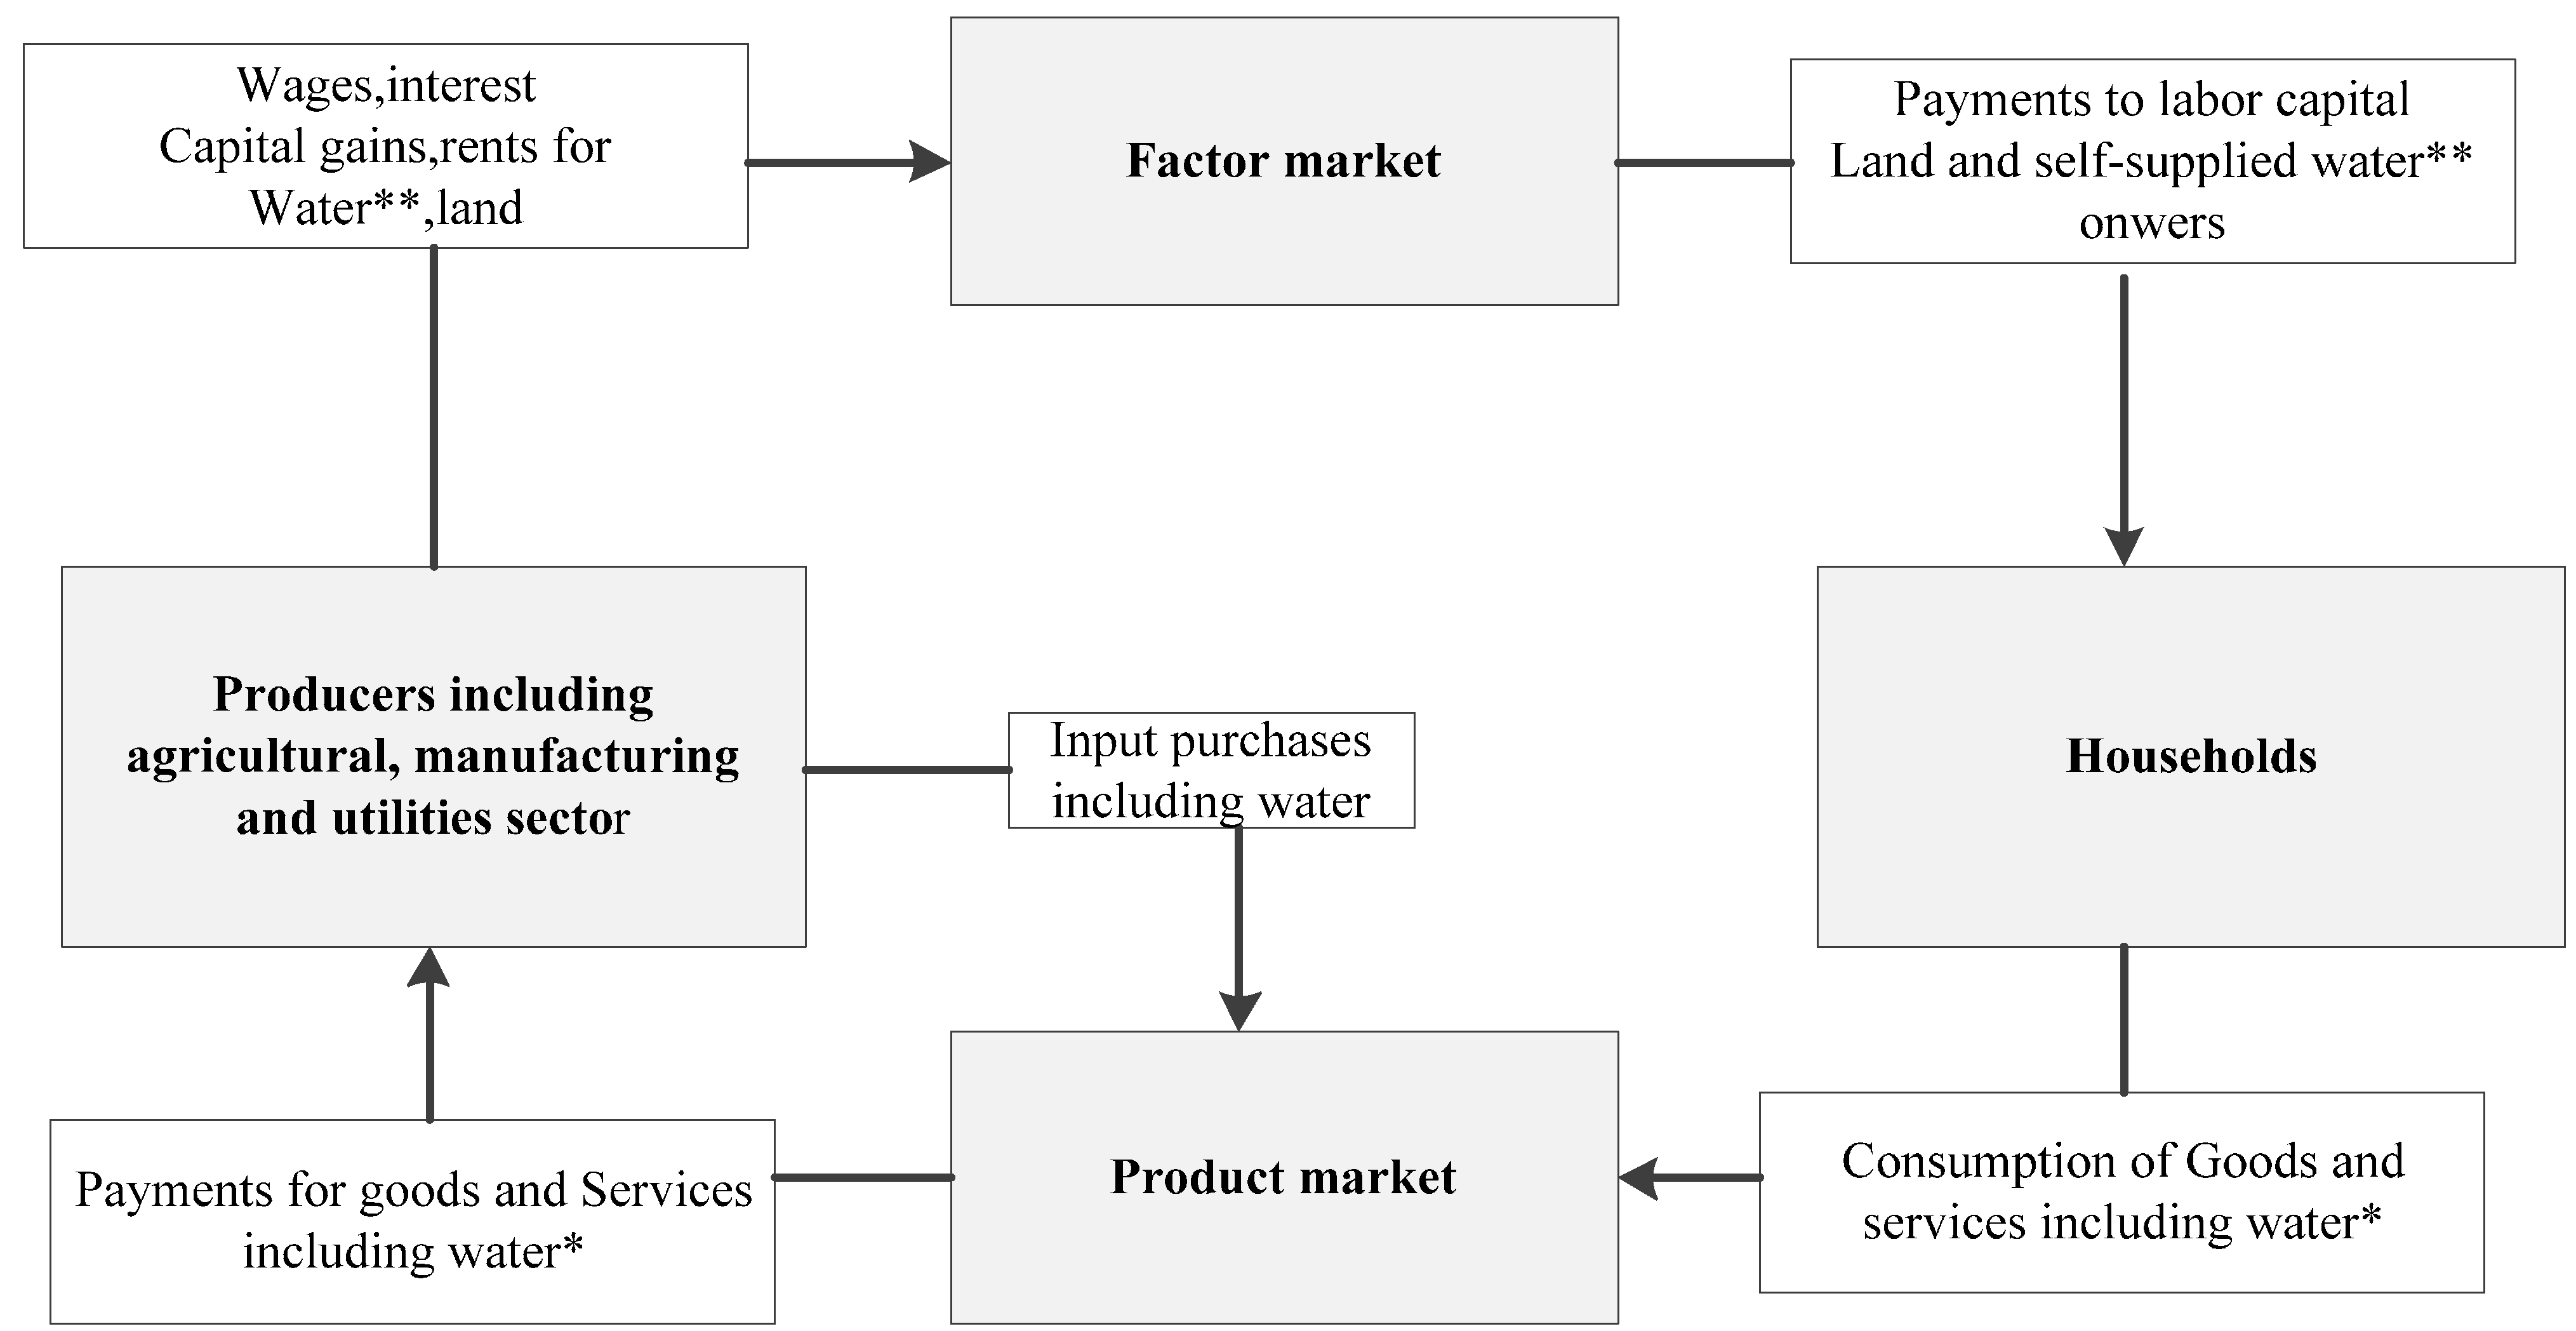
Figure 1. This water CGE model is an extended standard CGE model so that usually includes the components of factor market, consumption market, production market, government market, trade flow, and commodity exchanges as an intermediate input-output process. Commodity is produced by all firms in a sector that presents both market demand of consumption and market supply of production. Thereby, regional economic structure can be aggregated by a series of production functions to represent a practical and specific economic scale, and water may also be considered as a factor of production. The consumption market are formed by all households which represents all family earnings and purchase. Their incomes are divided by two parts, one is from all factor income; and the other one is from their salaries. For money flows in a well-constructed circulation, households purchase connects factor market and commodity market. Water commodities purchased in the product market may not include all water use for all production process in every sector. However, it should be included into a framework of money flows the same as other commodities (
Figure 1). There is a wide range of models for analyzing issues of water use, such as the water pricing policy, water quality, water allocation, water markets, and irrigation policies [
15,
17,
21,
22]. Most of them focus on describing agricultural sectors through a production function such as the nested constant elasticity of substitution (CES) function, the Cobb-Douglas function, and the Leontief function. These models distinguish between irrigated and rain-fed crops. In addition, some researchers have developed a multi-regional CGE model to explore the impact of trade liberalization policy on water resource allocation. They proposed a theoretical framework that links trade reform with water market creation, and further extended the model to distinguish surface water from groundwater [
15].
Figure 1.
Analytical framework of economic activities embedding water resources in the CGE model.
Figure 1.
Analytical framework of economic activities embedding water resources in the CGE model.
Notes: ** Water owned as a primary factor; * Water is acted as a commodity.
To date, the GTAP-W model and the TERM-H2O model are the two most renowned water-embedded CGE models. The GTAP-W model, first proposed by Berrittella [
1], is widely used to analyze related issues of agricultural water utilization at a global scale. Additionally, Glyn Wittwer has developed the TERM-H2O model, a special version of the TERM model, to analyze the economic impacts of water shortage and water trading at a multi-regional scale [
23,
24,
25]. In addition to the difference in scale, the GTAP-W model is a “top-down” model, while the TERM-H2O model follows a “bottom-up” approach. In the GTAP-W model, the original land endowment has been split into pasture land, rain-fed land, irrigable land, and irrigated land. Irrigation water is nested into value-added part, which implies substitution possibilities with irrigable land and all other factors of production. By combining irrigated land and its water supply, production factors are set in a value-added nest through a CES function [
26]. The nest structure of GTAP-W is relatively simpler, but more flexible. However, in the TERM-H2O model, water is combined with irrigable land to create irrigated land using the Leontief formulation, in which water is fixedly proportioned with irrigable land [
25]. Overall, these two models only focus on water consumption in agricultural sectors. In this study, water is considered as the primary factor in agricultural production and can be replaced with other factors. The CES function was used to analyze the factor distribution of production. In addition to the implementation of recycled waste water in the industrial sector, water serves as the intermediate input for the industrial sectors and is accounted for in the water supply sector. Therefore, water can be made a primary factor to flow across all sectors. In addition, capital, land, water, and labor are considered as the primary factors of production in our model. The research improved the general CGE model to consider the variance of water supply systems in different sectors, which included water in the agricultural sector and coupled water in industrial sector l. The model can evaluate the effects of industrial transformation on water consumption across sectors.
3. Study Area
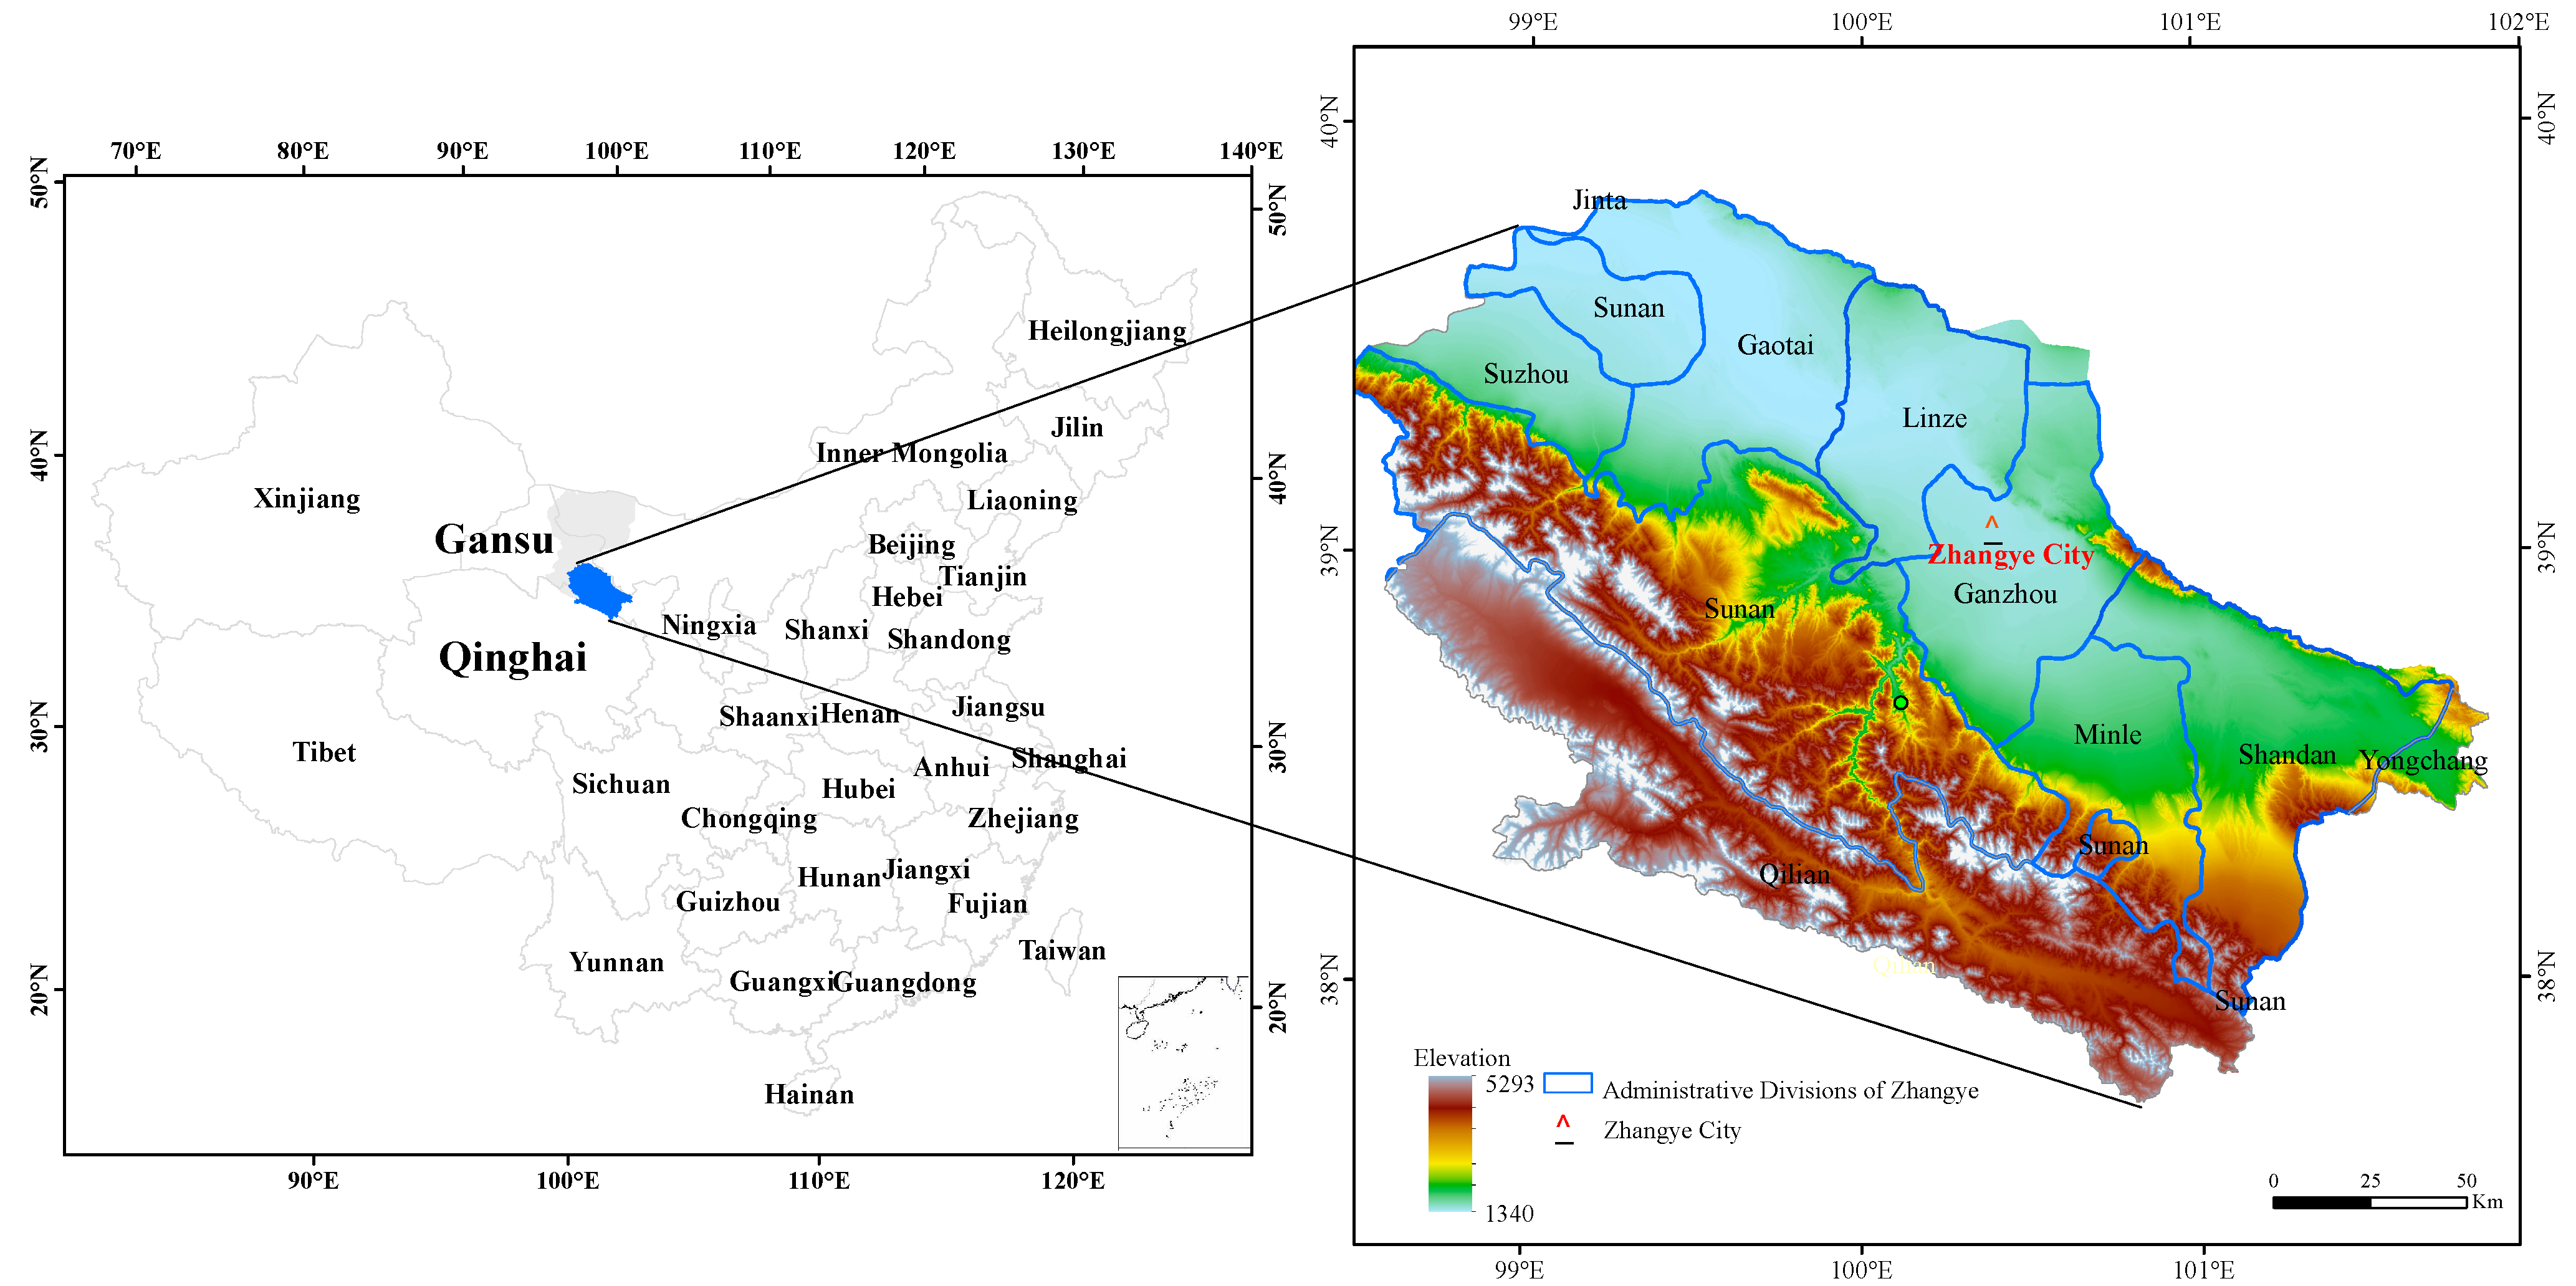
Zhangye, a prefecture-level city of Gansu Province in northwest China, is located in the midstream of the Heihe River Basin and the middle part of the Hexi Corridor (
Figure 2). As one of the most important areas during the national western development, Zhangye occupies 95% of cultivated land (2668 km
2), includes 91% of the population, and generates more than 80% of GDP of the Heihe River Basin. Zhangye is rich in natural resources and is the main irrigated area in the Heihe River Basin. There are 26 rivers and streams in Zhangye, which contribute to annual runoff up to 2.66 billion m
3. The groundwater reserve is very abundant [
27,
28]. Zhangye, with forest coverage reaching 9.2%, covers more than 217,333 km
2 grassland and 3867 km
2 woodland. Sunshine duration throughout the year in Zhangye is up to 3000 h. Zhangye is irrigated by the Heihe River, and its flat and fertile soil produces rich products, such as Wujiang rice and corn for seed. It is one of the 12 key national commercial grain bases due to its abundant supply of wheat, corn, rice, oilseed rape, flax and other crops. The government aimed to secure food production and economic growth, thus irrigation agriculture became the largest user of water by far. Large investments were made in agricultural infrastructure and laws were established to protect the water rights of riparian farmers. Rapid industrialization, however, proved to be a significant competitor to the agricultural sector. To adjust the farming layout, transforming low-value grain commodities to high-value products is the major agricultural development goal.
Figure 2.
Study area: Zhangye City.
Figure 2.
Study area: Zhangye City.
Expanding agriculture and rapid economic development have induced the excessive use of water resources in Zhangye [
28]. According to the Zhangye Water Resource Bulletin, the annual available water resources were 2.36 billion cubic meters in 2007, including 2.02 billion cubic meters surface water and 0.34 billion cubic meters groundwater, while actual annual water utilization was 2.36 billion cubic meters, 99% of which was consumed by the socio-economic systems; 95% of this amount was used for agriculture (
Table 1). Ecological and environmental water demands are severely restricted due to excessive water utilization in socio-economic systems. As a result, it seems that Zhangye has been caught in an environmental-economic dilemma due to increasing dependency on scarce water resources and further erosion of environmental quality. Therefore, it is imperative to promote water use efficiency for the management of water demand in the region.
Table 1.
Situation of water use in Zhangye, 2007.
Table 1.
Situation of water use in Zhangye, 2007.
| | Production | Household use | Ecological use | Total |
|---|
| Agricultural sectors | Industrial sectors | Tertiary industry |
|---|
| Surface Water | 1952 | 12.52 | 6.78 | 28.34 | 20.39 | 2020.03 |
| Ground Water | 283 | 30.64 | 3.6 | 9.95 | 11 | 338.19 |
| Total | 2235 | 43.16 | 10.38 | 38.29 | 31.39 | 2358.22 |
4. Methodology and Materials
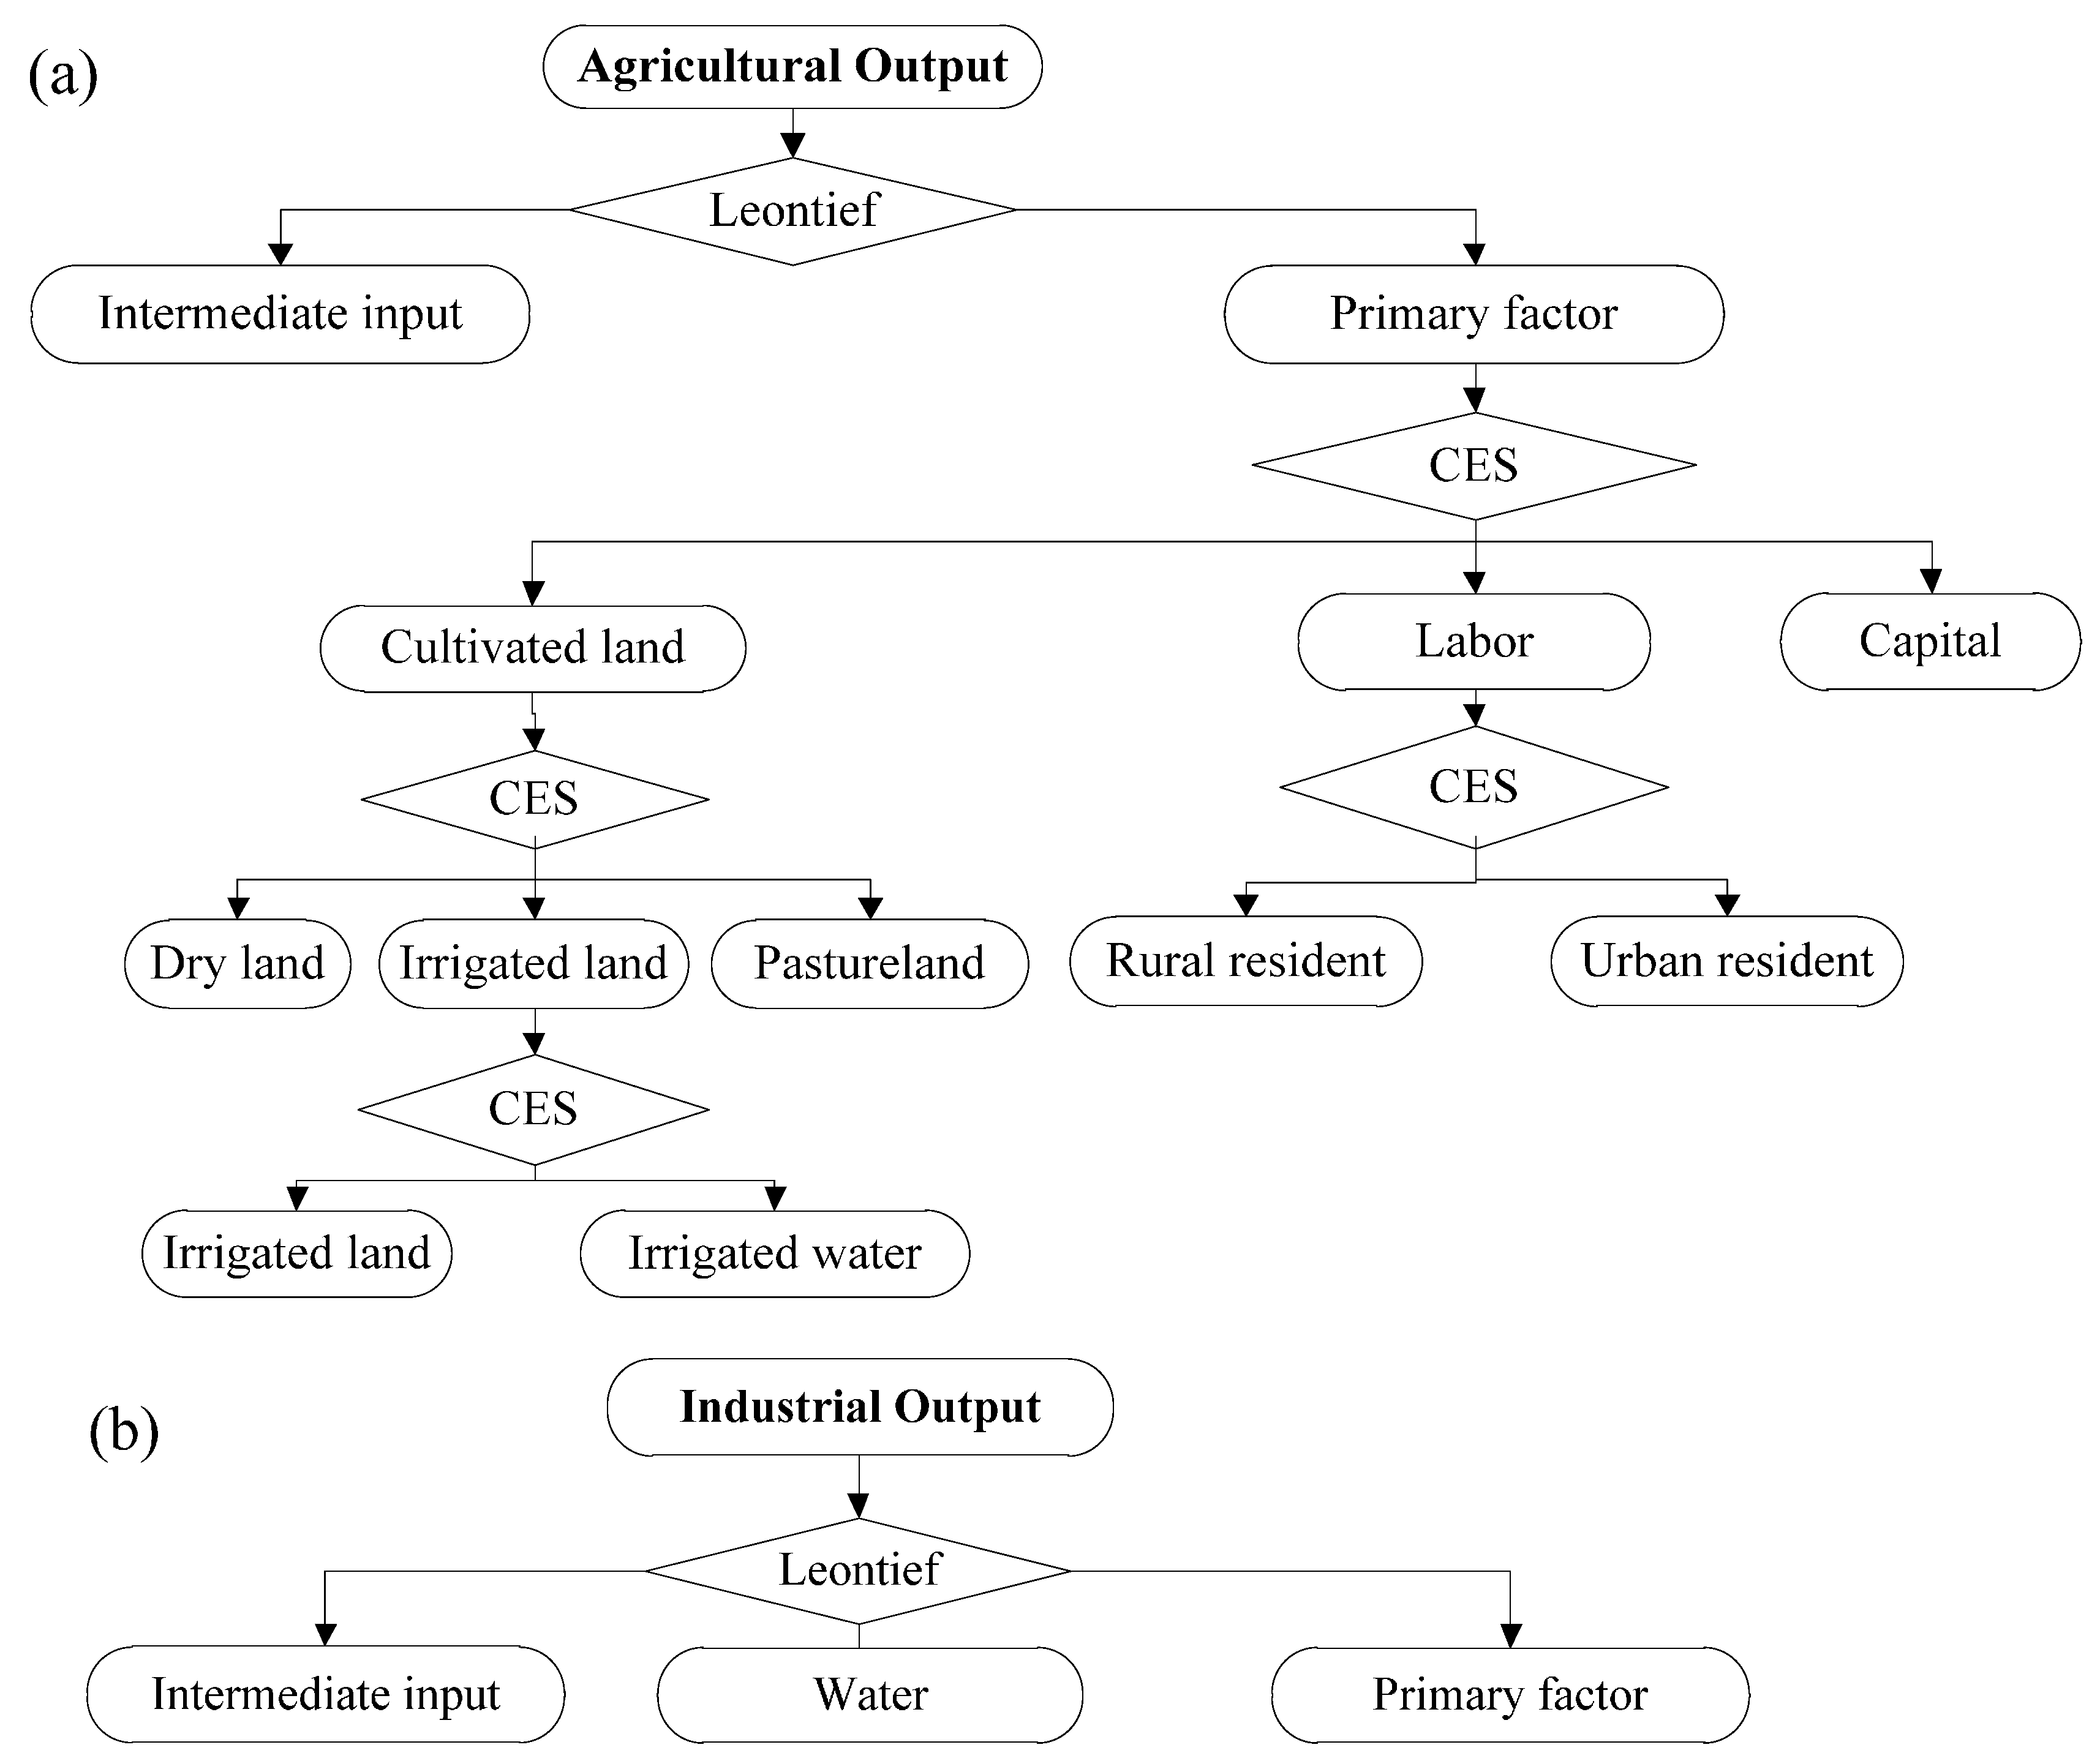
The CGE model is modified to embed water, and the economic activity of primary, secondary, and tertiary industries are included in the water-embedded CGE model with the production and consumption functions. In the nested structure of production function, land and water are considered a part of the primary factors in agricultural sectors (
Figure 3, Panel a). At the top level, the sectoral output is represented with a Leontief function of intermediate input and real value-added. Intermediate inputs are determined with fixed input-output coefficients, which determine the heterogeneity in both the technology and the productivity of sectors. Real value-added is represented with a CES function of capital, labor, and an aggregate of land and water in agricultural sectors, as shown in Equation (1). At the lower level, labor is represented with a CES function of rural and urban residents. In addition, the land and water aggregate is represented with a linear function of industrial land and cultivated land. Furthermore, it is assumed that the industrial land aggregate is a linear function of the land and water used in industrial production, and the cultivated land is a CES function of dry land, irrigated land, and pasture land. At the lowest level, the irrigated land is characterized with a CES function of land and water. Irrigated land combined with water are put into production process according to a CES function. At this stage, only biased technical change is specified, which is a shift in the production technology that favors land or water by increasing its relative productivity. Thus, the demand for irrigable land and water, and the unit cost of the irrigable land-water composite, are determined by Equations (1) and (2), respectively.
where
QFE(i,j,r) denotes the quantity of the total primary factor demand for endowment good
i for use in industry
j in region
r,
QLW(i,j,r) denotes the quantity of the land and water aggregate,
AFE(i,j,r) denotes the technical change of the primary factor,
PFE(i,j,r) denotes the price of the total primary factor,
PLW(i,j,r) denotes the price of the land and water aggregate, and
ELLWj,r denotes the elasticity of substitution. However, water is an intermediate input for production in secondary and tertiary sectors as follows (
Figure 3, Panel b).
where
Q1(
c,
i) denotes the quantity of water used in the industrial sector,
X1TOT(
i) denotes the quantity of total output,
P1TOT(
i) denotes the price of total output, and
P0COM(
c) denotes the price of water in sector
c.
Figure 3.
Production function for embedding water resource factors. Panel (a) the production function of the agricultural sector; Panel (b) the production function of the industrial sector.
Figure 3.
Production function for embedding water resource factors. Panel (a) the production function of the agricultural sector; Panel (b) the production function of the industrial sector.
Note: For more specific information about this model, see the book
Integrated River Basin Management Practice Guideline for the IO Table Compilation and CGE Modeling [
29].
Water supply data were collected from Zhangye Water Resource Bulletin, published by the Zhangye Water Resource Bureau. Water utilization data were collected from the Zhangye Water Resource Bureau and Water Supply Company and the input-output table published by the Statistics Bureau of Zhangye in 2002. The average water prices of different sectors, published by the Price Bureau of Zhangye, were used for calculating the initialized economic valuation of water use in each sector. See the following mathematical formulae.
For Water Consumption in Primary Industry [
10]:
where
WIcrop is the economic value of per unit water consumption in crop farming industry (CNY/m
3), GO represents the gross output of different cultivated land types (CNY), and WA is the amount of water consumption of different cultivated land types (m
3).
For Water Consumption in other industries (i):
where
WIi is the water consumption coefficient of per unit output in each industrial sector (CNY/m
3),
Ci is the coefficient of water reuse in each industrial sector,
GOi is the gross output of each industrial sector (CNY), and
WAi is the water consumption of different sectors (m
3).
The main water source for Zhangye is the Heihe River, and water consumption is closely related to the category and development of industries. In Zhangye, the output values of all industries except other agriculture continued to increase during 2003–2008 (
Table 2). The output value of the secondary industry increased significantly by 39.78% during 2003–2005 and 88.43% during 2005–2008, followed by that of the tertiary industry, which increased by 24.59% and 39.07%, respectively, during the same periods. However, the output values of animal husbandry and the construction industry increased by 30% and 35%, respectively, during 2003–2005, whereas their growth rate during 2005–2008 was only 7% and 10%, respectively. Water consumption increases with output growth, especially for the planting industry. The increase rate of water consumption was 30% during 2003–2005 and 7% during 2005–2008. At the same time, the marginal revenue of water in tertiary industry rose from 1.22 during 2003–2005 to 5.43 during 2005–2008. The abrupt decreased growth rate of water consumption between the two periods, even as the irrigation water supply from precipitation held stable in Zhangye, can be explained by two factors. First, in pursuit of rapid economic development, a higher output of crops at a lower level of water consumption may occur. Secondly, improvement in water use technology led to lower water consumption.
Table 2.
Baseline of outputs, water consumption, and marginal revenue of water during 2003–2005 and 2005–2008.
Table 2.
Baseline of outputs, water consumption, and marginal revenue of water during 2003–2005 and 2005–2008.
| Sector | I | II | III | IV | V | VI | VII | VIII |
|---|
| Planting sector | 22.40 | 15.49 | 0.13 | 0.3 | 0.43 | 0.22 | 0.07 | 3.14 |
| Animal husbandry | 7.76 | 0.23 | 0.3 | −0.25 | −1.20 | 0.07 | 0.13 | 0.54 |
| Other Agriculture | 1.17 | 2 | −0.24 | −0.27 | 0.89 | 0.08 | 0.23 | 0.35 |
| Industry | 17.44 | 0.39 | 0.4 | 0.22 | 1.82 | 0.88 | −0.1 | −8.80 |
| Construction | 9.08 | 0.05 | 0.35 | 0.11 | 3.18 | 0.1 | 0.12 | 0.83 |
| Service | 31.06 | 0.34 | 0.22 | 0.18 | 1.22 | 0.38 | 0.07 | 5.43 |
In this model, water is the primary factor in the agricultural sectors and the intermediate input in the industrial sectors; therefore, water is embedded in the economic flow. The assumption that the data are obtained from an economy in some type of “equilibrium” is the primary condition for all CGE models [
30]. In the baseline simulation, the model operates in a reverse fashion with GDP, production, consumption, and international trade exogenous, and the corresponding technical and preference change variables endogenous. In the baseline simulation, the model operates according to changes in GDP, consumption, investment, and other observed variables during a historical period, and then it calculates the necessary changes in technology and preferences. Calibration is the procedure commonly used for parameter specification, which was carried out with the data from 2003–2008 based on the input-output table in 2002; the model is completed when parameters have been calibrated and are ready to evaluate the effects of three scenarios on water consumption. We followed the static calibration procedure to compute the baseline after determining the parameter values, applying the CGE model until all parameter values are correctly specified.
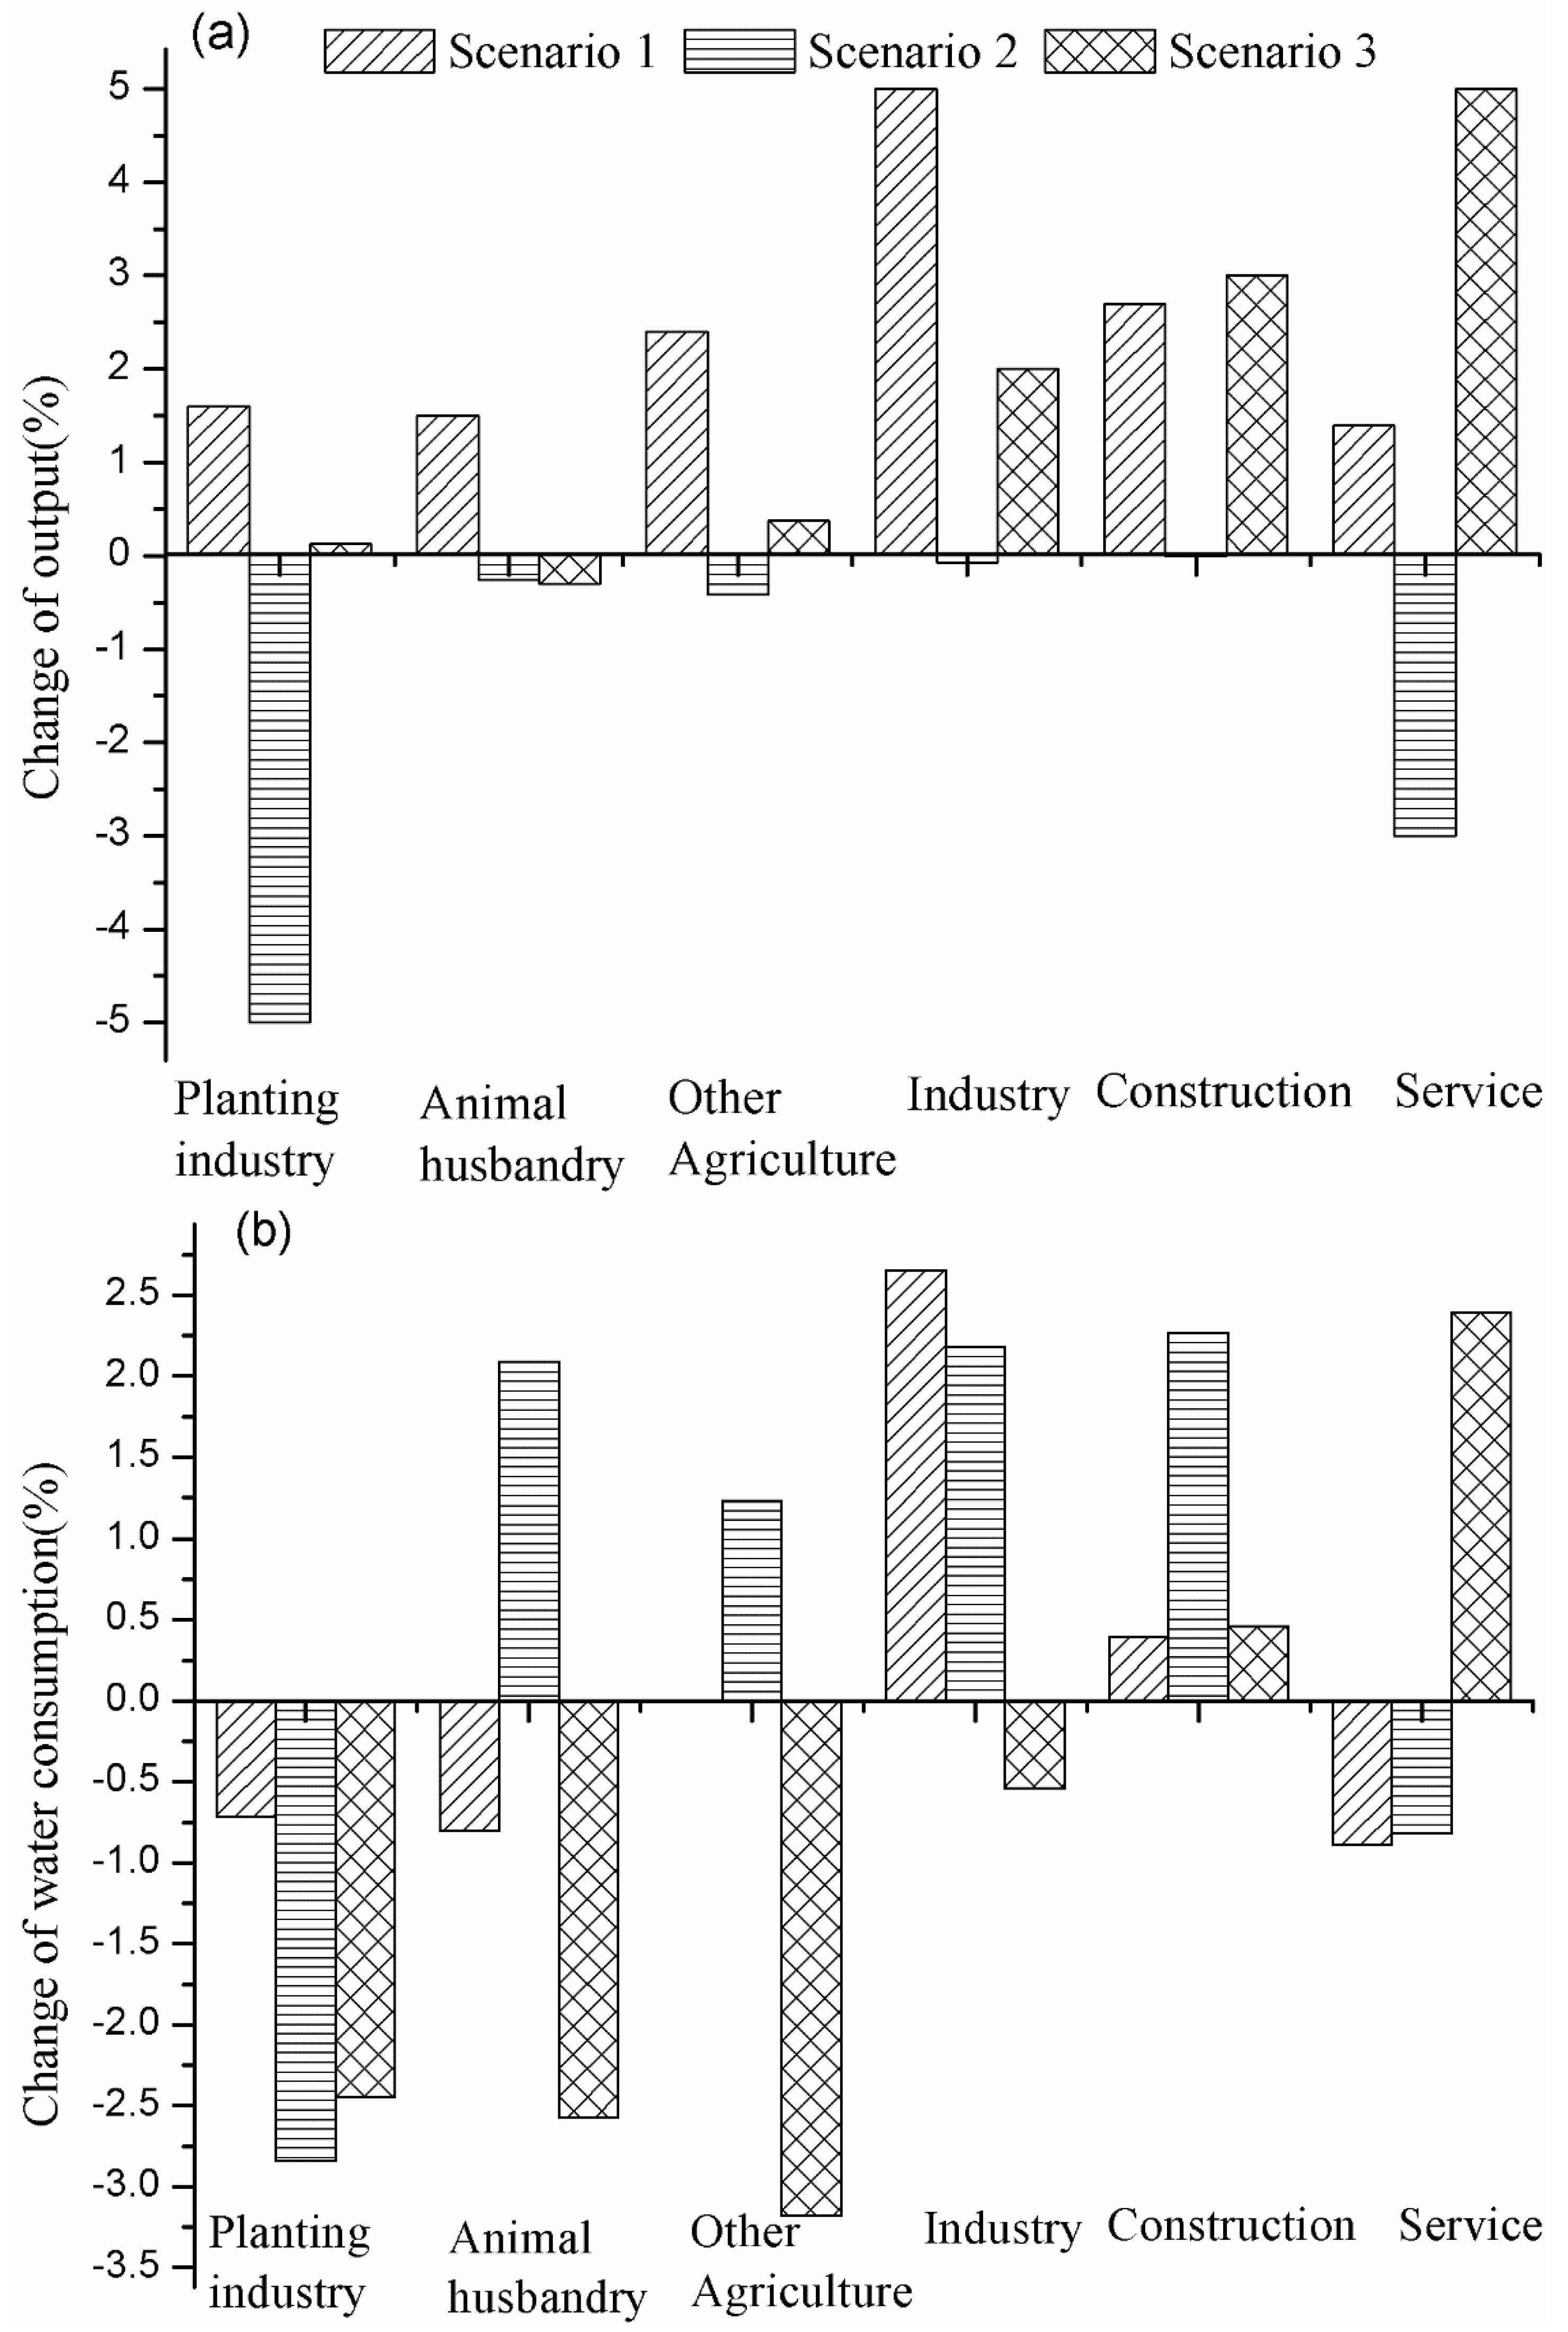
In this study, we designed three scenarios to analyze the impacts of industrial transformation on water consumption with a modified CGE model, which provides a scientific basis for water resource management. In the three scenarios, we separately assumed that the output value of the secondary industry increased by 5% during 2003–2008 (Scenario 1), the output value of the planting industry decreased by 5% in 2003–2008 (Scenario 2), and the output value of the tertiary industry increased by 5% in 2003–2008 (Scenario 3). The three scenarios represent industrial transformation, and the simulation results can show the influence of industrial transformation on water consumption, which can provide a scientific basis for water resource management.
5. Results and Discussion
It is challenging but necessary to boost economic development through the efficient use of water resources. The simulation results show that the output value of all the sectors increased under scenario 1 when the output value of the secondary industry increased by 5% (
Figure 4a). However, the proportion of water consumption in secondary industry increased, while that of farming, animal husbandry, and the service sector decreased, and that of other agricultures remained stable (
Figure 4b). The analysis suggests that the output value of other sectors was driven by the industrial technical change. Food industry is the major secondary industry in Zhangye, and therefore the development of secondary industry may advance the primary and tertiary industries by raising prices. Specifically, GDP increased by 2.6% and total water consumption was reduced by 0.13%, indicating that the farming industry is the largest water-consuming sector in the region. Under the second scenario, outputs of almost every industry decreased, but the change of water consumption was different. The change of water consumption in secondary industry was contrary to that of the output value. Under the last scenario, the development of tertiary industry would promote the secondary industry, but the effect on agriculture was not significant. However, the water consumption of the planting industry decreased by 2.5%; therefore, it will be beneficial to promote the expansion of secondary industry and tertiary industry with lower water use intensity while advancing the development of the planting industry and other agricultural sectors.
Figure 4.
Effects of industrial transformation on output value (a) and water consumption (b) under different scenarios.
Figure 4.
Effects of industrial transformation on output value (a) and water consumption (b) under different scenarios.
The reduction in water consumption per unit GDP can be achieved through promoting technical change under the three scenarios. The industrial transformation of planting plays a key role in improving water use efficiency to achieve the goal of reducing water consumption. Under scenario 1, when the output value of the secondary industry increased by 5%, the annual GDP increased by 0.80%, while the water consumption per unit GDP decreased from 80 m
3/10
4 CNY under the baseline scenario to 65 m
3/10
4 CNY under scenario 1. Under scenario 3, the water consumption of per unit GDP decreased by 25% as the annual GDP increased by 0.50% (
Table 3). This indicates that the secondary industries play an essential role in pushing economic development, while the development of the tertiary industries can greatly raise water use efficiency in Zhangye. The food industry in secondary industries can push the development of primary industry, which is also closely related to the development of tertiary industry. Therefore, the development of tertiary industries can drive the complete industrial chain in Zhangye’s economic system. The proportion of industries with high water consumption in Zhangye is very large, which can cause serious environmental issues, so the development of these industries is against the goal of sustainable development. Therefore, municipal government and relevant institutions in this environmentally fragile region should cooperate to promote the coordinated development of both economic and ecological systems. For example, high water consuming industries with a high direct water use coefficient should be limited to some extent in the future. Overall, according to the simulation results under three scenarios, we suggested that the third scenario should be adopted for water resource management reform.
Table 3.
Comparison of different scenarios’ effects on economic development and water consumption.
Table 3.
Comparison of different scenarios’ effects on economic development and water consumption.
| The annual growth rate of GDP during 2003–2008 | The water consumption per unit GDP (m3/104 CNY) |
|---|
| Baseline | 14.40% | 80 |
| Scenario 1 | 13.80% | 72 |
| Scenario 2 | 15.20% | 65 |
| Scenario 3 | 14.90% | 60 |


