Article

Differences in Pattern and Driving Forces between Urban and Rural Settlements in the Coastal Region of Ningbo, China

1
Key Laboratory of Regional Sustainable Development Modeling, Institute of Geographical Sciences and Natural Resources Research, Chinese Academy of Sciences, 100101 Beijing, China
2
College of Geographic Sciences, Nanjing Normal University, 1 Wenyuan Road, 210023 Nanjing, China
*
Author to whom correspondence should be addressed.
Sustainability 2014, 6(4), 1848-1867; https://doi.org/10.3390/su6041848
Submission received: 7 March 2014 / Revised: 27 March 2014 / Accepted: 28 March 2014 / Published: 9 April 2014

Abstract

:
Rapid urbanization on the coast of China has attracted much attention. The objective of this study was to explore the differences in dynamics and related driving forces between urban and rural settlements. Applying the quantitative method, we demonstrate that substantial heterogeneity in settlement growth, landscape pattern metrics, change, land sources and driving forces is exhibited across the different types of urban and rural settlements. The spatial growth of urban settlements is dominated by in situ expansion, while rural settlements tend to be scattered and shrinking rapidly. The sprawl of human settlements has mainly occupied farm land, but reclamation projects are increasingly becoming important land sources for urban settlements. Local government has played a critical role in urban settlements, while the expansion of rural settlements is mainly driven by individual choice and village collective organizations. Such differences may account for differential options for the management of human settlements scientifically.

1. Introduction

The important UN-HABITAT (United Nations Human Settlements Programme) conference, which was held in Vancouver in 1976, initiated ongoing progress in research on human settlements. The challenges of rapid urban transformation seen over the last three decades have been distinct and are presenting multidisciplinary scholars and managers in government with challenges that have never been faced before [1]. Land use and land cover change (LUCC) has been widely recognized as a key indicator in the field of global change [2,3]. Moreover, human settlements are considered an important issue of LUCC, with an extensive range of implications for ecosystem and environment conservation from human activity and construction land expansion due to rural–urban transformation [4,5,6]. The changes of human settlement closely reflect the dynamic interaction between humankind and the natural environment.
Researchers are focusing mainly on two regions, because of their potential vulnerability and the real challenges they represent. The first region is the coastal zone. A large body of work, using the principles and methods of landscape ecology, has explored the global characteristics of human settlements [7], monitoring LUCC [8], environmental change [9], climate change [10,11] and ecological effects [12]. The second region is urban development in developing countries. Most of the developed countries have entered the mature stage of urbanization, which has stabilized, so the focus of world urbanization has shifted to the developing countries. Most of the population growth expected in urban areas will be concentrated in the cities of the undeveloped regions, especially in Asia and Africa [13]. The study of human settlements mostly focuses on a number of aspects, including settlement evolution in the metropolitan region [14,15,16,17], informal settlements [18,19,20], modeling settlement patterns [21], socio-economic roles and sustainable management [22,23,24,25]. There is now a consensus that contemporary society faces a large problem with rapid habitation growth [26]. Recent studies have highlighted the importance of understanding human settlement dynamics for sustainability purposes. Most research has been concerned with the analysis of the effects of human settlement pattern change on the environment and ecology, while little has addressed the dynamic characteristics of human settlements, especially rural settlements [27,28]. More important is the scarcity of studies that analyze the differences between urban and rural settlements and the potential policy implications that these differences could have on a region from an integrated perspective. Therefore, further insight into the vital differences is required, and so this paper looks at the different patterns of change between urban and rural settlements, both in terms of dynamics and of driving forces, drawing on an example from a coastal area in east China, where rapid urbanization has occurred and rural-urban flow is dramatic. The paper analyzes the transformation by asking the following research questions: What is the difference in the spatial pattern change between urban and rural area at a regional scale? What is the role of driving forces and the differences between urban and rural settlements in shaping the different spatial development patterns?
To answer the above questions, an interdisciplinary methodology for identifying the spatio-temporal characteristics and driving forces is applied to compare different types of urban and rural settlements. The main aim is to examine the dynamics of human settlements, what kind of land use forms are changing into residential land, and the socio-economic-institutional driving mechanisms. This will help decision-makers to form rational policies for sustainable development of human settlements in the study area and other similar fast-developing regions. The study area lies in China’s coastal region, which has characteristics of both ecological vulnerability and rapid rural-urban transition.

2. Materials and Methods
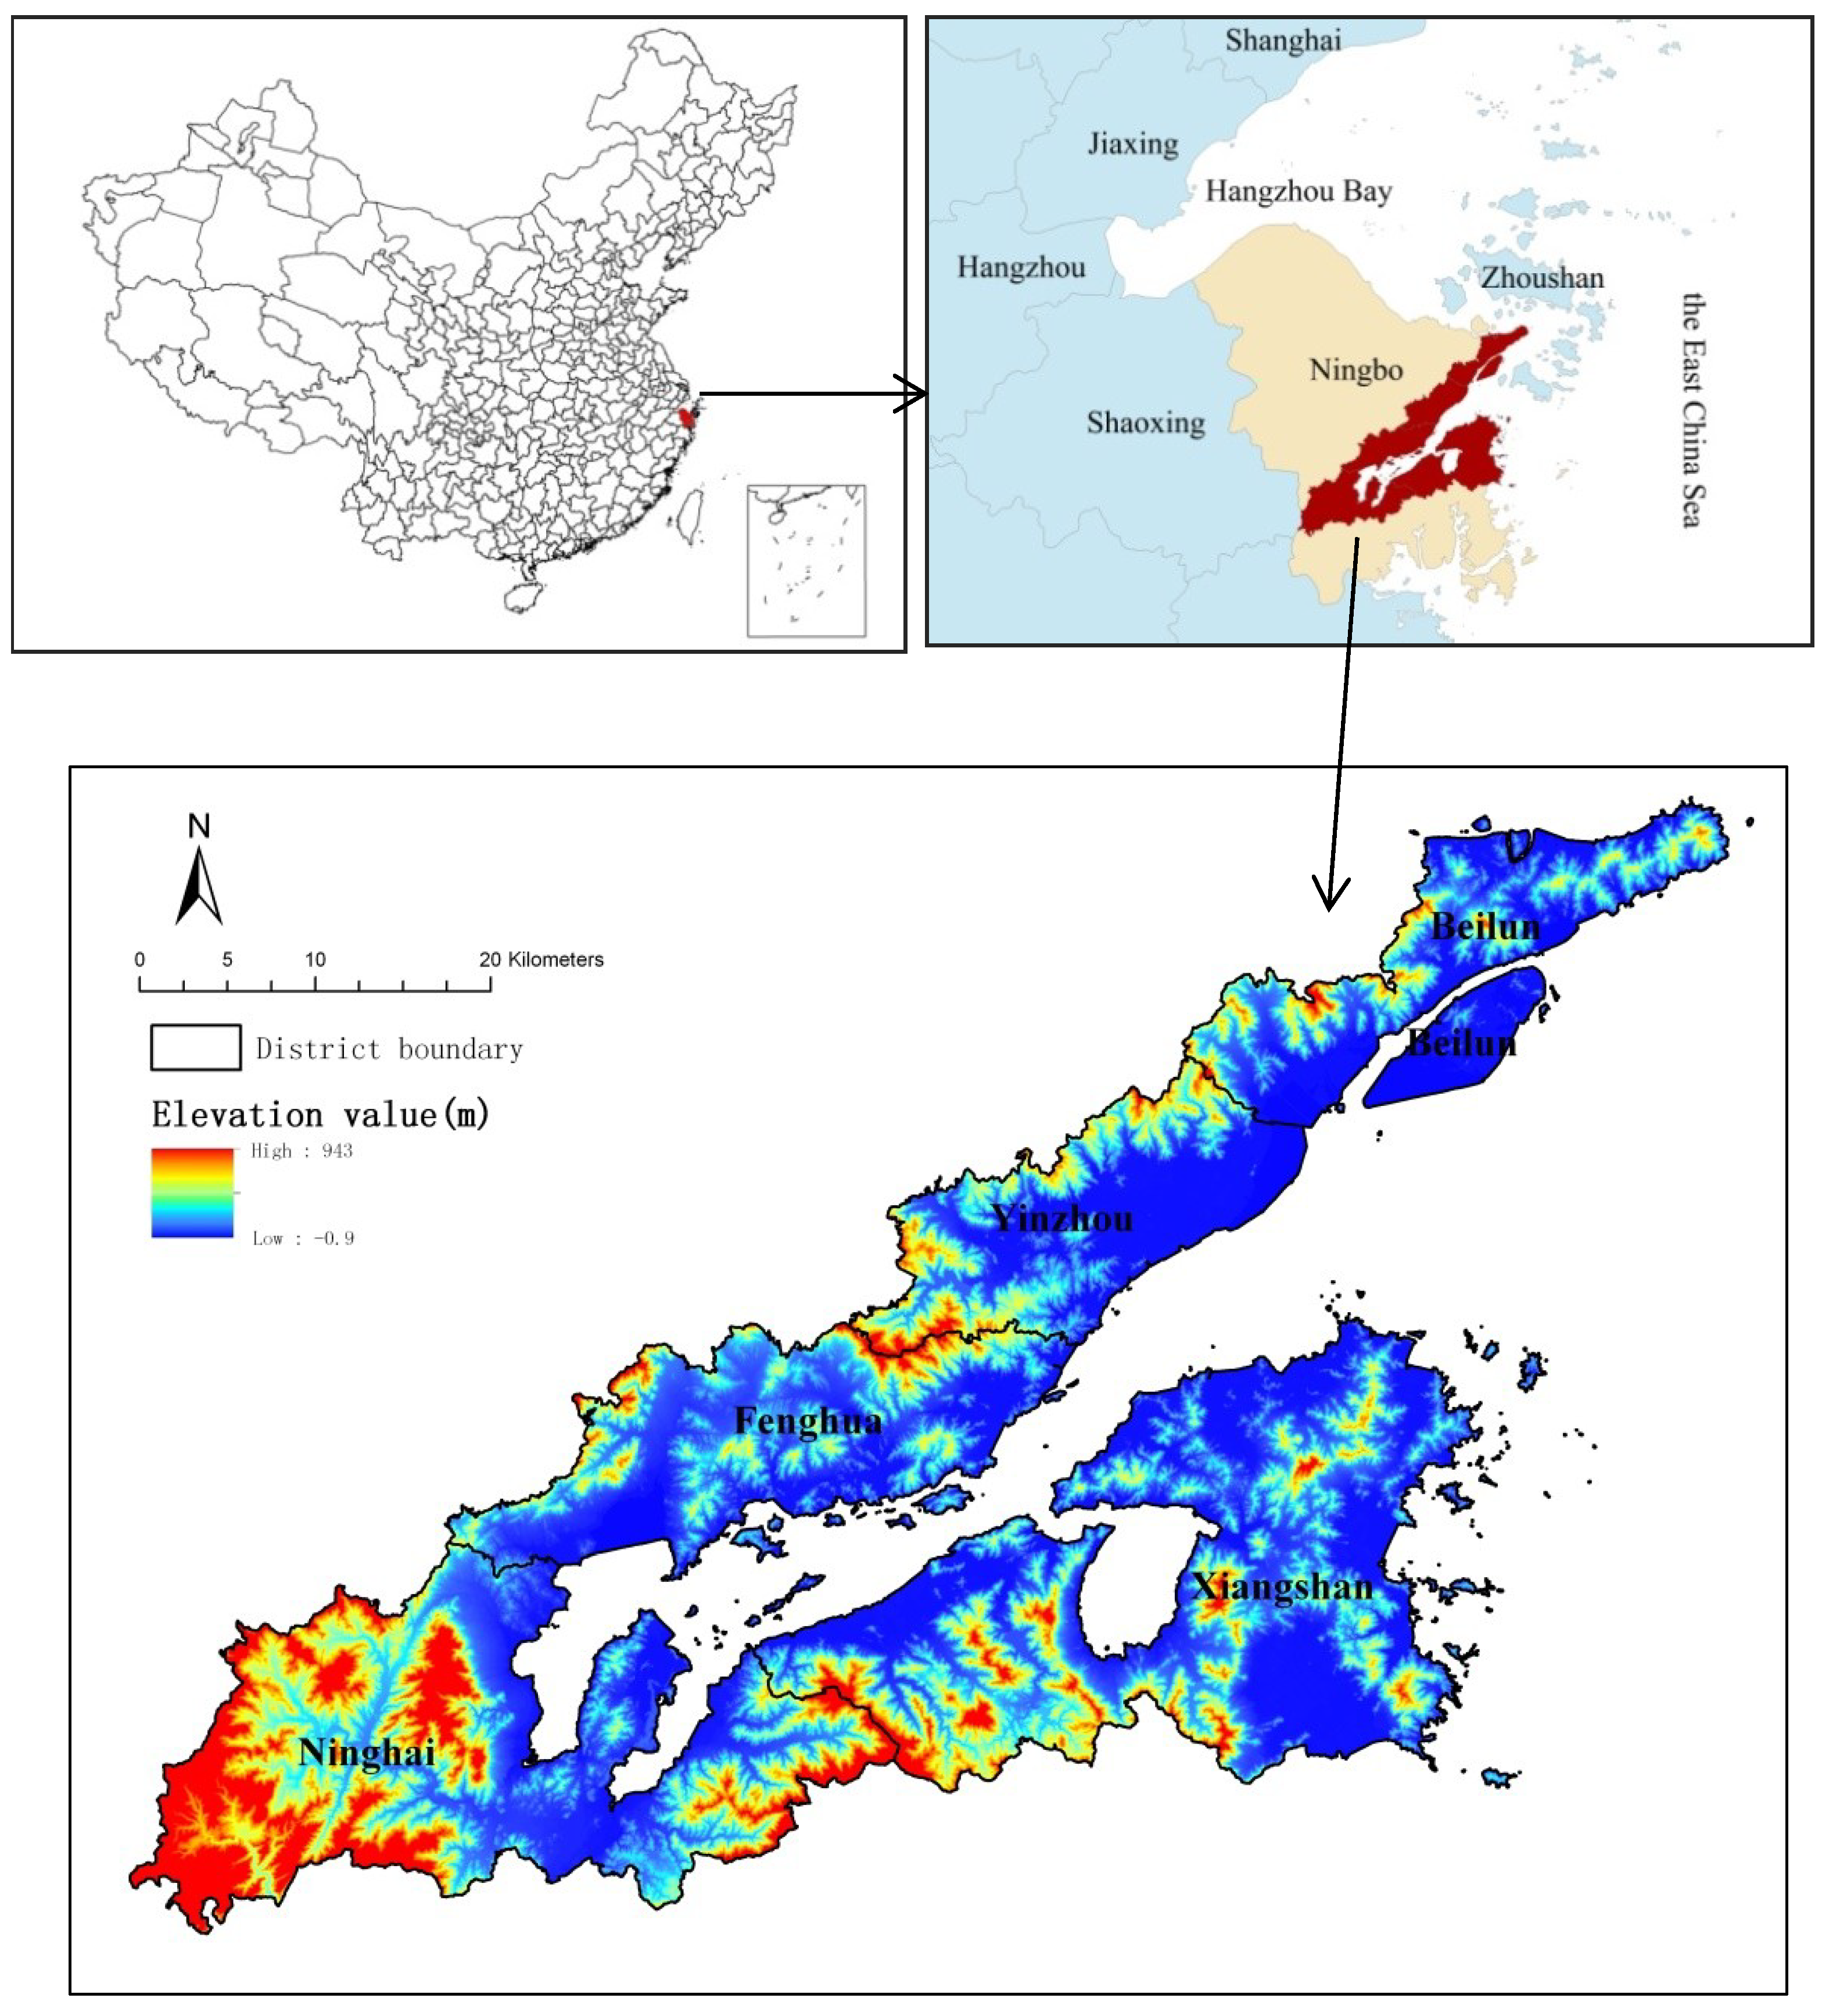
2.1. Study Area

Ningbo is the second-largest city in Zhejiang Province, located in the middle of the coast of the Chinese Mainland, southeast of the Yangtze River Delta and facing the East China Sea. It covers an area of 9816 km2, and is separated by Hangzhou Bay from Shanghai (China’s central city of economy and finance), Hangzhou (the capital of Zhejiang Province) and Jiaxing (Figure 1). Due to its location, Ningbo has been an important port city for foreign trade, and has achieved great progress in economic development. In 2011, the GDP per capita of Ningbo amounted to 104,485RMB¥, which was much higher than China’s average level (35,083RMB¥) in the same period, according to the National Bureau of Statistics of China and Ningbo Statistical Yearbook in 2012. This growth has been accompanied by rapid population increase.
Figure 1. Study area and its location in China.
Sustainability 06 01848 g001
While industrialization and urbanization have reached a relatively high level, the diffusion effect of economic development has been greater than the agglomeration effect. The developing region will receive more attention through favorable policies [4,29]. In 2005, the government of Ningbo introduced the plan of “Nantongchou”, which means that the government speeds up the development stage of the region and makes efforts to narrow the gap between the Ningbo metropolitan area and its southern region of Xiangshangang. Our study area is the Xiangshangang region, the main focus of the “Nantongchou” plan, and also the urbanization of the sub-core region in Ningbo, located along the southeast coastline. The Xiangshangang region, with the five districts (all of the same administrative level) of Beilun, Yinzhou, Fenghua, Ninghai and Xiangshan, covers a land area of 1774 km2, accounting for 18% of the area of Ningbo. The total population of study area is 804,000.7, 10.58% of the total population of Ningbo.

2.2. Data and Methods

In this section, three concepts are reviewed relating to settlement over time: human settlement, urban settlement and rural settlement. The generally accepted definition of human settlement is the totality of the human community—whether city, town or village—with the social, material, organizational, spiritual and cultural elements, as reported in the Vancouver declaration on human settlements. In short, human settlement means a place where people live and work, in diverse sizes: cities, towns, villages, or other agglomerations of buildings. An urban settlement is an area with a high population density and large size, where the people are occupied in non-agricultural industries. On the other hand, a rural settlement has a lower population density and size, and the inhabitants are engaged in agricultural production. It is proposed that human settlements are key factors in sustainable development [30]. Although the three concepts seem clear, it is not always straightforward in practice to divide settlements into urban and rural. First, without a global unified standard, many countries have developed different versions of the standard urban area. In some countries, urban boundaries are drawn liberally, while other countries draw their city boundaries tightly [31,32]. Second, the big challenge is that widespread peri-urbanization has taken place in developing regions, with great complexity of spatial and social situations. Additionally, many scholars have raised serious doubts about the accuracy and reliability of China’s official statistics in connection with the economy [33], energy [34] and urban population [35,36], etc. Therefore, because data reliability is critical to the quality of empirical research, these issues must be treated carefully. By defining our research in a specific region and over a short period, the harmful effect of different urban definitions can be largely eliminated. To answer the second problem, we used survey and mapping data to replace the more common remote sensing images. Although the latter is sophisticated and useful for interpreting the land use change [28,37,38] and the human distribution [39], it cannot identify, for example, the social dimensions of settlements. The land use and development intensity are easy to identify from high-definition remote images, but we get no information about the land’s properties. However, the social dimension link to the spatial settlements is helpful for dividing the urban and rural settlements in peri-urbanization areas.
The analysis of urban and rural settlement change in this study is based on official land use data that have been provided by the Ningbo Municipal Bureau of Land and Resources from 2005 and 2009 at a 1:100,000 scale. Although China’s official statistics data are often questioned, the land use survey data of China’s land ministry is obtained by professional surveys and mapping, and is widely used for scientific research [40,41,42,43]. To meet an urgent need for accurate and reliable data on China’s land use, a large-scale national land survey was commissioned by the State Council of China and executed by China’s land ministry twice, in 1996 and 2009. The purpose of the nation-wide survey was to gather systematic national data on the types, area, and location of land use, as well as the distribution of land ownerships. Field surveys were the primary method for obtaining data on land use, aided by aerial photographs and remote images [42,43]. There were 33 LULC (Land Use/Land Cover) types (urban settlements, rural settlements and other land use types) in the original LULC datasets. In this paper, however, the focus is on the pattern change of human settlements. Therefore, we reclassified the original LULC types into 13 classes: urban settlements, rural settlements, woodland, water, salt pan, rain paddy, special land, tidal flat, garden plot, grassland, river land, unirrigated farmland, and irrigated farmland. China’s national land use survey created a standardized land classification scheme [41]. In constructing the land use data set, the principle of the Chinese urban-rural divide is based on administrative divisions. The Residents Committee is the minimum urban administrative unit of the urban area, and the Villagers Committee is the rural equivalent. Urban settlements are defined as built-up areas that include all the land area of the Residents Committee. Rural settlements, also called rural housing land, refer to the land utilized by residents in the Villagers Committee for dwelling, i.e., land for building houses and other structures or facilities [28]. The two types of settlement in China are differentiated by the current administrative divisions, which also have a number of underlying determinants of their size, population density, and employment.
Additionally, coastal reclamation in the study area was obtained through analysis of historical Landsat ETM + imagery from 2003, from the Data Center of Resources and Environmental Sciences of the Institute of Geographic Sciences and Natural Resources Research of the Chinese Academy of Sciences.
It is well accepted that GIS and associated analytical software have played a critical role in spatial pattern analysis in many areas [44], and that they are effective in exploring the spatial patterns of human settlements. The spatial analyst function of ArcGIS software was used to analyze land use/land cover changes over time in Xiangshangang, combining data from 2005 and 2009 to interpret spatial growth of human settlements.
The theory and application of landscape ecology have developed greatly since the 1980s, marked by the foundation of the International Association for Landscape Ecology (IALE). There has been associated development of indices and quantitative methods for examining the interactions of natural systems and processes, and many of these metrics are closely correlated [45]. In this analysis of the changing patterns of human settlements at the regional level, three types of metrics—Shape Metrics, Edge Metrics, and Patch Density and Size Metrics—and nine indices-area weighted mean shape I (AWMSI), mean perimeter-area ratio (MPAR), area weighted mean patch fractal dimension (AWMPFD), total edge (TE), mean patch edge (MPE), mean patch size (MPS), number of patches (NumP), median patch size (MedPS) and total core area (CA) (Table 1)—are used for quantitative analysis of Xiangshangang’s human settlements. The calculation of landscape indices was completed by Patch Analyst extension, which was built up around ESRI’s ArcGIS software that facilitates spatial pattern analysis of landscapes [46,47].
Table 1. Landscape metrics to describe the pattern of human settlements.
Landscape metricIndexDescription
Shape MetricsAWMSIArea weighted mean shape I
MPARMean perimeter-area Ratio
AWMPFDArea weighted mean patch fractal dimension
Edge MetricsTETotal edge
MPEMean patch edge
Patch Density & Size MetricsMPSMean patch size
NumPNumber of patches
MedPSMedian patch size
CATotal core area

3. Results

3.1. The Growth of Regional Settlements

In 2005–2009, the number and area of human settlements in Xiangshangang increased substantially. The number of urban and rural settlements increases from 303 to 958—an increase rate of 216.2%. The area of residential development expanded from 91.89 km2 to 140.53 km2—an increase rate of 52.9% (Table 2). The area of human settlements in Xiangshangang will have doubled in less than 10 years at the present rate of increase.
Table 2. States of urban and rural settlements in 2005 and 2009.
Index20052009
RegionUrbanRuralRegionUrbanRural
ValueRatio (%)ValueRatio (%)ValueRatio (%)ValueRatio (%)
Plots number303237.5928092.4195816517.2279382.78
Area (km2)91.8926.3728.7065.5271.30140.5370.6750.2869.8649.72
The increase in the number of urban settlements is 142, which is far less than the increase in rural settlements, which is 513. The increasing area is dominated by urban settlements, which has reached 44.3 km2, whereas rural settlements account for only 4.34 km2. Thus, although Xiangshangang was dominated by rural settlements (71.3%) in 2005, subsequent urban expansion means that the area of urban settlements was equal to that of rural settlements by 2009 (Figure 2).
At the district scale, it is found that in Beilun, Ninghai and Xiangshan, human settlements increased rapidly, in similar proportion, with their areas reaching, 35.69 km2 in total, an increase of 73.36%. Fenghua took fourth place, followed by Yinzhou. The increase of urban settlements occurred mainly in Xiangshan, Beilun and Ninghai, accounting for 90.4% of the overall growth, whereas the increase of rural settlements mainly happened in Fenghua, with an increase of 7.94 km2. However, the area of rural settlements decreased by 8.33 km2 in Xiangshan. It can be seen from Table 3 that the increasing proportion of urban settlements reached 91.08%. Two different modes of increase were present in the five districts: first, a proportionally larger increase of urban settlements, which covered Xiangshan, Beilun, Yinzhou and Ninghai, all greater than 75%; second, a proportionally larger increase in rural settlements, which only applied to Fenghua, with an increase of more than 90%.
Figure 2. Changes of urban and rural settlements in year 2005–2009. (a) Number of settlements; (b) Area of settlements.
Sustainability 06 01848 g002
Table 3. Growth differences of human settlements in 2005–2009 at districts scale.
Sub-regionRegion
(km2)
District ratio
(%)
Urban
(km2)
District ratio
(%)
Rural
(km2)
Urban ratio
(%)
Rural ratio
(%)
Beilun12.5825.8511.3725.661.2190.399.61
Yinzhou4.419.063.648.220.7782.6417.36
Fenghua8.5517.570.611.387.947.1592.85
Xiangshan11.4923.6219.8144.72−8.33172.47−72.47
Ninghai11.6223.898.8720.022.7576.3023.70
Sum48.6510044.31100.004.3491.088.92

3.2. Landscape Characteristics and Spatial Pattern of Urban and Rural Settlements

3.2.1. Values of Landscape Parameters

The values of landscape pattern parameters of human settlements in 2009 and 2005 are given in three ways—Shape Metrics, Edge Metrics, and Patch Density and Size Metrics—in Table 4.
From the perspective of shape parameters, the index values of AWMSI, MPAR and AWMPFD of urban and rural settlements all show a rising trend in Xiangshangang, which shows that the degree of shape complexity of human settlements is increasing, and the spatial pattern is becoming more and more irregular. In terms of edge parameters, TE presents an obvious rising trend, while MPE is decreasing: TE has increased from 753,953 m in 2005 to 1,710,458 m in 2009, with TE of urban settlements increasing by 416,462 m and rural settlements increasing by 540,042 m, with the perimeter increases amounting to 43.5% and 56.5%, respectively. From the position of the density and size parameter, NumP and CA have increased in Xiangshangang substantially. MPS and MedPS are the crushing degree of landscape, and the average scale of all human settlements has decreased from 30.33 ha to 14.67 ha (51.6%). MedPS has also decreased rapidly to 5.9 ha from 17.66 ha (66.6%).
Table 4. Indexes of Landscape characteristics of human settlements in 2005 and 2009.
YearClassShape MetricsEdge MetricsPatch Density & Size Metrics
2005Region1.55104.841.26753,953248830.3330317.669189
rural1.49108.071.26624,821223223.4028016.876552
urban1.7065.451.25129,1325614114.642364.882637
Beilun1.53107.831.2689,426235324.923816.55947
Yinzhou1.50102.361.2590,160250431.663618.621140
Xiangshan1.61106.831.26317,085243930.4813016.983962
Fenghua1.5295.341.2580,557298439.692723.431072
Ninghai1.49104.471.25176,725245528.727219.132068
2009Region1.99275.641.291,710,458178514.679585.9014,053
rural1.70294.171.301,164,86314698.817935.076986
urban2.28186.541.29545,594330742.8316512.377067
Beilun1.82305.251.28264,338163213.611623.592205
Yinzhou1.67206.751.28199,337203416.13989.081580
Xiangshan2.32238.711.30534,505193018.452776.465111
Fenghua1.72383.641.29258,070170912.761515.671926
Ninghai1.91260.351.30454,209168211.962705.423230
Note: ① AWMSI; ② MPAR; ③ AWMPFD; ④ TE; ⑤ MPE; ⑥ MPS; ⑦ NumP; ⑧ MedPS; ⑨ CA.
The changing trend in the five districts stays the same throughout the region. Landscape complexity and the total area of human settlements have increased, while the average area of the single human settlement has decreased. Xiangshan ranks first among the district in these changes, with the area increasing to 5111 from 3962, with the proportional area decreasing to 36.4% from 43.1%. The area of single settlement is relatively small in Ninghai and Beilun. Ninghai has the smallest value of MPS (11.96) and Beilun has the smallest MedPS (3.59).

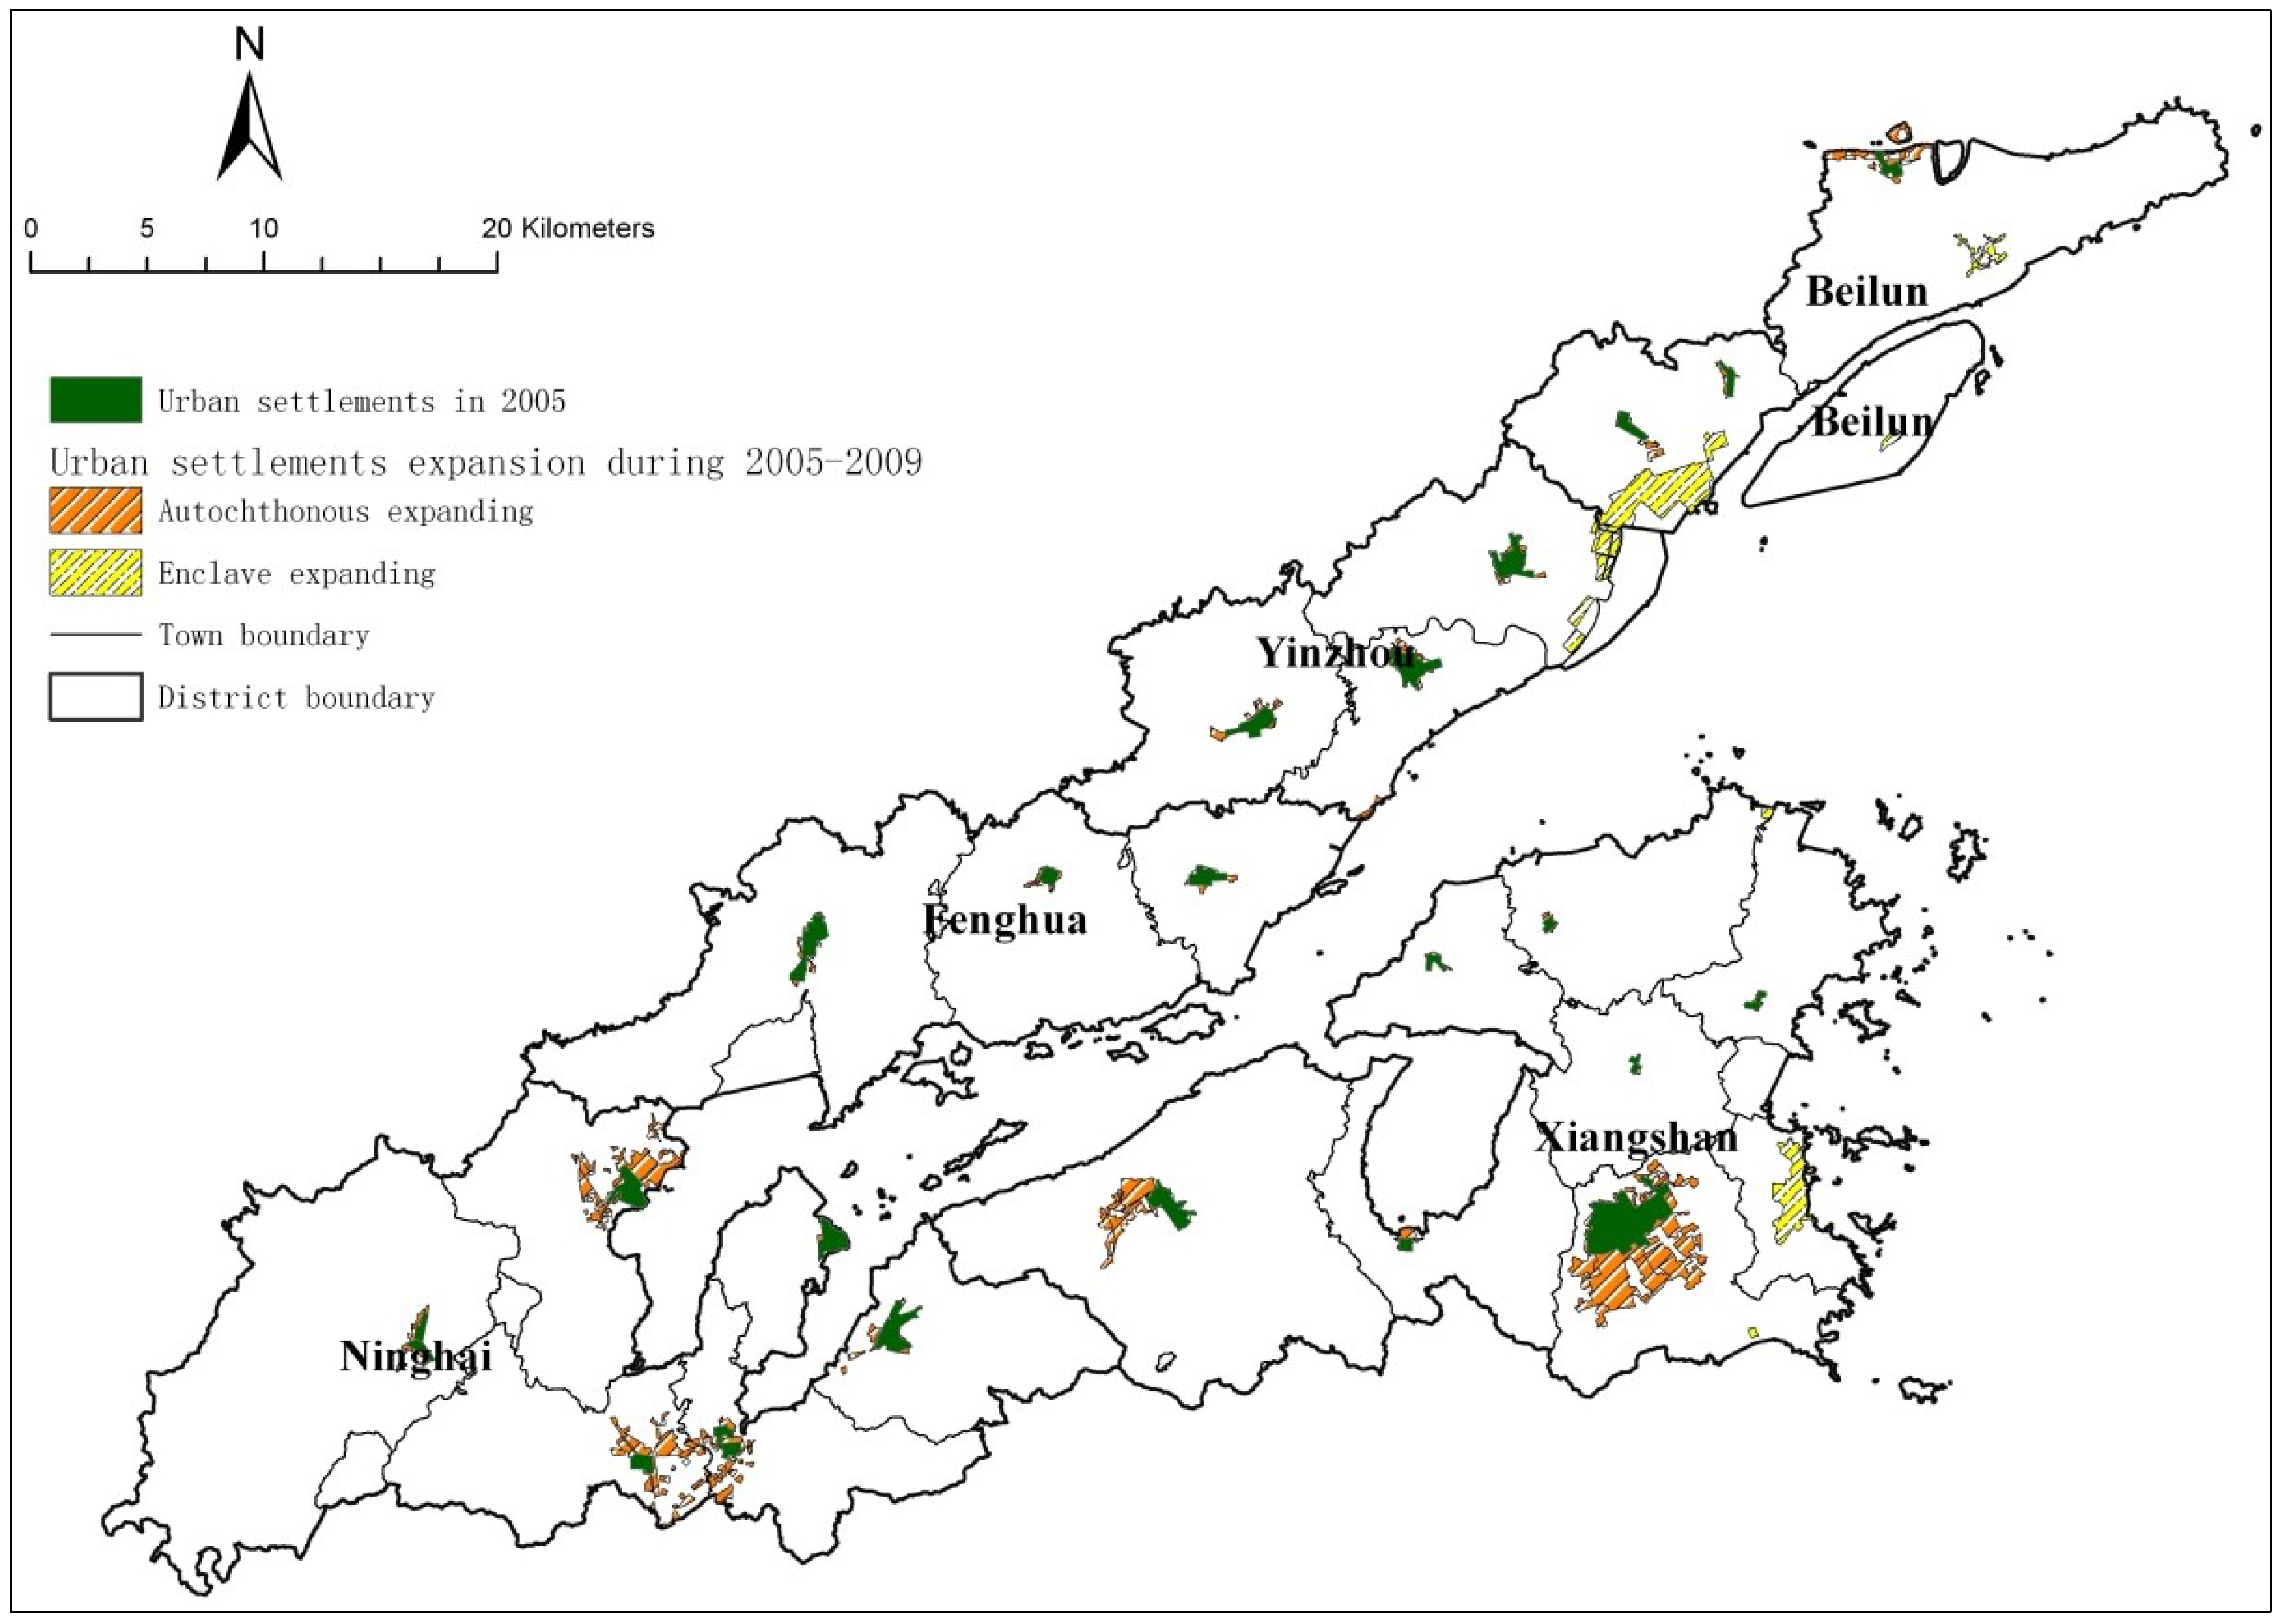
3.2.2. The Spatial Expansion of Urban Settlements

According to the spatial characteristics of settlement expansion, urban settlements can be divided into in-situ expansion and enclave expansion: the former is the successive expansion around existing urban settlements, and the latter is the development of new towns, separate from the original urban settlements. The urban settlements in Xiangshangang during 2005–2009 are selected for overlay analysis based on GIS software, and the analysis results are shown in Figure 3. There are 24 towns within the research region, of which 18 towns (75%) represent in-situ expansion, while only six towns (Chunxiao Town, Meishan Town, Baifeng Town, Zhanqi Town in Yinzhou and Juexi Town and Xianxiang Town in Xiangshan) are enclave developments (25%). In 2005–2009, the total expansion area of urban settlements was 44.3 km2, with in-situ expansion increasing by 27.69 km2 (62.5%), with an average expansion area, between 18 in-situ expansion towns, of 1.54 km2. Enclave area expansion has increased by 16.61 km2 (37.5%), with an average expansion area among the 6 enclave expansion towns of 2.77 km2. The enclave expansion is double the in-situ expansion, and has greater potential land use. In terms of towns, the average area per town within the research region increased from 1.1 km2 in 2005 to 2.9 km2 in 2009, an increase of 2.6 times.
Figure 3. Expanding of urban settlements during 2005–2009.
Sustainability 06 01848 g003

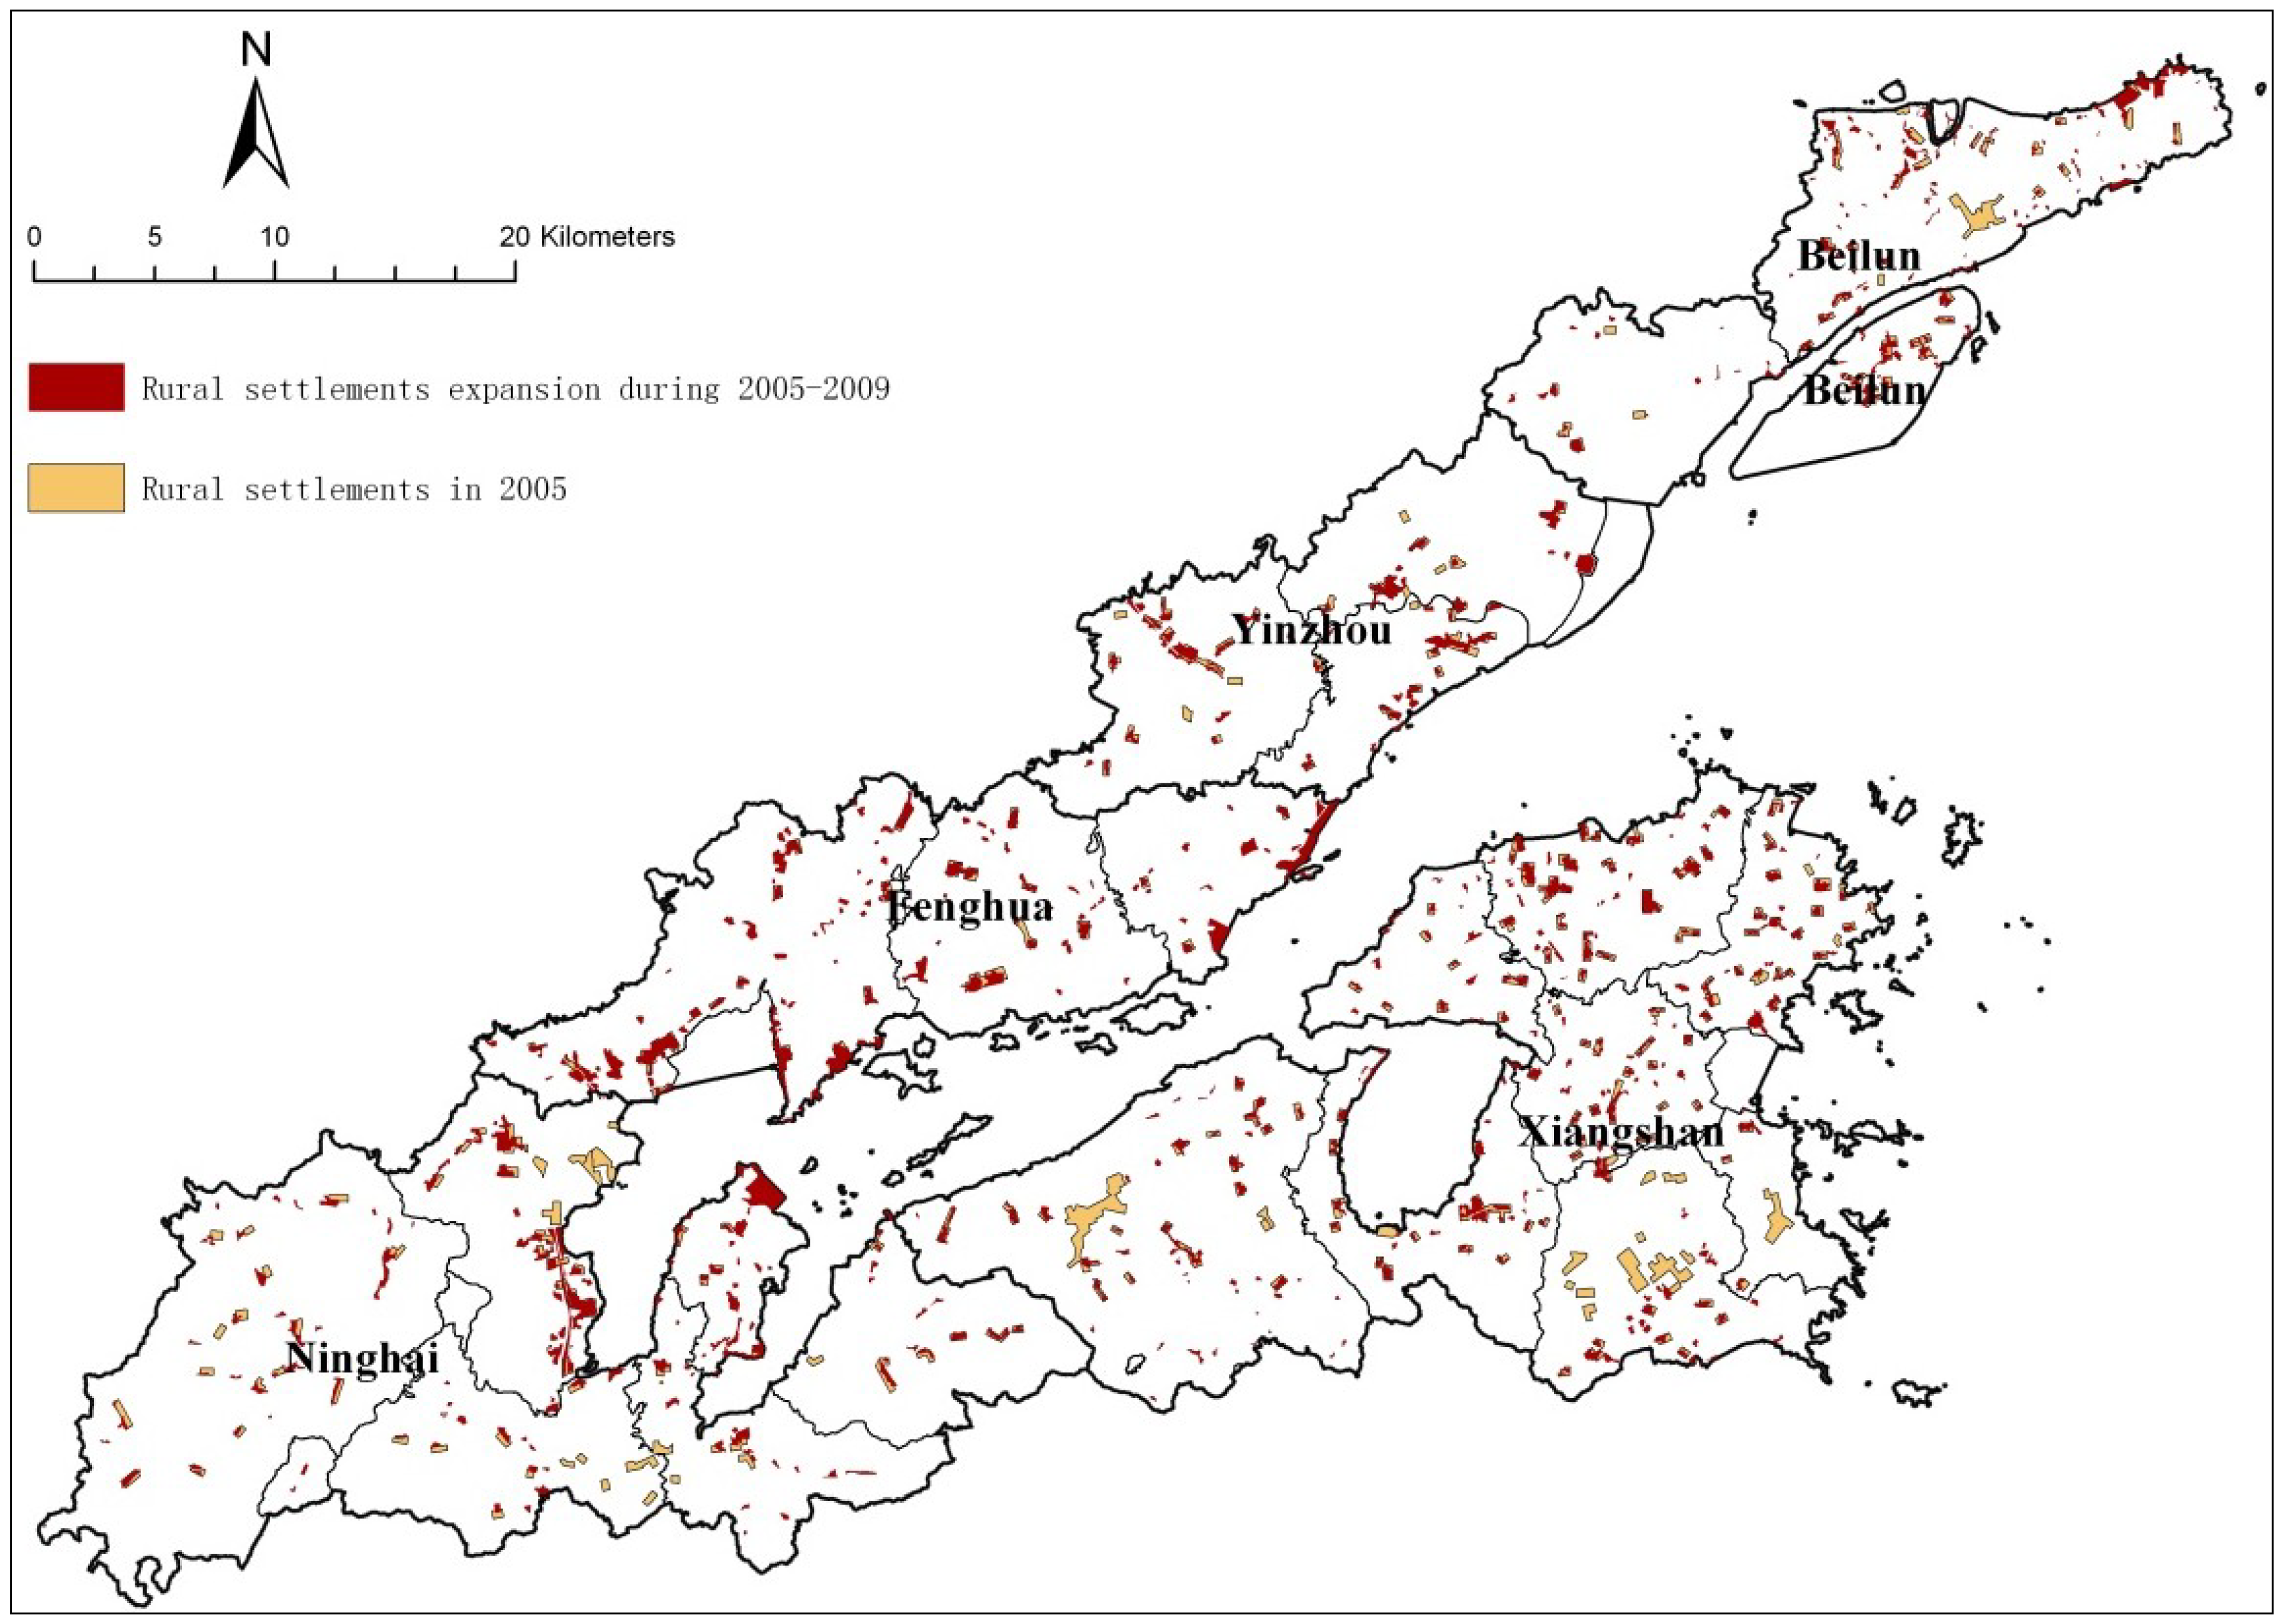
3.2.3. The Spatial Expansion of Rural Settlements

Rural settlements tend to be scattered and small, with average area per settlement decreasing rapidly from 23.40 ha to 8.81 ha. In 2005–2009, the number of rural residential points, NumP, has increased from 280 to 793; while the total area only increased from 65.52 km2 to 69.86 km2. The MPAR index has increased from 108 m/ha to 294 m/ha, and AWMSI increased from 1.5 to 1.7. It can also be seen in Figure 4 that the distribution of rural settlements is more extensive, rural settlements tend to be scattered and small, and the landscape pattern is more complex and irregular.
The land survey data show the area of rural settlements has only increased by 4.34 km2 in 2005–2009. By further inspecting the dynamic of rural settlements, it can be discovered that the area of rural settlements that was expanded outside the origin reached 41.03 km2 in 2005–2009 via ArcGIS spatial analysis. However, since quite a lot of rural settlements have turned into urban settlements, it is easy to obtain a wrong impression that the rural settlements have not changed much. Such results show that rural settlements in Xiangshangang in the past few years have changed greatly, and the area of the newly expanded rural settlements is excessively large and quite scattered, which causes a big problem for the intensive and economical utilization of land, and deserves attention and caution from policy research.
Figure 4. Expanding of rural settlements during 2005–2009.
Sustainability 06 01848 g004

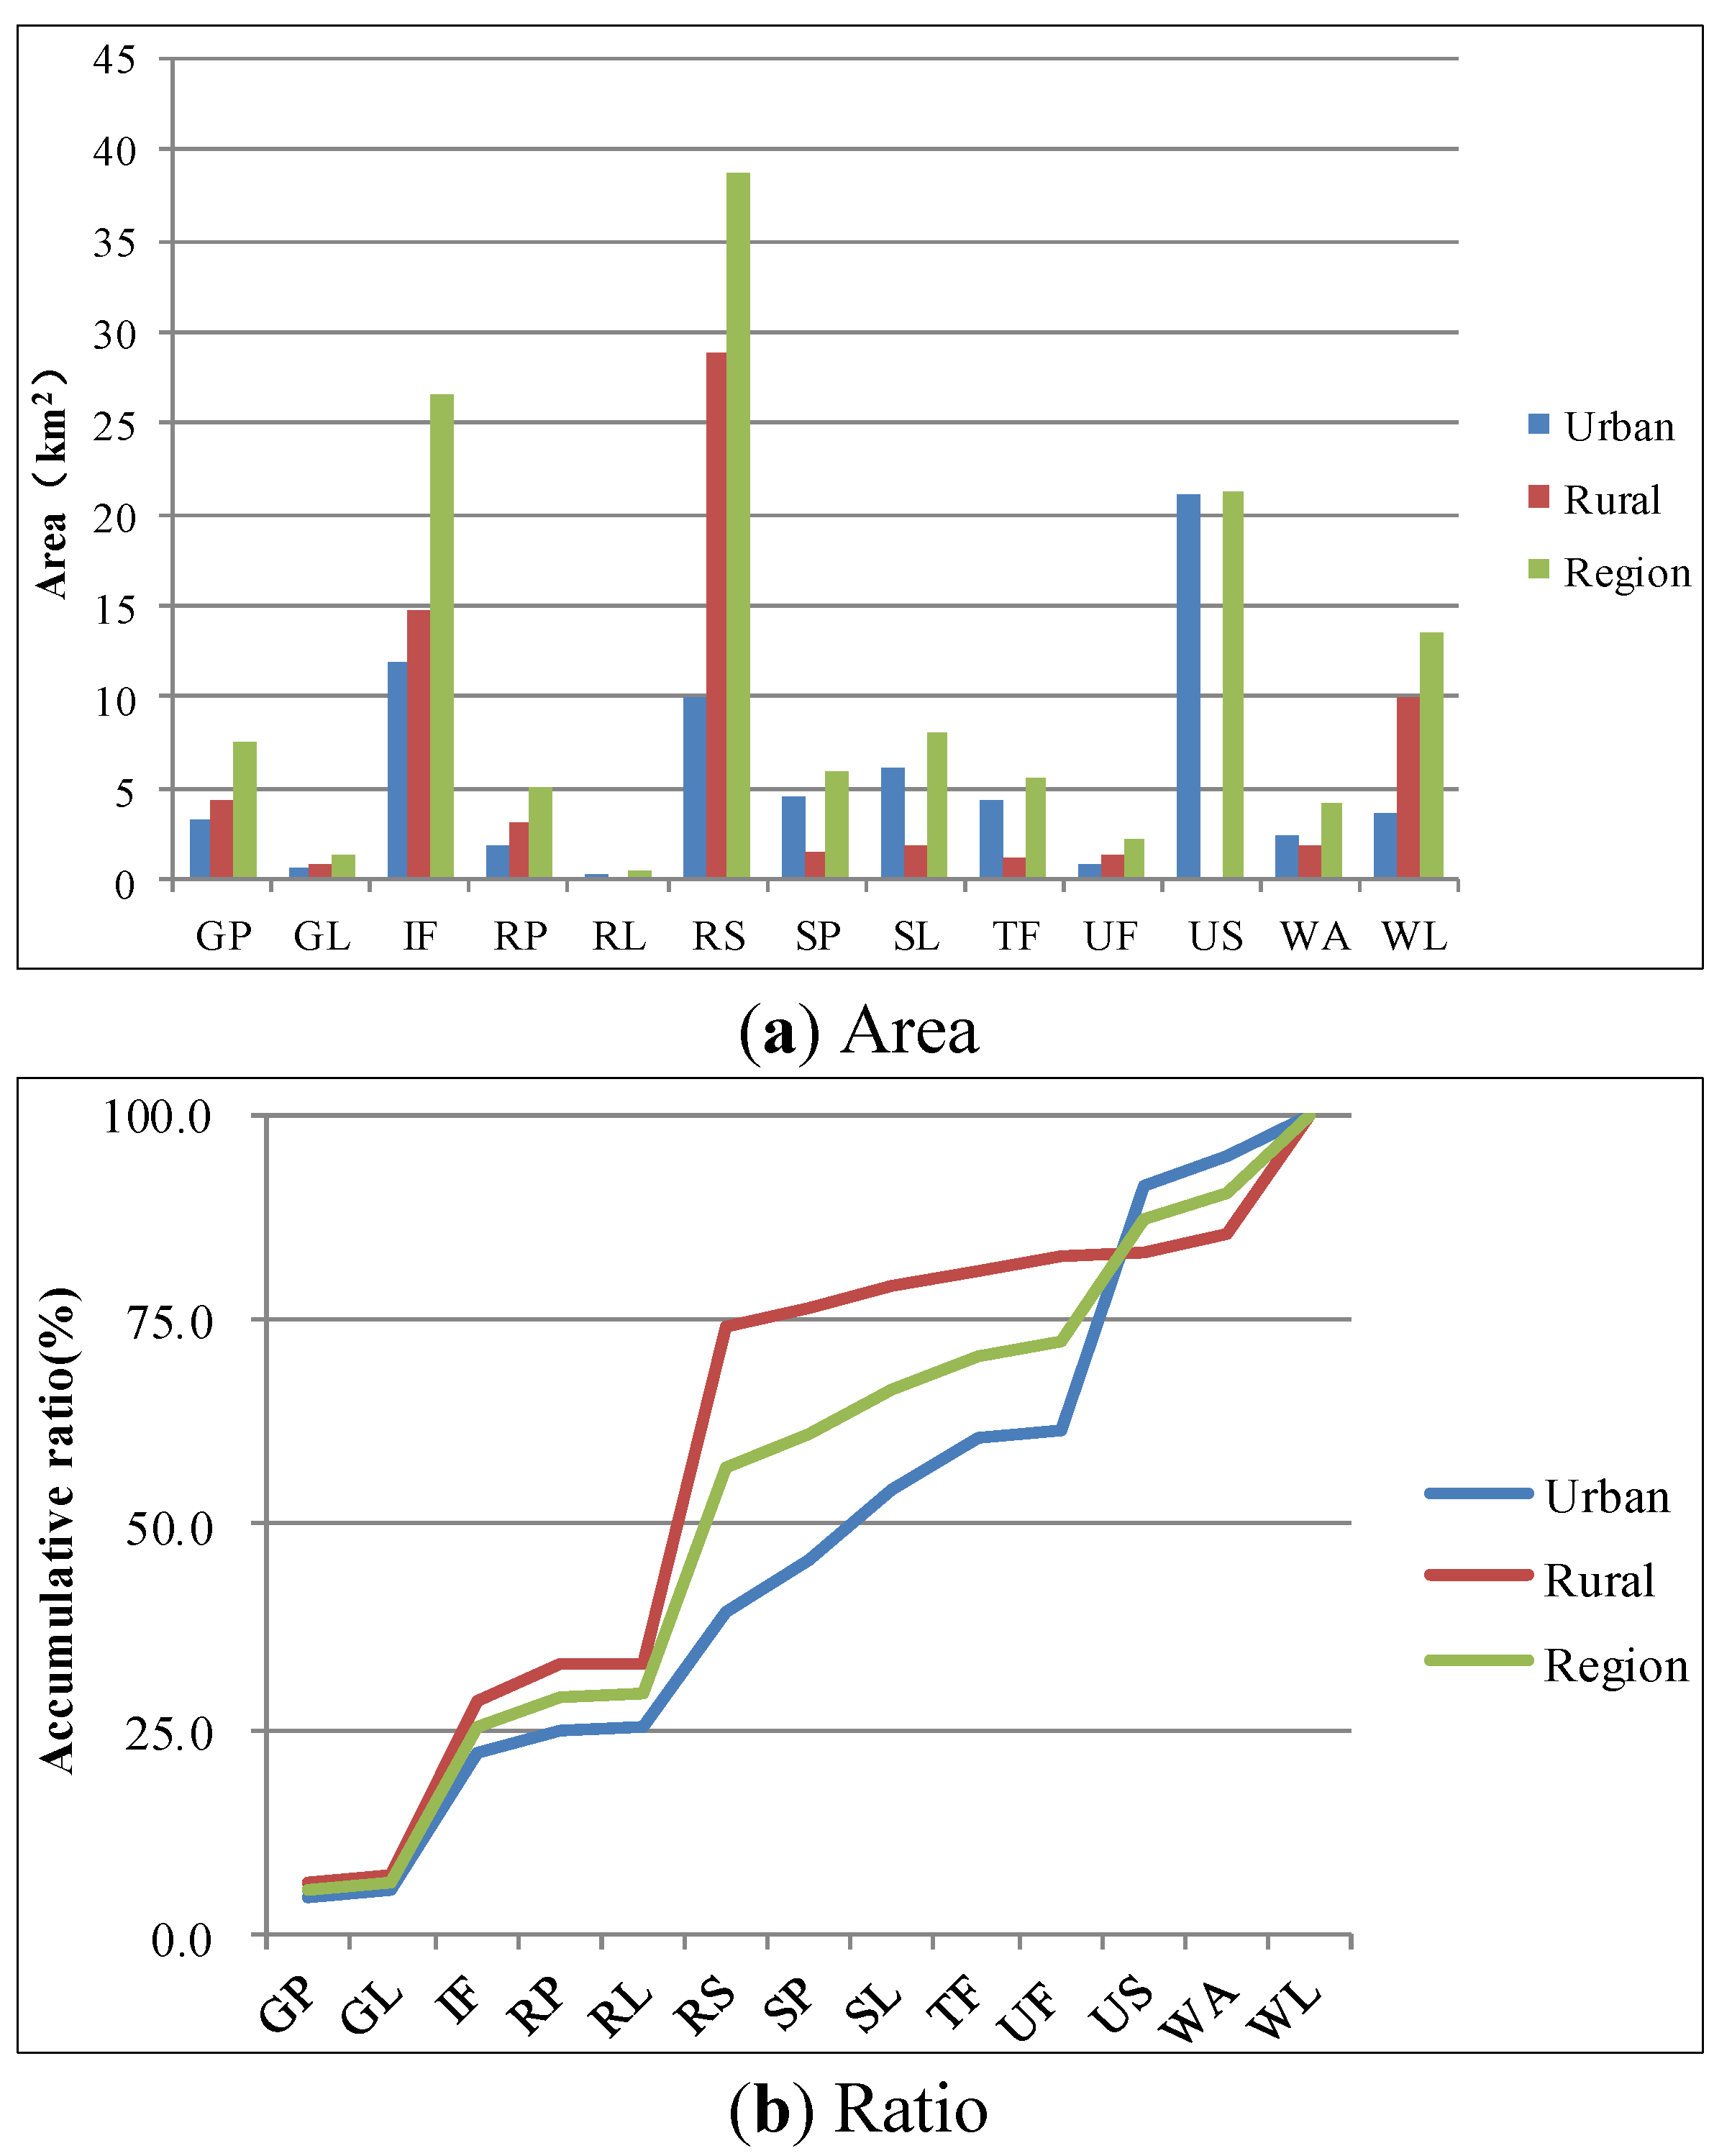
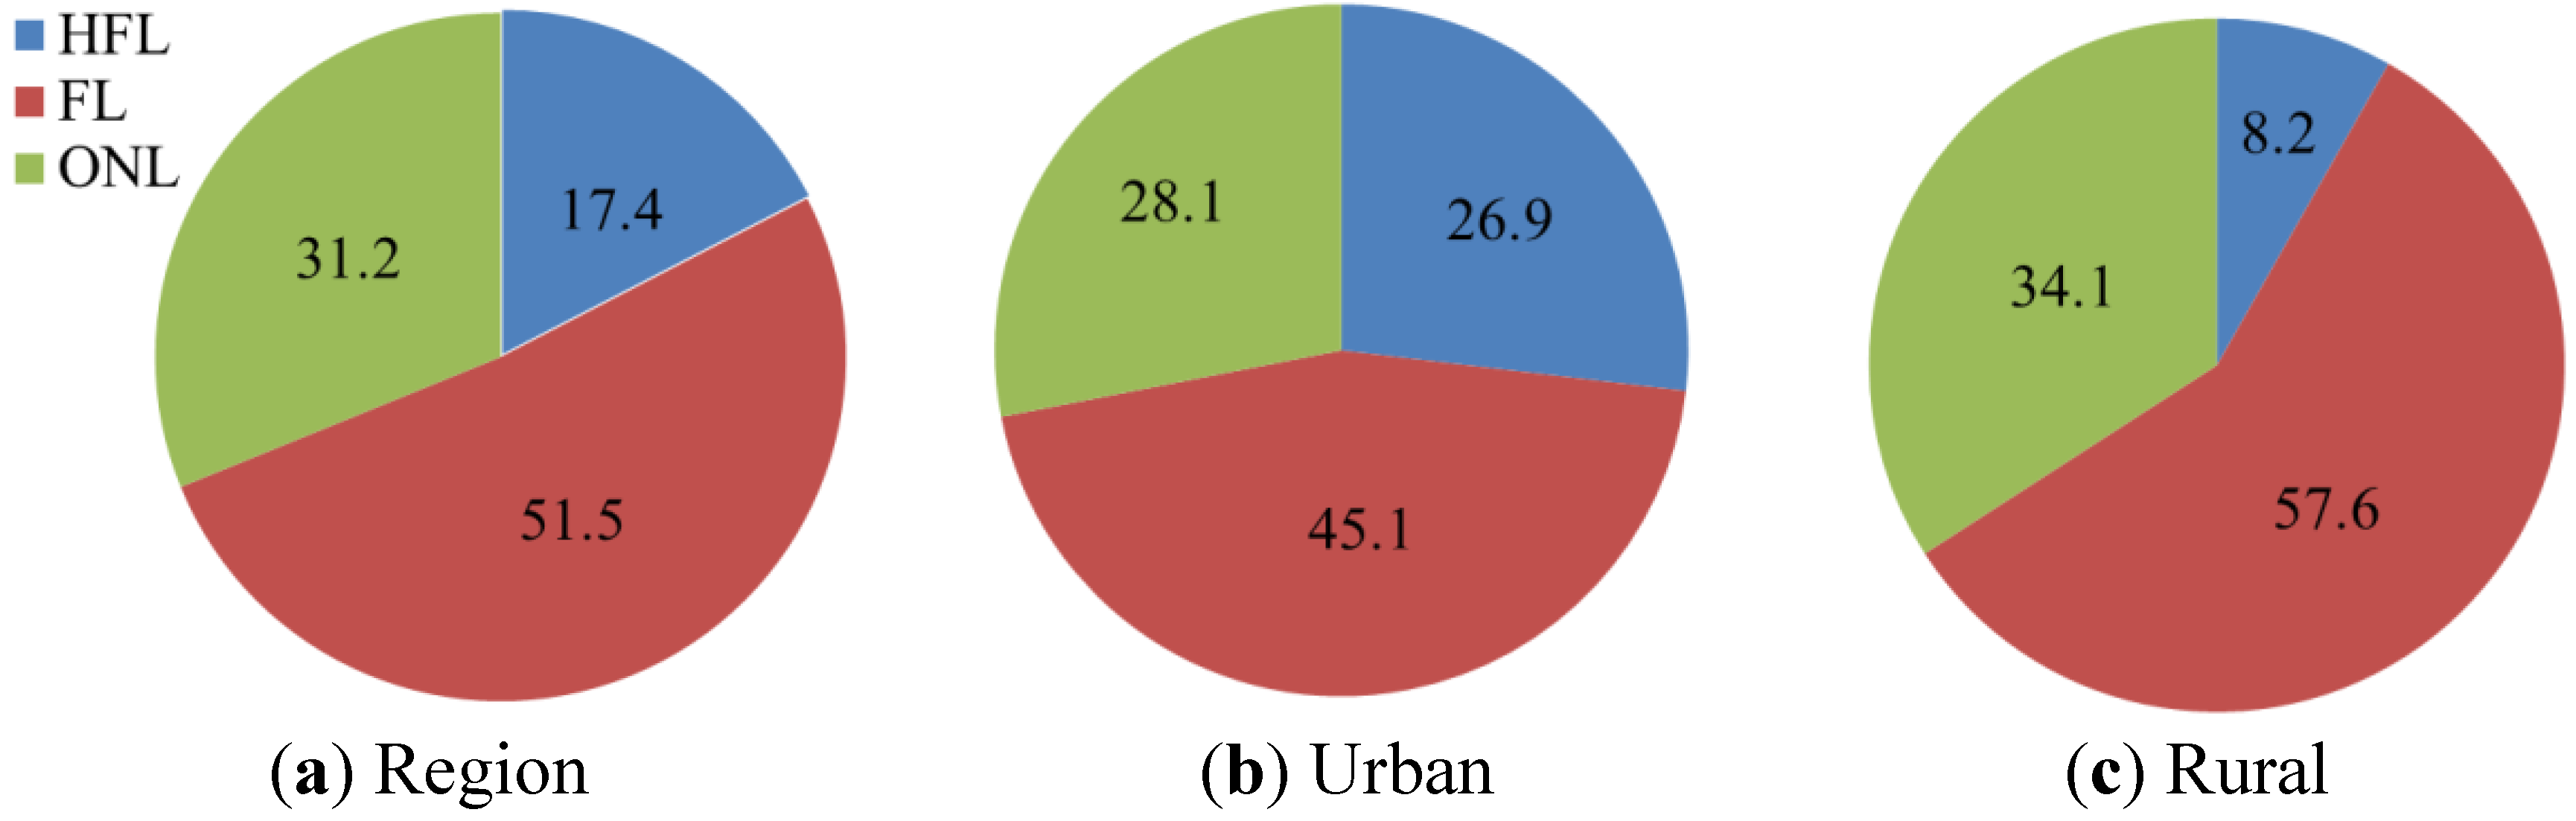
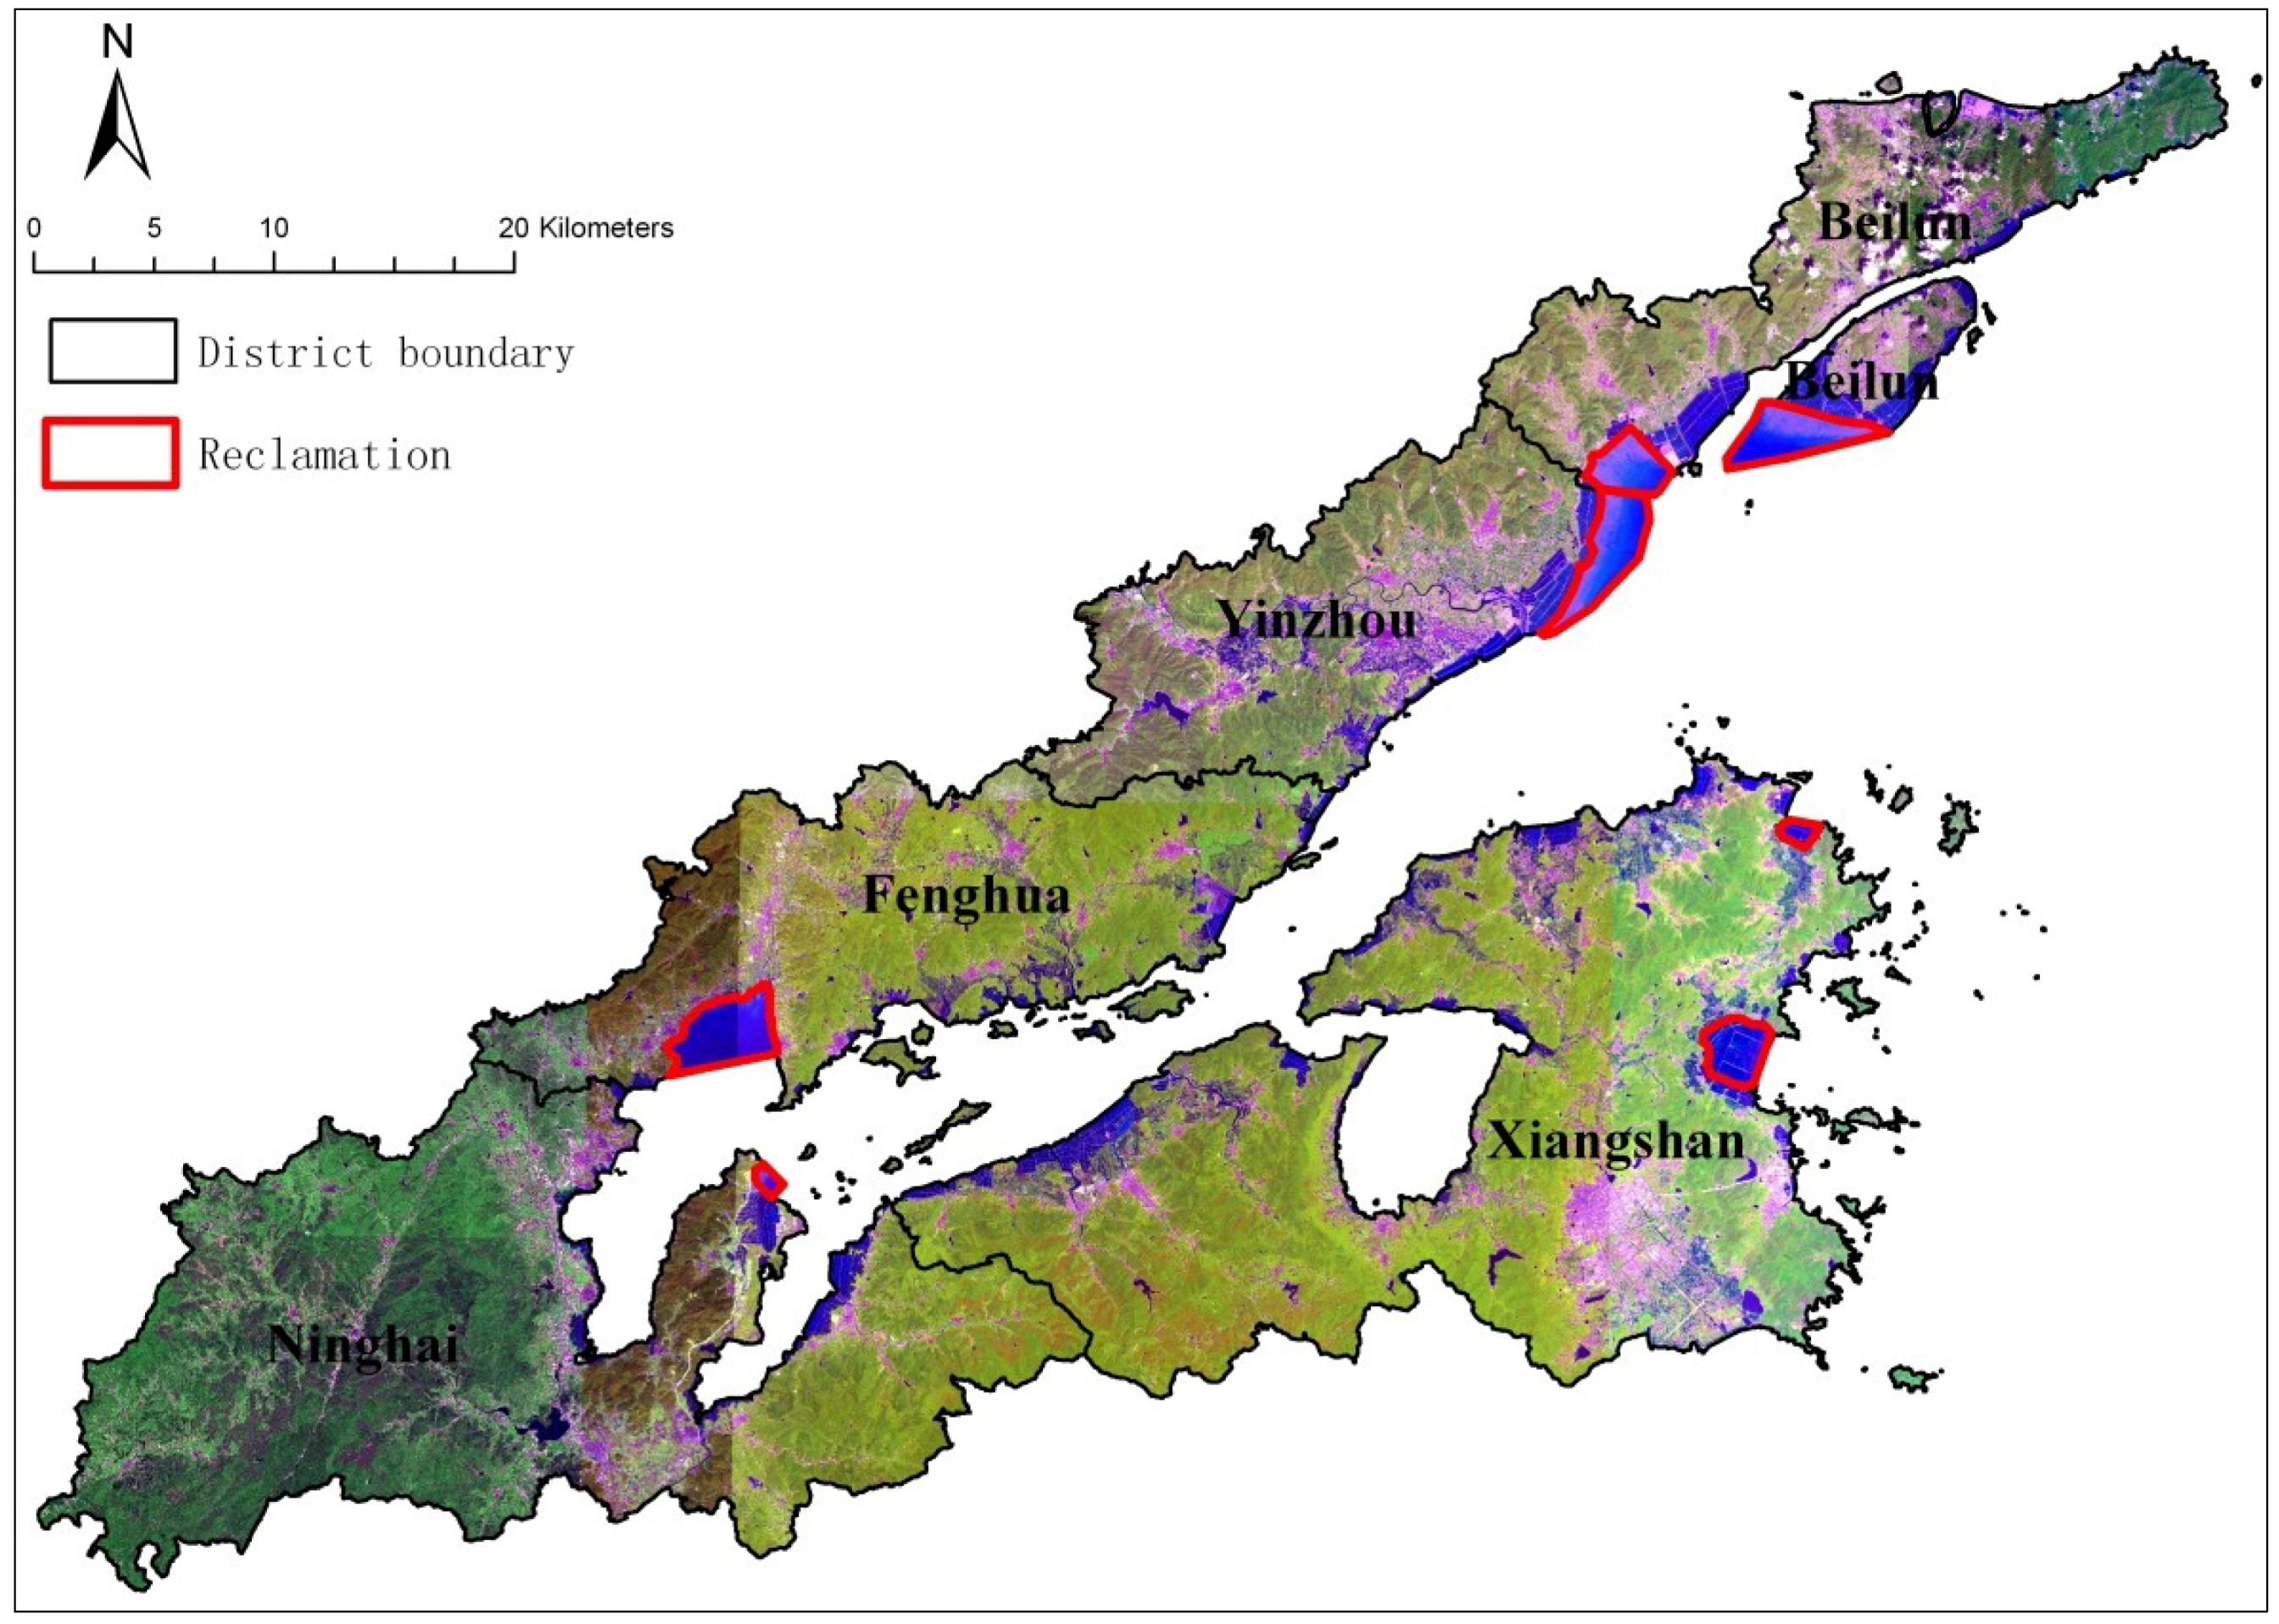
3.3. Land Sources of Urban and Rural Settlements

In 2005–2009, what land became residential? What are the differences between urban and rural settlements? What land use types are under the greatest pressure from rapid urbanization? The land sources of human settlements in 2009 are given in Figure 5.
The total land area of settlements in the region has reached 140.5 km2. Besides the original rural settlements of 38.8 km2, the area of the irrigation farmland is the largest (26.6 km2, 19%), and exceeds the original urban settlements land by 21.3 km2. The area of woodland is 13.5 km2 (9.6%), and these four land use types occupy 71.36% of human settlements land. Other land use types, in decreasing proportion, are: special land use, garden plot, salt pan, tidal flat, rain paddy, water, unirrigated farmland, grassland, and river land.
The total land area of the urban settlements has reached 70.7 km2, of which the original urban settlement land accounts for the largest part (21.2 km2, 30%). The area of the irrigated farmland is 11.9 km2 (16.9%), the rural settlements land takes third place (10 km2, 14.1%), followed, respectively, by special land, salt pan, and tidal flat (total area of 14.93 km2). These six land use types account for 87.2% of the total land area. In decreasing order of area occupied, other land use types are: woodland, garden plot, water, rain paddy, unirrigated farmland, grassland, and river land.
The total land area of rural settlement has reached 69.86 km2, with the original rural settlement land accounting for the largest part, with an area of 28.8 km2 (41.3%). Irrigated farmland takes second place, with an area of 14.7 km2 (21%). Third to fifth positions are taken by woodland, garden plot, and rain paddy (17.4 km2 in total). These five land use types account for 87.3% of the total land, showing that rural settlement land accounts for a large part of all farmland. Remaining land use types, in decreasing order of area used are: special land, water, salt pan, unirrigated farmland, tidal flat, grassland, river, and urban settlements.
In order to explore the differences of land use types more clearly, the remaining 11 types of land use, after urban and rural settlements are removed from the existing 13 types, are classified into three categories. The first is human facility land (HFL), including salt pan and special land; the second is farmland (FL), including irrigated farmland, unirrigatied farmland, garden plot and rain paddy; the third is other natural lands (ONL), including woodland, grassland, tidal flat, water, and river land. The proportions of the three land use types in the region and in urban and rural settlements are given in Figure 6. In terms of the region, farmland accounts for the largest area (51.55%), followed by other natural land (31.2%), which shows that the expansion of human settlements in Xiangshangang is mainly the occupation of farmland and other natural land; the occupation of human facility land accounts for only 17.4%. From the aspect of urban and rural residential development, the common characteristic is the same occupation–proportion sequence, which is farmland > other natural lands > human facility land. There are also differences between them: rural settlements occupy a large proportion of farmland (< 57.6%), while urban settlements occupy a great portion of facility land such as salt pan (26.9%), far higher than rural settlements (8.2%).
Figure 5. Land sources of urban and rural settlements.
Sustainability 06 01848 g005
Note: RS, Rural settlements; IF, Irrigated farmland; US, Urban settlements; WL Woodland; SL, Special land; GP, Garden plot; SP, Salt pan; TF, Tidal Flat; RP, Rained paddy; WA, Water; UF, Unirrigated farmland; GL, Grassland; RL, River land.
Figure 6. Ratio differences of regional, urban and rural settlements.
Sustainability 06 01848 g006

4. Driving Forces to Achieving a Rapid Rural—Urban Transformation

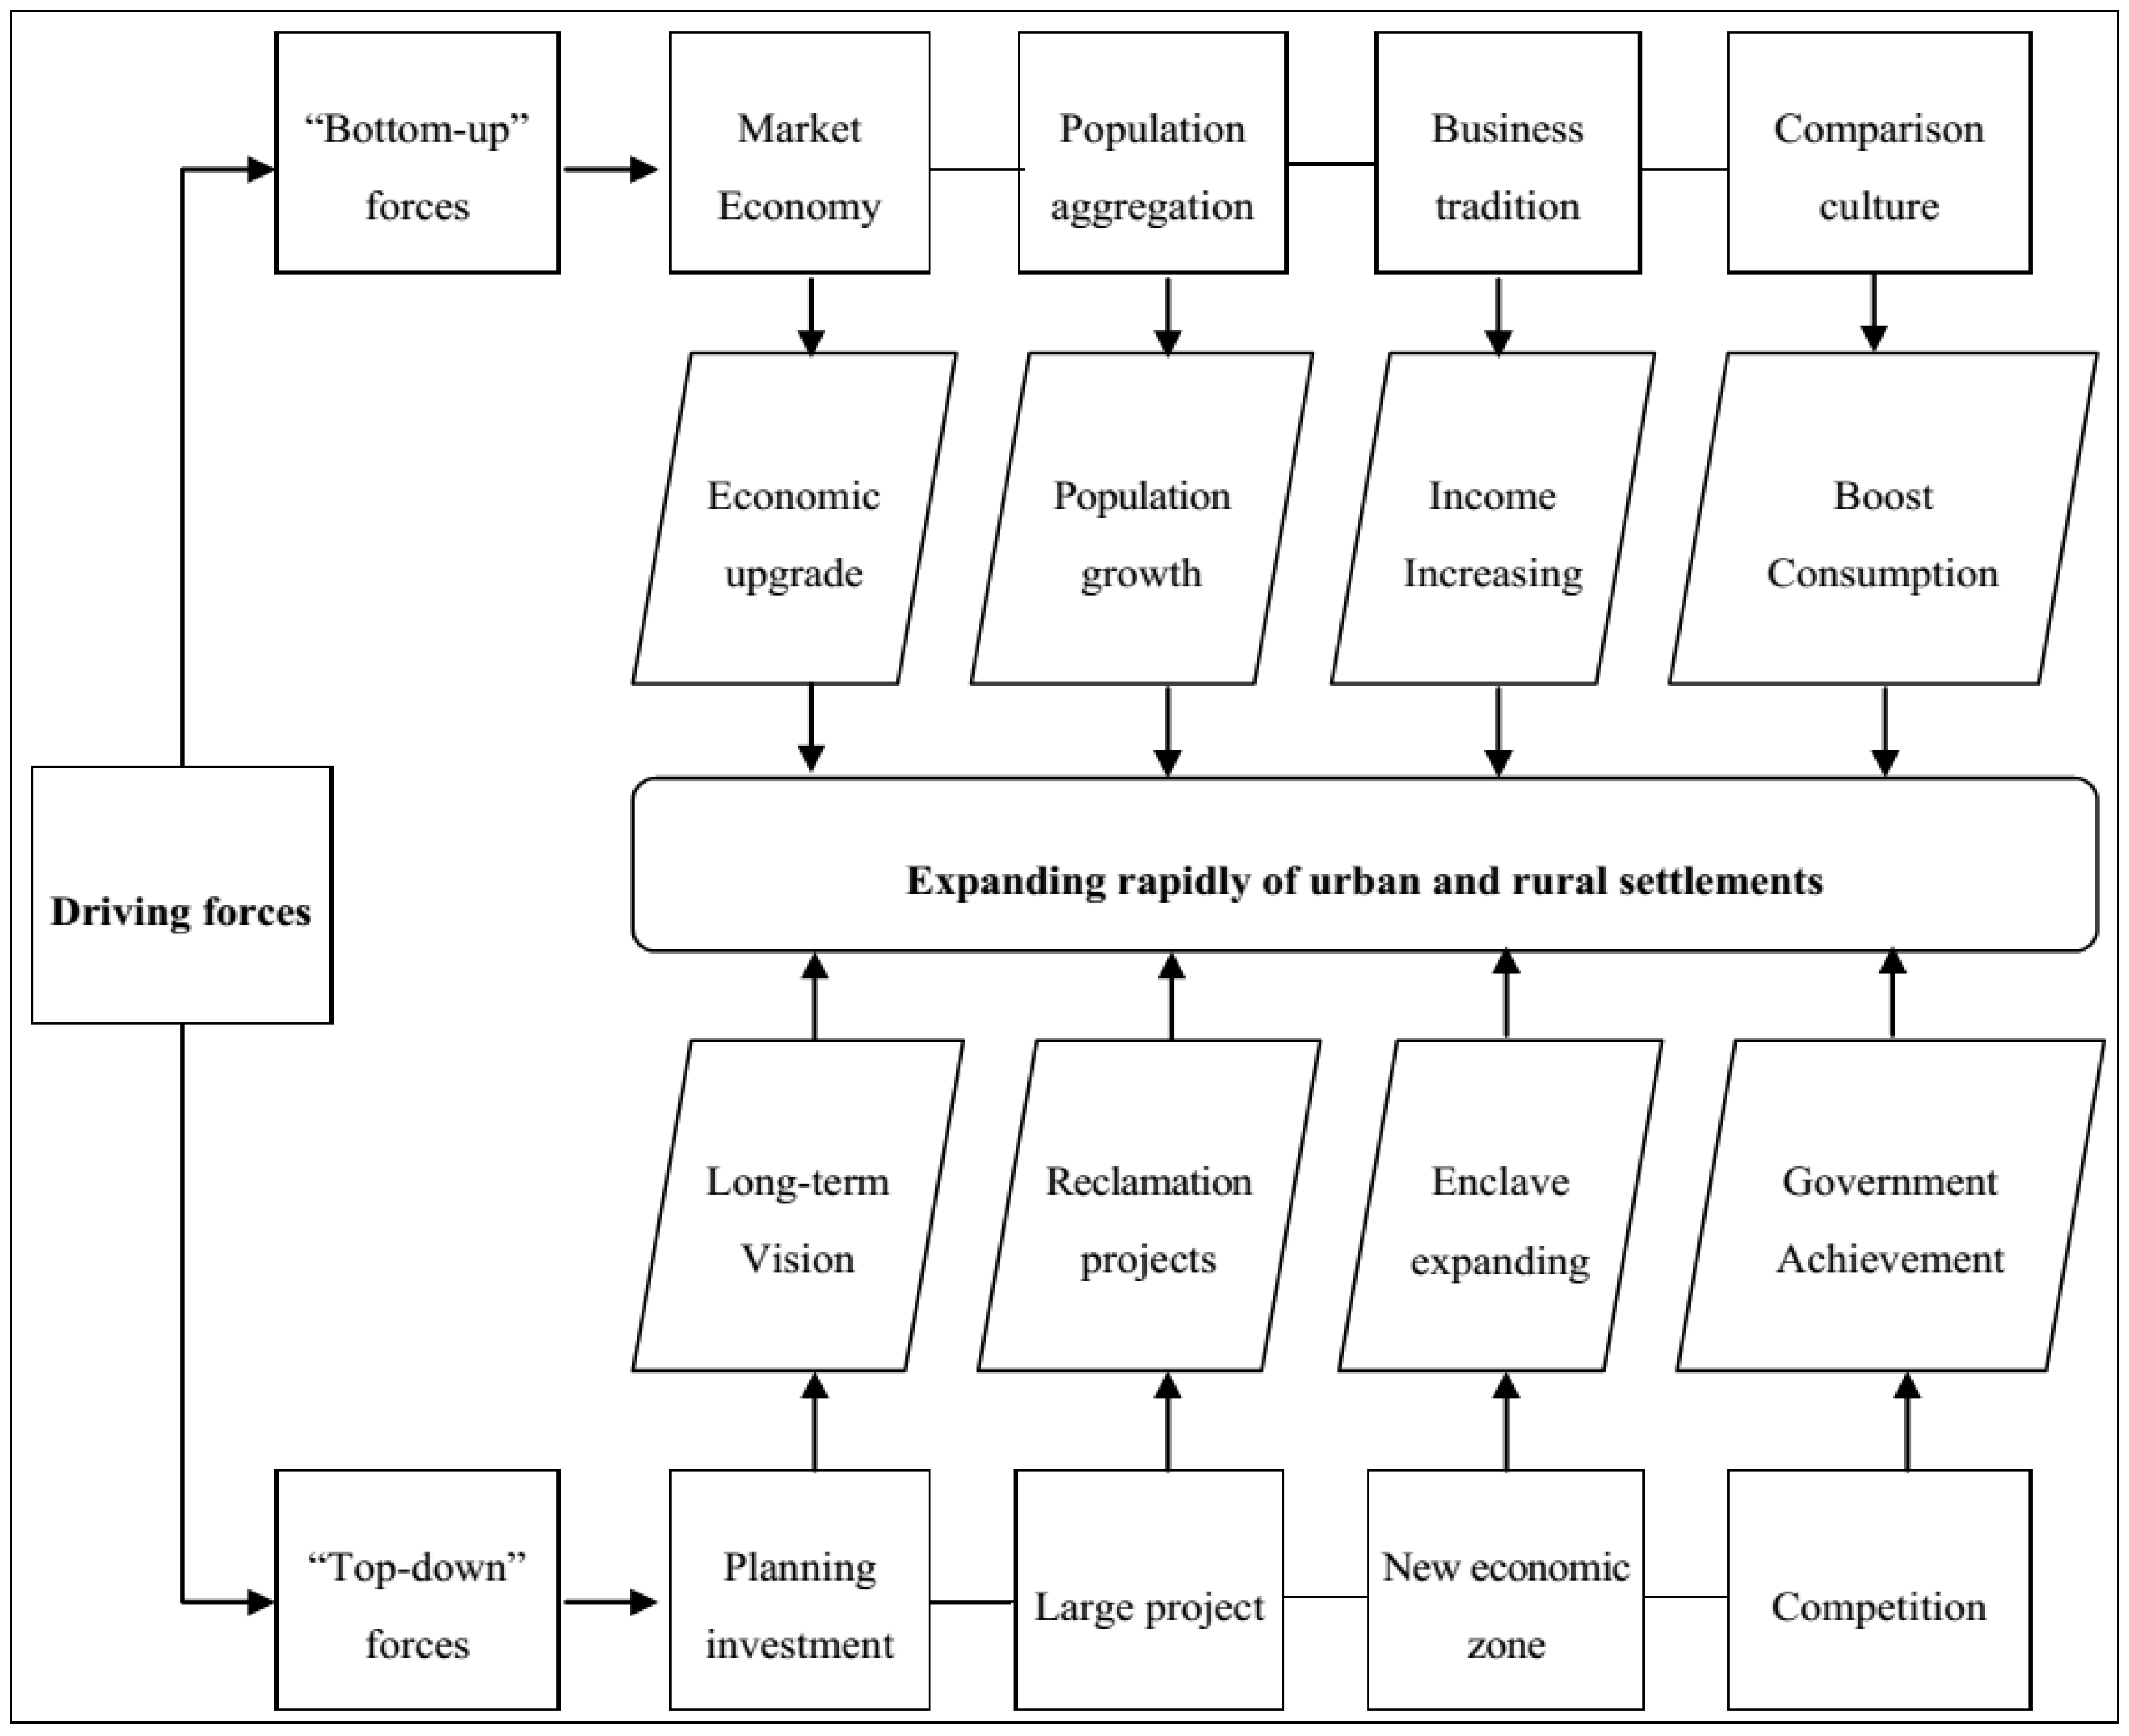
4.1. Driving Forces from Bottom to Top and from Top to Bottom

Currently, both rural development and urban development in the study area are experiencing a transition period [48]. There are two kinds of driving forces to achieving rapid rural-urban transformation in Ningbo. One group is traditional ‘bottom-up’ forces, which often mean market forces, an increased transient population, social and cultural factors, etc. The other group is ‘top-down’ forces with strong Chinese characteristics, which usually means a government-oriented urbanization drive (Figure 7).
Figure 7. Driving forces of achieving a rapid rural-urban transformation.
Sustainability 06 01848 g007
As a kind of natural historical process, urbanization is inevitable. The word “natural” is generally synonymous with market forces. Markets provide bottom-up solutions. As for Ningbo city, our research also shows that the speed and scale of the urban settlement expansion are faster and larger than rural expansion in most counties.
It is an interesting phenomenon that towns are often more flourishing and the rate of urbanization is higher when the floating population is greater than the resident population. For example, Ninghai, Xidian and Yinzhou are cluster centers of floating population, and they are more developed than the other two districts. However, a large floating population causes some problems. Many of the floating population are mostly engaged in low-income non-agricultural industries, and usually cannot access services such as education, medical treatment and public health, social welfare, etc.
Social and cultural factors play an important role in rural-urban transformation. As a coastal city, Ningbo is rich in cultural heritage. Prominent scholars from Chinese history, such as Wang Yangming and Huang Zongxi from the Ming and Qing dynasties, held that industry and commerce are equally important to agriculture, contrary to the prevailing Confucian ideas that praised agriculture and deprecated trade. This has produced a very profound mercantilist cultural tradition in Ningbo. In the social sphere, there are causes leading to urbanization and expansion of the rural settlements.
Because of China’s particular circumstances and its social backgrounds, the development of urban and rural settlements is universally “Government Dominated”. There are three characteristics of development in Ningbo: large investment and project promotion, many-headed management, and vicious competition. Large projects are often one of the most important indexes for assessing local officials’ achievements, and higher investments are therefore usually driven by local officials who have their performance judged solely by growth in their districts. Multi-management facilitates some special zones and large projects, but results in overlap and misappropriation. In recent years, in order to speed up the pace of economic development, the local government has set up some administrative units at, for example, town level, which are generally called something like “the Headquarters for Constructing a New City”, “Service Center”, “the Administrative Committee of the New Area”, and so on. In Xiangshan, these administrative departments easily lead to local protectionism, regional blockades, market Balkanization, and other difficulties. Under the assessment system that emphasizes local achievements, even if two areas are geographically adjacent and functionally complementary, they usually find it difficult to collaborate.

4.2. The Differences between Urban and Rural Driving Forces

The dual-track mechanism of promoting land use transformation facilitates further understanding of the difference between urban and rural development. The new political economy of human settlements in the post-reform period was a result of, and a response to, profound socio-economic-environmental changes in China [49]. Usually, the implementation of a ‘top-down’ approach to spatial expansion also needs to incorporate ‘bottom-up’ elements into the process. The rural-urban transformation is a dynamic, multi-scalar and hybrid process, which is also strongly shaped by the distinctive political, economic, social, and cultural context [50]. However, differences in driving forces can be found between urban settlements and rural ones.
The modes of both in-situ expansion and enclave expansion of urban settlements, with the local government playing a dominant role, have the typical trait of top to bottom. The role of the local government in urban settlements is more than being a facilitator that provides public services (e.g., education, hospitals, parks, sports fields, etc.); it is also a major stakeholder, directly involved in the whole process of urban settlement growth, dealing with planning, location choice, land acquisition, investment, and construction. The local government in the post-reform period has become a mixture of political and economic entity, not only expected to enhance GDP growth and political performance, but also extend financial resources in a highly marketed environment. In recent years, the local government of Ningbo has launched several coastal reclamation projects to solve land shortage, which are presented in Figure 8. The coastal reclamations have been carried out in each district, including 43 km2 in total. The local government should, based on environmental impact assessment, give priority to the conservation of the natural coastline over uncontrolled reclamation [51].
Figure 8. The reclamation projects in study area in recent years.
Sustainability 06 01848 g008
Rural settlements differ markedly from settlement growth in urban areas. Settlements in rural areas tend to be scattered and small. Individual choices and those made by village collective organizations play an important role, while the local government is rarely involved. Migrants often work in urban areas and live in rural settlements, where costs are lower, and local people have an economic incentive to build more houses to accommodate them. Unreasonable comparison with the higher urban housing standard and bigger housing areas is pervasive in rural areas of Ningbo, and this has aggravated the rapid sprawl of rural settlements. Additionally, the new phenomenon of village collective organizations participates in the construction of small property right housing (Xiaochanquanfang in Chinese) need really to be alert. The expansion of rural settlement has produced a unique phenomenon of “village-hollowing” [50].

4.3. Explaining the Difference Using the Theory of Production of Space

The theory of production of space first appeared in the 1970s, and it means that landscapes and spatial structures have often been reshaped by political, economic, and social factors such as capital, power, and class [52,53]. In 1974, in Production of Space, Lefebvre wrote: “(social) space is (social) production”, and held that social relations are spatial relations and vice versa, and that urbanization driven by capital dissimilates social (spatial) relations [54]. Thereafter, his followers developed the theory and applied it to the discussion of urban issues and uneven geographical development [55,56].
In fact, there is a strong characteristic of production of space in the course of urbanization in Ningbo, especially for the top-down mode. Generally speaking, the two modes are government-led, so political factors dominate the whole urbanization and market forces seem pointless, or at least secondary. Under such political control, many large projects have more risks than usual. The multi-channel management has brought with it a lot of issues, such as high cost, low efficiency, vicious competition and low-level redundant development. Large investment introduced by local officials reflects capital, together with power, deciding the directions of urbanization.
However, there are some differences between the two modes. Firstly, from a macro point of view, rural expansion has been influenced in recent years by the national “New Socialist Countryside” program, and the renovation and reconstruction of the village residential area is the core of that program. Secondly, from the micro point of view, the township governments and the village collectives are executives of the program, and their power has an effect on the rural settlements.

5. Discussion and Conclusions

While there are numerous studies analyzing human settlements and land use changes [57,58], the differences between urban settlements and rural areas have received less attention. Using interdisciplinary methods, the empirical research underpinning this paper has sought to examine the different dynamic patterns of human settlements and to discuss the driving forces in Xiangshangang, in the Ningbo city of coastal China, which has experienced dramatic economic and spatial restructuring. Our study shows that the total area of human settlements has undergone dramatic growth in recent years. Generally, the obvious effects of urbanization are to enhance the concentration of settlements, with an increase of population density and economic use of residential land. However, that is not what happened in the study area. The conversion of farmland to human settlements has been arguably the most widespread, and the transformation process has been more intense. An inefficient model of settlement sprawl has increasingly become a key obstacle to smart growth and healthy urbanization.
The classification of urban and rural settlements provides greater detail of the coastal residential land changes and driving forces. The area of urban settlements is increasing substantially. The spatial expansion is dominated by in-situ expansion, with the average area per town increasing from 1.1 km2 to 2.9 km2. From the comparison of satellite images and geographic investigation, urban settlement development, as a result of rapid industrialization and urbanization, has increased the demand for construction land, which not only causes more loss of fertile farmland, but also increases the built-up area. Further local development requires more land, which is very scarce, and the local government has played an important role in pushing forward reclamation projects, which have led to further expansion of urban settlements and to underlying resource–environment problems on the coast.
On the other hand, rural settlements differ from the urban ones in being scattered and small, with typical characteristics of rapid growth in number, and average area per settlement decreasing, with average area per settlement decreasing rapidly from 23.40 ha to 8.81 ha. Although the area of rural settlements seems to be growing only slowly, the change is very intense, and new expansion really is happening, in terms of great transformation from rural to urban settlements. The driving forces from bottom to top have played a key role in this growth process (e.g., income incentives, market forces, transient population, social and cultural background). The sprawl of most rural settlements is spontaneous and not assisted by the government or scientific planning [22], which has led to increasing difficulty and cost of management.
This study shows that both the dynamic and driving forces between urban and rural settlements are much more nuanced than is generally supposed, where no distinction is made between types. The growth process is quite complex, but the trends and policy implications are relatively clear. Future policy considerations mainly concern three aspects. First, a unique model of urban settlement expansion that is guided by local government and accelerated urbanization policies has emerged in the study area, where the growth mode is not sustainable. To achieve sustainable development, the local states need to curb land finance, and to give up the large politically motivates ‘show’ projects. The development of urban settlement needs to be driven by real requirements of local residents and migrants, rather than GDP increase or the will of the local leader. Second, the upgrading of rural settlements is not always a simple, integrated process of social impact, economic factors, and cultural habits. From that perspective, it is a much more difficult problem than urban settlement because of the large number of individuals involved and widespread squatter settlements. This paper proposes that we should enhance the education for sustainable settlements, which may be a long and gradual process, but the sooner we take action to stop irrational sprawl, the more effective we will be. Along the coast, laws should be passed and strictly enforced to prevent the growth of new villages [59]. Additionally, sustainable development of human settlements should be seen simultaneously from the viewpoints of environmental, social, economic, political and planning. It should be understood that environmental improvement has profound effects on livable and sustainable settlements [60]. The transformation from agricultural land to human settlements is relatively easy, but the reverse is not. The large scale of the reclamation projects is a great challenge, and the environmental effects need to be rigorously assessed and their size limited.

Acknowledgments

This work was supported jointly by the National Natural Science Foundation of China (Grant No. 41001080, 41001092 and 41230632) and The National Science and Technology Support Program (Grant No. 2012BAJ15B02).

Author Contributions

In this paper, Mingxing Chen contributed to research design, case study development, data analysis and writing of the article; Chao Ye contributed to structure of text and the writing work of Section 4 and Section 5.

Conflicts of Interest

The authors declare no conflict of interest.

References

  1. Habitat, U. Planning sustainable cities: Global Report on Human Settlements. Available online: http://www.unhabitat.org/content.asp?typeid=19&catid=555&cid=5607 (accessed on 10 January 2014).
  2. Frondoni, R.; Mollo, B.; Capotorti, G. A landscape analysis of land cover change in the Municipality of Rome (Italy): Spatio-temporal characteristics and ecological implications of land cover transitions from 1954 to 2001. Landsc. Urban Plann. 2011, 100, 117–128. [Google Scholar] [CrossRef]
  3. Fischer, J.; Lindenmayer, D.B. Landscape modification and habitat fragmentation: A synthesis. Glob. Ecol. Biogeogr. 2007, 16, 265–280. [Google Scholar] [CrossRef]
  4. Long, H.; Liu, Y.; Wu, X.; Dong, G. Spatio-temporal dynamic patterns of farmland and rural settlements in Su-Xi-Chang region: Implications for building a new countryside in coastal China. Land Use Pol. 2009, 26, 322–333. [Google Scholar] [CrossRef]
  5. Jenerette, G.D.; Harlan, S.L.; Brazel, A.; Jones, N.; Larsen, L.; Stefanov, W.L. Regional relationships between surface temperature, vegetation, and human settlement in a rapidly urbanizing ecosystem. Landsc. Ecol. 2007, 22, 353–365. [Google Scholar] [CrossRef]
  6. Xu, E.Q.; Zhang, H.Q.; Li, M.X. Mining spatial information to investigate the evolution of karst rocky desertification and its human driving forces in Changshun, China. Sci. Total Environ. 2013, 458, 419–426. [Google Scholar]
  7. Small, C.; Nicholls, R.J. A global analysis of human settlement in coastal zones. J. Coast. Res. 2003, 19, 584–599. [Google Scholar]
  8. Shalaby, A.; Tateishi, R. Remote sensing and GIS for mapping and monitoring land cover and land-use changes in the Northwestern coastal zone of Egypt. Appl. Geogr. 2007, 27, 28–41. [Google Scholar] [CrossRef]
  9. Walters, B.B. People and mangroves in the Philippines: Fifty years of coastal environmental change. Environ. Conserv. 2003, 30, 293–303. [Google Scholar] [CrossRef]
  10. McGranahan, G.; Balk, D.; Anderson, B. The rising tide: assessing the risks of climate change and human settlements in low elevation coastal zones. Environ. Urban 2007, 19, 17–37. [Google Scholar] [CrossRef]
  11. Awuor, C.B.; Orindi, V.A.; Adwera, A.O. Climate change and coastal cities: The case of Mombasa, Kenya. Environ. Urban 2008, 20, 231–242. [Google Scholar] [CrossRef]
  12. Liu, A.J.; Cameron, G.N. Analysis of landscape patterns in coastal wetlands of Galveston Bay, Texas (USA). Landsc. Ecol. 2001, 16, 581–595. [Google Scholar] [CrossRef]
  13. United Nations. World Urbanization Prospects, the 2011 Revision. Available online: http://esa.un.org/unup/ (accessed on 5 January 2014).
  14. Goddard, M. From rolling thunder to reggae: Imagining squatter settlements in Papua New Guinea. Contemp. Pac. 2001, 13, 1–32. [Google Scholar] [CrossRef]
  15. Kährik, A.; Tammaru, T. Population composition in new suburban settlements of the Tallinn metropolitan area. Urban Stud. 2008, 45, 1055–1078. [Google Scholar] [CrossRef]
  16. Wu, W. Migrant Settlement and Spatial Distribution in Metropolitan Shanghai. Prof. Geogr. 2008, 60, 101–120. [Google Scholar] [CrossRef]
  17. Aguilar, A.G.; Santos, C. Informal settlements’ needs and environmental conservation in Mexico City: An unsolved challenge for land-use policy. Land Use Pol. 2011, 28, 649–662. [Google Scholar] [CrossRef]
  18. Lall, S.V.; Suri, A.; Deichmann, U. Household savings and residential mobility in informal settlements in Bhopal, India. Urban Stud. 2006, 43, 1025–1039. [Google Scholar] [CrossRef]
  19. Del Mistro, R.; Hensher, D.A. Upgrading informal settlements in South Africa: Policy, rhetoric and what residents really value. Hous. Stud. 2009, 24, 333–354. [Google Scholar] [CrossRef]
  20. Parsa, A.; Nakendo, F.; McCluskey, W.J.; Page, M.W. Impact of formalisation of property rights in informal settlements: Evidence from Dar es Salaam city. Land Use Pol. 2011, 28, 695–705. [Google Scholar] [CrossRef]
  21. Ford, A.; Clarke, K.C.; Raines, G. Modeling settlement patterns of the late classic Maya civilization with bayesian methods and geographic information systems. Ann. Assoc. Am. Geogr. 2009, 99, 496–520. [Google Scholar] [CrossRef]
  22. Pugh, C. Squatter settlements: Their sustainability, architectural contributions, and socio-economic roles. Cities 2000, 17, 325–337. [Google Scholar] [CrossRef]
  23. Mukhija, V. Upgrading housing settlements in developing countries: The impact of existing physical conditions. Cities 2001, 18, 213–222. [Google Scholar] [CrossRef]
  24. Daniere, A.; Takahashi, L.; NaRanong, A.; Lan, V.T.N. Social capital and urban environments in Southeast Asia: Lessons from settlements in Bangkok and Ho Chi Minh City. Int. Dev. Plann. Rev. 2005, 27, 21–58. [Google Scholar] [CrossRef]
  25. Lu, Q.S.; Liang, F.Y.; Bi, X.L.; Duffy, R.; Zhao, Z.P. Effects of urbanization and industrialization on agricultural land use in Shandong Peninsula of China. Ecol. Indic. 2011, 11, 1710–1714. [Google Scholar] [CrossRef]
  26. Daniere, A. Planning Sustainable Cities: Global Report on Human Settlements 2009. Int. Dev. Plann. Rev. 2011, 33, 99–101. [Google Scholar]
  27. Huang, Q.H.; Li, M.C.; Chen, Z.J.; Li, F.X. Land Consolidation: An Approach for Sustainable Development in Rural China. Ambio 2011, 40, 93–95. [Google Scholar] [CrossRef]
  28. Long, H.L.; Hellig, G.K.; Li, X.B.; Zhang, M. Socio-economic development and land-use change: Analysis of rural housing land transition in the Transect of the Yangtse River, China. Land Use Pol. 2007, 24, 141–153. [Google Scholar] [CrossRef]
  29. Dunford, M.; Perrons, D. Regional Inequality in the EU: How to Finance Greater Cohesion. Eur. Plann. Stud. 2012, 20, 895–922. [Google Scholar] [CrossRef]
  30. Choguill, C.L. Toward sustainability of human settlements. Habitat Int. 1996, 20, v–viii. [Google Scholar] [CrossRef]
  31. Cohen, B. Urban growth in developing countries: A review of current trends and a caution regarding existing forecasts. World Dev. 2004, 32, 23–51. [Google Scholar] [CrossRef]
  32. Zhang, L. Re-examining China’s “urban” concept and the level of urbanization. China Q. 1998, 154, 330–381. [Google Scholar] [CrossRef]
  33. Rawski, T.G. What is happening to China’s GDP statistics? China Econ. Rev. 2001, 12, 347–354. [Google Scholar] [CrossRef]
  34. Sinton, J.E. Accuracy and reliability of China’s energy statistics. China Econ. Rev. 2001, 12, 373–383. [Google Scholar] [CrossRef]
  35. Zhou, Y.; Laurence, L.J.M. China’s urban population statistics: A critical evaluation. Eurasian Geogr. Econ. 2005, 46, 272–289. [Google Scholar] [CrossRef]
  36. Zhou, Y.X.; Ma, L.J.C. China’s urbanization levels: Reconstructing a baseline from the fifth population census. China Q. 2003, 173, 176–196. [Google Scholar] [CrossRef]
  37. Salmon, B.P.; Olivier, J.C.; Kleynhans, W.; Wessels, K.J.; van den Bergh, F.; Steenkamp, K.C. The use of a Multilayer Perceptron for detecting new human settlements from a time series of MODIS images. Int. J. Appl. Earth. Obs. 2011, 13, 873–883. [Google Scholar] [CrossRef]
  38. Jiang, D.; Huang, Y.; Zhuang, D.; Zhu, Y.; Xu, X.; Ren, H. A Simple Semi-Automatic Approach for Land Cover Classification from Multispectral Remote Sensing Imagery. PLoS One 2012, 7, e45889. [Google Scholar]
  39. Linard, C.; Gilbert, M.; Snow, R.W.; Noor, A.M.; Tatem, A.J. Population Distribution, Settlement Patterns and Accessibility across Africa in 2010. PLoS One 2012, 7, e31743. [Google Scholar]
  40. Ho, S.P.; Lin, G.C. Converting Land to Nonagricultural Use in China’s Coastal Provinces Evidence from Jiangsu. Mod. China 2004, 30, 81–112. [Google Scholar] [CrossRef]
  41. Lin, G.C.S.; Ho, S.P.S. China’s land resources and land-use change: Insights from the 1996 land survey. Land Use Pol. 2003, 20, 87–107. [Google Scholar] [CrossRef]
  42. Wang, J.; Chen, Y.; Shao, X.; Zhang, Y.; Cao, Y. Land-use changes and policy dimension driving forces in China: Present, trend and future. Land Use Pol. 2012, 29, 737–749. [Google Scholar] [CrossRef]
  43. Xu, Y.; McNamara, P.; Wu, Y.; Dong, Y. An econometric analysis of changes in arable land utilization using multinomial logit model in Pinggu district, Beijing, China. J. Environ. Manage. 2013, 128, 324–334. [Google Scholar] [CrossRef]
  44. Committee on Strategic Directions for the Geographical Sciences in the Next Decade; National Research Council. Understanding the Changing Planet: Strategic Directions for the Geographical Sciences; The National Academies Press: Washington, DC, USA, 2010; p. 6. [Google Scholar]
  45. Gong, C.; Yu, S.; Joesting, H.; Chen, J. Determining socioeconomic drivers of urban forest fragmentation with historical remote sensing images. Landsc. Urban Plann. 2013, 117, 57–65. [Google Scholar] [CrossRef]
  46. Patch Analyst 5. Available online: http://www.cnfer.on.ca/SEP/patchanalyst/whats_new.html (accessed on 20 October 2013).
  47. Wang, Z.; Song, K.; Zhang, B.; Liu, D.; Ren, C.; Luo, L.; Yang, T.; Huang, N.; Hu, L.; Yang, H. Shrinkage and fragmentation of grasslands in the West Songnen Plain, China. Agric. Ecosyst. Environ. 2009, 129, 315–324. [Google Scholar] [CrossRef]
  48. Long, H.; Zou, J.; Pykett, J.; Li, Y. Analysis of rural transformation development in China since the turn of the new millennium. Appl. Geogr. 2011, 31, 1094–1105. [Google Scholar] [CrossRef]
  49. Shen, J.F. Understanding dual-track urbanisation in post-reform China: Conceptual framework and empirical analysis. Popul. Sp. Place 2006, 12, 497–516. [Google Scholar] [CrossRef]
  50. Long, H.; Li, Y.; Liu, Y.; Woods, M.; Zou, J. Accelerated restructuring in rural China fueled by ‘increasing vs. decreasing balance’ land-use policy for dealing with hollowed villages. Land Use Pol. 2012, 29, 11–22. [Google Scholar] [CrossRef]
  51. Zhao, B.; Kreuter, U.; Li, B.; Ma, Z.; Chen, J.; Nakagoshi, N. An ecosystem service value assessment of land-use change on Chongming Island, China. Land Use Pol. 2004, 21, 139–148. [Google Scholar] [CrossRef]
  52. Harvey, D. Social Justice and the City; Blackwell: Oxford, UK, 1973; pp. 10–13. [Google Scholar]
  53. Harvey, D. The Enigma of Capital: And the Crises of Capitalism; Oxford University Press: New York, NY, USA, 2011. [Google Scholar]
  54. Lefebvre, H.; Nicholson-Smith, D. The Production of Space; Blackwell: Oxford, UK, 1991; Volume 30, pp. 21–26. [Google Scholar]
  55. Smith, N. Uneven Development: Nature, Capital, and the Production of Space; University of Georgia Press: Athens, GA, USA, 2008; pp. 2–4. [Google Scholar]
  56. Soja, E.W. The socio-spatial dialectic. Ann. Assoc. Am. Geogr. 1980, 70, 207–225. [Google Scholar] [CrossRef]
  57. Güneralp, B.; Güneralp, İ.; Castillo, C.R.; Filippi, A.M. Land Change in the Mission-Aransas Coastal Region, Texas: Implications for Coastal Vulnerability and Protected Areas. Sustainability 2013, 5, 4247–4267. [Google Scholar] [CrossRef]
  58. Kew, B.; Lee, B.D. Measuring Sprawl across the Urban Rural Continuum Using an Amalgamated Sprawl Index. Sustainability 2013, 5, 1806–1828. [Google Scholar] [CrossRef]
  59. Lau, J.C.Y.; Chiu, C.C.H. Dual-track urbanization and co-location travel behavior of migrant workers in new towns in Guangzhou, China. Cities 2013, 30, 89–97. [Google Scholar] [CrossRef]
  60. Chen, M.X.; Lu, D.D.; Zha, L.S. The comprehensive evaluation of China’s urbanization and effects on resources and environment. J. Geogr. Sci. 2010, 20, 17–30. [Google Scholar] [CrossRef]

