Sustainability Reporting: An Approach to Get the Right Mix of Theory and Practicality for Local Actors

Abstract
:1. Introduction

| Theme | Barriers | References |
|---|---|---|
| Capacity | Lack of financial resources; Lack of expertise, skills and training; Limited readily accessible data on ecosystem & community wellbeing; Limited political and legislative power of local government; Short political cycles making planning problematic and funding sporadic; Increase devolution of responsibilities from State and federal governments to Local Governments; High workloads and portfolios of staff | [7,8,9,10,11] |
| Commitment | Other priorities seen as more important (i.e., economic and service priorities); Pro-development ethos of councils; Lack of support from key staff such as mayor, CEO or senior management; Lack of support from critical mass of councilors; Narrow definition of sustainability (i.e., environment focus); Lack of understanding about the link between health of environment & economic wellbeing; Small to no budgets for sustainability; Environmental/sustainability officers not placed in key positions in organizational hierarchy; Temporary and ad-hoc nature of grants; Development of a Sustainability/Environmental Strategy seen as the end point | [7,11,12,13,14] |
| Coordination | Poor coordination between three tiers of government; Variable coordination and collaboration between regional and local institutions; Lack on integration between agencies; Lack of coordination between council departments; Lack of understanding of the multiple roles of local government; Fragmentation of policy making and implementation | [7,15,16,17] |
| Community | Lack of interest in sustainability in community; Competing priorities for community; Fear of change and approaches seen to be radical; Limited resources for community engagement (i.e., time, money, expertise); Limited understanding of the need for and benefits of community engagement by council staff and elected members; Increased work demand on rural people due to factors such as agricultural restructuring and drought means less time for community involvement | [7,9,11,12,18] |
| Issues with current sustainability reporting tools | Complexity of sustainability; No agreed or consistent approach to development of locally relevant tools; Complex measuring process; Contested nature of some sustainability tools; Existing tools not locally relevant; Lack of transparency in some sustainability tools; No practical tools that can be used to direct policy and decision making; Lack of ownership; Confusion with performance indicators; Undefined aggregation methods | [4,19,20,21,22] |

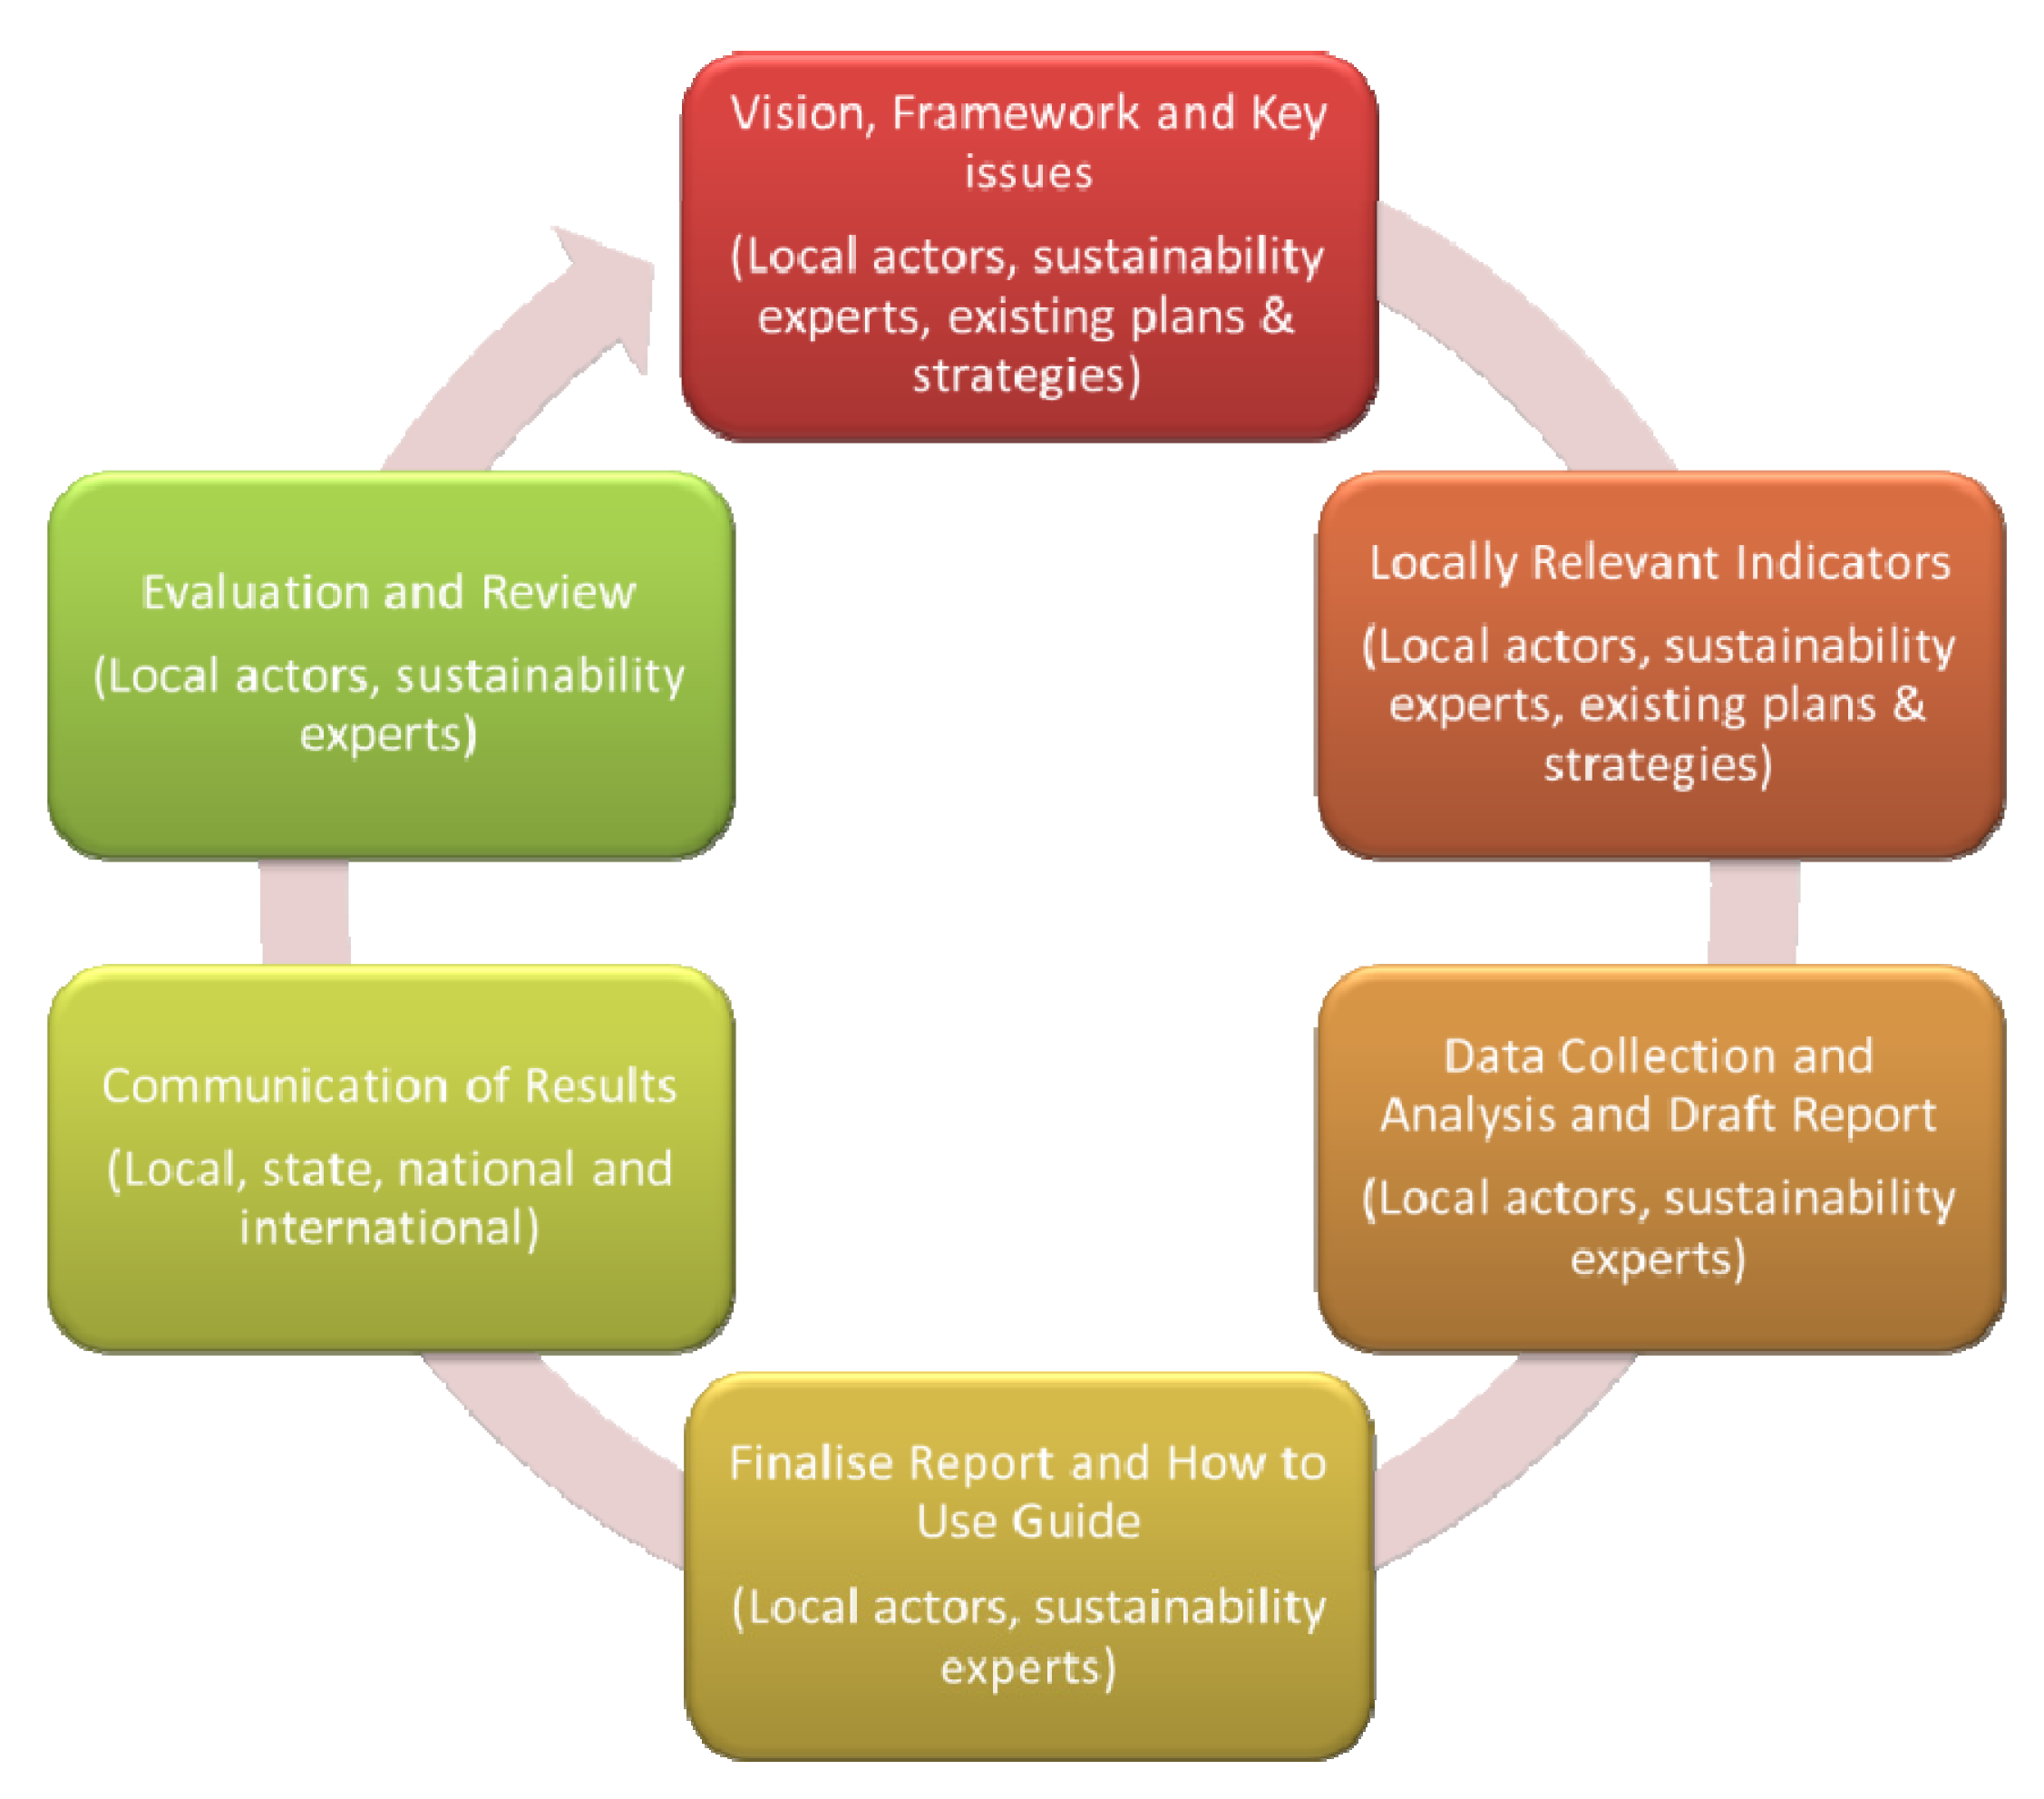
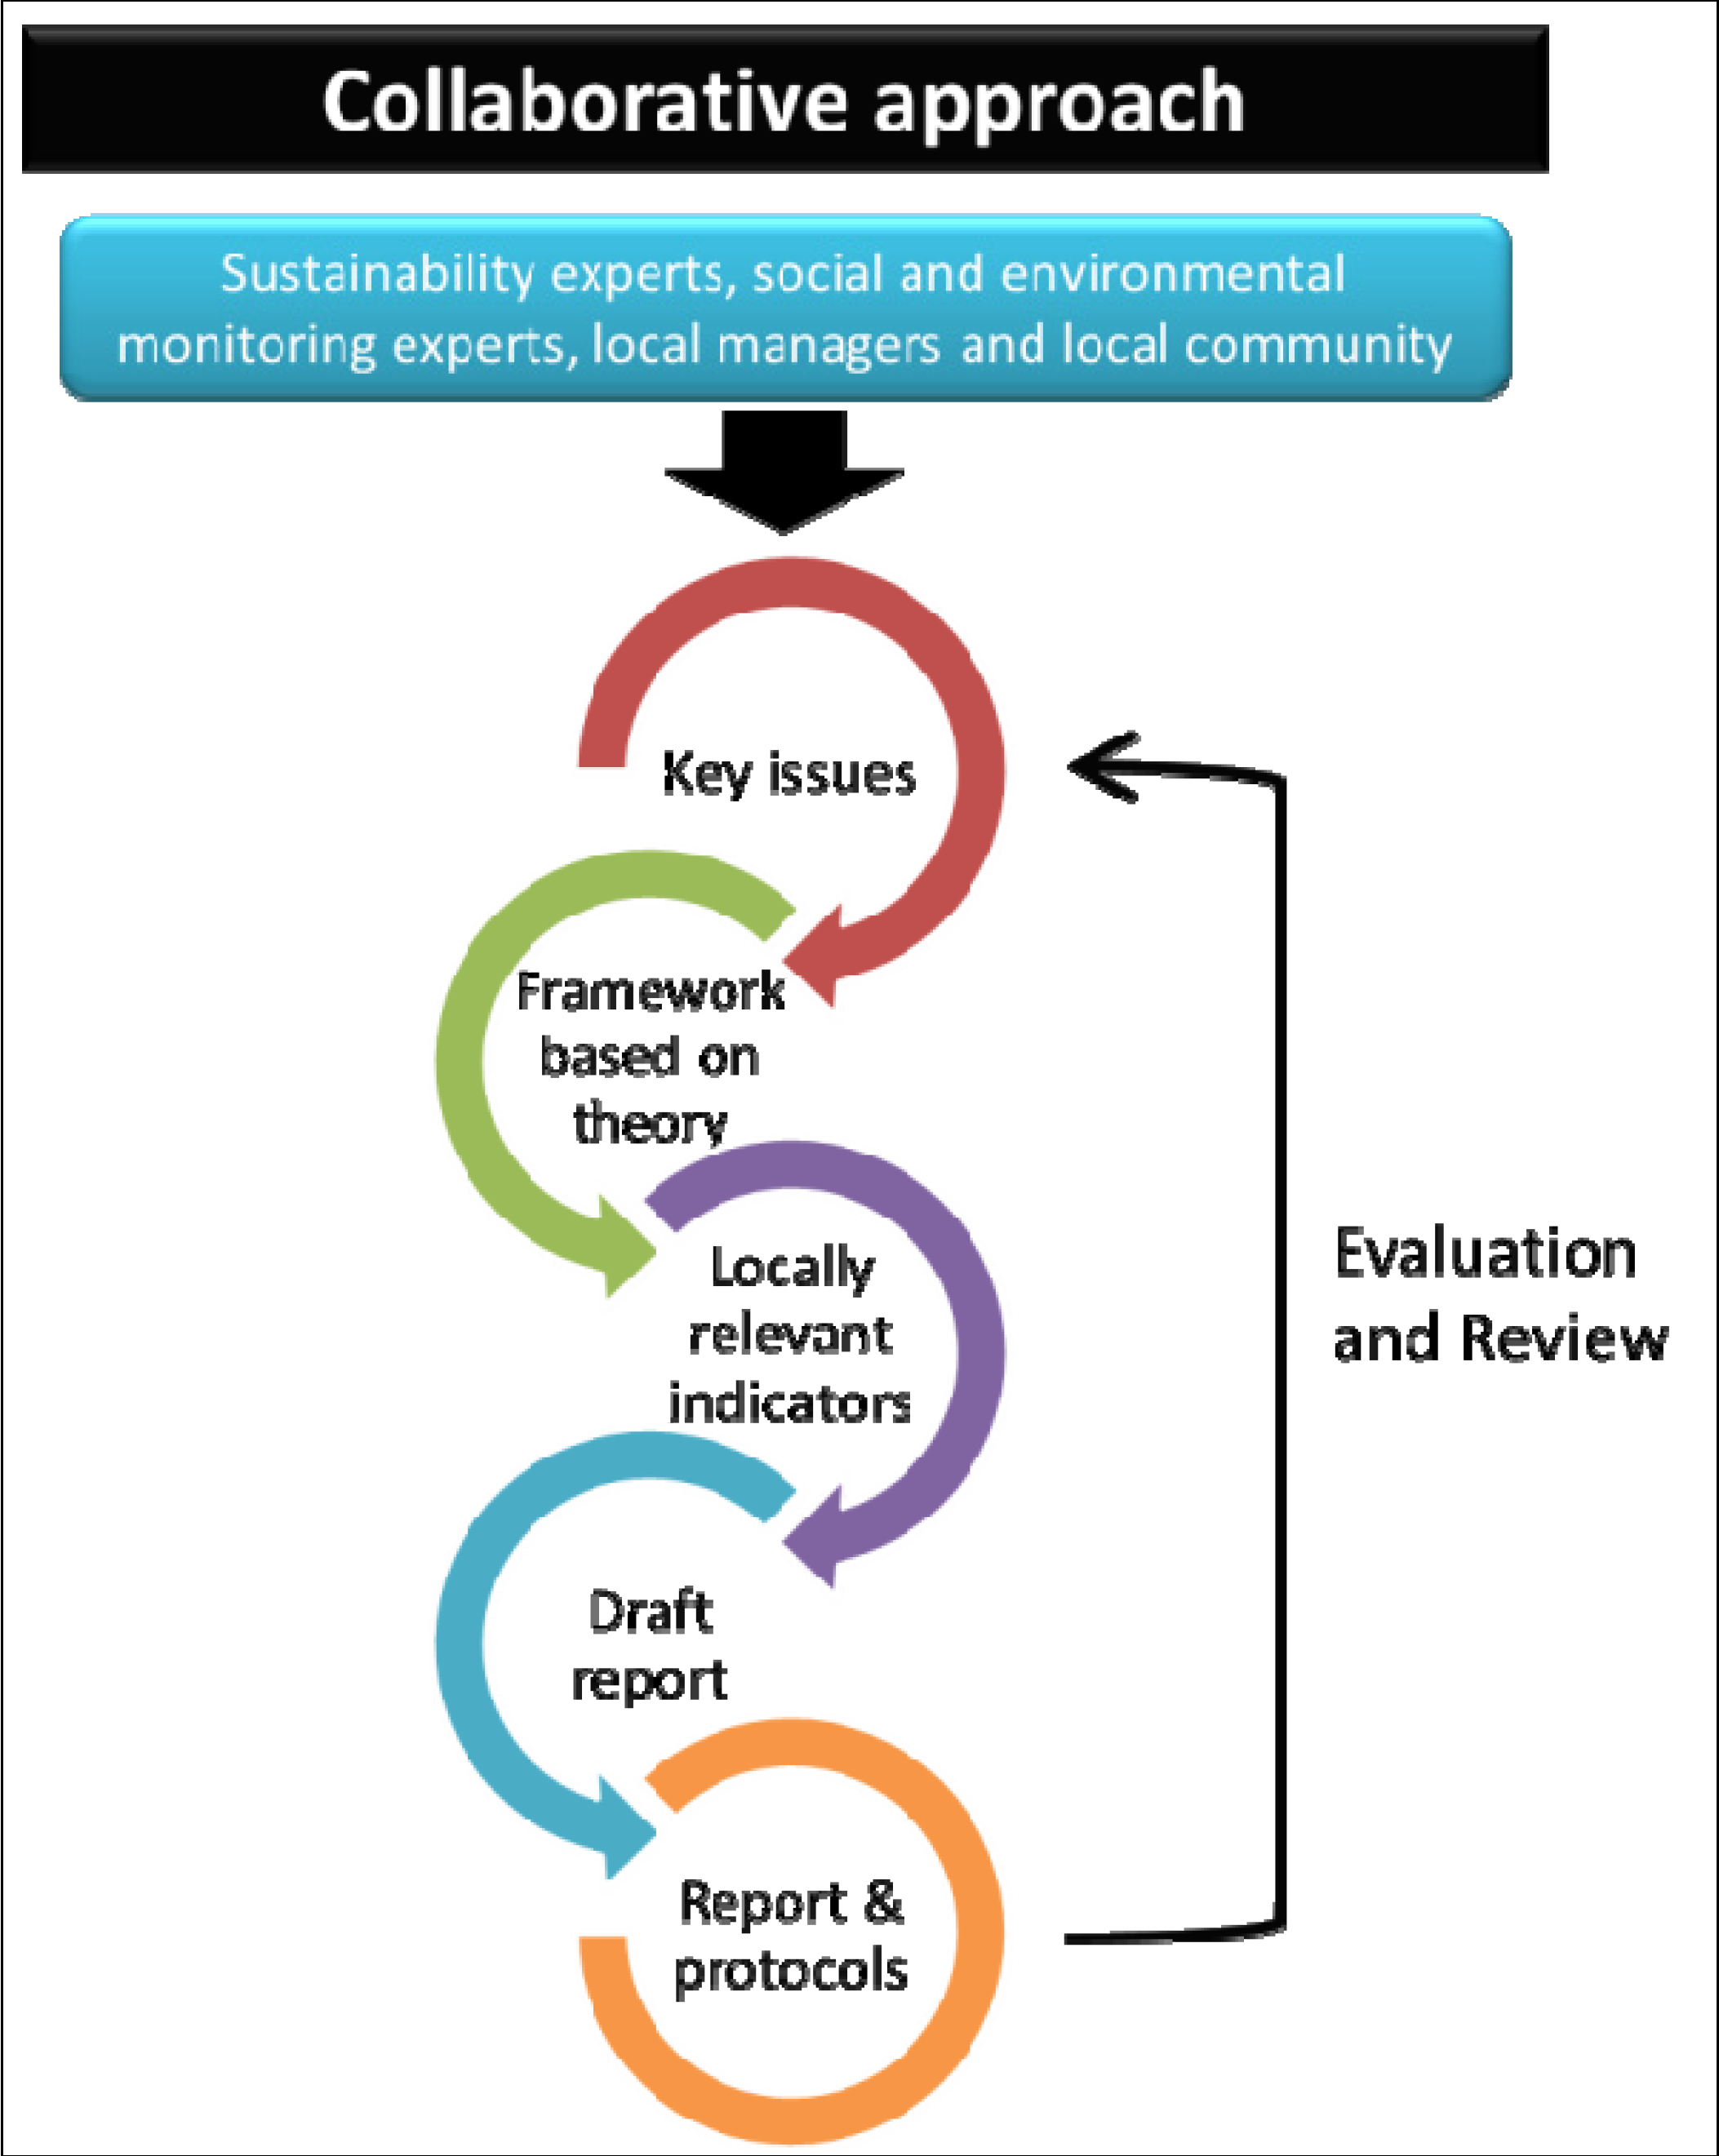
2. The Collaborative Approach to Developing Sustainability Reporting Tools

3. Regional Sustainability Indicators Framework for South West Victoria
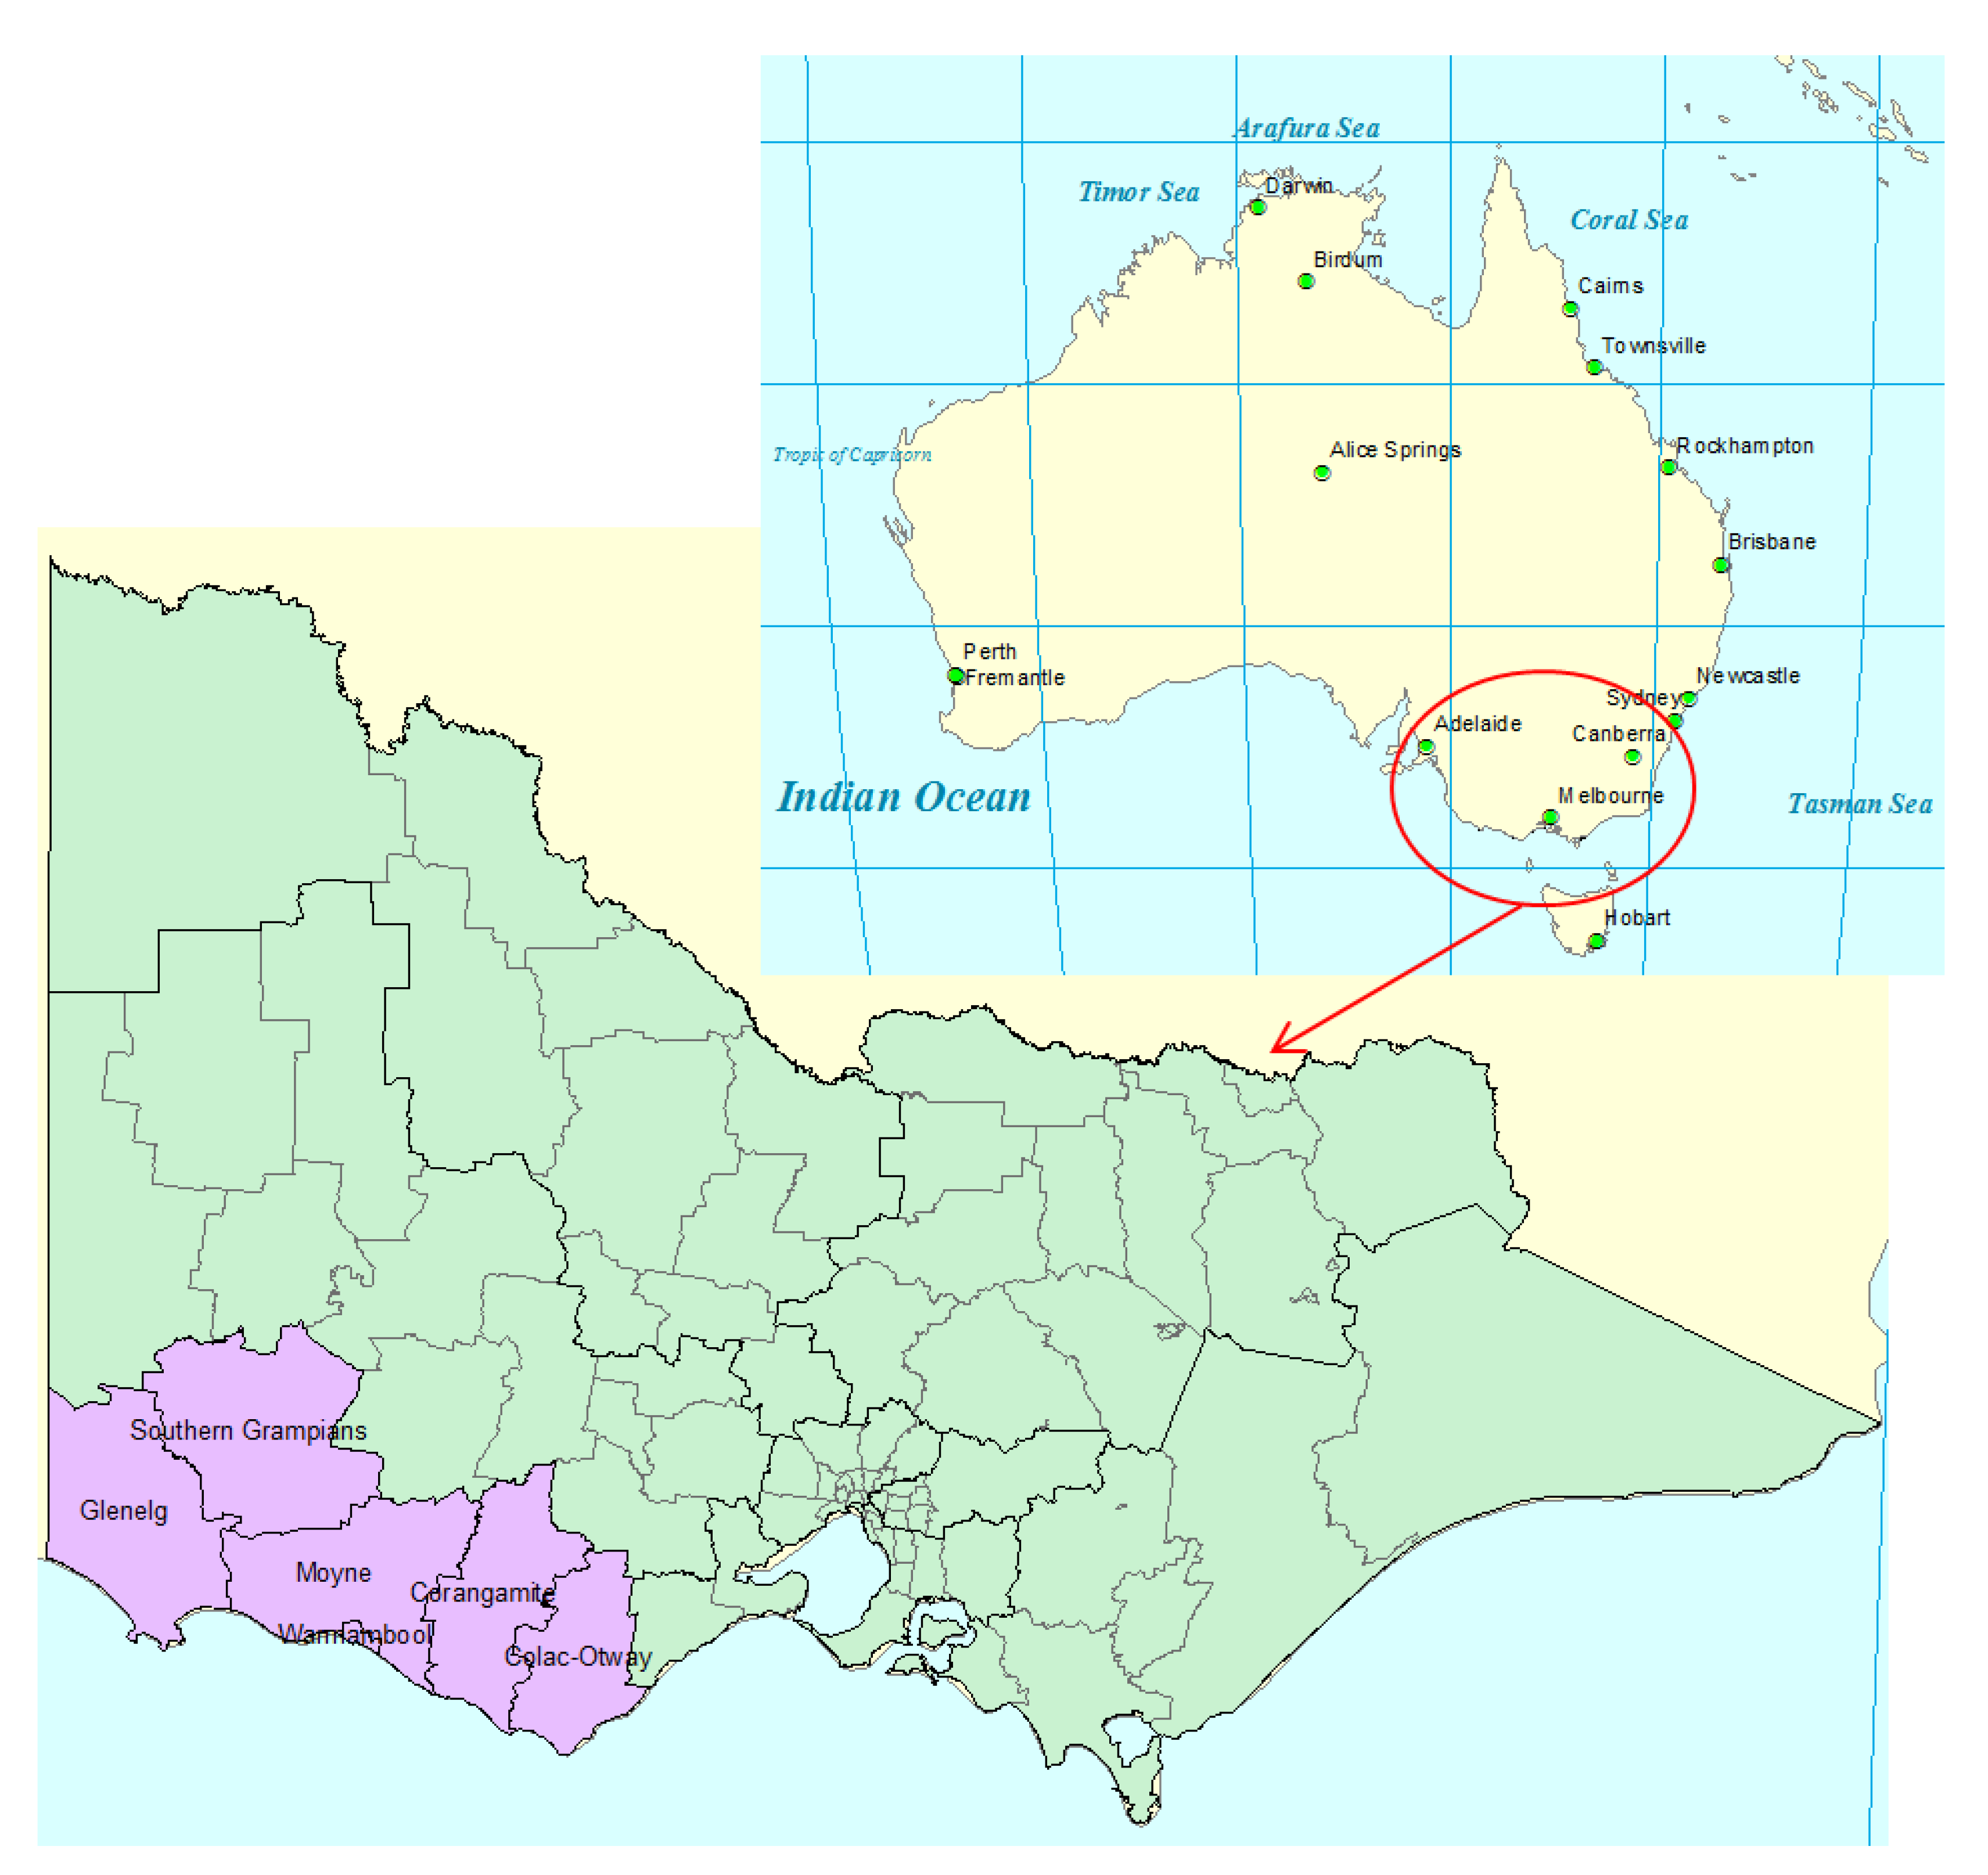
3.1. Study Area—South West Victoria

3.2. Method
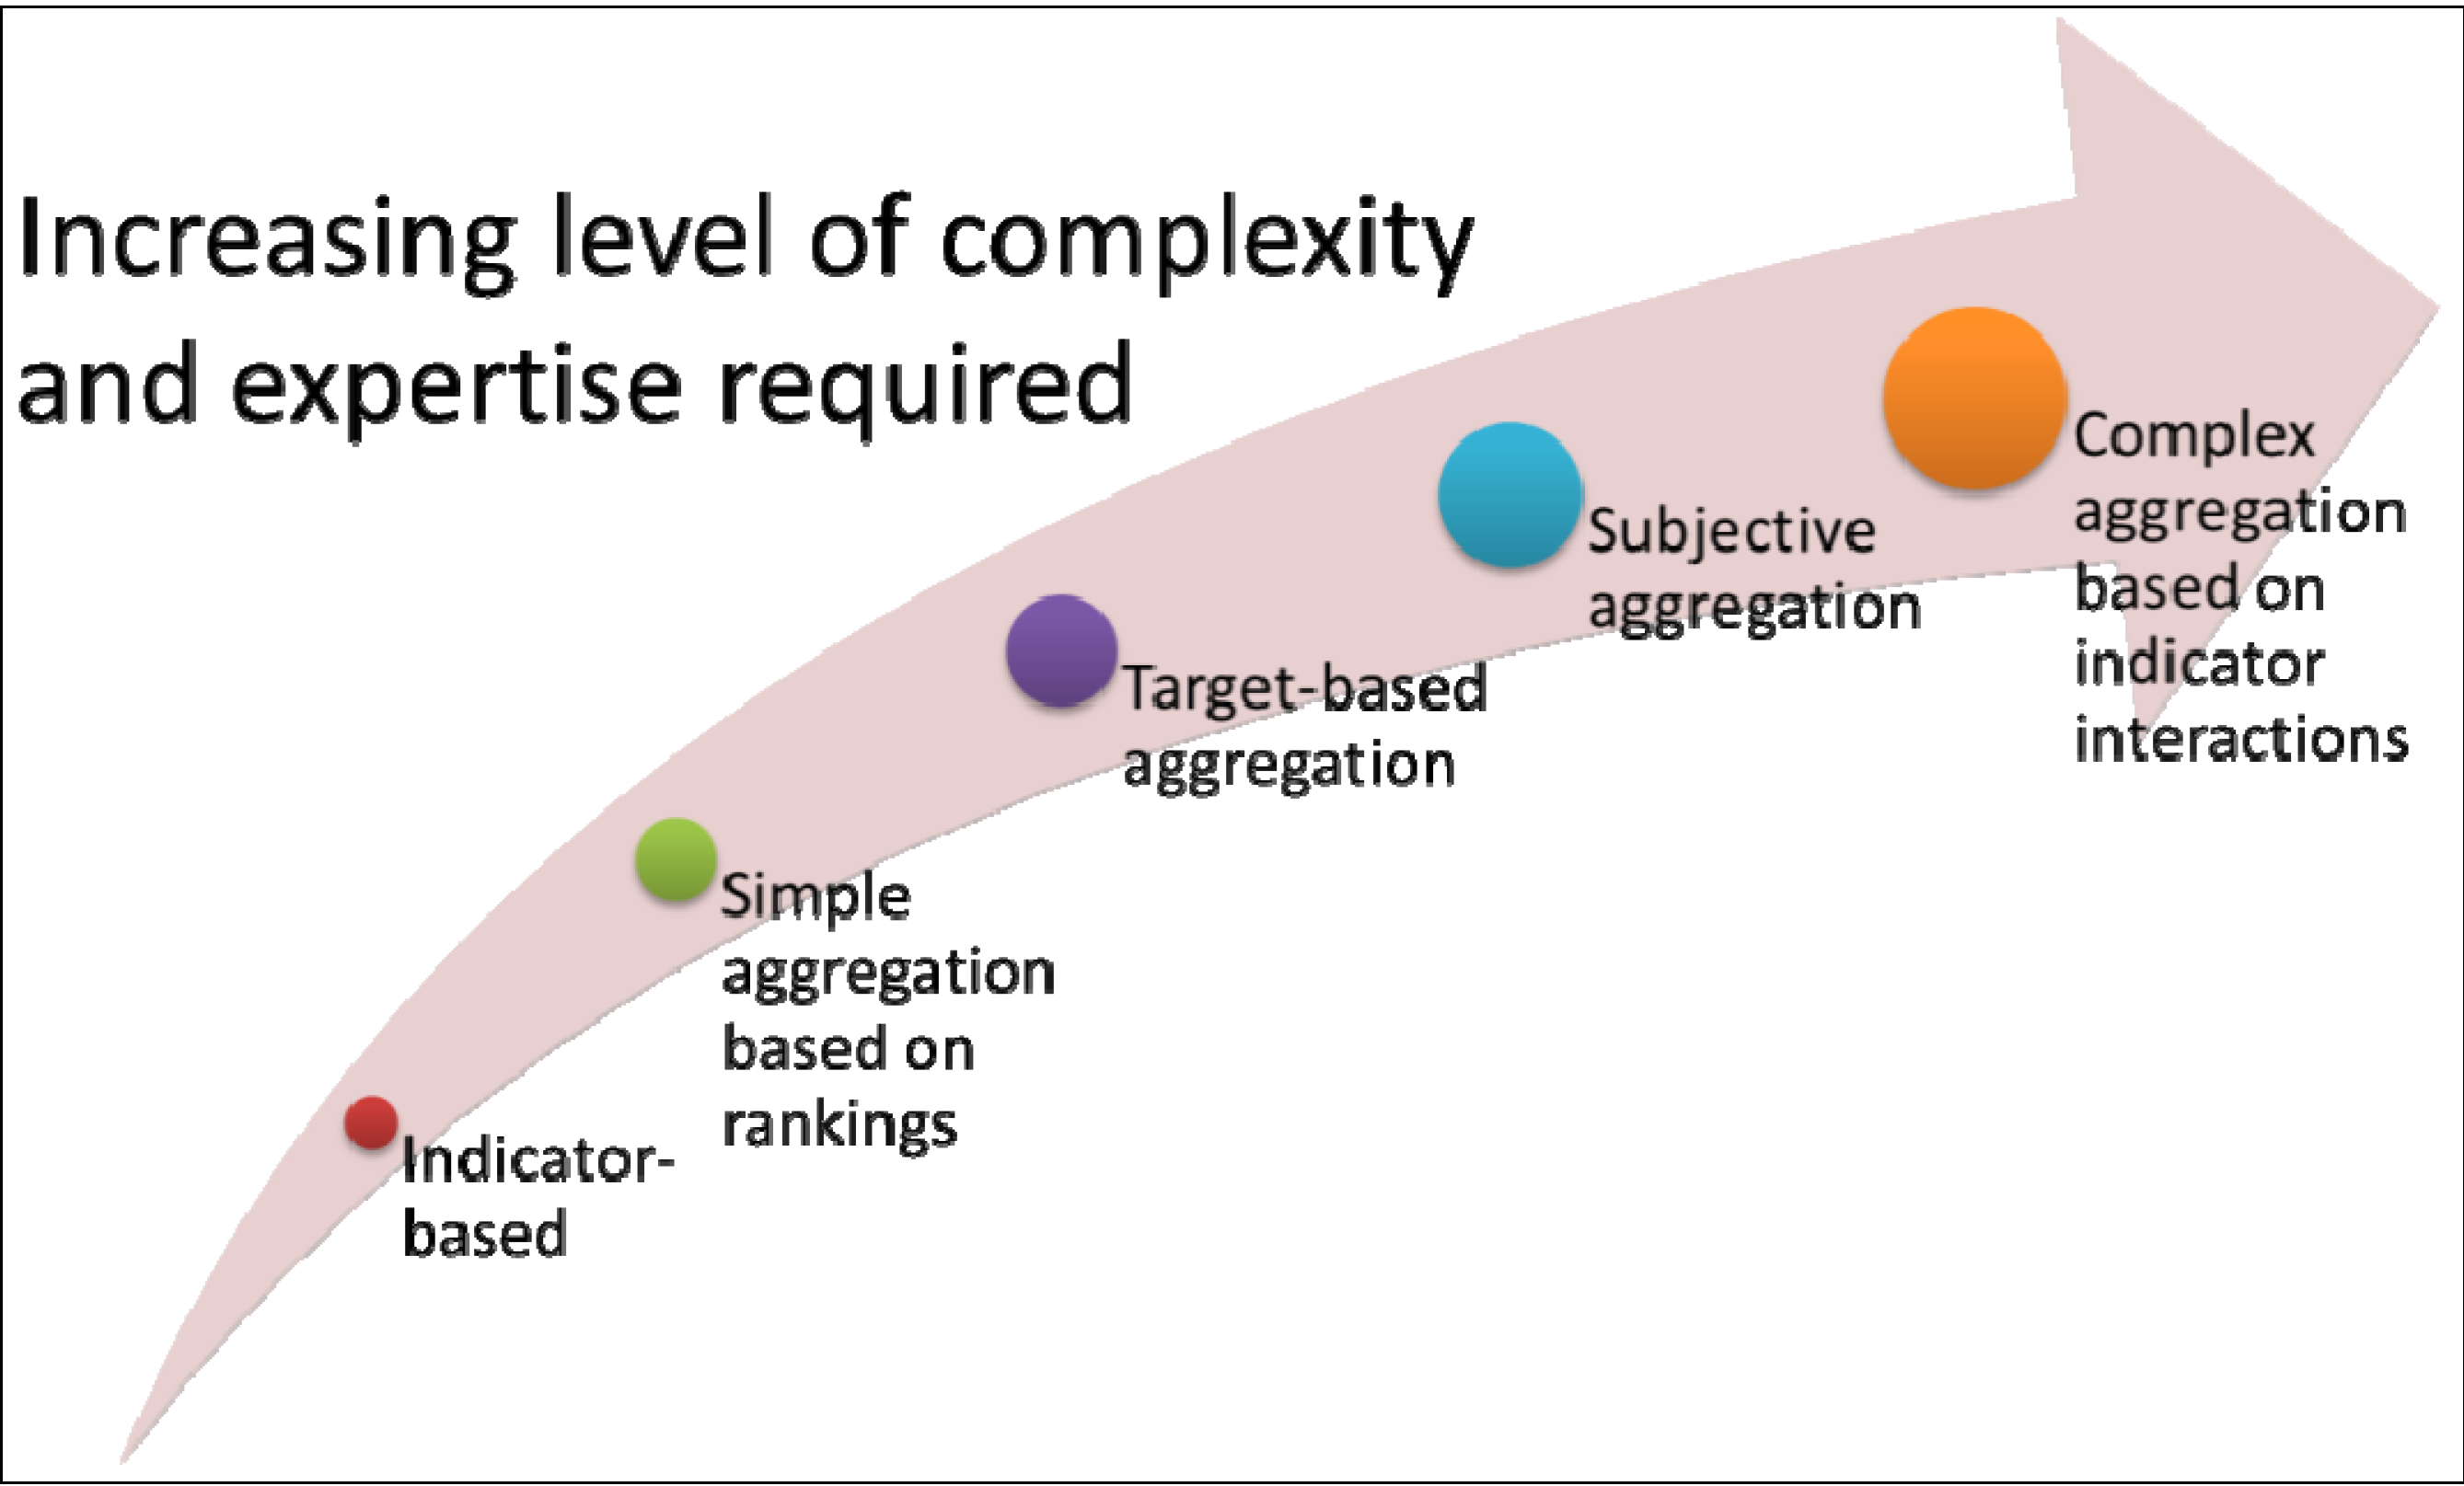
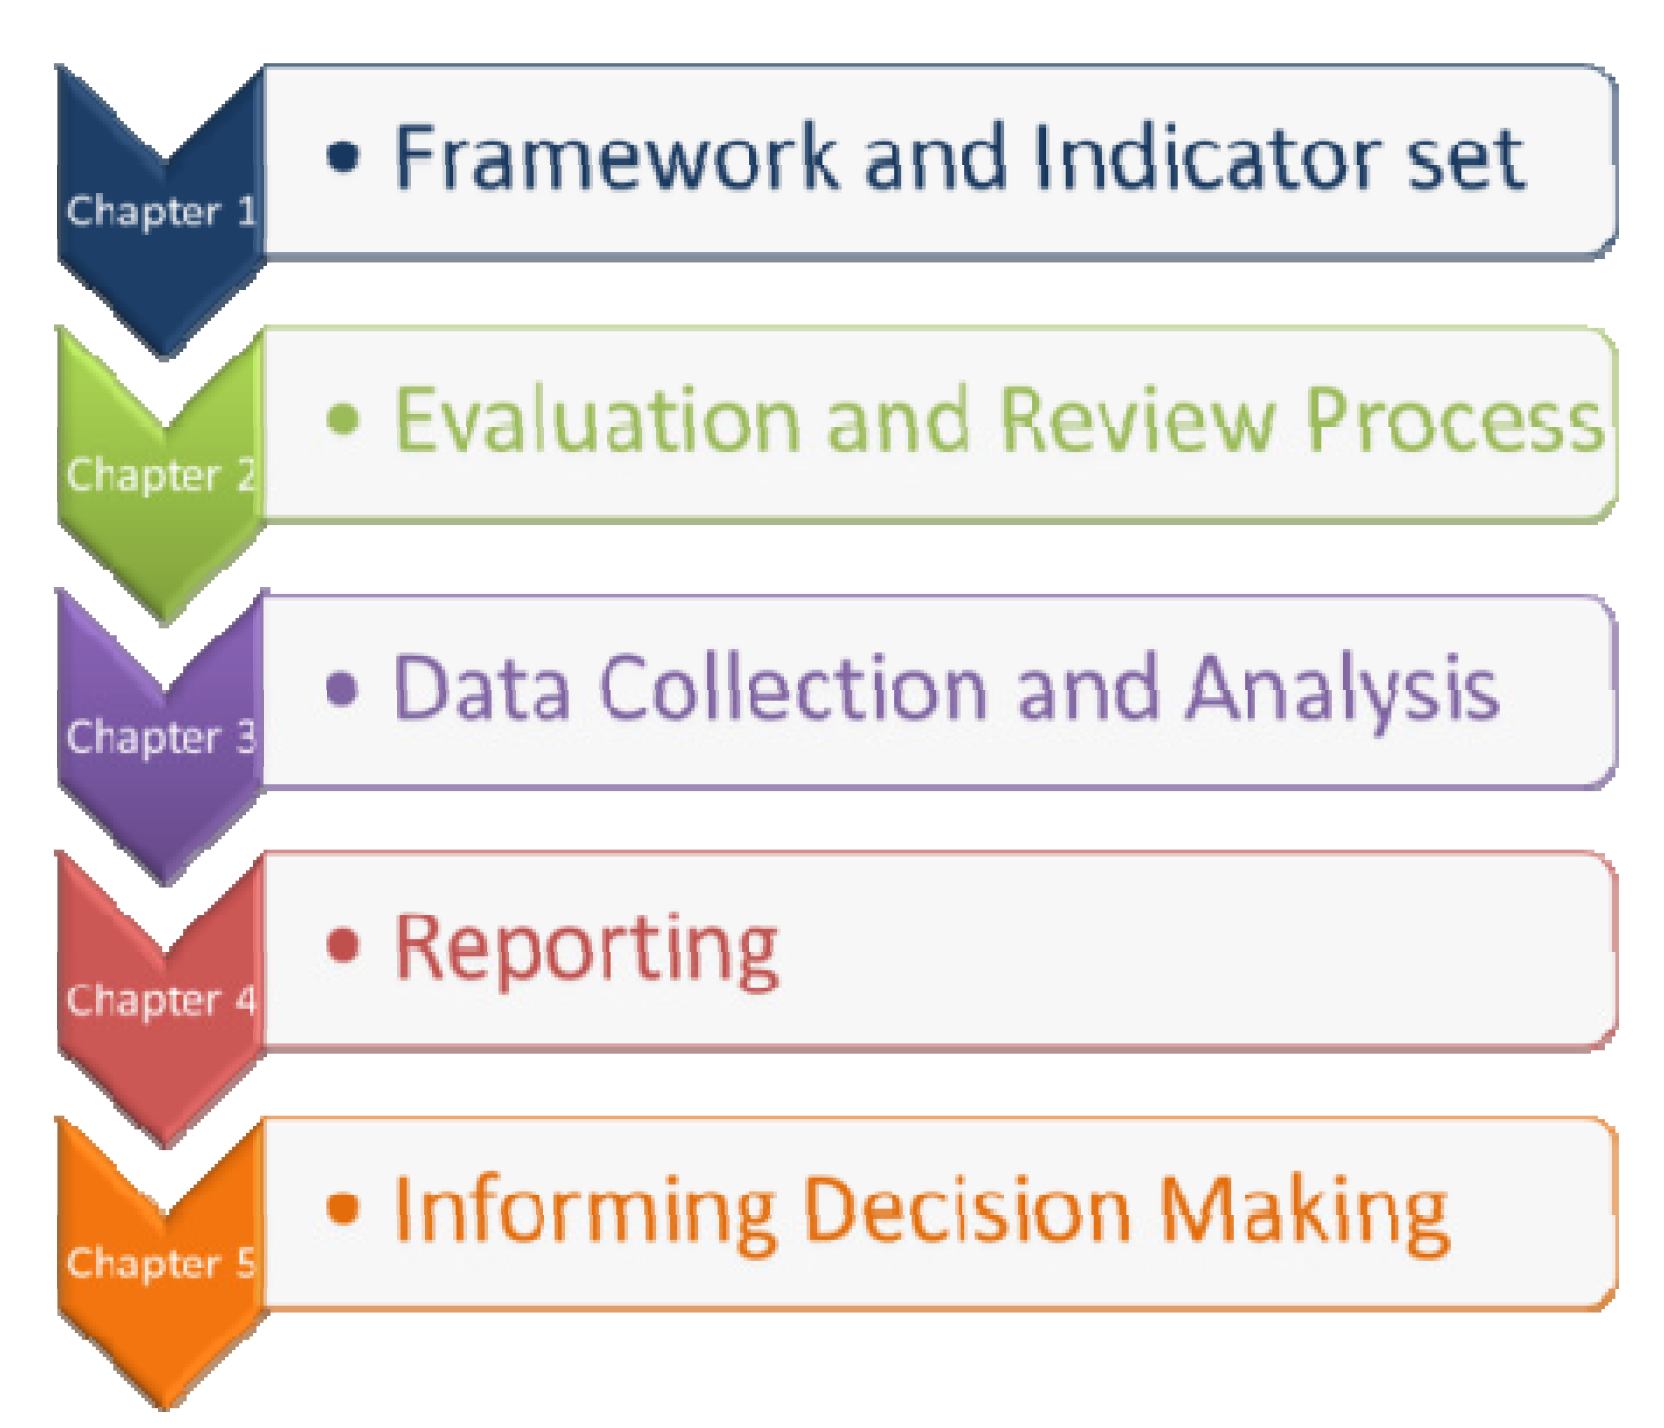
3.2.1. Sustainability Reporting Tool Framework
3.2.2. Agreed Indicator Set
- (1)
- Is the indicator:
- Relevant and valuable to the region (i.e., tells us about a key issue)?
- Easily understood by the average person?
- Appropriate for the regional/local government scale?
- (2)
- Will the indicator:
- Flag dangerous or irreversible problems?
- Measure progress to achieving our sustainability vision?
- Provide information in the future?
- (3)
- Can the indicator be:
- Acted on by regional community or authorities?
- Easily measured?
- Measured repeatedly with confidence in the result?
- Fit with other reporting in the region (such as State of the Environment reporting)?
- (4)
- What are the indicators main limitations?
3.2.3. Evaluation of Indicators
- An appropriate measure for the indicator
- Whether data was available for the measure for all Council areas in the region
- If the methods used for data collection were valid and reliable methods
- Whether the data was comparable across data collection years (i.e., were the same methods used for each year?)
- If and when the next data collection will be carried out
- Methods for data analysis based on sustainability theory, including methods for new indices where no current measures or methods were available
3.2.4. Draft Reports
3.2.5. Finalization of the Reports
3.2.6. How-to-Use Guide
3.2.7. Communication Locally, Statewide and Nationally
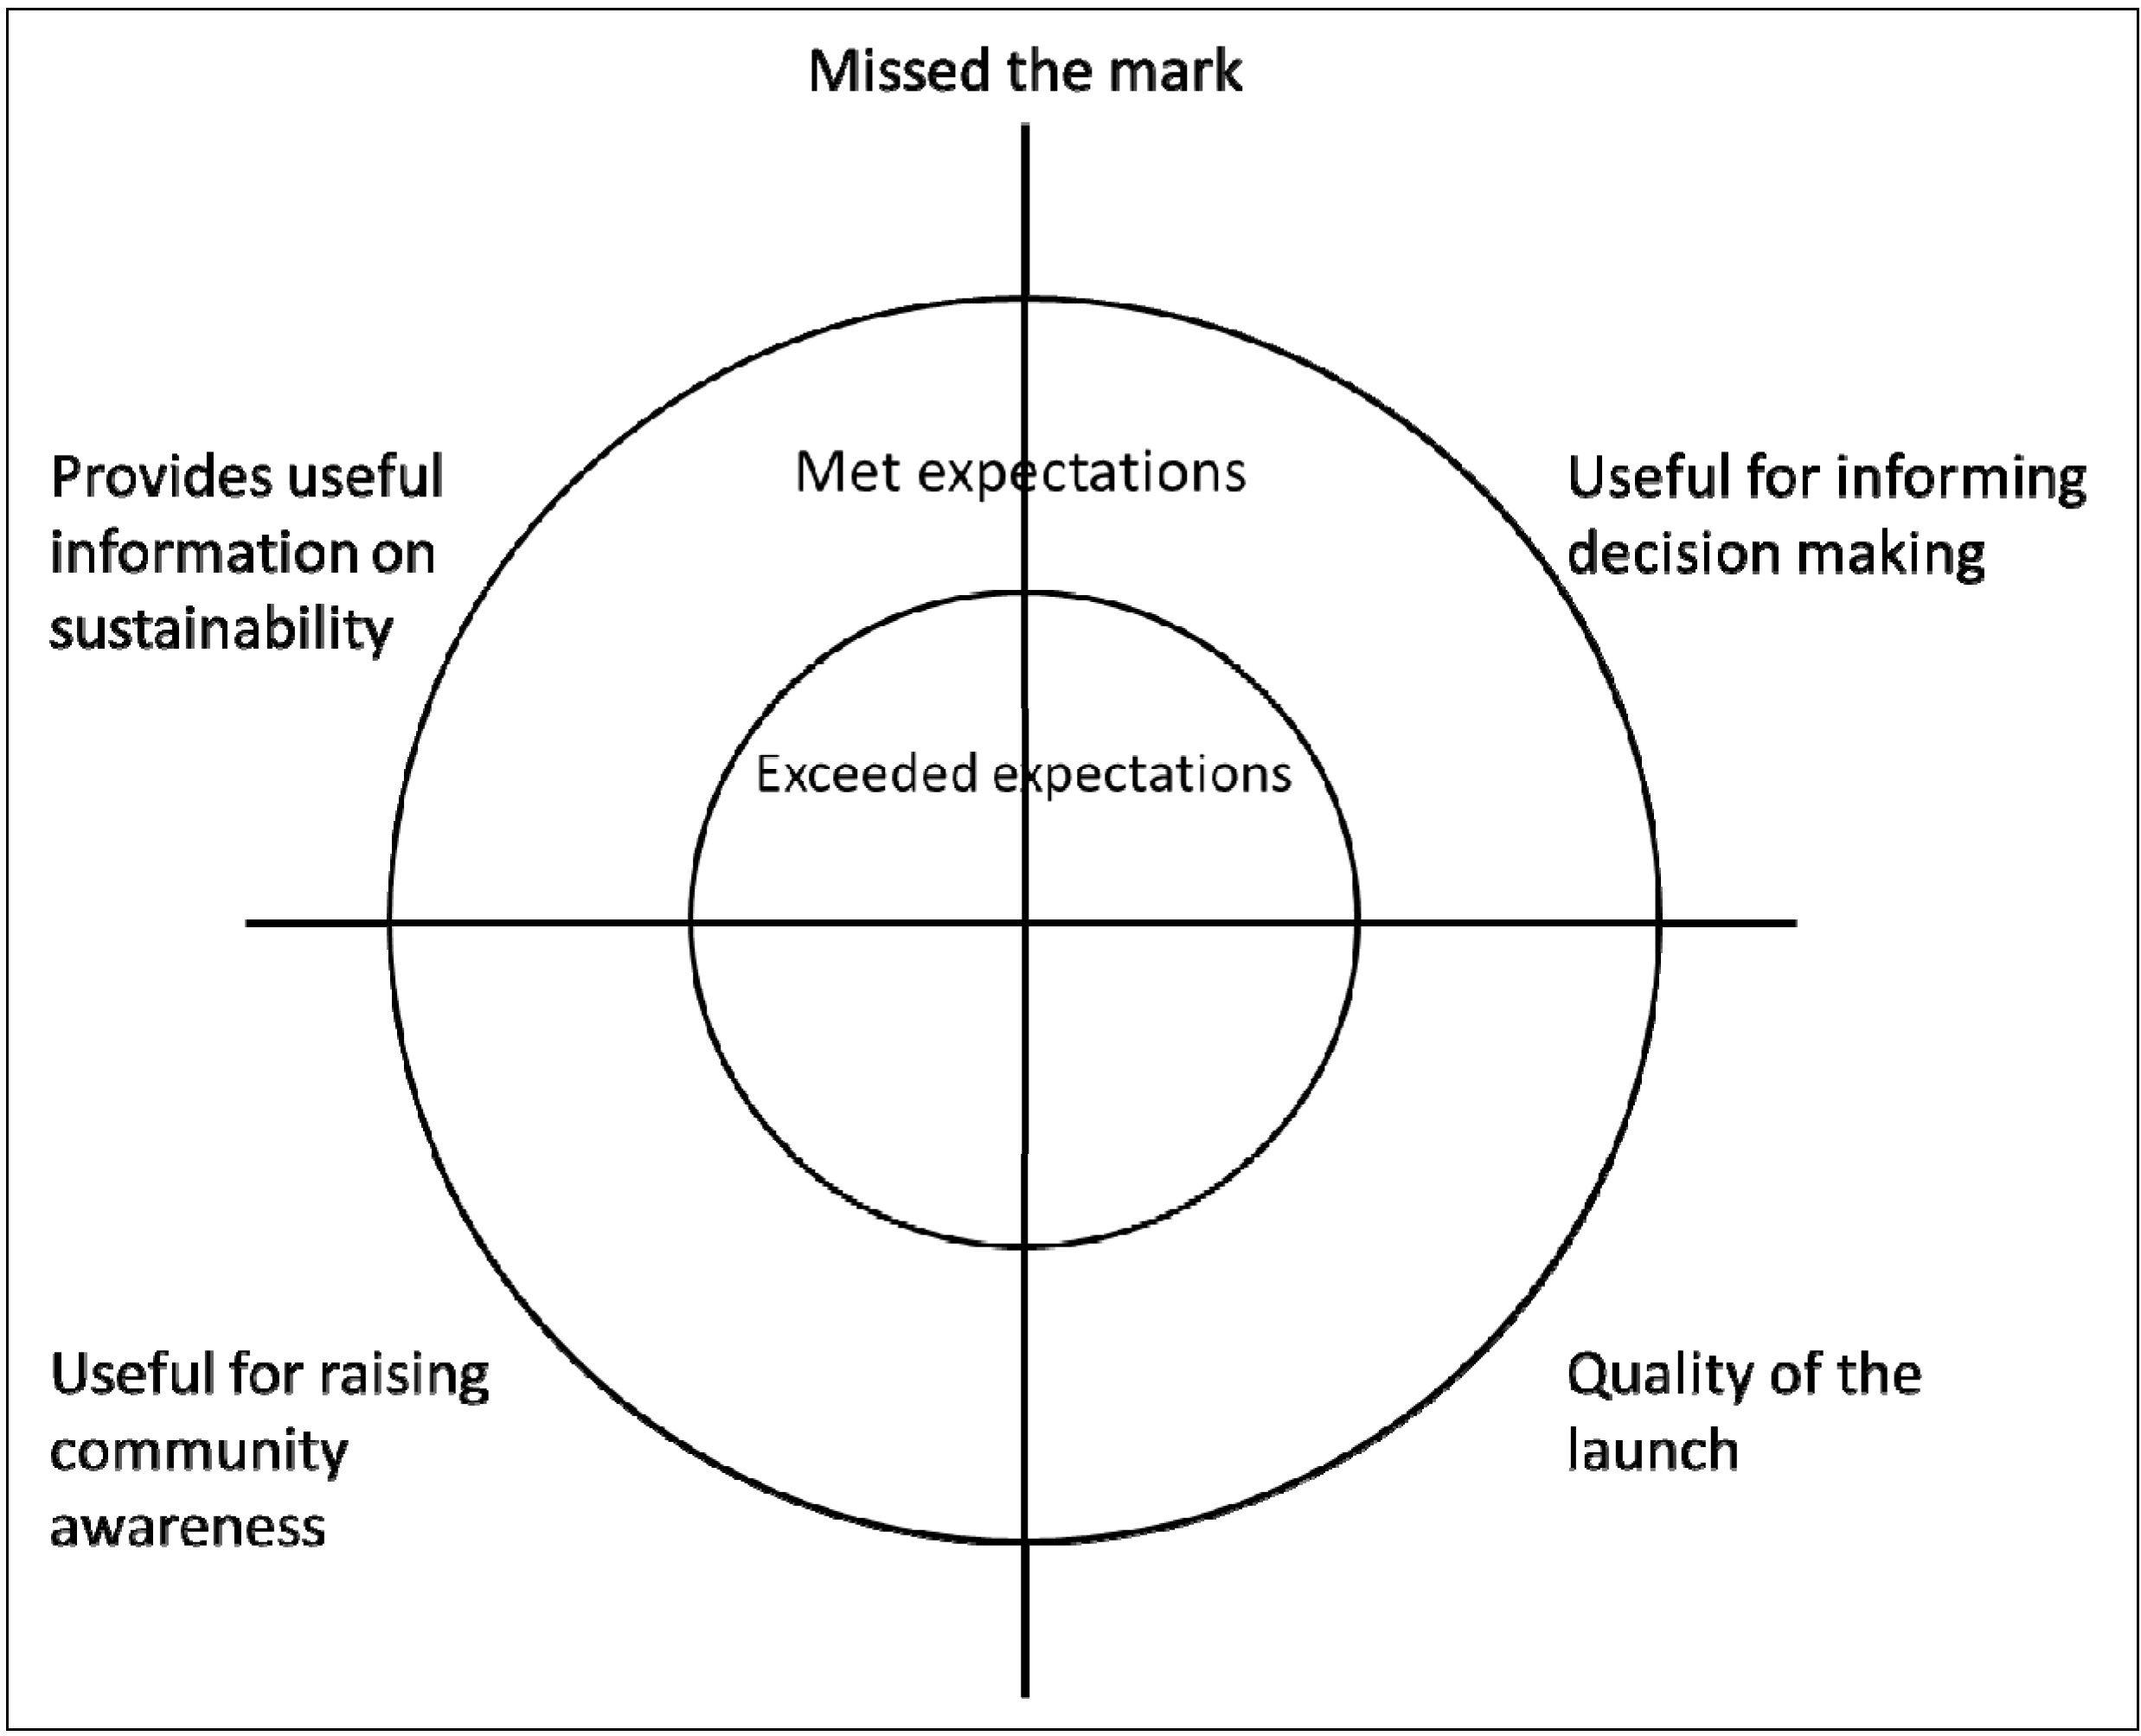
3.2.8. Evaluation of the Tool and the Project
- Provides useful information on sustainability
- Useful for informing decision making
- Useful for raising community awareness
- Quality of the launch

4. Results: The Great South West Community Report Card
4.1. Framework for the Great South West Community Report Card
“The Great South West is a great place to live, work and visit with great lifestyle choices. We are happy, healthy and well educated, and engaged in a thriving, multifaceted and resilient economy with a focus on ‘clean green’ goods. We value our environment and act together to ensure a healthy and beautiful environment for our community, and its visitors, to enjoy now and into the future”[39]
“To report on the sustainability of the region to Local Governments, local organizations, industry and community enabling informed decision making to enhance the region’s sustainability”.

- A report card called The Great South West Community Report Card designed to provide a quick snapshot of the sustainability of the region
- A technical report containing all the data and analysis, including trend and condition, as well as information on the links to sustainability and the key issues of the region to provide an evidence base for decision makers
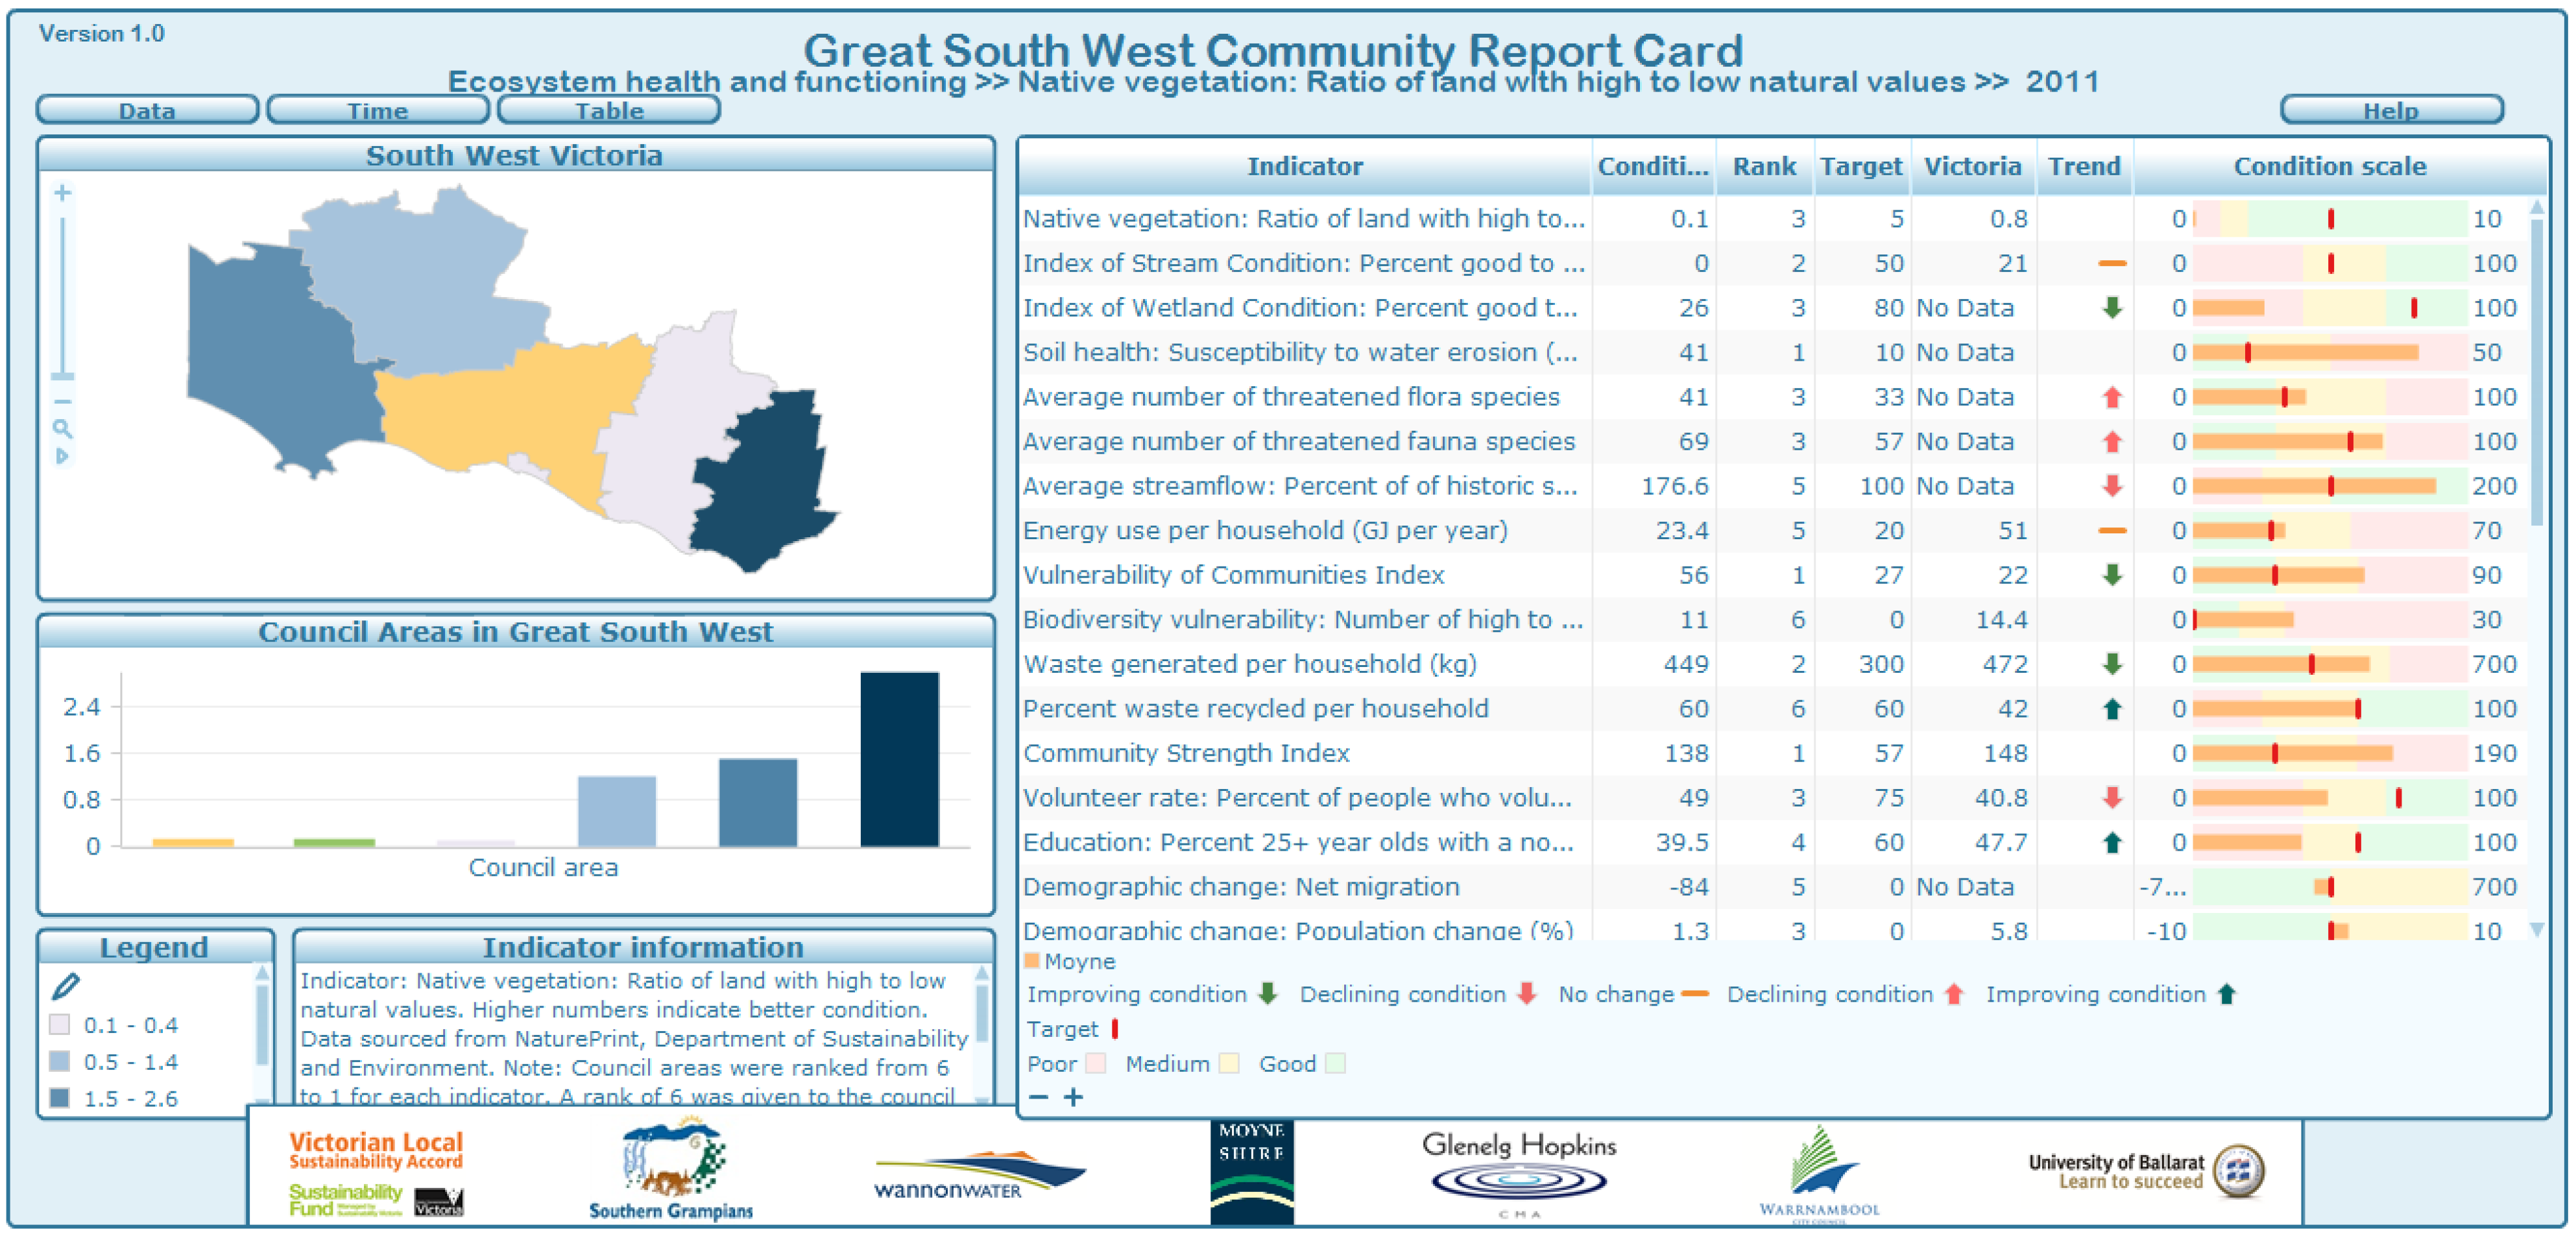
- An online interactive indicator report with all the indicator data which can be updated when new data becomes available for up-to-date information.
| Key Issues |
|---|
| Degradation of natural ecosystems health and functioning; Changes in population; Impacts on economic wellbeing including labor and skills shortages and ability to retain staff; Community wellbeing issues such as violent crime, family violence, health and resilience; Climate change impacts on the region; Services and infrastructure provision issues; Lack of strong regional planning and resultant land use change impacts; Resource issues including water, green energy, organic waste, food security, community capacity and education |
4.2. Indicators for the Great South West Community Report Card
| System/key issue | Indicator | Measure |
|---|---|---|
| Ecosystem wellbeing | ||
| Ecosystem health and functioning | Condition of parks and reserves | No data available |
| Condition of native vegetation | Ratio of land with high to low natural values | |
| Health of waterways | Index of Stream Condition: percent good to excellent ratings | |
| Health of waterways | Index of Wetland Condition: percent good to excellent ratings | |
| Health of waterways | Index of Estuarine Condition | |
| Soil Health | Susceptibility to water erosion (% land area) | |
| Status of flora and fauna | Average number of threatened flora species | |
| Status of flora and fauna | Average number of threatened fauna species | |
| Climate Change | Average streamflows compared to historical average | Average streamflow: percent of historical streamflow |
| Household energy use | Energy use per household (GJ) | |
| Vulnerability Index to climate change | Vulnerability of Communities Index (includes dependence on agriculture, number of dependent/vulnerable people and exposure to climate change impacts such as high temperatures, changed rainfall patterns, frosts and sea level rise) | |
| Vulnerability Index to climate change impacts | Biodiversity vulnerability: Number of high to very high risk ratings | |
| Waste management | Waste to landfill from households | Waste generated per household (kg) |
| Waste recycling rate of households | Percent waste recycled | |
| Human Wellbeing | ||
| Community Wellbeing | Community Wellbeing Index | Community Strength Index (includes amenity, ability to get help, community participation and selected outcomes, e.g., safety, diversity and feeling valued by society) |
| Volunteer rate | Percent of people who volunteer | |
| Education levels attained | Percent 25+ year olds with a non-school qualification | |
| Demographic change | Net migration | |
| Demographic change | Population change (%) | |
| Demographic change | Change in age structure (%) | |
| Participation rates of young people | Percent of 15–19 year olds fully engaged in work or study (%) | |
| Participation rates of young people | Percent of 15–19 year olds not engaged in work or study (%) | |
| Participation rates of young people | Percent of 15–19 year olds employed full-time | |
| Participation rates of young people | Percent of 15–19 year olds studying or part-time work | |
| Number of cultural, sporting, recreation, arts and craft events and local food markets | Participated in Arts and Related Activities in the Last Month (%) | |
| Number of cultural, sporting, recreation, arts and craft events and local food markets | Opportunities to Participate in Arts and Related Activities (%) | |
| Violent crime rates | Crimes against the person rate per 100,000 population | |
| Economic wellbeing | Unemployment rate | Percent of labour force unemployed |
| Employment diversity | Number of sectors with 5% of workforce | |
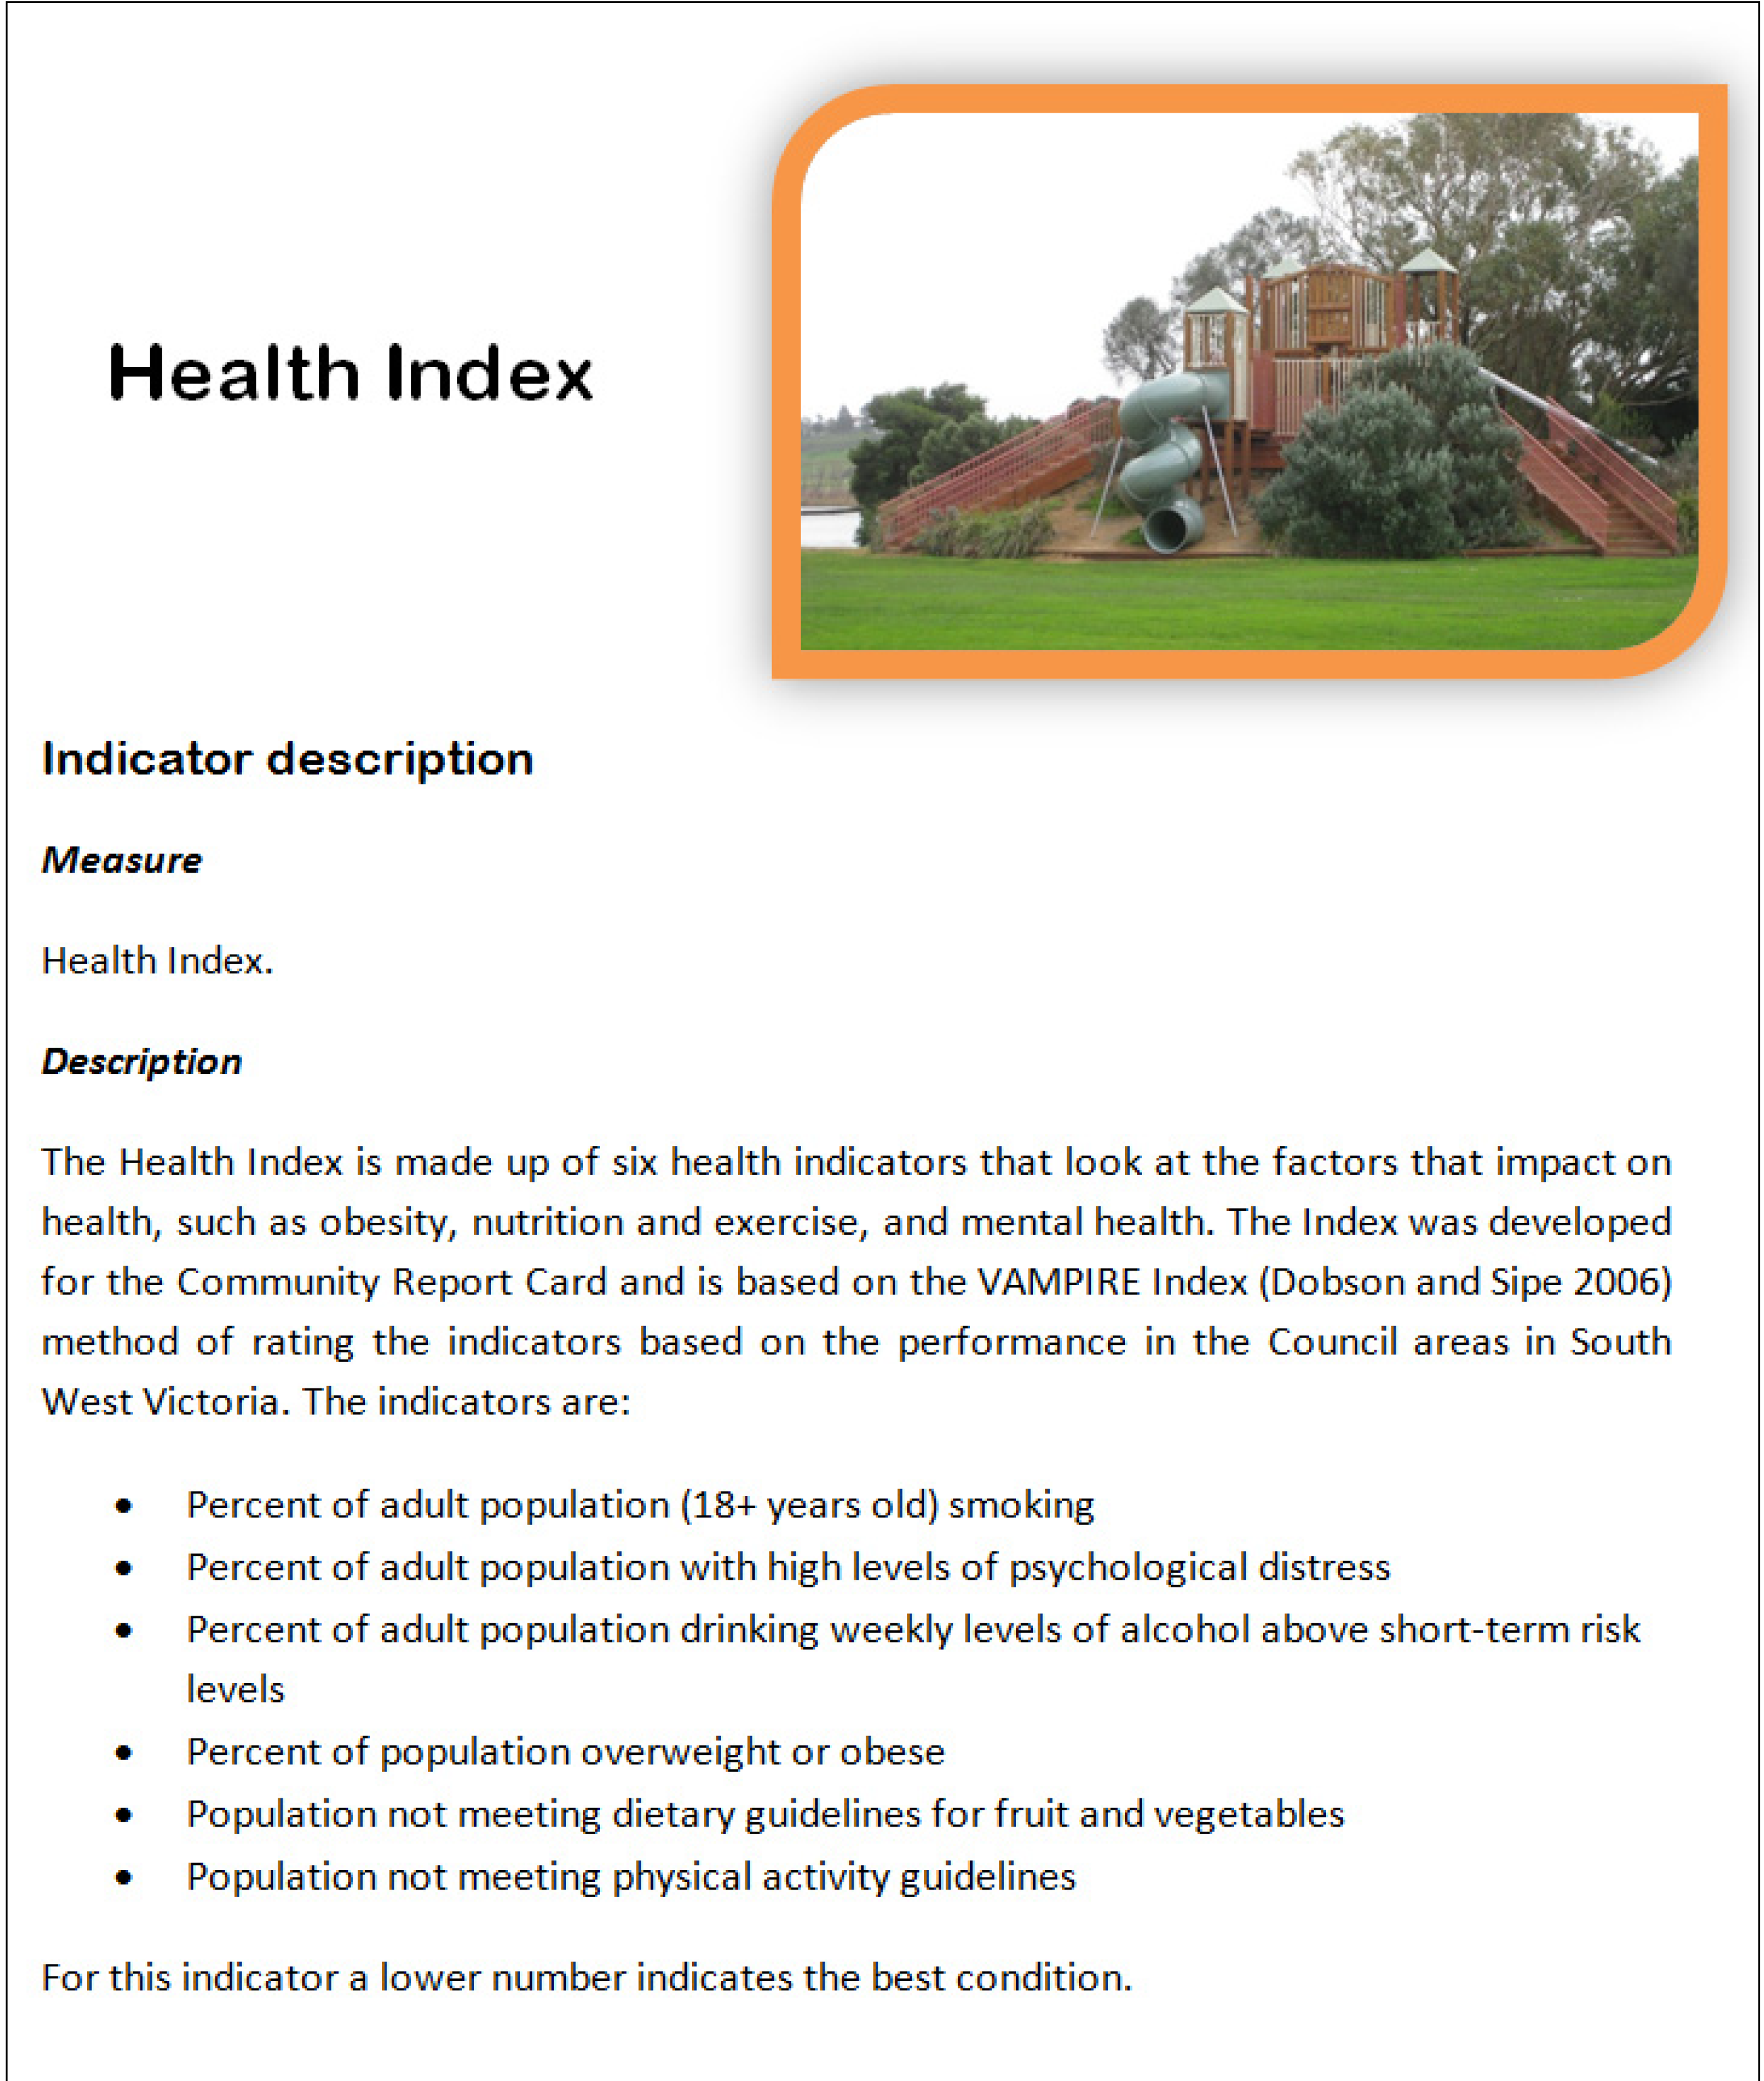
| Healthy lifestyles | Health Index | Health Index (includes smoking, psychological distress, alcohol consumption, obesity, consumption of fruit and vegetables and physical activity) |
| An index of sustainable lifestyles | Sustainable Lifestyles Index (includes shower time, plastic bag use packaging choice, power use, buying local, growing own food, red meat consumption, composting, and transport use) | |
| Regional planning | Land use change vs. land suitability | No method or data available |
| Implementation of environmental/sustainability strategy actions | No data available | |
| Roads and transport | Access to public transport | Percent who live close to public transport |
| Road condition and maintenance | No data available | |
| Access to services | Access to healthcare | Access to hospital services in local area (self-sufficiency) |
| Access to healthcare | General practitioners per 1,000 population | |
| Affordability | Housing affordability | Percent households with housing costs 30% or more of gross income |
| Housing affordability | Percent of renters with renting costs 30% or more of gross income | |
| Housing affordability | Percent purchasers with mortgage costs 30% or more of gross income | |
| VAMPIRE Index | VAMPIRE Index: vulnerability to mortgage, oil and inflation stress (includes percent people working who undertook a journey to work by car; percent households with 2 or more cars; median weekly household income; and percent dwellings being purchased) |
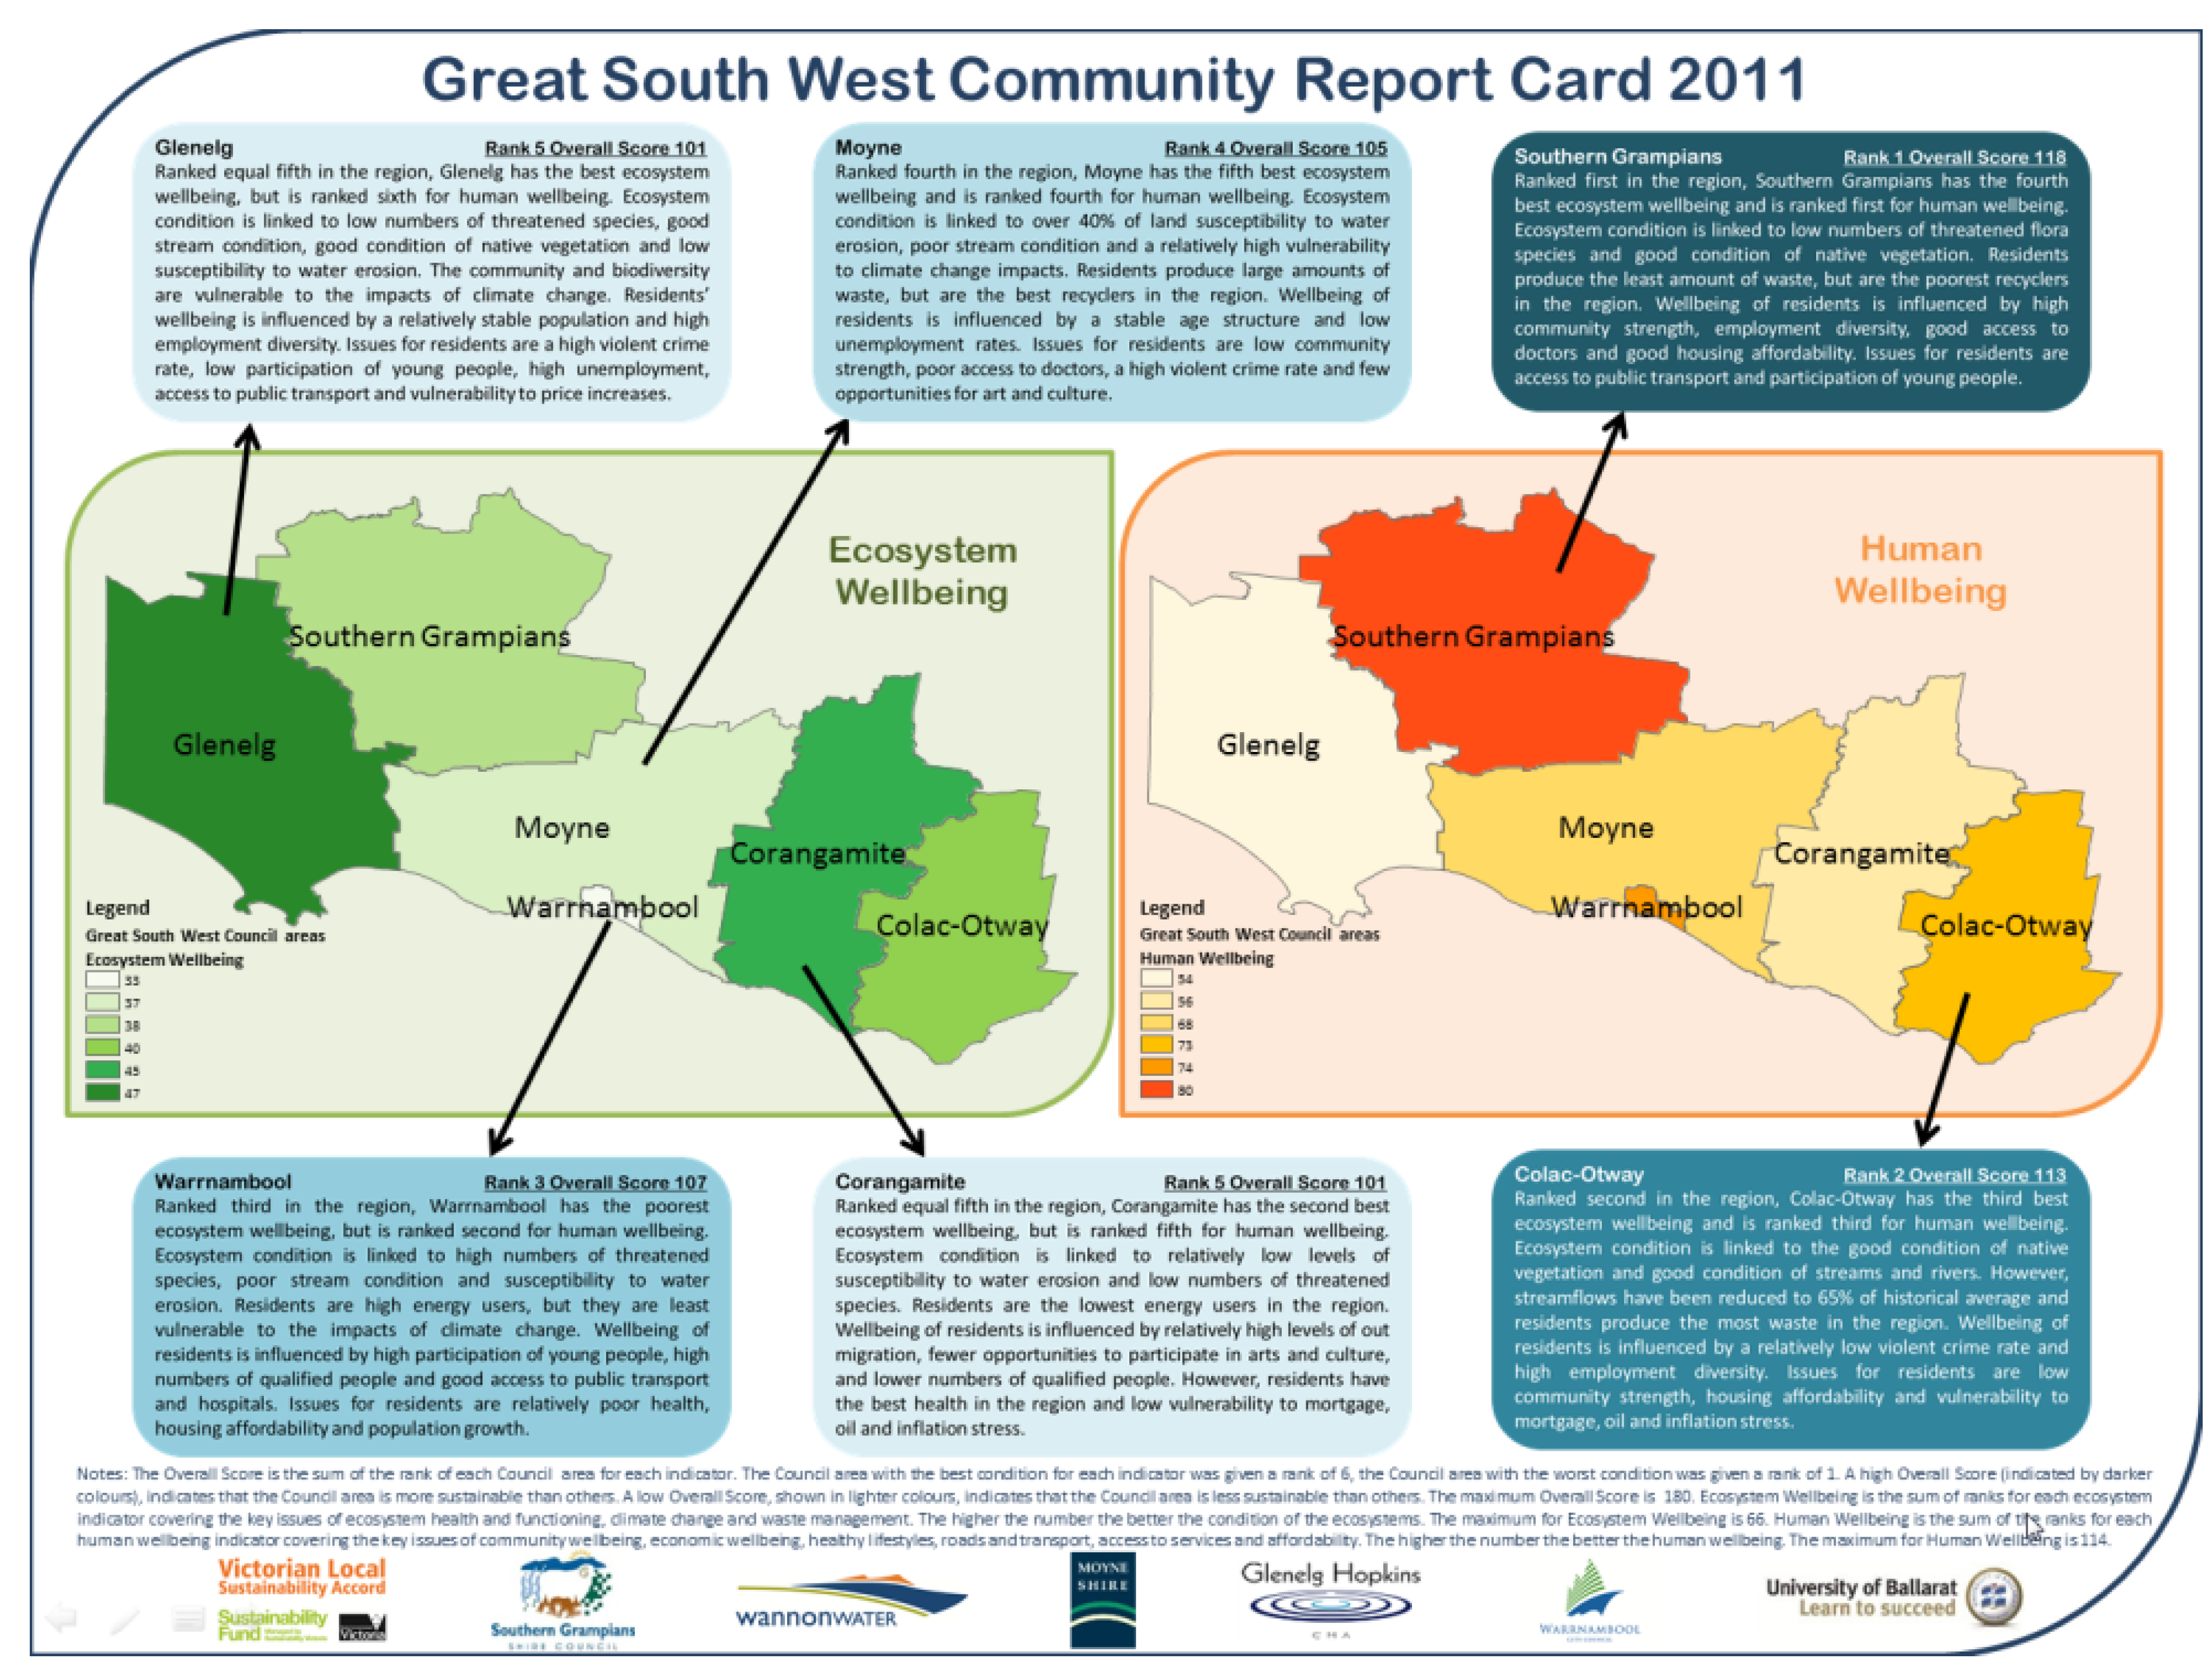
4.3. The Great South West Community Report Card


4.4. Evaluation of the Great South West Community Report Card
“The Report Card brings together a range of valuable indicative information not otherwise normally conveniently available in one place. While there are no empirical absolutes about many of the measures their value will assume greatest value for sustainability when the data collection is repeated annually or biannually over an extended period of time. An evaluation 5 to 10 times over, say, a 10 year period (when the impact of minor annual variability will start to fade) will be of great value in identifying successful and/or problem areas of both environmental and social sustainability.”
5. Implications of Using a Collaborative Approach to Develop a Sustainability Reporting Tool

Acknowledgments
Conflicts of Interest
References
- Forum for the Future. In Sustainable Cities Index 2007; Forum for the Future: London, UK, 2007.
- Prescott-Allen, R. The Wellbeing of Nations: A Country-by-Country Index of Quality of Life and the Environment; Island Press: Washington, DC, USA, 2001. [Google Scholar]
- Wackernagel, M.; Rees, W.E. Our Ecological Footprint: Reducing Human Impact on the Earth; New Society Publishers: Gabriola Island, BC, Canada, 1996. [Google Scholar]
- Graymore, M.L.M.; Wallis, A.M.; Richards, A.J. An Index of Regional Sustainability: A GIS-based multiple criteria analysis decision support system for progressing sustainability. Ecol. Complex. 2009, 6, 453–462. [Google Scholar] [CrossRef]
- Richards, A.J.; Wallis, A.M.; Graymore, M.L.M. An Index of Regional Sustainability (AIRS): Incorporating system processes into sustainability assessment. In Presented at the 2007 ANZSEE Conference, Re-inventing Sustainability: A climate for change. Noosa Lakes, Queensland, Australia, 3–6 July 2007.
- Esty, D.C.; Levy, M.; Srebotnjak, T.; de Sherbinin, A. Environmental Sustainability Index: Benchmarking National Environmental Stewardship; Yale Center for Environmental Law & Policy: New Haven, CO, USA, 2005. [Google Scholar]
- Pini, B.; Wild River, S.; Haslam McKenzie, F.M. Factors Inhibiting Local Government Engagement in Environmental Sustainability: Case studies from rural Australia. Aust. Geogr. 2007, 38, 161–175. [Google Scholar] [CrossRef]
- Graymore, M.L.M.; Sipe, N.G.; Rickson, R.E. Regional Sustainability: How useful are current tools of sustainability assessment at the regional scale? Ecol. Econ. 2008, 67, 362–371. [Google Scholar] [CrossRef]
- Wild River, S. Enhancing the sustainability efforts of local governments. Int. J. Innov. Sustain. Dev. 2005, 1, 46–64. [Google Scholar] [CrossRef]
- Tanguay, G.A.; Rajaonson, J.; Lefebvre, J.-F.; Lanoie, P. Measuring the sustainability of cities: An analysis of the use of local indicators. Ecol. Indic. 2010, 10, 407–418. [Google Scholar] [CrossRef]
- Mercer, D.; Jotkowitz, B. Local Agenda 21 and Barriers to Sustainability at the Local Government Level in Victoria, Australia. Aust. Geogr. 2000, 31, 163–181. [Google Scholar] [CrossRef]
- Keen, M.; Mercer, D. Environmental planning at the local level: The example of local conservation strategies in Victoria, Australia. Environmentalist 1993, 13, 83–95. [Google Scholar] [CrossRef]
- Lane, M.B.; McDonald, G. Community based environmental planning: Operational dilemmas, planning principles and possible remedies. J. Environ. Plan. Manag. 2005, 48, 709–731. [Google Scholar] [CrossRef]
- Christoff, P. Degreening government in the garden state: Environment policy under the Kennett government, 1992–1997. In Environ. Plan. Law J.; 1998; 15, pp. 10–32. [Google Scholar]
- Sauvage, J.; Smith, G. Organisational change in Sutherland Shire Council-methods and techniques using sustainability training. In Proceedings of the Effective Sustainability Education-What Works? Why? Where Next? Linking Research and Practice, University of NSW, Sydney, Australia, 18–20 February 2004.
- Morrison, T.H.; McDonald, G.T.; Lane, M.B. Integrating natural resource management for better environmental outcomes. Aust. Geogr. 2004, 35, 243–58. [Google Scholar] [CrossRef]
- Keen, M.; Mahanty, S.; Sauvage, J. Sustainability assessment and local government: Achieving innovation through practitioner networks. Local Environ. 2006, 11, 201–216. [Google Scholar] [CrossRef]
- Keen, M.; Mercer, D.; Woodfull, J. Approaches to environmental management at the Australian local government level: Initiatives and limitations. Environ. Polit. 1994, 3, 43–67. [Google Scholar] [CrossRef]
- Byrne, S.; Wallis, A.M.; Graymore, M.L.M.; O’Toole, K. Regional Sustainability Program. Indicators Guide—Victoria: Background Report; Deakin University: Warrnambool, Australia, 2010. [Google Scholar]
- Ramos, T.B.; Caeiro, S. Meta-performance evaluation of sustainability indicators. Ecol. Indic. 2010, 10, 157–166. [Google Scholar] [CrossRef]
- Wallis, A.; Richards, A.; O’Toole, K.; Mitchell, B. Measuring regional sustainability: Lessons to be learned. Int. J. Environ. Sustain. Dev. 2007, 6, 193–207. [Google Scholar] [CrossRef]
- Wallis, A.M.; Kelly, A.R.; Graymore, M.L.M. Assessing sustainability: A technical fix or a means of social learning? Int. J. Sustain. Dev. World Ecol. 2010, 17, 67–75. [Google Scholar]
- Swinburne University Centre for Regional Development. Cardinia Compass: Indicators of Community Sustainability; Prepared for the Cardinia Shire Council by Centre for Regional Development at Swinburne University: Melbourne, Australia, 2006. [Google Scholar]
- Jacksonville Community Council Inc. Quality of Life in Jacksonville: Indicators for Progress. City of Jacksonville: Jacksonville, FL, USA, 2001. [Google Scholar]
- City of Tucson. The Livable Tucson Vision Program. Available online: http://cms3.tucsonaz.gov/livable (accessed on 27 March 2010).
- Frankston City Council. State of the City Report 2009. Frankston City Council: Frankston, Australia, 2010. [Google Scholar]
- Reed, M.S.; Fraser, E.D.G.; Dougill, A.J. An adaptive learning process for developing and applying sustainability indicators with local communities. Ecol. Econ. 2006, 59, 406–418. [Google Scholar] [CrossRef]
- Bell, S.; Morse, S. Experiences with sustainability indicators and stakeholder participation: A case study relating to a “Blue Plan” project in Malta. Sustain. Dev. 2004, 12, 1–14. [Google Scholar] [CrossRef]
- Byrne, S.; Wallis, A.M.; Graymore, M.L.M.; O’Toole, K. Getting Started: A Guide to Developing Regional Sustainability Indicators in Victoria; Deakin University: Warrnambool, Australia, 2010. [Google Scholar]
- Graymore, M.L.M. Great South. West. Online Community Indicators Report. Available online: http://www.GSWreportcard.org (accessed on 31 January 2013).
- Bennetto, L.; Martin, R.; Nichols, J.; Riddle, L.; Worland, R. The Great South. Coast Regional Strategic Plan; Barwon South West Regional Management Forum and Regional Development Australia: Geelong, Australia, 2010. [Google Scholar]
- Australian Bureau of Statistics. Census of Population and Housing. Available online: http://www.abs.gov.au/census (accessed on 31 January 2013).
- South West Sustainability Partnership. South. West. Sustainability Blueprint; South West Sustainability Partnership: Hamilton, Australia, 2001. [Google Scholar]
- Graymore, M. Regional Sustainability Indicators Framework for South West Victoria: Milestone 3b Report: Agreed Set of Indicators; Horsham Campus Research Precinct, University of Ballarat: Horsham, UK, 2011. [Google Scholar]
- Hardi, P.; Zdan, T. Assessing Sustainable Development: Principles in Practice; International Institute for Sustainable Development: Winnipeg, MB, Canada, 1997. [Google Scholar]
- Graymore, M.L.M. Great South West Community Report Card: Guide to the Community Report Card; Horsham Campus Research Precinct, University of Ballarat: Horsham, UK, 2012. [Google Scholar]
- Graymore, M. Regional Sustainability Indicators Framework for South West Victoria—Milestone 6 Report: Final Project Report; Horsham Campus Research Precinct, University of Ballarat: Horsham, UK, 2013. [Google Scholar]
- University of Swinburne. Evaluation Toolbox. Available online: http://www.evaluationtoolbox.net.au (accessed on 1 October 2012).
- Graymore, M. Regional Sustainability Indicators Framework for South West Victoria—Milestone 3a: Workshop 1—Defining the Framework Outcomes; Horsham Campus Research Precinct, University of Ballarat: Horsham, UK, 2011. [Google Scholar]
- Wackernagel, M.; Yount, J.D. The ecological footprint: An indicator of progress toward regional sustainability. Environ. Monit. Assess. 1998, 51, 511–529. [Google Scholar] [CrossRef]
- Graymore, M.L.M. Great South West Community Report Card: Technical Report; Horsham Campus Research Precinct, University of Ballarat: Horsham, UK, 2012. [Google Scholar]
- Graymore, M.L.M. Great South. West. Community Report Card 2011; Horsham Campus Research Precinct, University of Ballarat: Horsham, UK, 2012. [Google Scholar]
- Wallis, A.M.; Graymore, M.L.M.; Richards, A.J. Significance of environment in the assessment of sustainable development: The case for south west Victoria. Ecol. Econ. 2011, 70, 595–605. [Google Scholar] [CrossRef]
- Coelho, P.; Mascarenhas, A.; Vaz, P.; Beja, I.; Dores, A.; Ramos, T.B. A methodological framework for indicators of sustainable development at the regional scale: The case of a Portuguese region (Algarve). In Proceedings of the 12th Annual International Sustainable Development Research Conference, Hong Kong, China, 6–8 April 2006.
- Dodson, J.; Sipe, N. Shocking the Suburbs: Urban Location,Housing Debt and Oil Vulnerability in the Australian City; Urban Research Program Griffith University: Brisbane, Australia, 2006. [Google Scholar]
- Sietchiping, R. Applying an index of adaptive capacity to climate change in north-western Victoria, Australia. Applied GIS 2007, 3, 16.1–16.28. [Google Scholar] [CrossRef]
- Natural Assets Alliance of the South West Sustainability Partnership. In Towards Environmental Sustainability in the South West: Priorities Direction Statement 2010–2012; South West Sustainability Partnership: Hamilton, ON, Canada, 2010.
© 2014 by the authors; licensee MDPI, Basel, Switzerland. This article is an open access article distributed under the terms and conditions of the Creative Commons Attribution license (http://creativecommons.org/licenses/by/3.0/).
Share and Cite
Graymore, M.L.M. Sustainability Reporting: An Approach to Get the Right Mix of Theory and Practicality for Local Actors. Sustainability 2014, 6, 3145-3170. https://doi.org/10.3390/su6063145
Graymore MLM. Sustainability Reporting: An Approach to Get the Right Mix of Theory and Practicality for Local Actors. Sustainability. 2014; 6(6):3145-3170. https://doi.org/10.3390/su6063145
Chicago/Turabian StyleGraymore, Michelle L. M. 2014. "Sustainability Reporting: An Approach to Get the Right Mix of Theory and Practicality for Local Actors" Sustainability 6, no. 6: 3145-3170. https://doi.org/10.3390/su6063145