Article

Densification without Growth Management? Evidence from Local Land Development and Housing Trends in Charlotte, North Carolina, USA

Department of Geography and Earth Sciences, University of North Carolina at Charlotte, Charlotte, NC 28223, USA
*
Author to whom correspondence should be addressed.
Sustainability 2014, 6(6), 3975-3990; https://doi.org/10.3390/su6063975
Submission received: 14 April 2014 / Revised: 5 June 2014 / Accepted: 17 June 2014 / Published: 20 June 2014
(This article belongs to the Special Issue Density and Sustainability)

Abstract

:
In urban America, land development and residential real estate have passed through a number of different phases during the post-WWII era. In contemporary discourse on urban sustainability, attention is often expressed in terms of intensity of land development, lot sizes, and square-footage of housing units. In this paper, we reconstruct the land development trajectory of a rapidly growing southern city in the United States and assess whether this trajectory has experienced any reversal in the face of socio-economic transformations that have occurred over the past decade or so. Starting with current land and real estate property records, we reconstitute the urban map of Charlotte using World War II as a starting point. Results highlight a decline in the average single family lot size over the past decade, while the average home size has consistently grown, suggesting that the city of Charlotte and its county have witnessed a densification trend along a path towards greater land development. This analysis both helps situate Charlotte with respect to other U.S. urban regions, and provides support for potential land-use policies, especially densification, when a balance between urban development, environment preservation, energy savings, and the achievement of quality of life for current and future generations are concerned.

Graphical Abstract

1. Introduction

Charlotte, North Carolina is a mid-size American city that has been epitomized in the literature as an archetype for low-density, rapidly suburbanizing growth patterns [1]. As one of the newer Sunbelt cities, devoid of rigorous growth management strategies or natural barriers to halt the spatial expansion of development, it is perhaps unsurprising that Charlotte’s development patterns are often linked with those of other geographically similar metropolitan areas such as Atlanta or Orlando. However, Charlotte offers several distinctions from these other cities. Perhaps most notably is that its population growth has seen an increase over the past decade, outpacing cities whose populations soared prior to the close of the previous century, including Atlanta, Phoenix, and Orlando. According to recent population estimates by the US Census Bureau [2], the Charlotte Metropolitan Statistical Area (MSA) was the 4th fastest growing MSA in the country from 2000–2010. The city’s population increased by 31 percent during that time, slightly up from its growth of 29.8 percent in the previous decade. This latest growth has occurred amidst national demographic shifts and changes in consumer housing preferences that have lead Nelson [3] to proclaim it as being “a new era of urbanity in the United States”. Thus, Charlotte is perhaps an ideal city for investigating longitudinal development trends to determine if a shift in its development trajectory has occurred toward densification, smart growth development, and urban infill, despite an absence of sustainable growth management policies on behalf of the local government.
The purpose of this paper is to address this research question utilizing a disaggregated, longitudinal dataset of land development and housing. The analysis relies on fine-grained, parcel-level data on land use over several decades, as well as public records of the type and size of new constructions over the same period. Longitudinal trends are analyzed within the context of the extant literature on urbanization, suburbanization, and urban planning. If the evidence points toward a shift in the trends, the spatial location of changes will also be investigated to determine where these changes have occurred throughout Mecklenburg County, which encompasses the City of Charlotte per se. The remaining structure of the paper is as follows: In Section 2, literature on urban dynamics is briefly reviewed with an emphasis on the drivers of sprawl and recent trends in urban development and suburbanization. The geographic context of the city of Charlotte is introduced in Section 3 followed by an overview of the data and methods in Section 4. Results are presented in Section 5, followed by the Discussion and Conclusions in Section 6.

2. Urban Dynamics

2.1. Suburbanization and “Sprawl”

It is well documented that development patterns of urban areas throughout the United States since World War II have featured an outward spatial expansion of single-family residential housing and low density development. Throughout much of the country, urban population gradients have declined at a faster rate than population growth [4]. Urban spatial expansion is largely fueled by population influxes in conjunction with rising household incomes which serve to drive up demand for larger living spaces [5]. Given that land prices decline outside urban city centers, residents wishing to maximize their housing consumption do so by choosing the outermost extents of urban areas, thus compensating commuting costs with housing and lot size consumption. This tradeoff forms the crux of traditional urban economic residential choice models [6]. Proponents of “sprawl” or suburbanization emphasize this consumer preference for low-density residential development, arguing that the resulting landscapes are a reflection of free market choices of Americans [7]. Others assert that the urban housing market is far from a freely operating system as zoning regulations and transportation and parking requirements all limit the availability of alternate, higher-density and mixed-use developments in certain markets [8]. Levine and Frank [8] further contend, based on a survey of Atlanta residents, that there is an unmet demand for smarter-growth developments, hypothesizing that if land-use regulations that encumber such developments were lifted, consumers would respond favorably.
Although the term “urban sprawl” is multifaceted and elusive to define, low-density development is often seen as a defining trait [9,10]; Lopez and Hynes [11] suggest it is the most important dimension of sprawl. Large residential housing units on large lots are associated with increased automobile dependency, forest and farmland development, and infrastructure costs, while sprawl, more generally, is argued to be the source of a host of environmental problems [12]. Given these concerns, a number of municipalities and states have enacted growth management policies such as zoning regulations, density bonuses or incentives, transit corridors, or growth boundaries to slow the spatial spread of growth and promote compact, contiguous development. The empirical evidence on the effectiveness of such policies has produced mixed results. For example, Jun [13] evaluates the development patterns within and around Portland, Oregon, home of one of the oldest, and perhaps most acclaimed growth management policies, and finds no statistical support that the boundary is effective in halting growth; rather it has been credited with diverting growth to surrounding areas. On the other hand, Song and Knapp [9] examine residential development trends of neighborhoods in Portland in an effort to catalogue sprawl characteristics over time (street connectivity, density, land-use mix, accessibility). The authors uncover a persistent increase in median housing square footage over time, from 1940 to 2000, while the median single-family lot size has followed a consistent trend of decline, thus providing evidence of single family residential densification. The descriptive nature of the study prohibits any causal attribution of this densification trend to the growth management policies in Portland and the authors acknowledge that they may also be a result of market forces.
In a subsequent study, Wilson and Song [14] compare development patterns between Portland’s Multnomah County and Charlotte’s Mecklenburg County between 2000 and 2003, given the similar population size and demographic composition of the two locales. The authors conclude that Charlotte’s development patterns depict a typical sprawling, suburban landscape with a declining urban core, whereas Portland exemplifies a trend toward compact development. The authors further link Charlotte’s development trends with its lack of growth regulations, drawing parallels between its trajectory and that of Atlanta. Unfortunately, the 2000–2003 snapshot in time misses many critical developments in Charlotte’s development track, including downtown revitalization efforts that have since then produced a rather drastic transformation of the city center, continued population growth putting pressure on the planning and development communities to produce new urbanization templates, and a host of New Urbanism neighborhood and housing developments across the metropolitan region.
More recently, Wilson and Song [1] utilized development patterns in Charlotte’s county, Mecklenburg, to suggest that residential subdivision construction is a contagious process; that the development of a previously undeveloped parcel induces further development within the local vicinity. While motivated by a desire to understand the process of urban sprawl (as defined by low density development), their study fails to account for the type of development that occurs within these parcels, measuring parcel subdivision as a discrete event—divided or not—further portraying an image of homogenous, low-density, subdivisions without empirical validation.

2.2. The Emergence of New Trends?

Given that population growth, rising incomes, and consumer preferences for low-density residential development, and highway expansion are largely attributed with shaping post-war suburban landscapes in the United States [4,5,7], it is conceivable that shifts in any or all of these factors could lead to a reversal of development trends even without the influence of stringent growth management policies. A number of indicators suggest that such changes are underway, including demographic shifts to the nation’s population composition and a perceptible shift in consumer preference toward smart growth, walkable, and mixed-use developments. Nelson [3] has argued that together these changes will spur a new era of urbanism throughout the United States, featuring mixed land uses, higher residential and non-residential densities, and a resurgence in urban infill and redevelopment. In particular, the share of population over the age of 65 will grow by 12–19 percent in the coming years with the aging of the baby boomer generation. This population cohort will have different housing needs than households raising families. Furthermore, the number of single-person households will outnumber households with children by the year 2030 for the first time in the country’s history. Just as the large number of households raising families helped shape the American suburban landscape, these demographic changes are projected to impact housing and urban planning demand in the future.
In addition to demographic changes, recent evidence has suggested that a change in consumer housing preferences is underway across the nation. According to the National Association of Realtors’ consumer community preference survey [15], while single-family housing is still the undeniable preferred choice of abode for Americans, walkable communities and short commute times complete the list of desirable neighborhood traits. The survey reports that nearly half of the public would prefer to live in an urban environment, or in a suburban environment that features a blend of housing, shops, restaurants, and businesses, while only 12 percent of respondents listed a suburban neighborhood with houses alone as a top choice. Given the choice between a long commute (20 minutes or longer) and a smaller house and lot, nearly 60 percent of the public surveyed stated a preference for a shorter commute. This large percentage alone may help a natural densification or infill in low-density urban areas to satisfy an increasing desire to reduce commutes. These national survey responses agree with the findings of Levine and Frank [8], and question the durability of Muth’s [6] assumption that American consumers will select the longer commute.
Several studies have found supporting empirical evidence of a modification in urban development patterns toward densification and urban infill. In an analysis of 257 U.S. metropolitan areas in 1990 and 2010, Sarzynski et al. [16] observed a general trend toward both residential and employment densification during the decade, but an increase in other sprawl-like characteristics. Thomas [17] tracked Census Bureau residential building permit data for the 50 largest metro areas from 1990–2008, recording an increase in central city’s share of permits in all cities throughout the country, particularly following the recent Great Recession. These results signify a reversal in trends from 1990–1995, although the study reports that a large majority of housing construction still takes place in suburban locations. Acknowledging that the Census data provides limited geographic detail, the author calls for additional studies employing parcel-level analyses to investigate patterns within particular regions.
In one such study, Atkinson-Palombo [18] examined residential construction along the urban fringe of the Phoenix metropolitan area between 2000 and 2005, uncovering a densification in construction as compared to housing built between 1990 and 2005. The results suggested the emergence of “new suburbanism” type developments replete with multiple-family housing and amenity-rich condominiums along the suburban frontier. Wheeler [4] looked at the evolution of built landscapes across six metropolitan regions between 1980 and 2005, generally documenting the consistent spread of low-density, sprawl-type development, with one notable aberration in the results. Las Vegas, the most rapidly growing city in the country in the previous two decades, was the one city amongst those examined (Albuquerque, Atlanta, Boston, Minneapolis, and Portland) to experience an increase in density, or the number of people per developed square mile during the time frame. Recently, Kopits et al. [19] analyzed development trends of exurban counties in the Baltimore and Washington, D.C. region and similarly noted a decline in lot sizes and a trend towards higher density in outlying areas since the 1980s. Their analysis suggests that lot sizes are not determined by zoning rules, but by other factors, including household preferences. Results of a longitudinal hedonic model reveals a consumer preference for higher acreage, but the value placed on this additional acreage has been decreasing over time. Consumers also showed some indication of a willingness to exchange lot sizes for house sizes; this, of course, is a tradeoff that would result in an increase in densification.
The present study will contribute to this empirical literature by providing a parcel-based local analysis of urban and housing development in a rapidly growing southern city.

3. Study Area: Charlotte in Context

The city of Charlotte is located within Mecklenburg County, North Carolina. It is the largest city in the state and has undergone rapid population and housing growth in recent years, particularly over the course of the previous decade. Between 2000 and 2010, Mecklenburg County saw a 35.8 percent increase in population from 695,454 residents to 919,628. Compared to the United States as a whole, its demographic profile is younger—according to the 2010 US Census, only 8.8 percent of the county’s population was over the age of 65 whereas 13.3 percent of the nation’s population fell within this cohort. Mecklenburg county also has a larger share of individuals between the ages of 25 and 34 (16.8% vs. 13.3% for the United States), a smaller average household size (2.49 vs. 2.58), and a larger percentage of individuals residing alone (29.2% vs. 26.7%). In 2010, the Charlotte MSA had the third highest percentage of 35–44 year olds in the nation [20].
In terms of urban development, the Charlotte metropolitan area can be characterized by two dichotomous trends: new outward suburbanization and central city revitalization [21]. Gentrification of older central city neighborhoods has been a deliberate effort aided by large financial corporations hoping to create an amenity-rich central city capable of attracting professional workers from around the globe to supply labor [22]. Thus, high-end condominium construction has helped shape the downtown skyline over the past 10 years, while older neighborhoods surrounding the immediate urban center have similarly witnessed an improvement across a number of quality of life indicators during the previous decade, particularly a rise in relative economic status as compared to the rest of the city, and a decline in crime [23]. In 2007, the city opened its first light rail line which subsequently spurred a host of higher-density transit-oriented development projects [21,24]. However, as Walters [21] points out, this $400 million dollar investment can be juxtaposed with the simultaneous construction of a 67-mile outer belt freeway which has served to open up large amounts of land for suburban development. These dueling dynamics set the backdrop for our longitudinal analysis of land development trends.

4. Data and Methodology

Development trends are traced through the use of GIS property records in 2008 from the Geospatial Information Services Department of Mecklenburg County. The database contains information related to real estate tax records including parcel, land, building, legal description, ownership, sales information and so on. The key attributes of buildings used in this analysis include building type (such as single family residential, multi-family residential, condominium, townhouse, commercial, office, industrial, warehouse, utility, civic, government, etc.), built year, housing units (only for residential use), and building square footage. For the land development level analysis, we derive the land-use information of parcels from building type data—for instance mixed-use land use is created if a parcel accommodates buildings of different functions (residential and retail, residential and office, etc.). Land acreage information is calculated within GIS. We exclude records with unreliable information or extreme values from the analyses.
The methodology is rather straightforward. Parcel and building data are parsed out by year of the current construction; then the selected attributes of the parcel and building files are processed using frequency and summary statistics tools in the ArcGIS software application for GIS analysis. The aggregated, longitudinal data are subsequently imported into Microsoft Excel and post-processed to generate trend lines. ArcGIS serves to aggregate parcel and building information up to census tract areal units for mapping according to the age of development.

5. Results

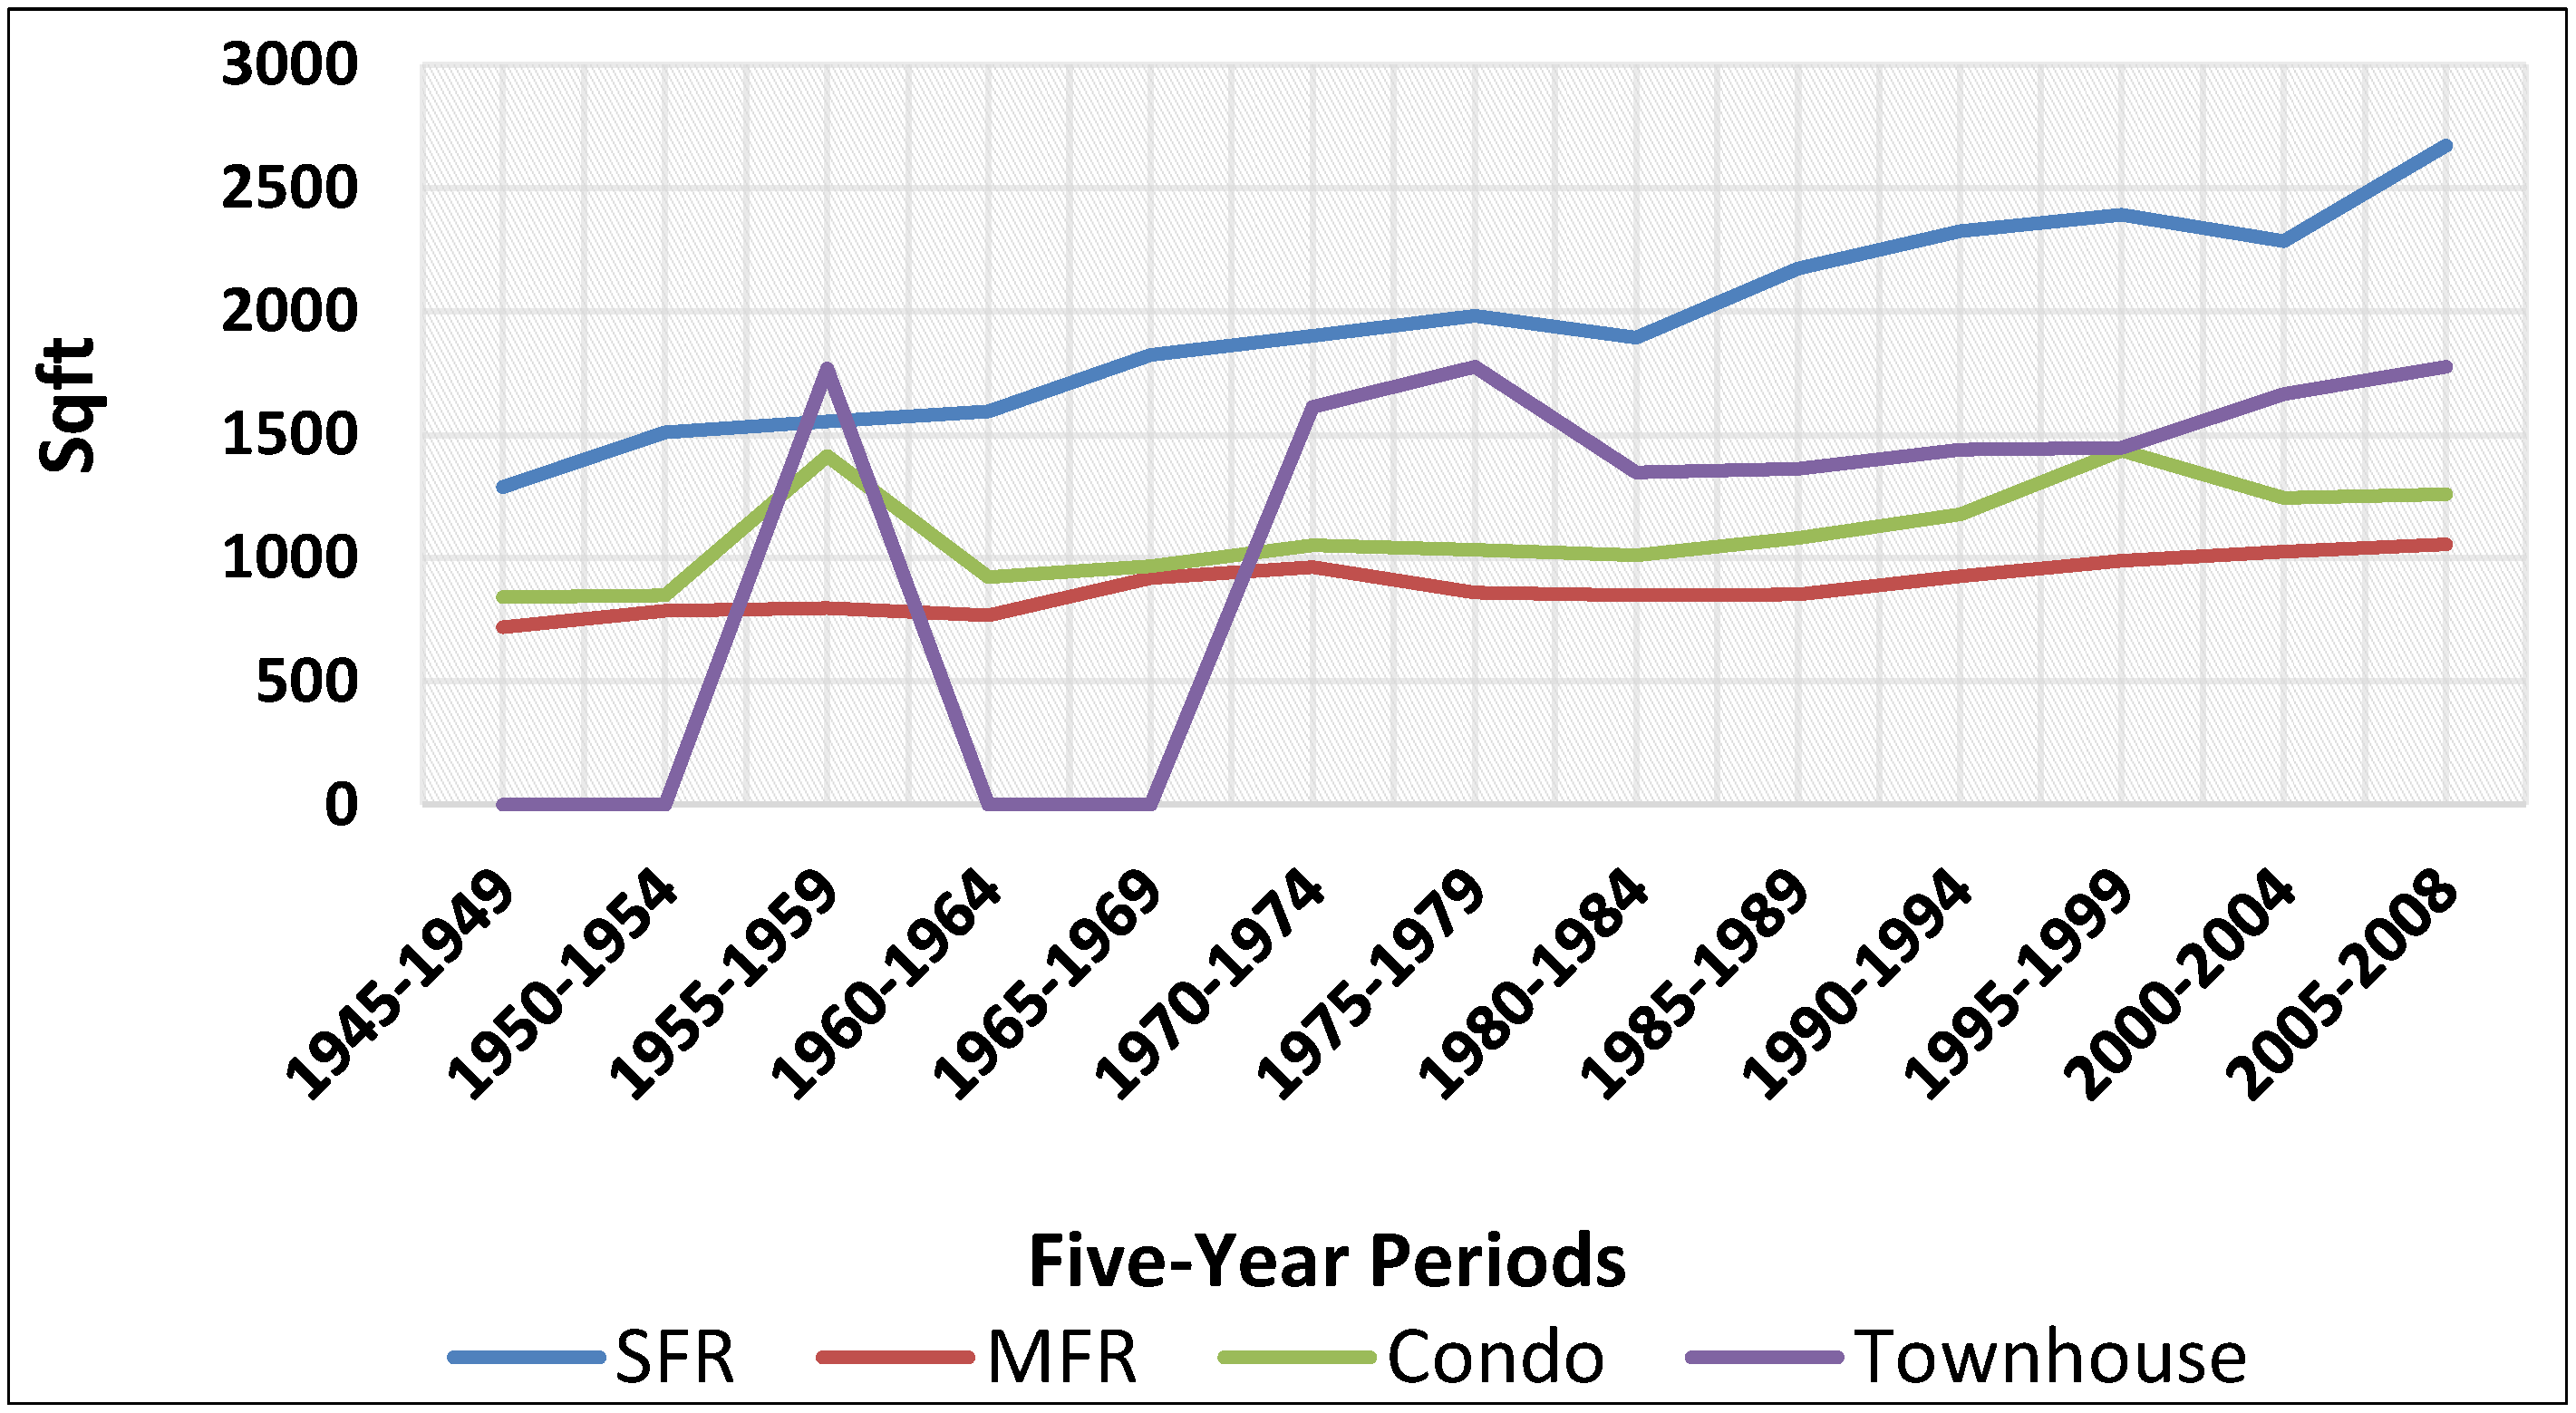
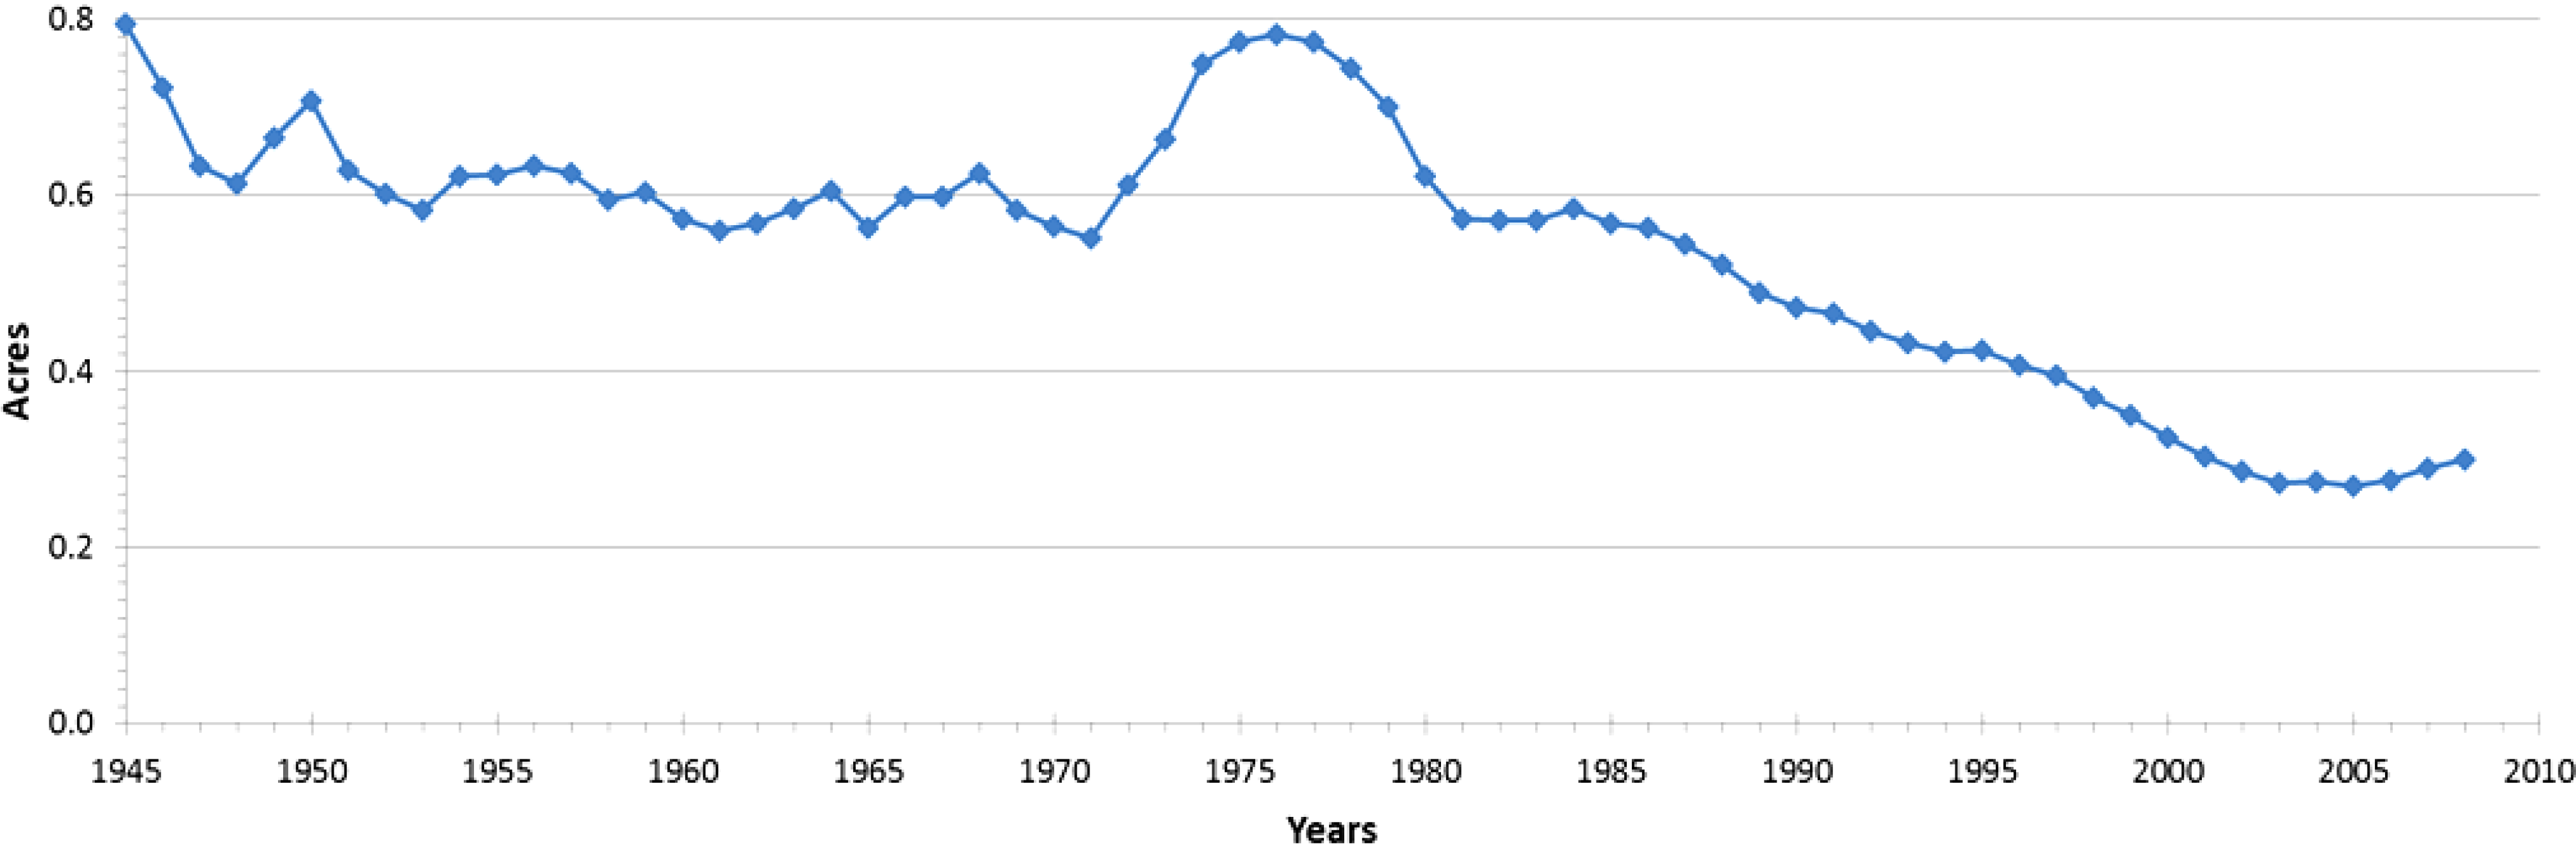
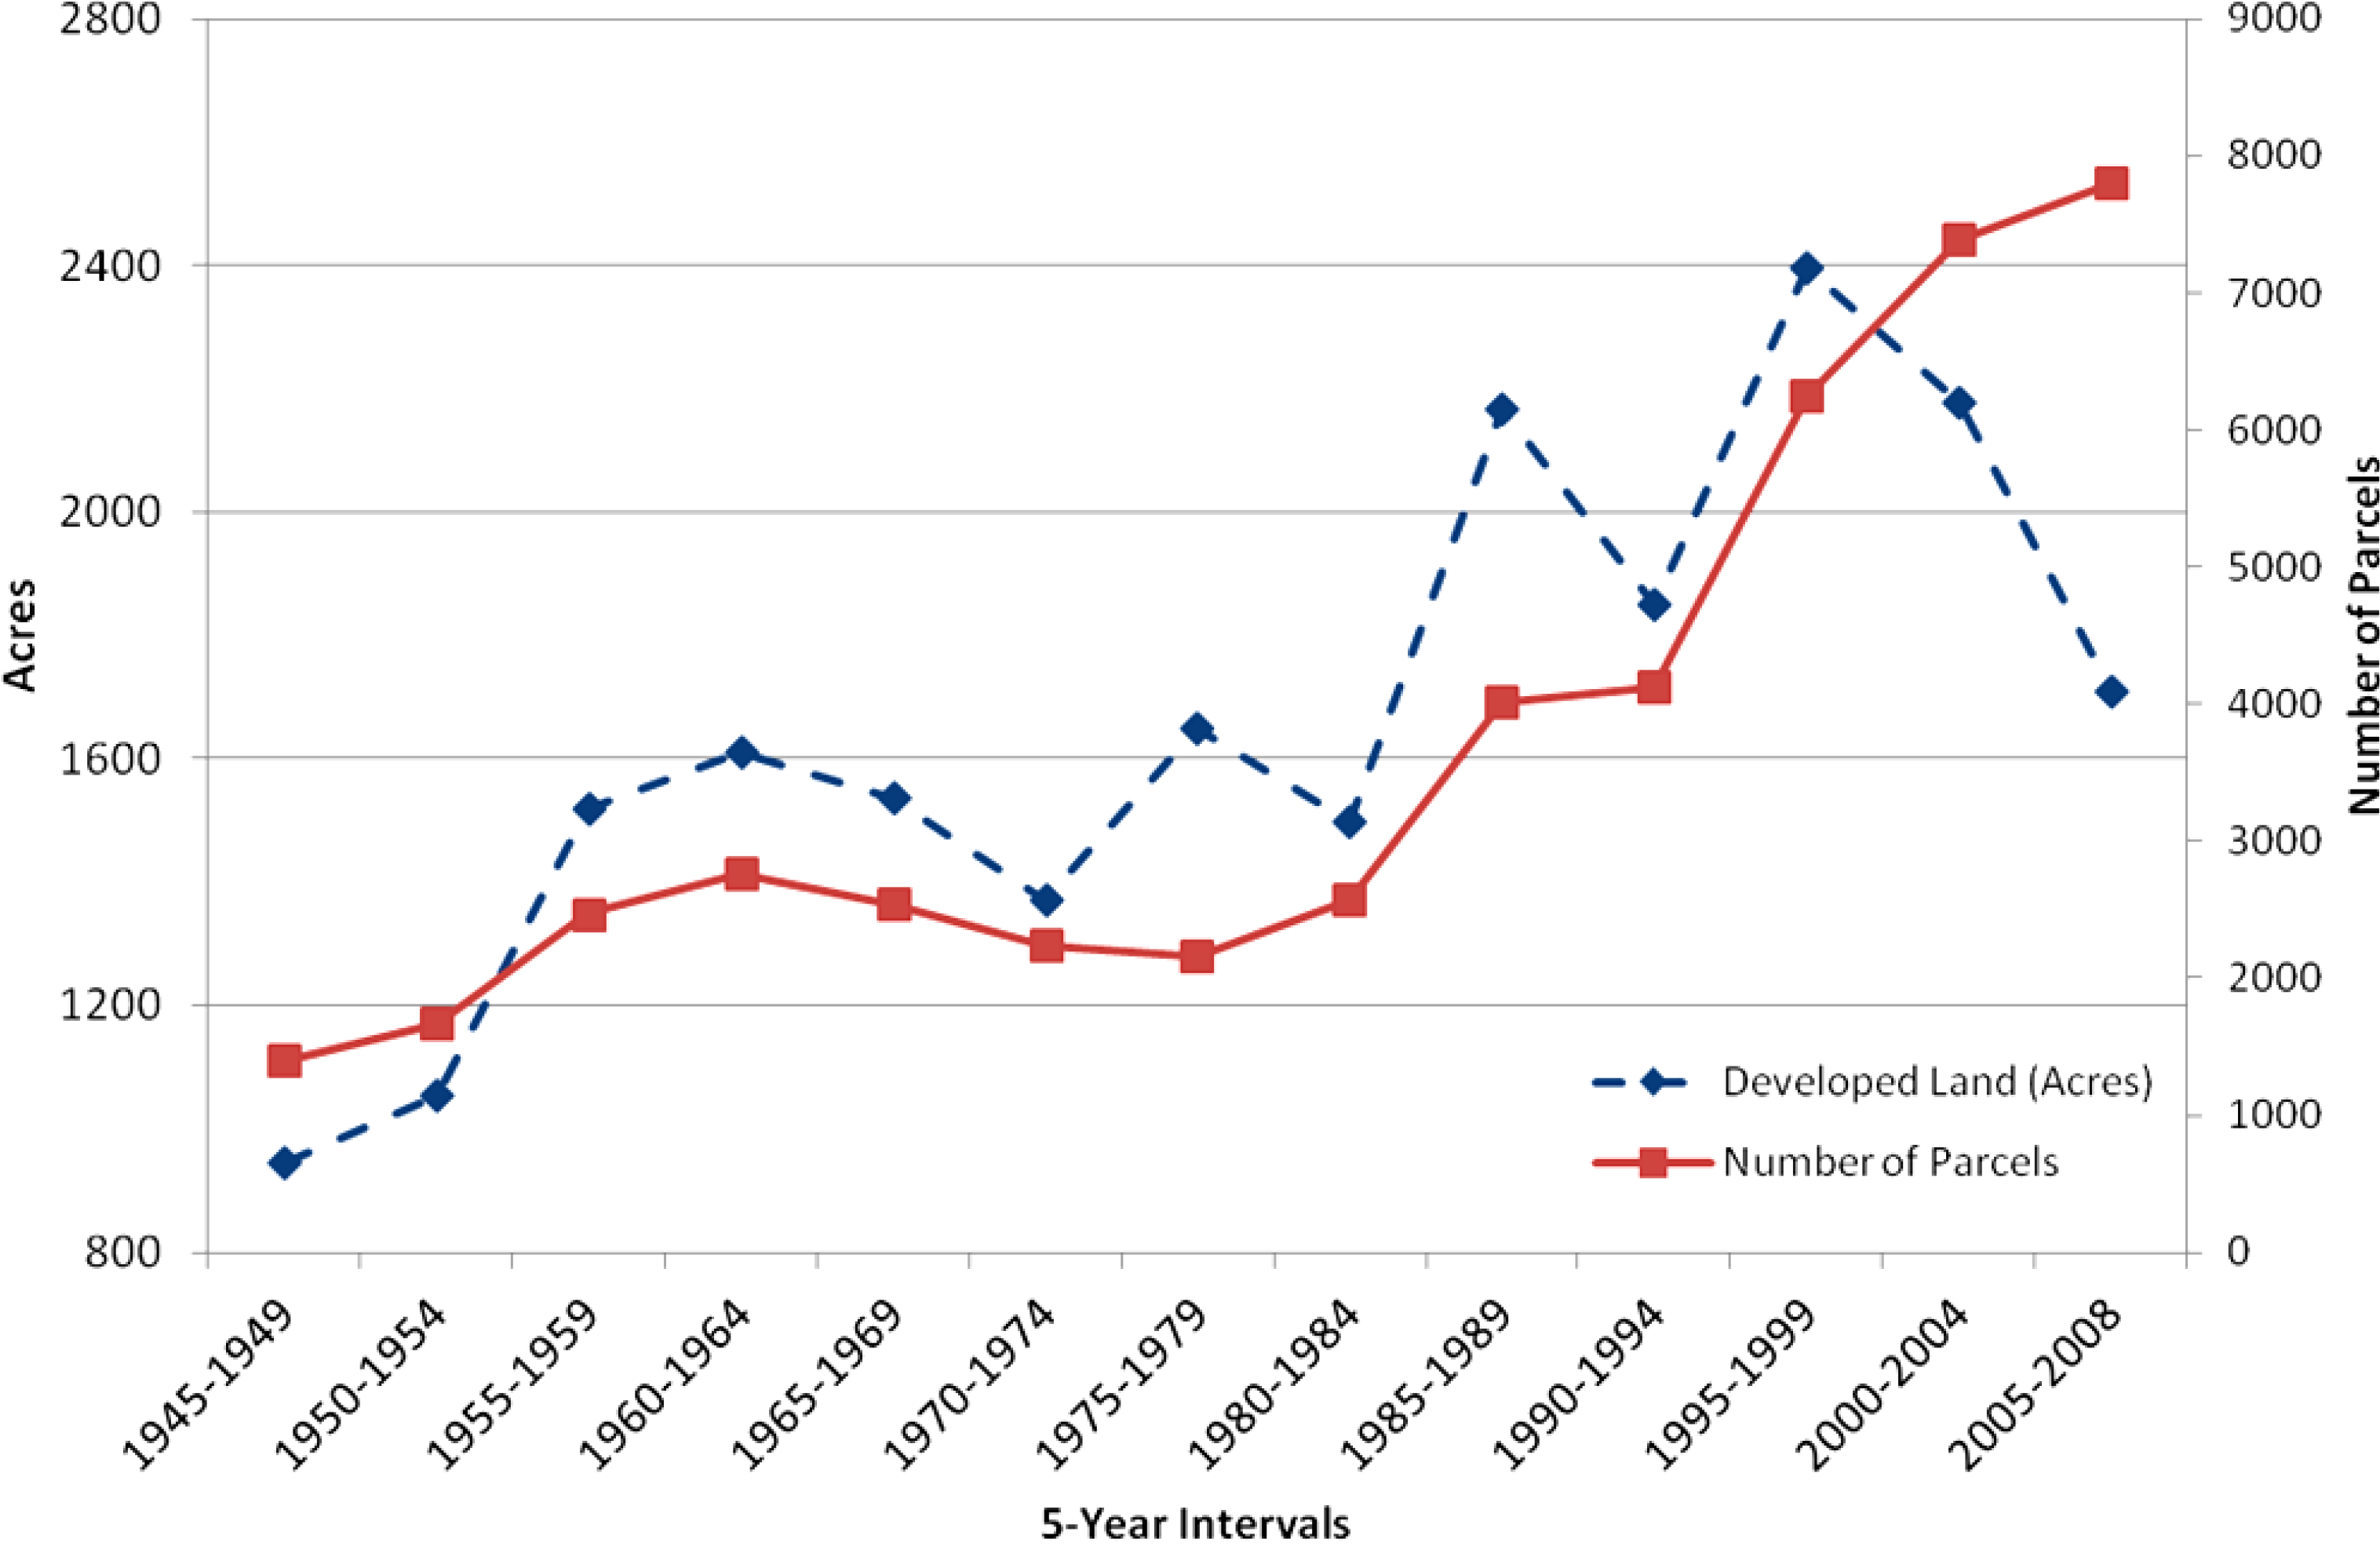
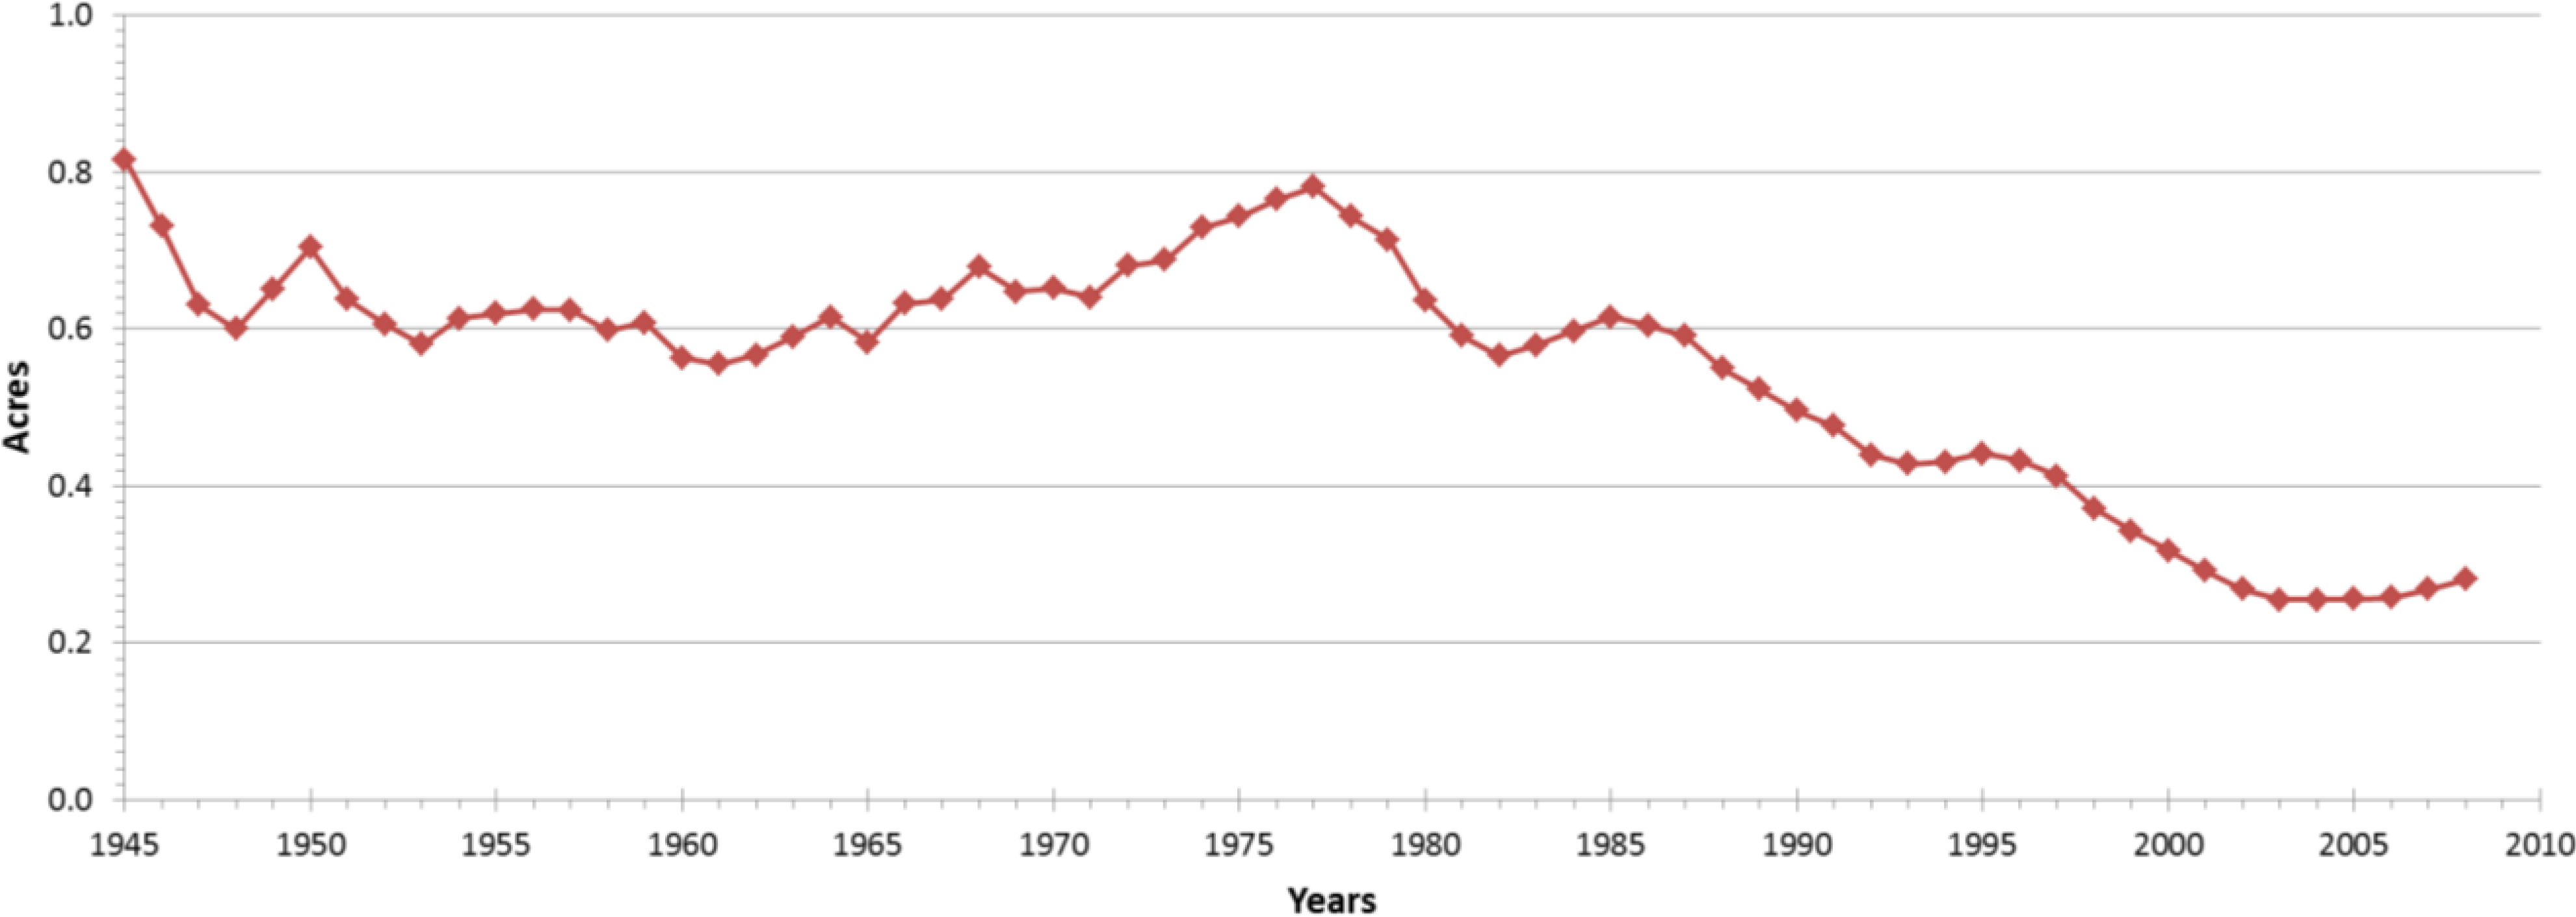
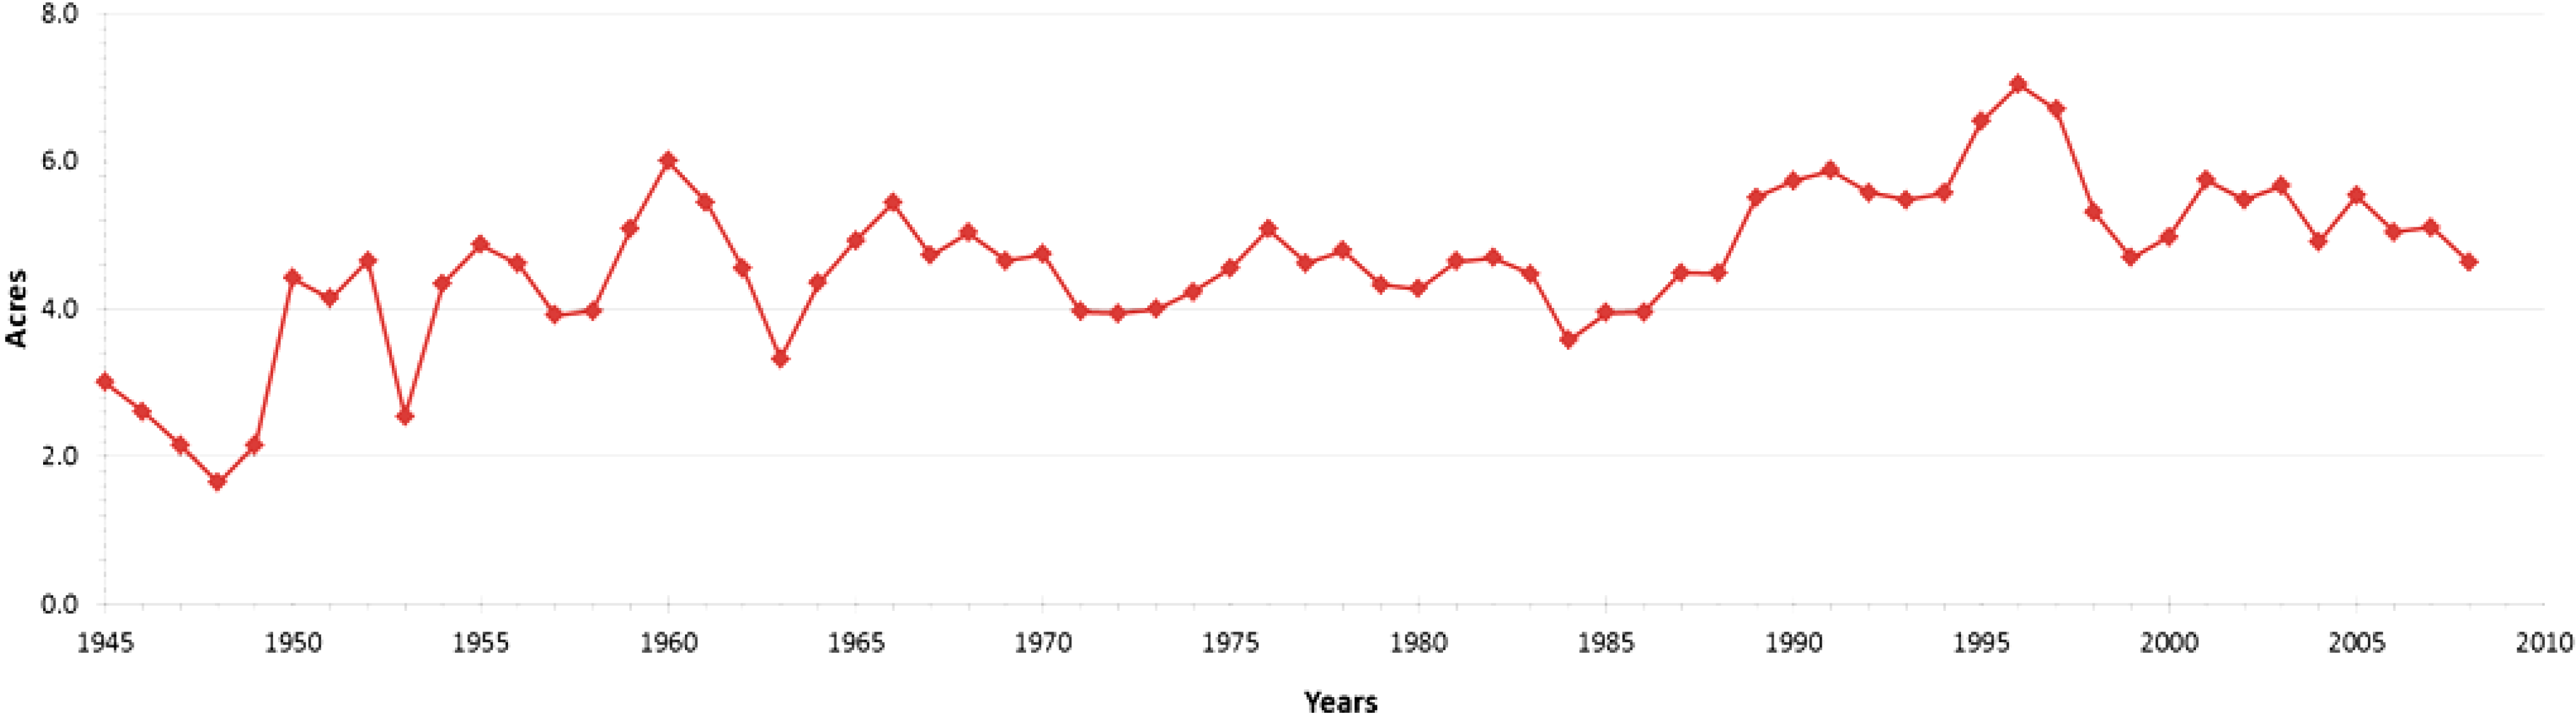
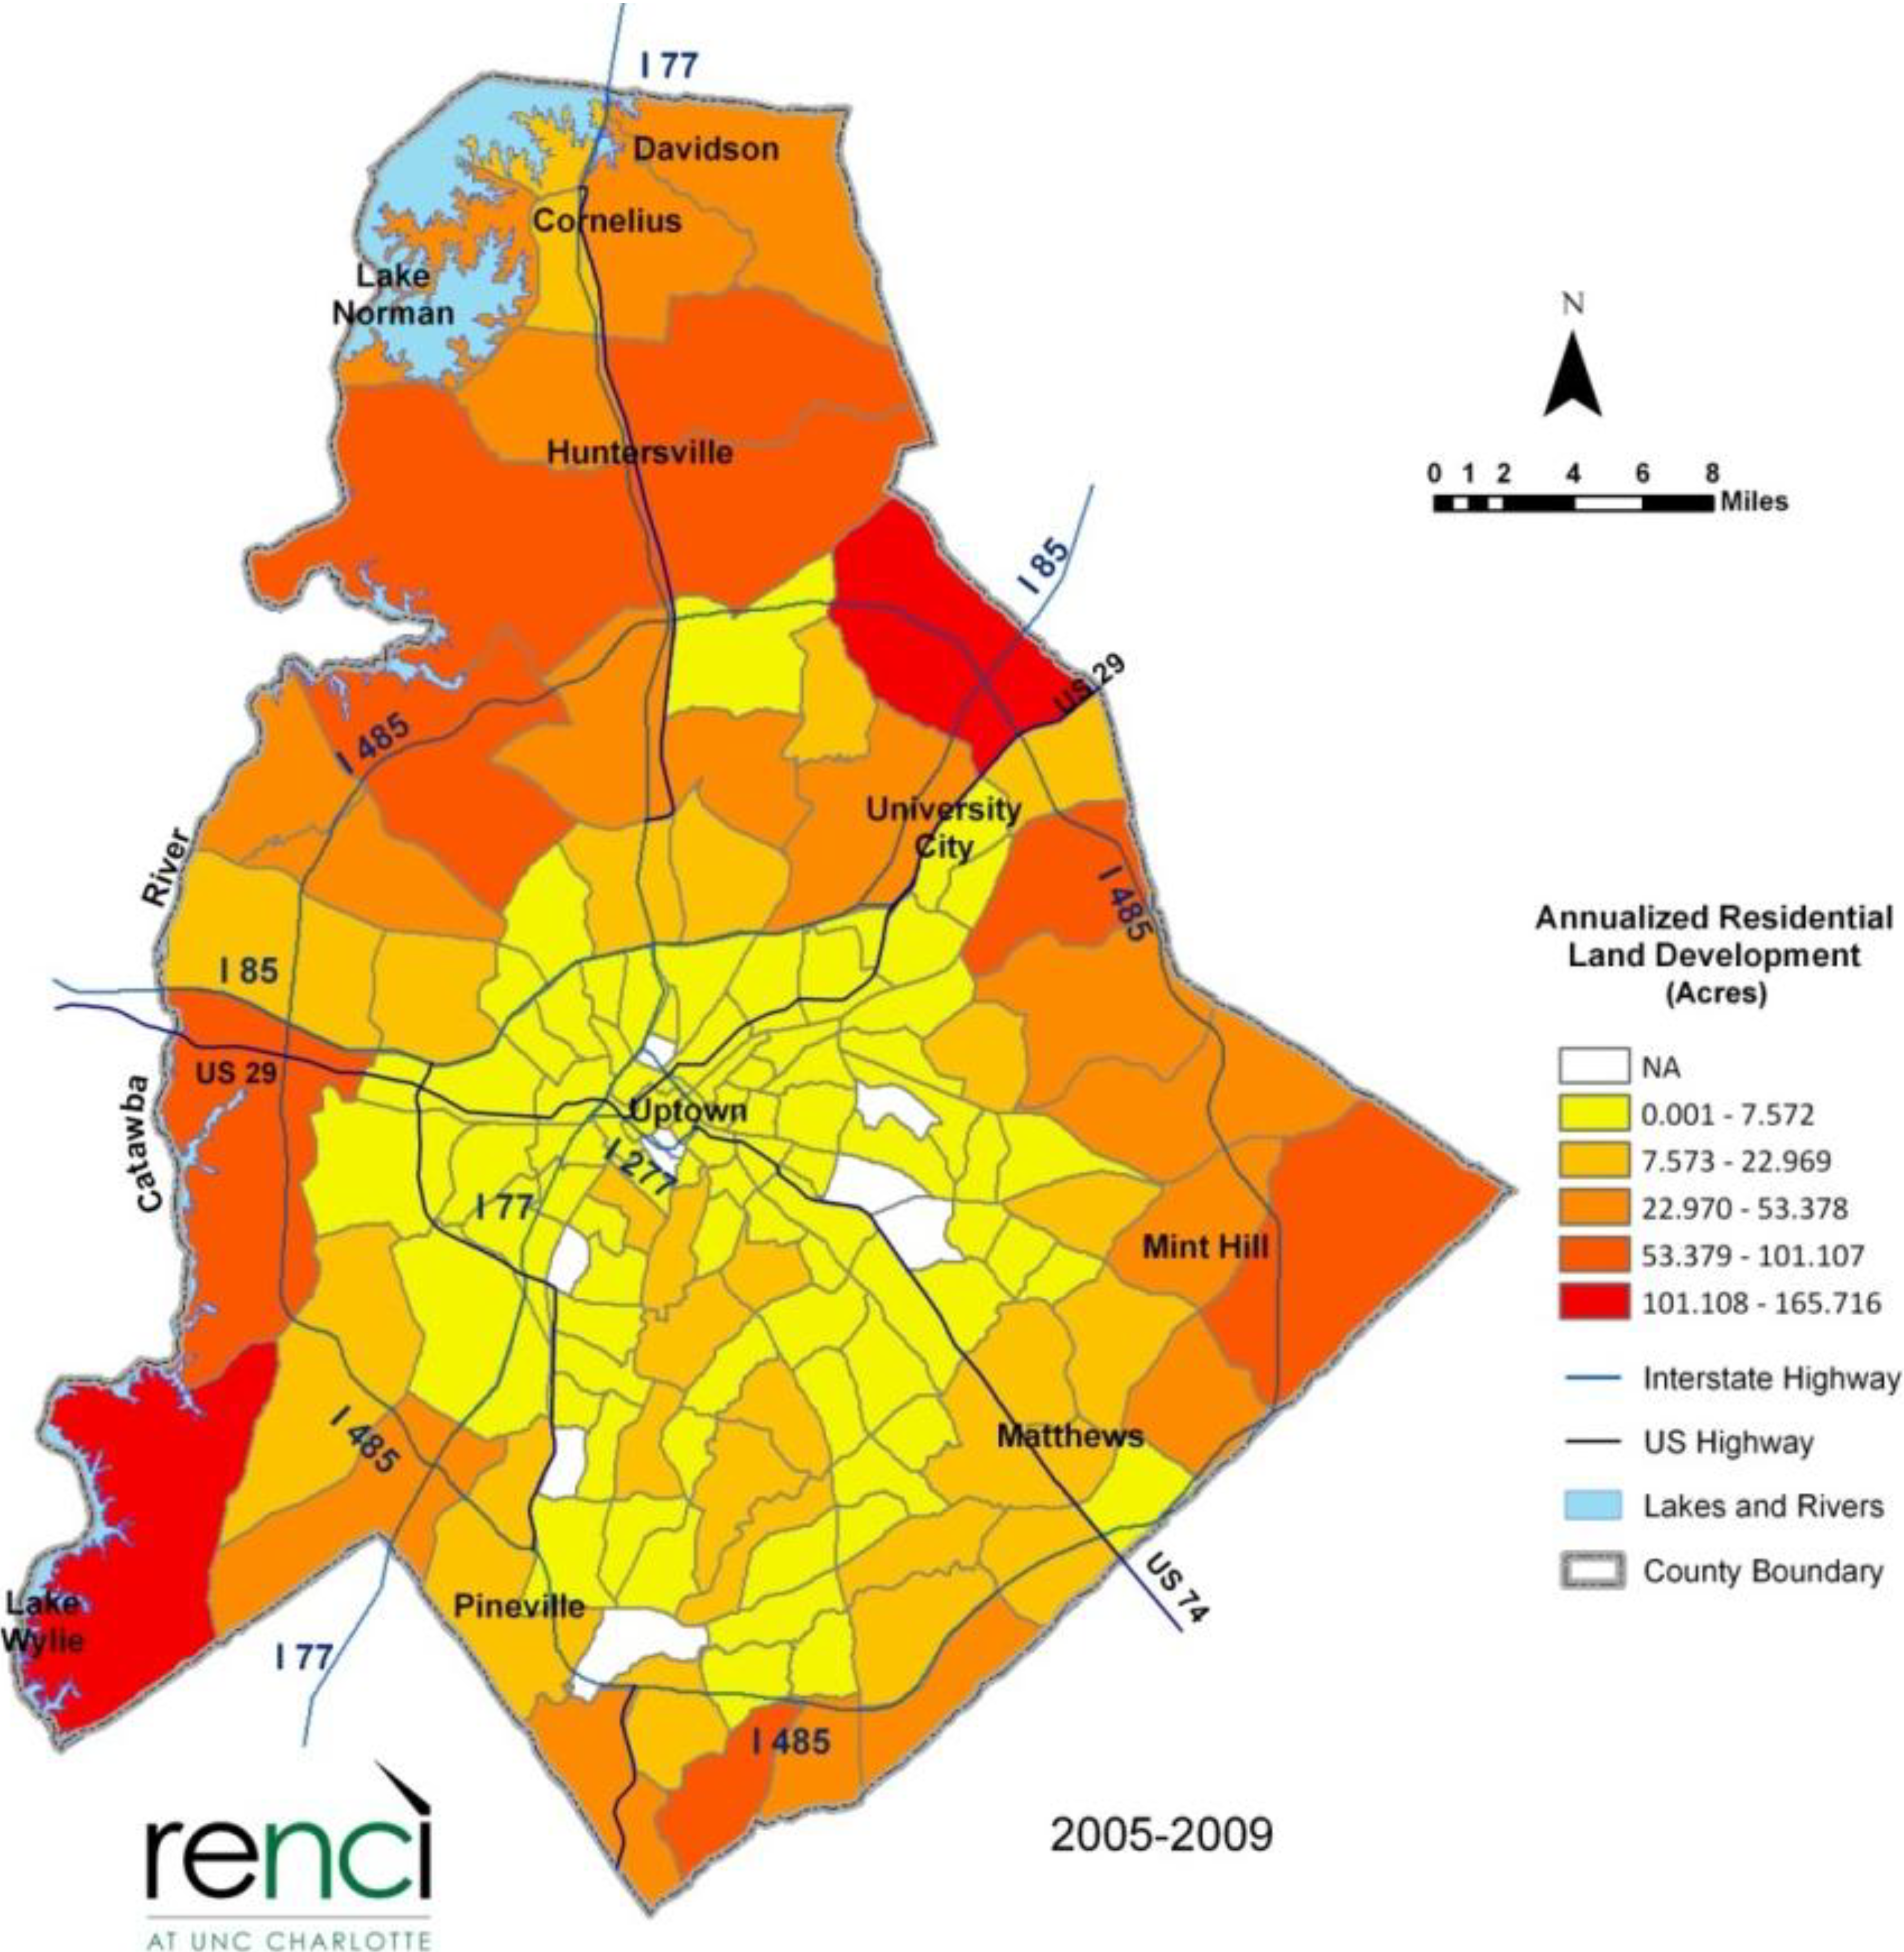
5.1. Land Development Trends

Trends in average housing sizes are shown for single-family (SFR), multi-family (MFR), condominium, and townhouse housing types in Figure 1.
The graph indicates that the average size of a single-family housing unit rose from an average of 1324 square feet between 1945 and 1949 to an average of 2549 square feet between 2005 and 2008; this corresponds to a 92.5% rise in average single-family homes in six decades. Notably, this final time period marks a steep increase in dwelling size from the previous period (2000–2004) which had an average size of 2179 square feet. Townhomes (owner-occupied rowhouses) in the county were a rare phenomenon until the 1970s, and their size has similarly risen, particularly over the course of the past 15 years. Multi-family residential units, where separate housing units are contained within a larger structure (such as a duplex, triplex, or apartment complex) and condominium units, also multi-unit structures but individually owned, have grown in size at a more subdued pace. Multi-family residences rose from 718 to 1056 square feet (47% increase) and condominiums rose from 840 to 1256 square feet (50% increase over the study period).
Figure 1. Average housing unit size in 1945–2008: Single-family units (SFR), multi-family units (MFR), townhouses, and condominiums.
Sustainability 06 03975 g001
While dwelling sizes have steadily risen, Figure 2 illustrates a steady decline in single-family residential lot sizes in the county since the mid-1980s.
Figure 2. Single-family residential lot size, 1945–2008.
Sustainability 06 03975 g002
The figure depicts a three-year moving average of parcel lot sizes and reveals that lots reached their peak during the mid-1970s, fell sharply for the next 5 years, and then followed a steady decline until 2005 when a slight increase is displayed. Thus, the combination of rising home sizes shown in Figure 1 coupled with declining lot sizes, as indicated in Figure 2, provide collective evidence of a trend toward higher intensity of land development, or the densification of single-family residential units in Mecklenburg County. These trends are similar to those uncovered by Song and Knaap [9] for the city of Portland who also identified a simultaneous rise in house size and decline in lots since the 1940s.
As further evidence of this increase in densification, Figure 3 displays two trends: the total amount of newly developed residential land annually (in terms of acreage, or the size of the parcels), and the total number of parcels developed each year.
Figure 3. Total amount of annual residential land developed and total number of yearly parcels developed, 1945–2008.
Sustainability 06 03975 g003
The solid line, portraying the total number of parcels developed shows a near constant increase in annually developed parcels, with a sharp rise in absolute values beginning in 1990. The dashed blue line on the other hand, indicates the annual number of acres developed for residential purposes and shows a steep decline in values from its peak between 1995 and 1999. Looking beyond single family residential housing, Figure 4 shows the total acreage of developed parcels divided by the number of total residential units including single and multi-family housing, condominiums, townhouses, and units in mixed-use developments. This figure presents a more complete picture of residential land development patterns as the proportion of non-single-family residential housing has increased throughout the county.
Figure 4. Total area of developed parcels (all types of development)/number of residential units (all types—SFR, MFR, condos, townhouses, and units in mixed-use developments), 1945–2008.
Sustainability 06 03975 g004
Residential land development therefore clearly illustrates a shift in its development trend; while the number of parcels developed has steadily risen over the past 20 years, the intensity of this development has increased, particularly over the last decade. This consideration was overlooked by the work of Wilson and Song [1] who report on the spatial spread of parcel subdivision in Mecklenburg County, but do not investigate how parcels were subdivided.
In addition to residential land-use trends, we also examine at the development intensity of non-residential parcels including office space, commercial, industrial, mixed-use, and government uses. Figure 5 depicts the overall development trends for these parcels, showing the 3-year moving average of the number of developed acres divided by the number of parcels. The graph shows a slow increase in the number of acres per parcel, peaking in the mid-1990s, followed by an increase in intensity (or decline in land area consumption) in the latter years of the study.
Figure 5. Non-residential land-use development intensity (total number of acres/number of developed parcels), 1945–2008.
Sustainability 06 03975 g005

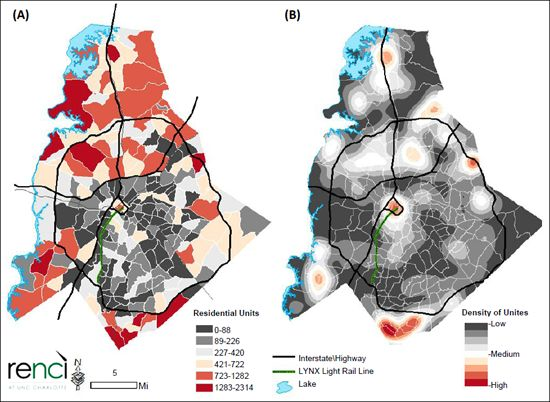
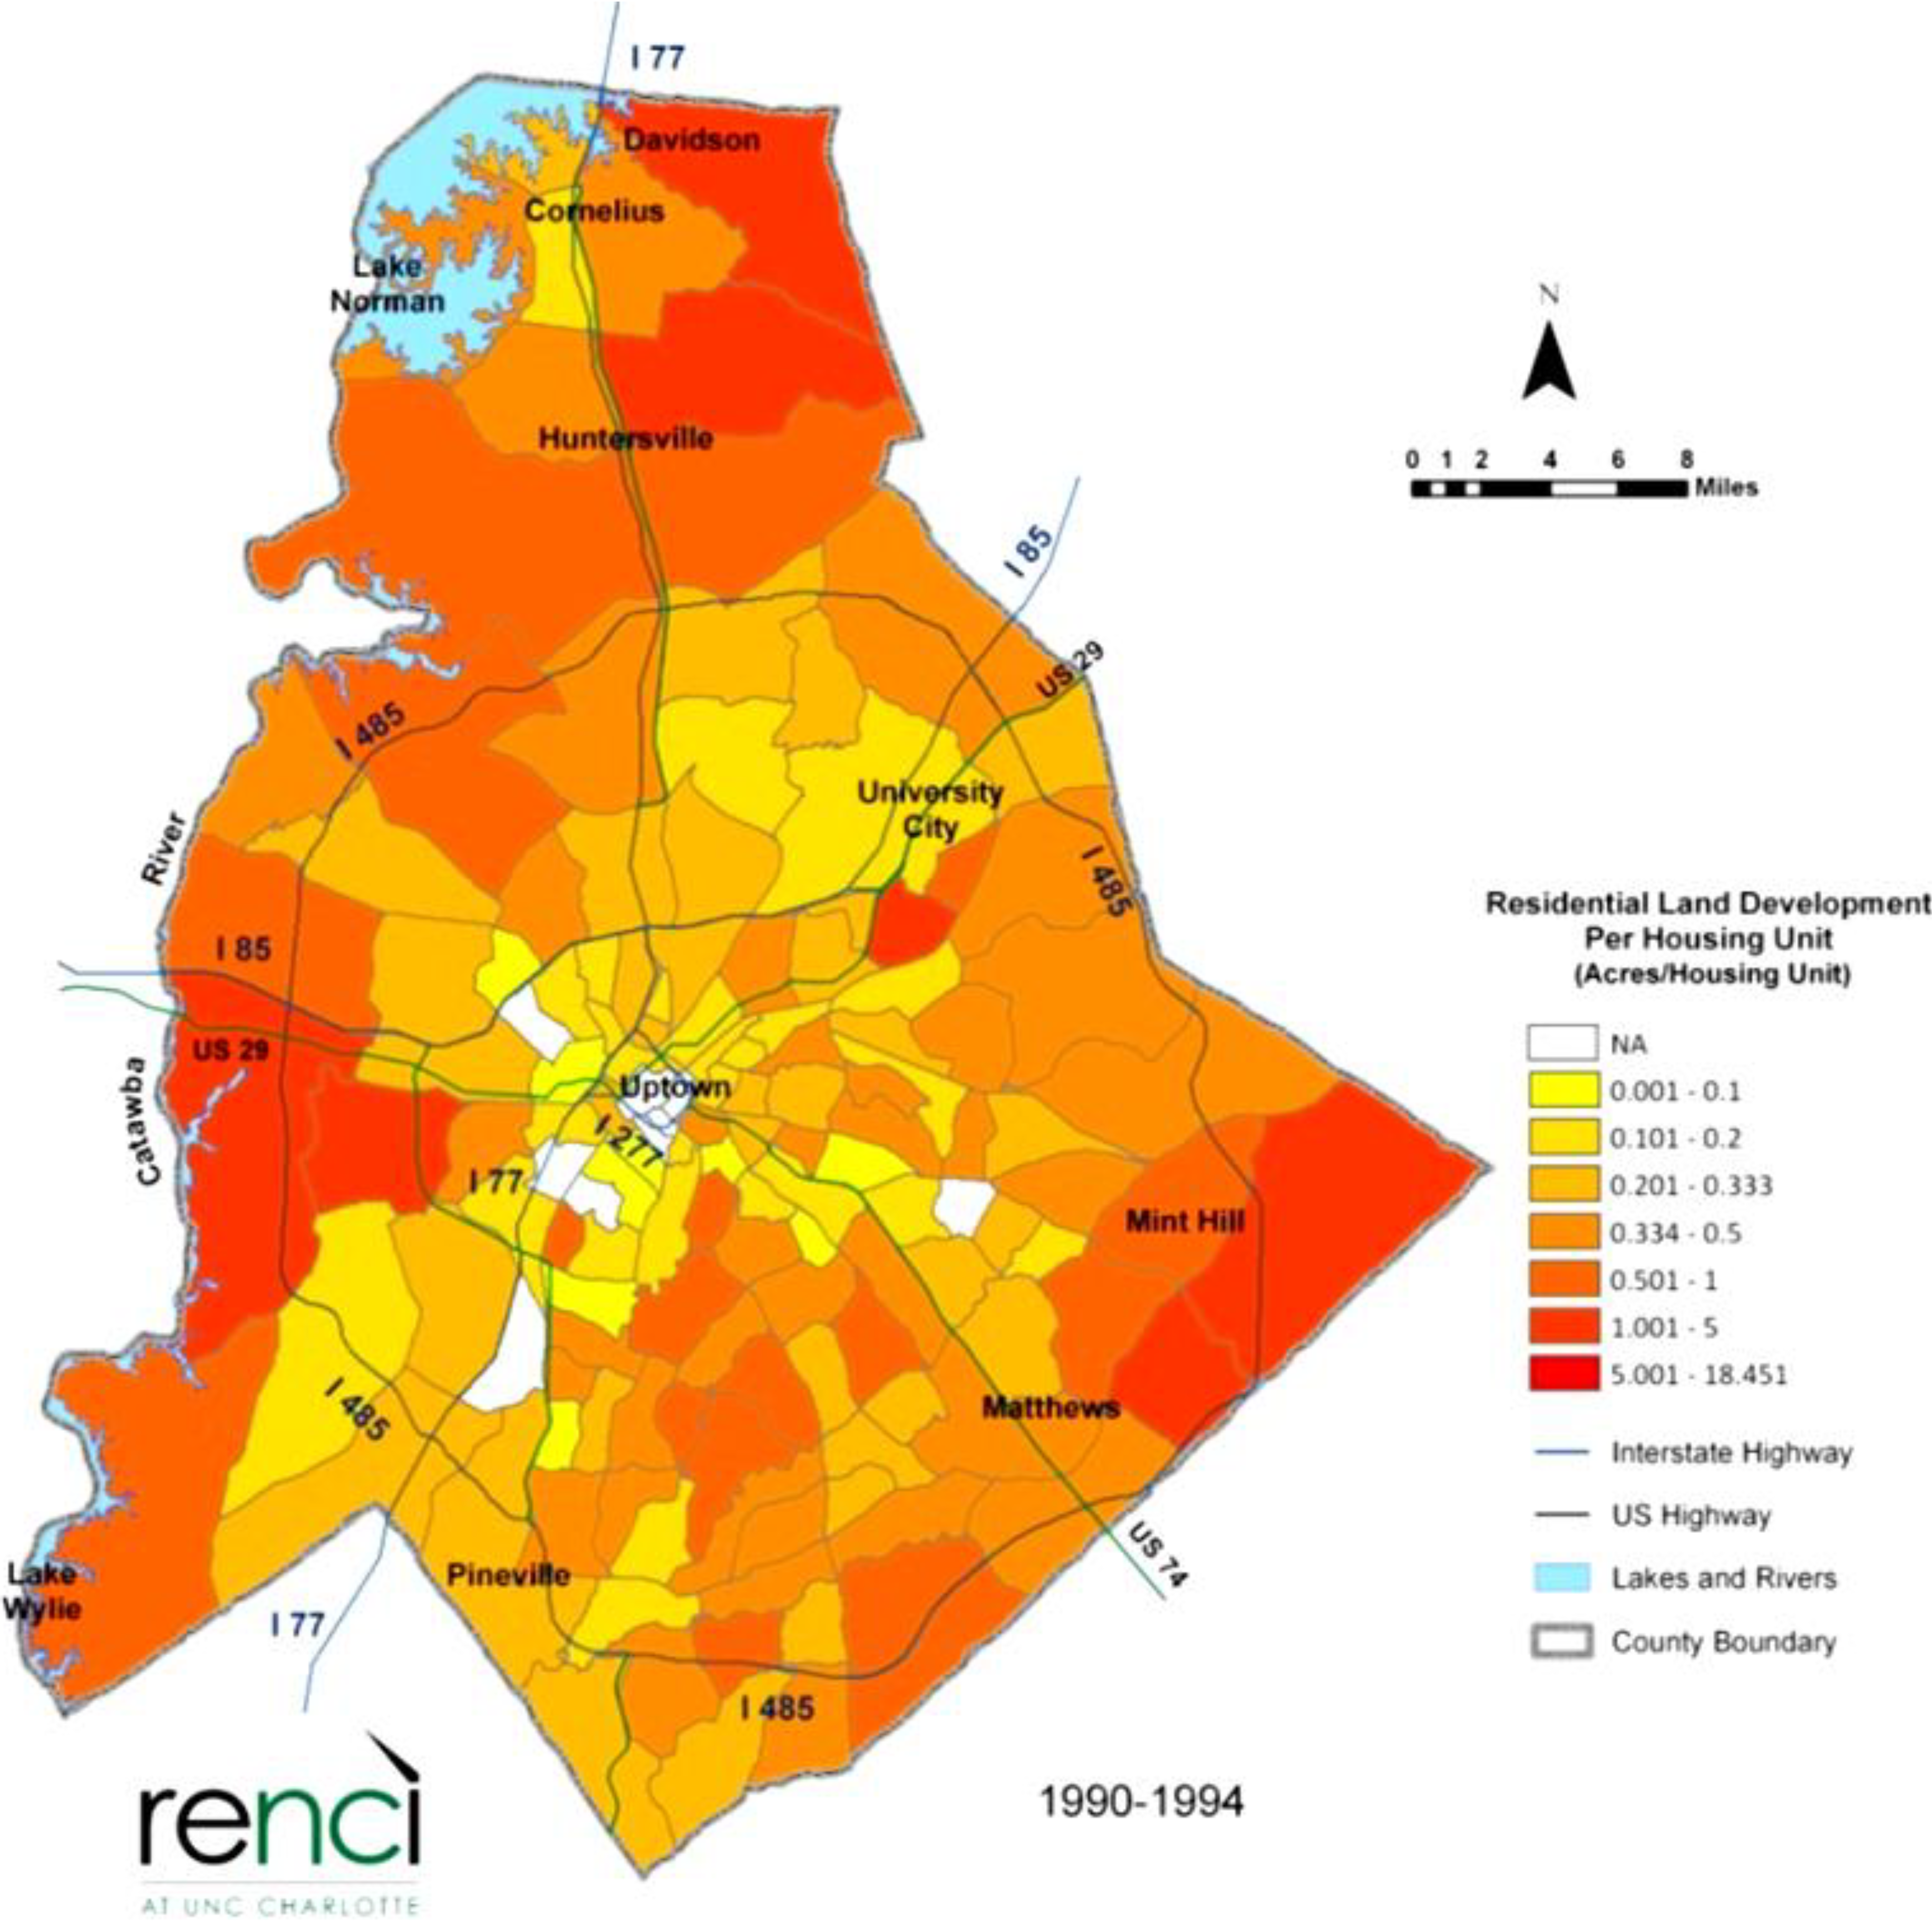
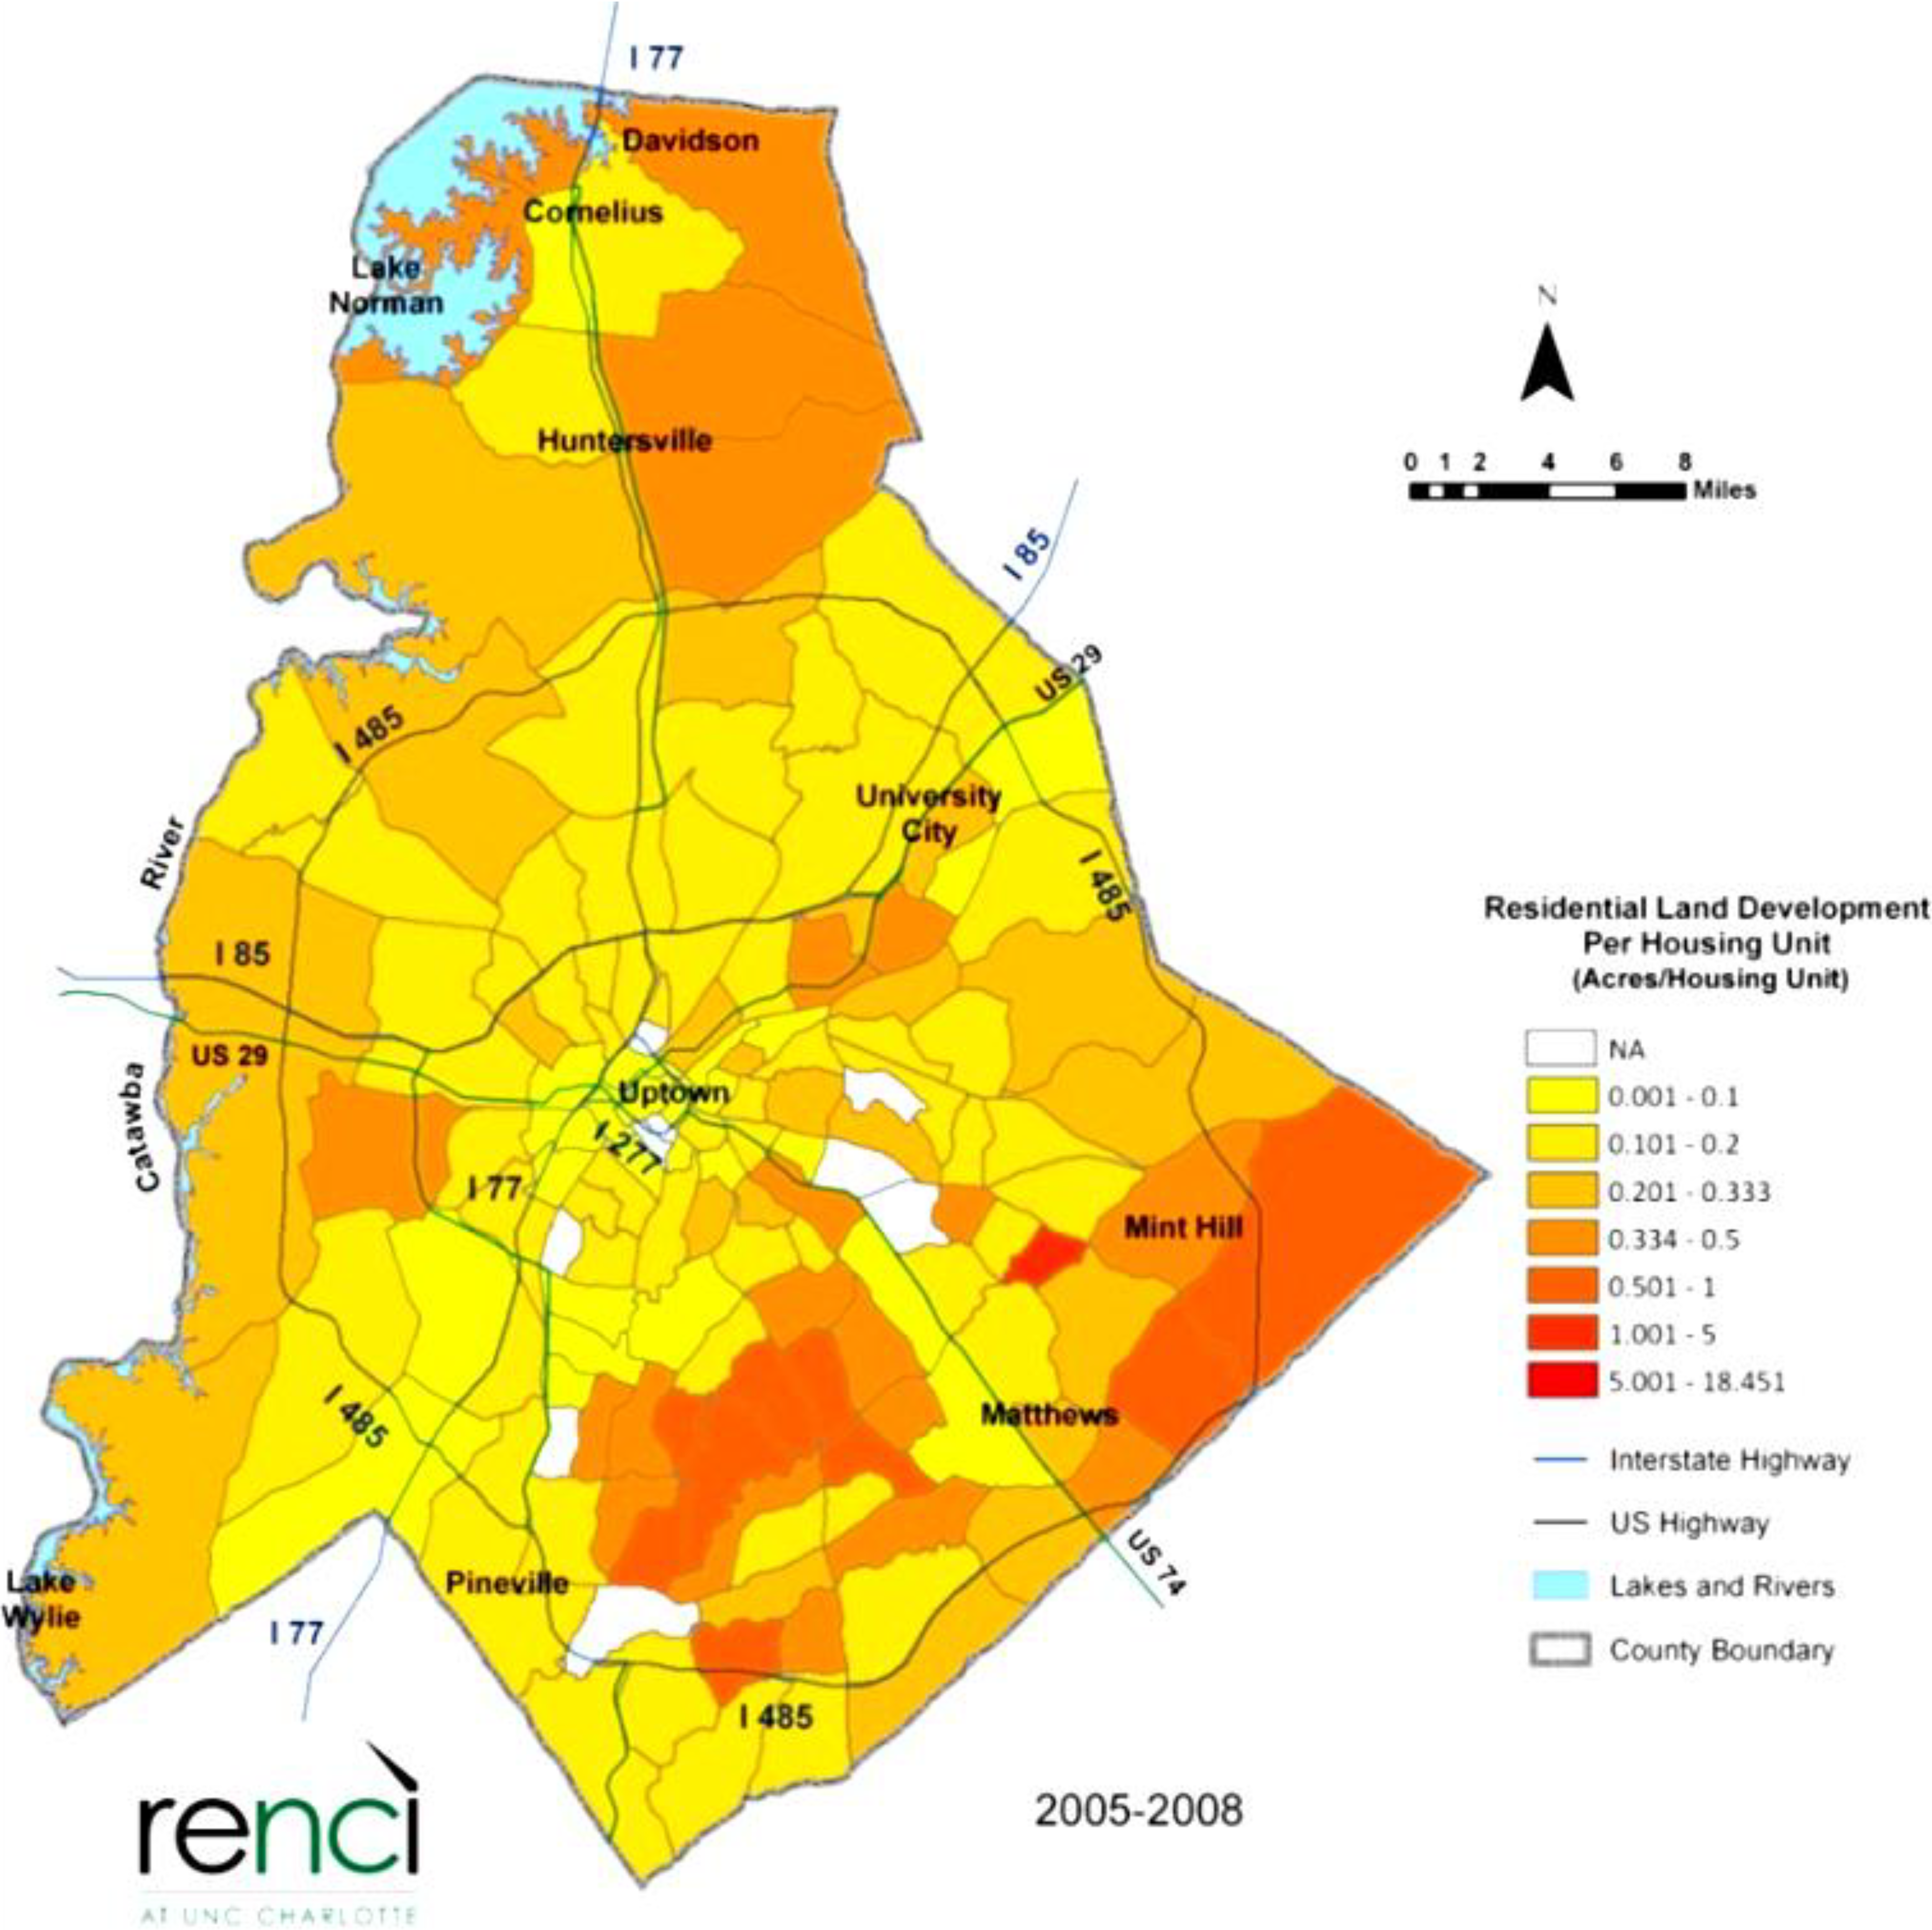
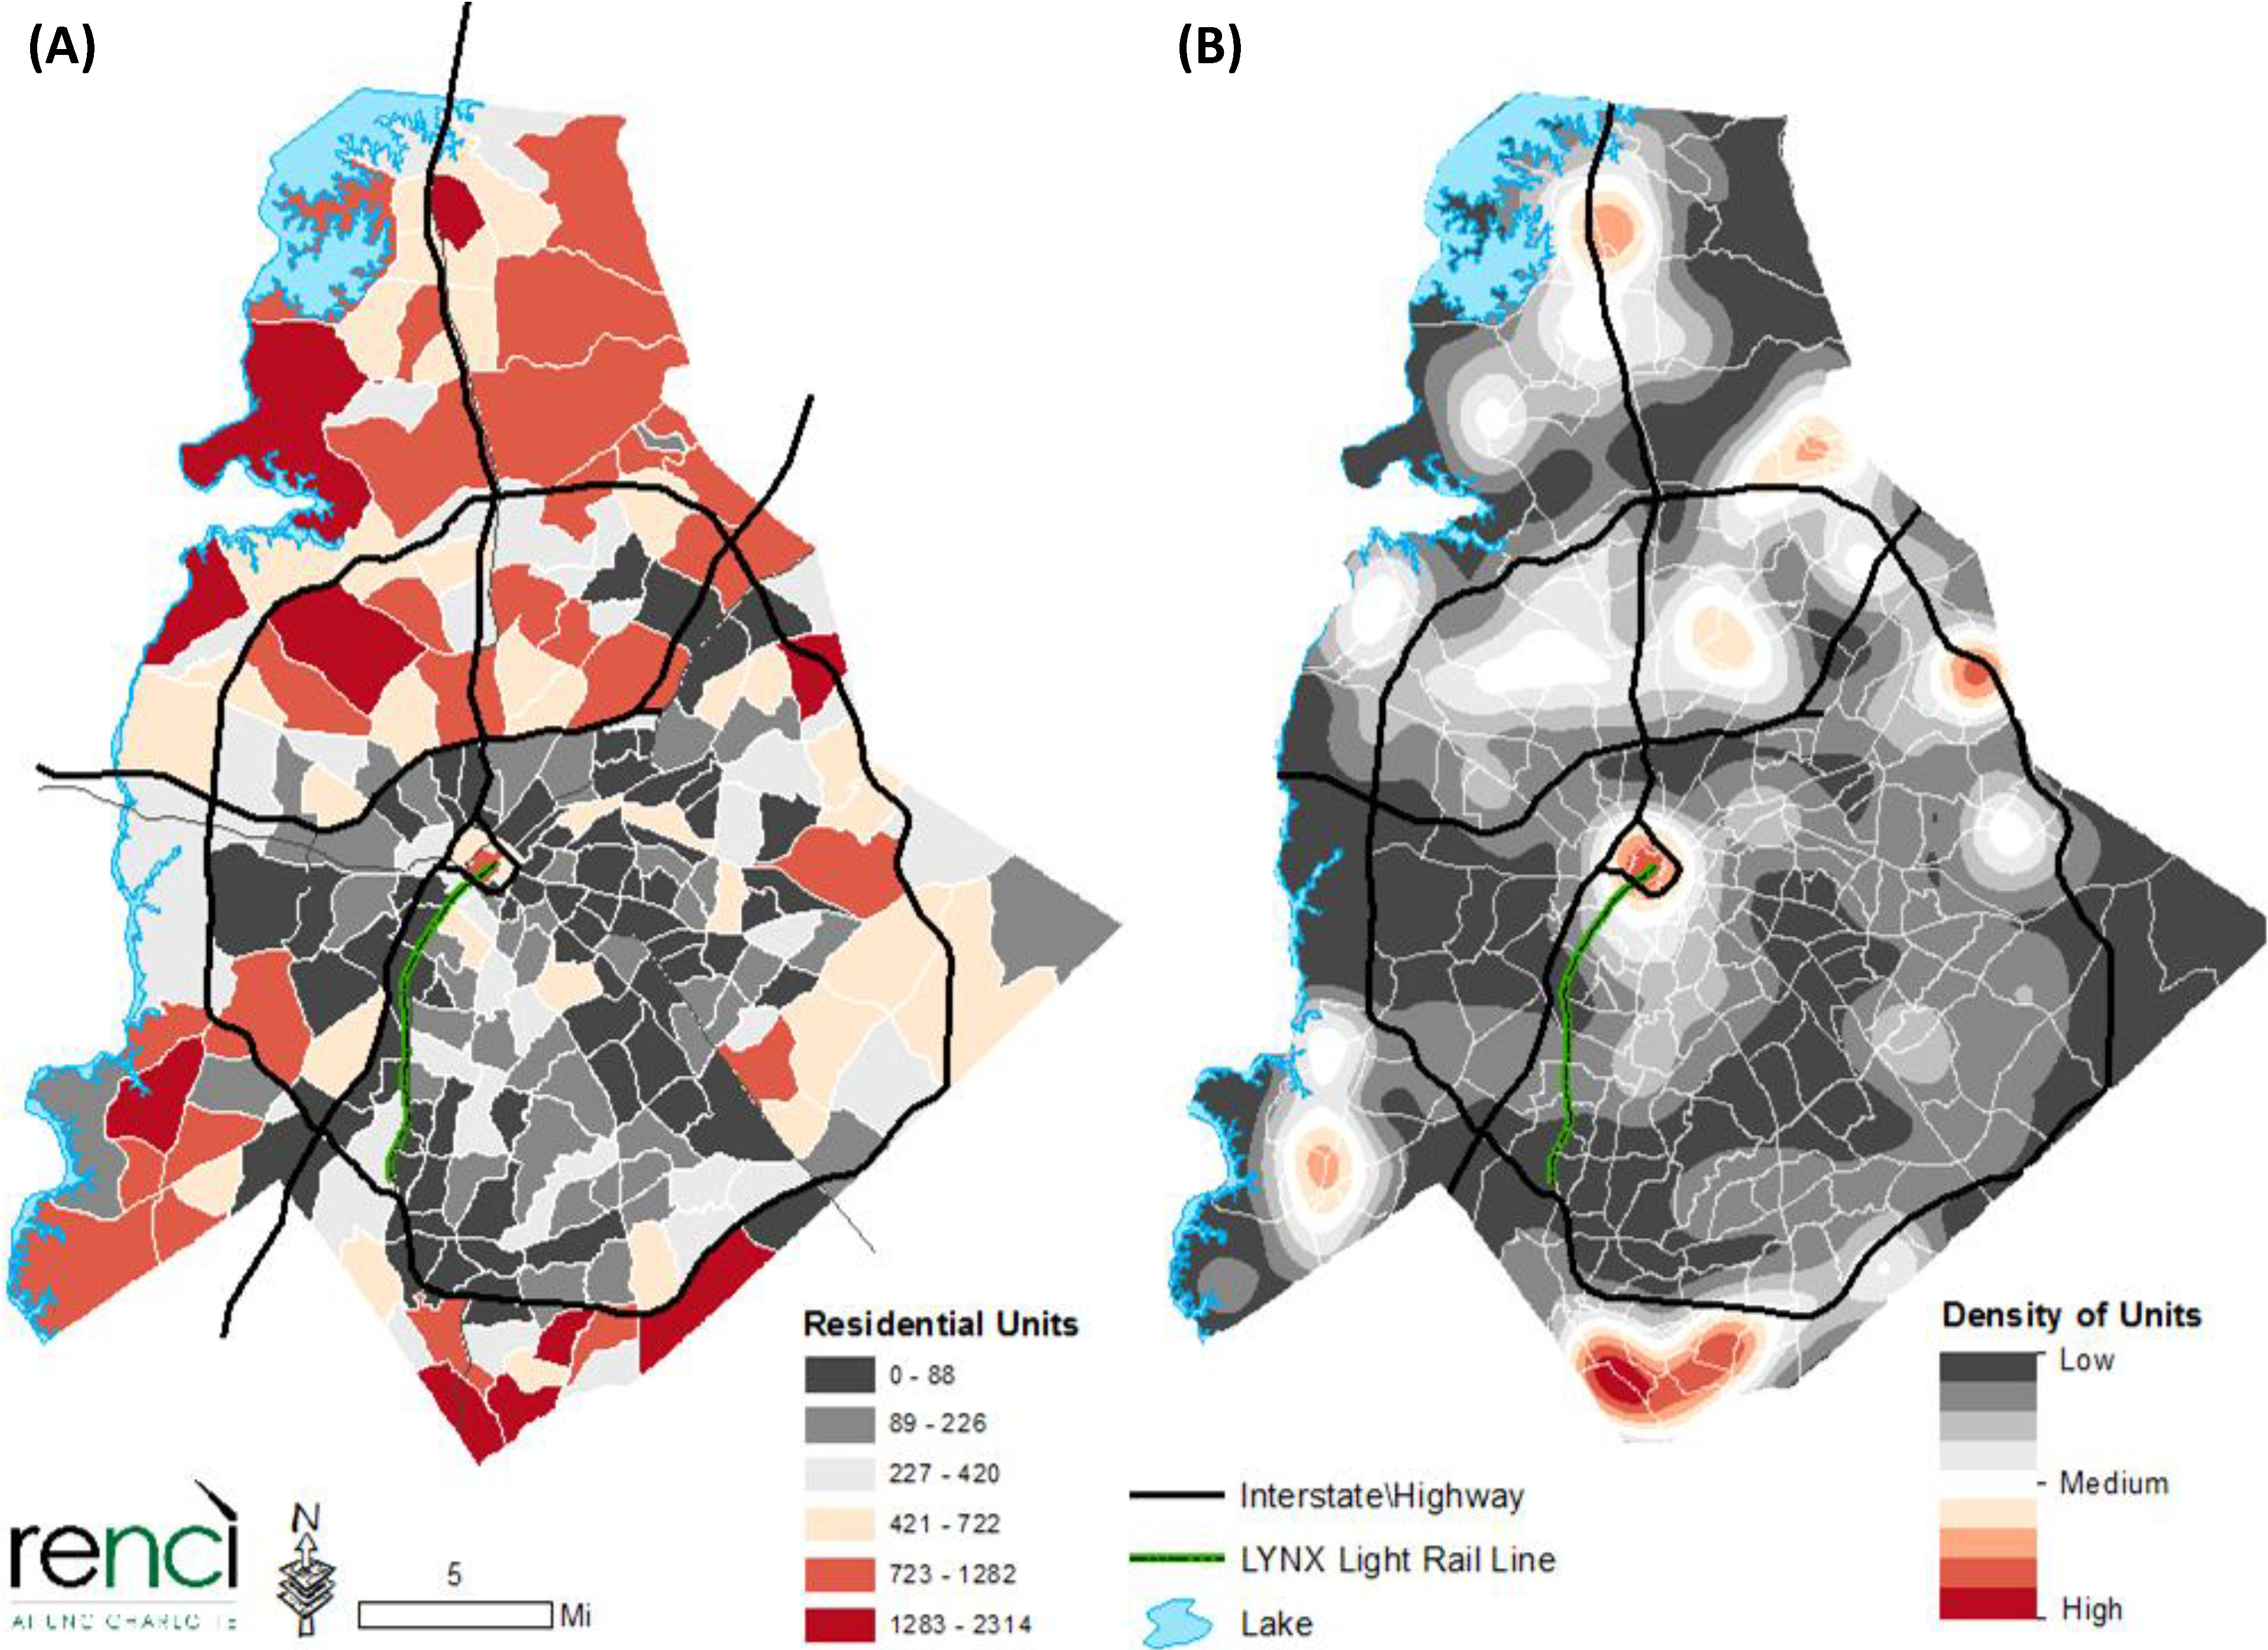
5.2. Spatial Patterns of Development

Given these densification indicators in Mecklenburg County, the spatial location of development patterns is examined next. Figure 6 and Figure 7 are maps representing the spatial distribution of average residential land development per housing unit for two time periods: 1990–1994 and 2005–2008, respectively.
The maps show a higher acre per housing unit value in neighborhoods throughout the county, including the outer-most suburban tracts in the 1990–1994 map (Figure 6) and a clear decline in values in the latter time frame (Figure 7). This further supports the county-wide increase in land intensity of residential developments over the decades of fast growth of Charlotte. As will be discussed in more detail in Section 6, part of this suburban increase in housing development intensity in areas close to the three northern towns of Huntersville, Cornelius and Davidson can be attributed to changes in zoning laws to more progressive, or form-based, developments which helped to spur a number of smart growth or new urbanism-type developments.
The greatest amount of developed land (in terms of acreage) in the latter time frame has occurred in census tracts farthest from the city center (Figure 8), as well as in neighborhoods south of the urban core. Thus, given that the development trend lines suggest a shift towards greater intensity, the spatial patterns of development demonstrate that this cannot all be attributed to infill. On the contrary, there appears to be a change in the form of suburban developments.
Finally, the two maps in Figure 9 illustrate the extent of new residential construction throughout Mecklenburg County from 2000 to 2009.
The map in Figure 9a depicts the total number of residential units constructed during this time span to give the reader a sense of the absolute value of units constructed during that time—values range from a minimum of 0 to a maximum of 2314 units constructed in each tract during the decade. The second map in the Figure is a kernel density surface of individual housing unit locations; this map shows where the highest concentration of residential growth took place: in the city center and in several places along the outer beltway and northern highway corridor. This map also indicates the location of the light rail line extending from the city center southward; this line opened in 2007.
Figure 6. Spatial distribution of new residential land development per housing unit (Acres/Housing Unit), 1990–1994.
Sustainability 06 03975 g006
Figure 7. Spatial distribution of new residential land development per housing unit (Acres/Housing Unit), 2005–2008.
Sustainability 06 03975 g007
Figure 8. Acreage of new residential land development during 2005–2008.
Sustainability 06 03975 g008
Figure 9. Spatial distribution of new housing development, 2000–2009: (A) Total count per census tract; (B) Kernel density of individual housing units.
Sustainability 06 03975 g009

6. Discussion and Conclusions

The results of the disaggregate, longitudinal analysis of development trends in Charlotte’s Mecklenburg County suggest that, particularly since 2000, a shift in development patterns has occurred away from low-density, sprawling suburbs. While the number of parcels developed in the county has steadily risen to meet population influx demands, the resulting developments have occurred at a greater intensity, consuming less land per acre than in the past. This is a significant observation for researchers undertaking modeling of land-use and land cover change, as futures cannot simply be an extrapolation from past trends (as in [25]). It underscores the relevance of breaking from pattern-based modeling approaches and the need, instead, to embrace process-based modeling approaches that can endogenize changes in behaviors and adjustments towards more sustainable environments, whether through market driven mechanisms or through planning initiatives.
The spatial distribution of these changes indicates that this densification trend has occurred on two fronts: urban infill developments close to the city’s core, and higher intensity suburban developments toward the outer reaches of the county. In explaining the reason behind this shift, we have identified four main factors that have contributed to county-wide densification patterns: (1) a trend towards smart growth or ‘New Urbanism’ developments in suburban areas; (2) transit-oriented development around a newly implemented light rail line; (3) revitalization and gentrification in neighborhoods in and around the urban core of Charlotte; and (4) vertical residential development in Charlotte’s center.
As noted, the suburban census tracts, particularly those north of Charlotte, have witnessed a decline in the amount of land developed per residential unit, particularly during the 2000–2010 decade. Part of this intensification can be attributed to progressive, or form-based zoning laws in three towns located to the north of the Charlotte city center (Huntersville, Cornelius, and Davidson), which emphasize new urbanism design principles [21]. For example, the town of Huntersville, situated 14 miles to the north of the city of Charlotte, which saw its population increase by 728 percent between 1990 and 2000 (its 2010 population was recorded as 46,773), adopted a smart growth/mixed-use zoning ordinance in 1996 to curb the construction of typical ‘sprawling’ type developments. The town’s new development regulations include stringent requirements on street connectivity, although it makes no stipulation regarding either housing density requirements or mixed-uses. Rather, these decisions are left to developers based on market demands [26]. Consequently, a host of so-called smart growth or ‘new urbanism’ style developments have been developed in these suburban communities. It is important to note that the density of these suburban developments was not dictated by local governments or zoning regulations; the observed densification is therefore a result of market trends and developer decisions. Such decisions are driven by a developer’s objective of maximizing profits, given existing regulatory constraints. Profits accrued from developing a site are a function of the potential revenue, minus the costs associated with developing the site where revenue is contingent upon the number of lots built, the total size of the development site, as well as other natural amenities, surrounding land uses and accessibility. Costs to the developer stem from the number of lots, the price of land (or the size of the development), the cost of providing infrastructure to the site, and the shape of the parcel to be subdivided [27].
In terms of transit-oriented development, the city’s first light rail line opened in 2007, and as of that year, had attracted $257 million in new, high density developments with another $1.58 billion in announced projects along the line [21]. These developments represent the first realization of the city’s 2025 Transit Corridor System Plan released in 2002 which outlined five multimodal corridors radiating from the city center, each with accompanying land-use intensities that diminish the farther they are from the transportation lines.
Finally, the revitalization and vertical development of Charlotte’s urban core go hand in hand. According to a 2014 “State of the Center City” report [28], the 2.59 square miles of downtown is currently undergoing a second residential housing boom; the first took place in the years just prior to the Great Recession, those documented in our analysis.
This paper has provided a critical descriptive analysis of land development trends in a rapidly growing urban area. A limitation of this work is that it focuses exclusively on the core county of a larger metropolitan region; it may well be the case that more traditional suburbanization continues to take place in the more peripheral areas of the metropolitan regions surrounding our study area. Therefore, future work should expand the spatial scope of this research and employ confirmatory analyses to identify factors driving the observed trends including socioeconomic and demographic shifts in the region, zoning regulation changes, transportation investments, and central city revitalization initiatives.

Acknowledgments

The authors acknowledge financial support from the North Carolina Renaissance Computing Institute (RENCI).

Author Contributions

Elizabeth Delmelle and Jean-Claude Thill contributed to the writing of the manuscript and data analysis. Yuhong Zhou processed and analyzed the data. All authors read and approved the final manuscript.

Conflicts of Interest

The authors declare no conflict of interest.

References

  1. Wilson, B.; Song, Y. Do large residential subdivisions induce further development? A spatially explicit hazard analysis of land use change in charlotte. J. Am. Plann. Assoc. 2010, 77, 5–22. [Google Scholar] [CrossRef]
  2. Bureau, U.C. Growth in urban population outpaces rest of nation, census bureau reports. Available online: http://www.census.gov/newsroom/releases/archives/2010_census/cb12–50.html (accessed on 8 April 2014).
  3. Nelson, A.C. The new urbanity: The rise of a new America. Ann. Am. Acad. Polit. Soc. Sci. 2009, 626, 192–208. [Google Scholar] [CrossRef]
  4. Wheeler, S.M. The evolution of built landscapes in metropolitan regions. J. Plann. Educ. Res. 2008, 27, 400–416. [Google Scholar] [CrossRef]
  5. Brueckner, J.K. Urban sprawl: Diagnosis and remedies. Int. Reg. Sci. Rev. 2000, 23, 160–171. [Google Scholar] [CrossRef]
  6. Muth, R.F. Cities and Housing; University of Chicago Press: Chicago, IL, USA, 1969. [Google Scholar]
  7. Gordon, P.; Richardson, H.W. Are compact cities a desirable planning goal? J. Am. Plann. Assoc. 1997, 63, 95–106. [Google Scholar] [CrossRef]
  8. Levine, J.; Frank, L.D. Transportation and land-use preferences and residents’ neighborhood choices: The sufficiency of compact development in the Atlanta region. Transportation 2007, 34, 255–274. [Google Scholar] [CrossRef]
  9. Song, Y.; Knaap, G.-J. Measuring urban form: Is Portland winning the war on sprawl? J. Am. Plann. Assoc. 2004, 70, 210–225. [Google Scholar] [CrossRef]
  10. Galster, G.; Hanson, R.; Ratcliffe, M.R.; Wolman, H.; Coleman, S.; Freihage, J. Wrestling sprawl to the ground: Defining and measuring an elusive concept. Hous. Pol. Debate 2001, 12, 681–717. [Google Scholar] [CrossRef]
  11. Lopez, R.; Hynes, H.P. Sprawl in the 1990s measurement, distribution, and trends. Urban Aff. Rev. 2003, 38, 325–355. [Google Scholar]
  12. Johnson, M.P. Environmental impacts of urban sprawl: A survey of the literature and proposed research agenda. Environ. Plann. A 2001, 33, 717–735. [Google Scholar] [CrossRef]
  13. Jun, M.-J. The effects of Portland’s urban growth boundary on urban development patterns and commuting. Urban Stud. 2004, 41, 1333–1348. [Google Scholar] [CrossRef]
  14. Wilson, B.; Song, Y. Comparing apples with apples: How different are recent residential development patterns in Portland and charlotte? J. Urbanism 2009, 2, 51–74. [Google Scholar]
  15. Russonello, B.; Stewart, L. Community preference survey: What Americans are looking for when deciding where to live. Available online: http://www.realtor.org/reports/2011-community-preference-survey (accessed on 18 June 2014).
  16. Sarzynski, A.; Galster, G.; Stack, L. Evolving United States metropolitan land use patterns. Urban Geogr. 2013, 35, 25–47. [Google Scholar]
  17. Thomas, J. Residential construction trends in America’s metropolitan regions. Washington, D.C. Environmental Protection Agency. Available online: http://www.epa.gov/dced/construction_trends.htm (accessed on 18 June 2014).
  18. Atkinson-Palombo, C. New housing construction in phoenix: Evidence of “new suburbanism”? Cities 2010, 27, 77–86. [Google Scholar] [CrossRef]
  19. Kopits, E.; McConnell, V.; Miles, D. Lot size, zoning, and household preferences. Hous. Pol. Debate 2012, 22, 153–174. [Google Scholar] [CrossRef]
  20. Wilson, S.; Plane, D.; Mackun, P.; Fischetti, T.; Goworowska, J. Patterns of Metropolitan and Micropolitan Population Change: 2000 to 2010; US Census Bureau: Washington, DC, USA, 2010. [Google Scholar]
  21. Walters, D. Centers and edges: The confusion of urban and suburban paradigms in charlotte-Mecklenburg’s development patterns. In Charlotte, NC: The Global Evolution of a New South City; Graves, W., Smith, H., Eds.; University of Georgia Press: Athens, Greece, 2010. [Google Scholar]
  22. Smith, H.; Graves, W. The corporate (re) construction of a new south city: Great banks need great cities. SE Geogr. 2003, 43, 213–234. [Google Scholar]
  23. Delmelle, E.C.; Thill, J.-C. Mutual relationships in neighborhood socioeconomic change. Urban Geogr. 2014, in press. [Google Scholar]
  24. Fogarty, N.; Austin, M. Rails to Real Estate: Development Patterns along Three New Transit Lines; Center for Transit Oriented Development: Washington, DC, USA, 2011. [Google Scholar]
  25. Meentemeyer, R.K.; Tang, W.; Dorning, M.A.; Vogler, J.B.; Cunniffe, N.J.; Shoemaker, D.A. Futures: Multilevel simulations of emerging urban-rural landscape structure using a stochastic patch-growing algorithm. Ann. Assoc. Am. Geogr. 2013, 103, 785–807. [Google Scholar] [CrossRef]
  26. Huntersville, T.O. Planning philosophy. Available online: http://www.huntersville.org/Departments/Planning/PlanningPhilosophy.aspx (accessed on 16 November 2013).
  27. McConnell, V.; Walls, M.; Kopits, E. Zoning, TDRs and the density of development. J. Urban Econ. 2006, 59, 440–457. [Google Scholar] [CrossRef]
  28. Partners, C.C.C. State of the center city. Available online: http://www.charlottecentercity.org/business/reports/state-of-the-center-city/ (accessed on 14 April 2014).

