Transfer Scheme Evaluation Model for a Transportation Hub based on Vectorial Angle Cosine

Abstract
:1. Introduction
2. Basic Model Based on Vectorial Angle Cosine
 ,
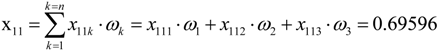
,  , j = 1,…, N, xij represents the sequential vector consisted by each indicator value of i-th program, k = 1,…, n represents the sub-indicators corresponded to the index xij . ωk represents each sub-index weight related to its corresponding index,
  .
. , j=1,…, N, According to the definition of two vector (Set A, B) angular cosine:
  , cosine formula between the i-th scheme and the best solution can be obtained:

3. Multi-Objective Decision Hub Transfer Scheme Evaluation Based on Vectorial Angle Cosine
3.1. Evaluation Index System

3.2. Quantitative Evaluation of Indicators


 , A1 represents the average transfer distance to other transit line. i represents other transit line, N is the total amount of all transit lines. ni represents the number of passenger who transfer to the i-th transit line, di represents the transfer distance to the i-th transit line; A2 represents transfer line slope, using transfer stairs angular cosine to represent, L1 represents horizontal distance of the stair, L2 represents the tilt length of the stair. K1, K2, are the coefficients.

3.3. Evaluation Index Standardization
3.4. Hub Transfer Scheme Evaluation Based on Cosine of the Vector’s Angle
 , i = 1…m, j = 1…N, k = 1…n. Then, we obtained weight vector { θj } of indicator vector { xij } based on the AHP method. Zi = {zij} = {xij · θj},
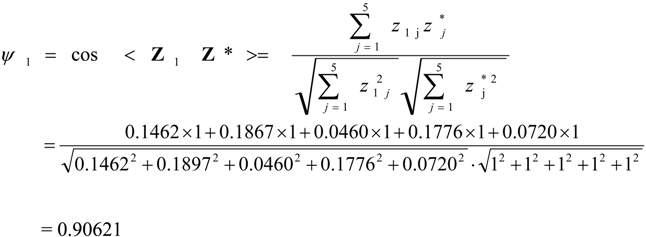
  , j = 1…N. We calculated the cosine ψi of the angle between the index vector Zi = {zij} (i = 1…m, j = 1…N) given by the i-th scheme and the ideal solution indicators vector Z*. The steps of multi-objective decision based on vectorial angle cosine is as follows.
 | Step 1: |  |
| Step 2: | 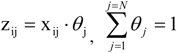 |
| Step 3: | |
| i = 1,…, m; j = 1, …, N |
4. Application

| Evaluation indexes xij | Evaluation sub-indexes xjjk | Evaluation index values | Ideal scheme | First scheme | Second scheme | Third scheme | ωk | θj |
|---|---|---|---|---|---|---|---|---|
| xi1 | xi11 | Original value | 4.8 | 3.4 | 3.7 | 4.5 | 0.33 | 0.21 |
| Normalized value | 1.000 | 0.708 | 0.771 | 0.938 | ||||
| xi12 | Original value | 5.0 | 4.2 | 4.6 | 4.8 | 0.35 | ||
| Normalized value | 1.000 | 0.840 | 0.920 | 0.960 | ||||
| xi13 | Original value | 3 | 5.7 | 6.2 | 5.6 | 0.32 | ||
| Normalized value | 1.000 | 0.526 | 0.484 | 0.536 | ||||
| xi2 | xi21 | Original value | 1.5 | 1.3 | 1.2 | 0.9 | 0.48 | 0.20 |
| Normalized value | 1.000 | 0.867 | 0.800 | 0.600 | ||||
| xi22 | Original value | 0.895 | 0.855 | 0.702 | 0.825 | 0.52 | ||
| Normalized value | 1.000 | 0.955 | 0.784 | 0.922 | ||||
| xi3 | xi31 | Original value | 2 | 9 | 4 | 13 | 0.53 | 0.22 |
| Normalized value | 1.000 | 0.222 | 0.500 | 0.154 | ||||
| xi32 | Original value | 80 | 410 | 220 | 545 | 0.47 | ||
| Normalized value | 1.000 | 0.195 | 0.364 | 0.147 | ||||
| xi4 | xi41 | Original value | 0.104 | 0.098 | 0.086 | 0.084 | 0.30 | 0.19 |
| Normalized value | 1.000 | 0.942 | 0.827 | 0.808 | ||||
| xi42 | Original value | 0.800 | 0.854 | 0.890 | 0.880 | 0.38 | ||
| Normalized value | 1.000 | 0.937 | 0.899 | 0.909 | ||||
| xi43 | Original value | 0.950 | 0.880 | 0.832 | 0.867 | 0.32 | ||
| Normalized value | 1.000 | 0.926 | 0.876 | 0.913 | ||||
| xi5 | xi52 | Original value | 2 | 5 | 8 | 6 | 1.00 | 0.18 |
| Normalized value | 1.000 | 0.400 | 0.250 | 0.333 | ||||
| Vector cosine | ψ0=1 | ψ1 | ψ2 | ψ3 |

 .
.
5. Conclusions
Acknowledgments
Author Contributions
Conflicts of Interest
References
- Sun, L.-S.; Ren, F.-T.; Yao, L.-Y. Application of fuzzy multi-attribute decision making method in urban transportation terminal scheme optimum selection. J. Beijing Univ. Technol. 2007, 33, 470–474. [Google Scholar]
- Li, F. Optimum Transfer Project of Urban Rail Transit Hinge. Urb. Mass Transit 2007, 10, 14–17. [Google Scholar]
- Yi, J. Evaluating the transfer project of urban passenger hub with gray system theory. J. Lan Zhou Jiaotong Univ. 2008, 27, 89–92. [Google Scholar]
- Shen, H.; Xie, J.; Li, J.; Li, W. Hydrological combined forecasting method based-on vectorangular cosine. Syst. Eng. Theory Practice 2012, 32, 1591–1597. [Google Scholar]
- Zhao, M.; Huo, Z.; Chen, Q. Multi-objective decision-making model and its application in engineering evaluation based on vector cosine. J. Anhui Univ. Tech. (Nat. Sci.) 2011, 28, 300–303. [Google Scholar]
- Tao, Z.-F.; Zhang, J.; Chen, H.-Y. Multi-objective programming method of interval combination forecasting based on vectorial angle cosine. J. Xihua Univ. (Nat. Sci.) 2010, 29, 35–41. [Google Scholar]
- Montreuil, B.; Ratliff, H.D. Optimizing the location of input/output stations within facilities layout. Eng. Costs Prod. Eco. 1988, 14, 177–187. [Google Scholar] [CrossRef]
- Tullis, T.S. Facile: A Computer Program for Space Station Facilities Layout and Activity Simulation. SAE Intersoc. Conf. Environ. Syst. 1987. [Google Scholar] [CrossRef]
- Tsang, C.W.; Ho, T.K. Passenger flow and station facilities modeling for metro station layout design. In Proceedings of the 4th International Conference on Traffic and Transportation Studies, Dalian, China, 2–4 August 2004.
- Lee, H.Y. Integrating simulation and ant colony optimization to improve the service facility layout in a station. J. Comput. Civ. Eng. 2012, 26, 259–269. [Google Scholar]
- Diego-Mas, J.A.; Santamarina-Siurana, M.C.; Alcaide-Marzal, J.; Cloquell-Ballester, V.A. Solving facility layout problems with strict geometric constraints using a two-phase genetic algorithm. Int. J. Prod. Res. 2009, 47, 1679–1693. [Google Scholar] [CrossRef] [Green Version]
- Lu, Q. Design of Marker System for Passengers in Traffic Hubs. Urb. Rapid Rail Transit 2012, 1, 68–77. [Google Scholar]
- Pan, H.; Shen, Q.; Xue, S. Intermodal Transfer between Bicycles and Rail Transit in Shanghai, China. Transp. Res. Record 2010, 2144, 181–188. [Google Scholar] [CrossRef]
- Zhang, Y.-S.; Chen, X.-M.; Yu, L.; He, B.; Lin, G.-X. Study on model of coordinated operation between urban rail and bus systems at transfer stations. J. China Railw. Soc. 2009, 3, 11–19. [Google Scholar]
- Li, W. Research on the organizational efficiency evaluation of China’s railway transport industry with network DEA. Adv. Inf. Sci. Service Sci. Available online: http://d.g.wanfangdata.com.cn/Periodical_zgrkx201105021.aspx (accessed on 6 May 2014).
- Sharma, B.C.; Gandhi, O.P. Safety assessment of lubricating oil using AHP and vector projection method. Ind. Lubr. Tribol. 2008, 60, 259–265. [Google Scholar] [CrossRef]
- Zhang, Q.; Han, B.; Li, D.; Lu, F. Evaluation method for the operation performance of urban rail transit hub based on simulation technology. China Railw. Sci. 2011, 32, 120–126. [Google Scholar]
- Cherry, T.; Townsend, C. Assessment of Potential Improvements to Metro-Bus Transfers in Bangkok, Thailand. Transp. Res. Rec. 2012, 2276, 116–122. [Google Scholar] [CrossRef]
- Li, F.-L.; Ge, Z.-Y. Synthetic evaluation on transfer of rail transit terminal based on AHP method. Railw. Transp. Econ. 2006, 28, 79–81. [Google Scholar]
- Zhou, W.; Jiang, C.-L. Theoretical analysis of the interchange passengers in urban transport terminals. J Transp. Syst. Eng. Inf. Technol. 2005, 5, 3–30. [Google Scholar]
- Sun, Q.-P.; Cheng, D.-X. An Empirical Study of Fuzzy Quality Synthetic Evaluation of Comprehensive Transfer Hub Transfer Articulation. Technol. Innov. Manag. 2010, 31, 164–166. [Google Scholar]
- Song, Y.; Wang, Z.; Wang, M. Evaluation of urban rail transit transfer efficiency. Key technologies of railway engineering-high speed railway. Heavy Haul Railw. Urb. Rail Transit. 2010, pp. 639–642. Available online: http://apps.webofknowledge.com/full_record.do?product=UA&search_mode=GeneralSearch&qid=2&SID=1FY2kvuZ3v9RVxerjXD&page=1&doc=3 (accessed on 6 May 2014).
- Hirano, K.; Kitao, Y. A study on connectivity and accessibility between tram stops and public facilities. WIT Tran. Built Environ. 2009, 107, 247–264. [Google Scholar] [CrossRef]
- Brierley, G.S.; Drake, R.D. Cost-reduction strategies for subway design and construction. Tunn. Undergr. Space Technol. 1995, 10, 31–35. [Google Scholar] [CrossRef]
© 2014 by the authors; licensee MDPI, Basel, Switzerland. This article is an open access article distributed under the terms and conditions of the Creative Commons Attribution license (http://creativecommons.org/licenses/by/3.0/).
Share and Cite
Yao, L.-Y.; Xia, X.-F.; Sun, L.-S. Transfer Scheme Evaluation Model for a Transportation Hub based on Vectorial Angle Cosine. Sustainability 2014, 6, 4152-4162. https://doi.org/10.3390/su6074152
Yao L-Y, Xia X-F, Sun L-S. Transfer Scheme Evaluation Model for a Transportation Hub based on Vectorial Angle Cosine. Sustainability. 2014; 6(7):4152-4162. https://doi.org/10.3390/su6074152
Chicago/Turabian StyleYao, Li-Ya, Xin-Feng Xia, and Li-Shan Sun. 2014. "Transfer Scheme Evaluation Model for a Transportation Hub based on Vectorial Angle Cosine" Sustainability 6, no. 7: 4152-4162. https://doi.org/10.3390/su6074152
APA StyleYao, L.-Y., Xia, X.-F., & Sun, L.-S. (2014). Transfer Scheme Evaluation Model for a Transportation Hub based on Vectorial Angle Cosine. Sustainability, 6(7), 4152-4162. https://doi.org/10.3390/su6074152