1. Introduction
In a time of great attention to energy savings, thinking about cities and their evolution toward smart communities is strategic. To do this, trying to make all cities of the world “smart” can play a key role in the environmental and economic recovery. Most of the world’s population lives in urban areas and in inefficient buildings under the energy point of view. Starting from these assumptions, there is the need to identify technologies and innovations able to improve social development and quality of life. Smart cities can be a viable solution [
1,
2,
3,
4,
5]. The term smart city is related to a coordinated set of interventions with the aim to improve the quality of life and urban services. To achieve this concept of a city, an extensive use of ICT (information communication technologies) and a design full of intelligence and ability is necessary; hence the “smart”. Different from the past, where each aspect was approached separately, in smart cities, they are considered simultaneously. Indeed, the city is viewed as a collection of interconnected networks, such as a transportation network, a power grid, a network of buildings, a lighting network, a network of social relations, a network of public lighting, water, garbage and others. The whole concept of smart cities involves an important subset, the so-called smart environment, which takes into account the energy efficiency upgrading of existing buildings. On the other hand, thinking only about the introduction of ICT technologies [
6,
7,
8,
9] for the creation of a smart environment is not correct. In some cases, these technologies can be used only for a system optimization. The smart cities concept refers to an innovative design process for new urban areas, but it is worth noticing that the building sector needs redevelopment: not all planned “smart” technologies can be applied to all buildings. This is due to the presence of artistic and architectural constraints.
It is clearly necessary to investigate the influence of common efficiency measures on buildings and, at the same time, use advanced calculation codes to define the energy performance. In their studies, De Lieto Vollaro
et al. [
10,
11] evaluated the energy performance of historical buildings through the dynamic software, TRNSYS (Transient System Simulation Tool). The authors compared the results obtained with the dynamic approach with the conventional semi-stationary one. Using a dynamic code allowed them to take into account the inertial behavior of the structures.
Dynamic software, such as TRNSYS, can be used in a holistic approach to design and retrofit. This approach, applied to the building envelope, requires an assessment of thermal, acoustic, optical and structural aspects. Baldinelli
et al. [
12] proposed a holistic approach to a wooden window. Through this methodology, they optimized the energy and environmental performance of the wooden window, by evaluating the influence of thermal, acoustic, optical, mechanical and environmental properties.
Agnoli and Zinzi [
13] carried out a parametric analysis on window thermal proprieties. They studied various window types, characterized by different values of the solar gain factor, window transmittance and air permeability. Using TRNSYS software, the authors investigated the net energy requirement for many types of buildings, taking into account the window properties’ variation.
Furthermore, Ballarini and Corrado [
14] performed a parametric analysis, over two case studies, aiming to establish the importance of the thermal insulation to the cooling energy need. They carried out several studies under different configurations, characterized by different parameter sets that affect the energy performance. Many variables were considered, such as external climate, type of building use, occupancy schedule, building geometry, size of the transparent surfaces, thermal and solar parameters of the transparent surfaces, the solar absorption coefficient of the external surface of the opaque envelope, the thermal insulation level and the heat capacity of the building components.
The aim of this paper is to provide a parametric analysis for the holistic design of the building envelope. In particular, the influence of some building envelope parameters on the energy demand has been analyzed, such as solar absorbance, the thermal transmittance of vertical and horizontal surfaces and the solar gain factor values (
g-value). These parameters are representative of the possible interventions that can be applied over the whole building sector, conventional and historical [
15].
2. Methodology
The aim of this study is to assess the possible interventions on the building envelope that should allow significant energy savings. In general, to achieve this goal, technicians evaluate the intervention effects on buildings in a sequential approach [
16], without assessing every single improvement.
On the contrary, this study adopts a different approach. Indeed, in order to improve the energy efficiency of the building envelope, the effect of each intervention was separately assessed. Finally, the results are reported on a single graph.
Regarding building envelope, changes to dyes, the thermal transmittance of vertical and horizontal surfaces, the windows’ thermal transmittance and the solar gain factor values (
g-value) were considered:
The solar absorbance of walls, roofs and other external surfaces was considered through different dyes;
Thermal transmittance variation was considered, taking into account vertical and horizontal surfaces;
Thermal transmittance and the solar gain factor (g-value) of some window categories were considered, taking into account that the first and the second parameters are mutually influenced.
Finally, a graph able to summarize the interventions’ effect on the energy demands was carried out by means of the analysis of five different models:
- (1)
The standard configuration model: characterized by specific values of solar absorbance, vertical and horizontal surface transmittance, window thermal transmittance and the solar gain factor;
- (2)
The solar absorbance variation model: characterized by the same parameters values assumed in the standard configuration model, except for the solar absorbance, which is characterized by five different values, from 0.100 to 0.600;
- (3)
The vertical opaque surface’s transmittance variation model: characterized by the same parameter values assumed in the standard configuration model, except for the vertical wall thermal transmittance, which is characterized by five different values, from 0.650 to 2.341 W/m2K;
- (4)
The horizontal opaque surface’s transmittance variation model: characterized by the same parameter values assumed in the standard configuration model, except for the roof thermal transmittance, which is characterized by five different values, from 0.628 to 2.080 W/m2K;
- (5)
The window g-value variation model: characterized by the same parameters values assumed in the standard configuration model, with five different values for the solar gain factor, from 0.855 to 0.910;
The parameters adopted for each configuration are shown in
Table 1.
Table 1.
Parameters values for each configuration.
Table 1.
Parameters values for each configuration.
| | α
(-) | Uvs
(W/m2K) | Uhs
(W/m2K) | Uw
(W/m2K) | g-value
(-) |
|---|
| Standard configuration model | 0.600 | 0.650 | 0.628 | 5.680 | 0.855 |
| Solar absorbance variation model | from 0.100 to 0.600 | 0.650 | 0.628 | 5.680 | 0.855 |
| Vertical opaque surface’s transmittance variation model | 0.600 | from 0.650 to 2.341 | 0.628 | 5.680 | 0.855 |
| Horizontal opaque surface’s transmittance variation model | 0.600 | 0.650 | from 0.628 to 2.080 | 5.680 | 0.855 |
| Window g-value variation model | 0.600 | 0.650 | 0.628 | 5.680 | from 0.855 to 0.910 |
2.1. Building Model
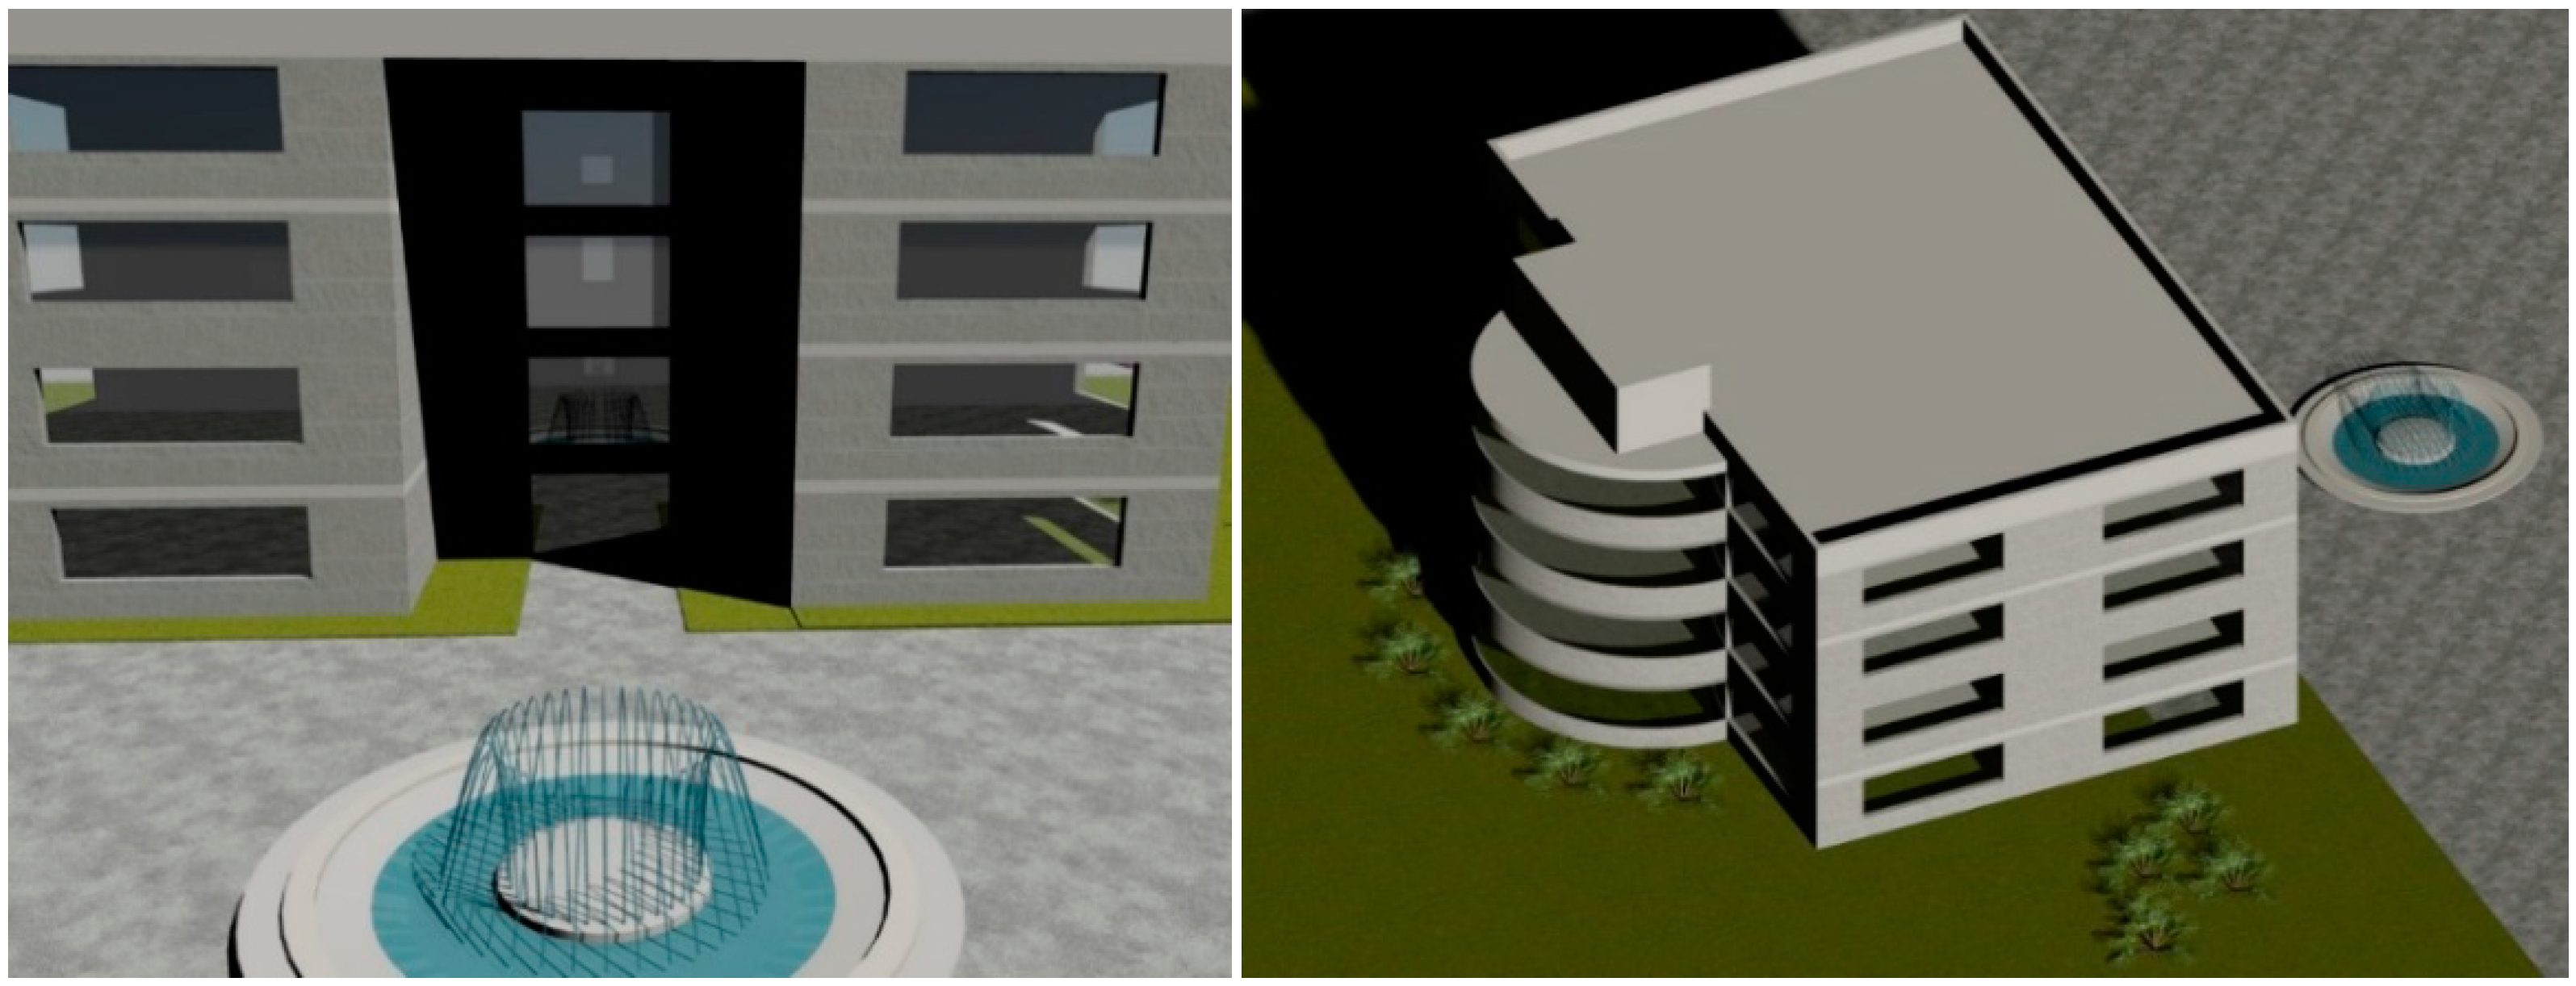
The building taken into account in this study is situated in Rio de Janeiro. The structure is composed of three stories of 699.5 m
2, and each floor is 3 m high. The building is characterized by large windows, as shown in
Figure 1. This has an important impact on the building’s energy demand, because of the climatic conditions of Rio de Janeiro in terms of solar radiation.
Figure 1.
Rendering of the building.
Figure 1.
Rendering of the building.
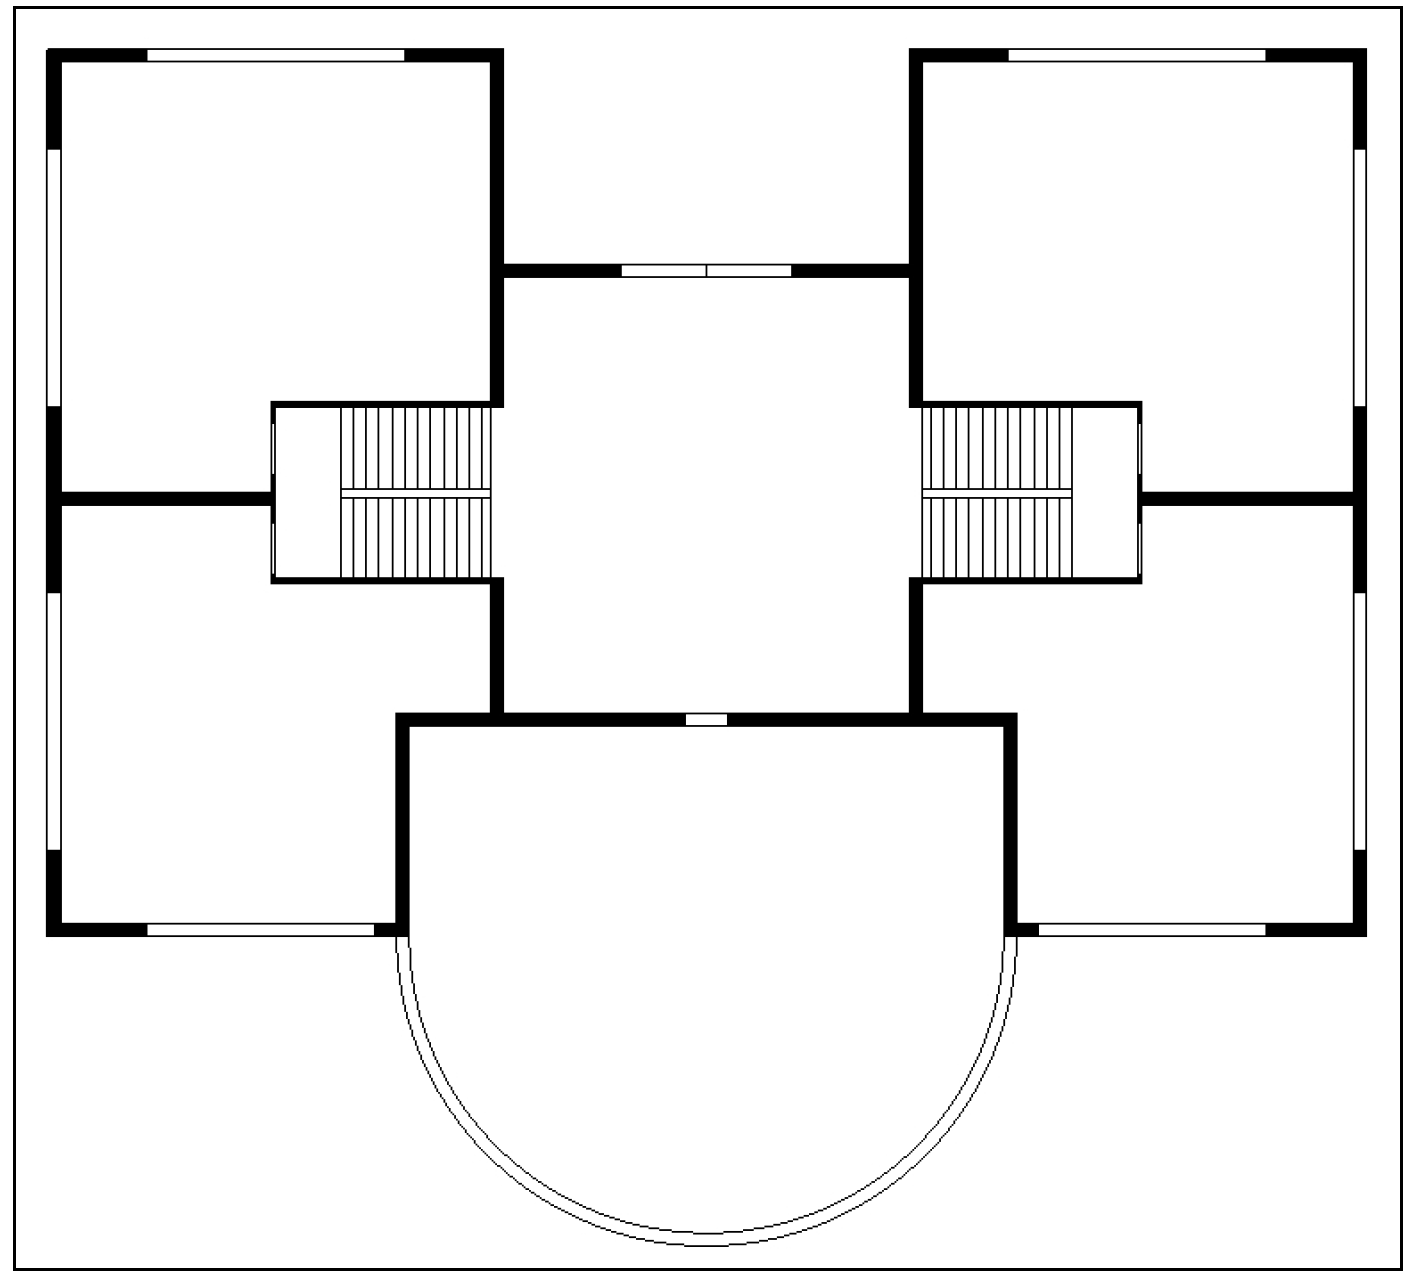
The building’s geometry is shown in
Figure 2.
Table 2 points out the materials used in this structure.
Figure 2.
The building’s planimetry.
Figure 2.
The building’s planimetry.
Table 2.
The building’s material characteristics.
Table 2.
The building’s material characteristics.
| Materials | Thermal Conductivity (W/m K) | Specific Heat Capacity (kJ/kg K) | Mass Density (kg/m3) |
|---|
| Plasterboard | 0.70 | 1 | 1,400 |
| Concrete | 0.33 | 1 | 1,200 |
| Reinforced concrete | 1.91 | 1 | 2,400 |
| Brick | 0.24 | 1 | 600 |
| Mortar | 1.40 | 0.67 | 2,000 |
| Perforated brick | 0.40 | 1 | 800 |
| Full brick | 0.72 | 1 | 1,800 |
| Polystyrene | 0.05 | 1.22 | 15 |
| Tile | 1.47 | 0.71 | 1,700 |
| Bitumen | 0.17 | 1 | 1,200 |
| Gravel | 1.20 | 1 | 1,700 |
| Windows | Characteristics | Transmittance (W/m2K) | g-value |
| Frame | | 2.27 | - |
| Single | Single glazing 4mm | 5.68 | 0.855 |
2.2. Modeling via TRNSYS
To provide the buildings thermal analysis, the dynamic software TRNSYS has been employed. It is based on an advanced calculation code, which applies the transfer function relationships of Mitalas [
17].
In several studies, it has been demonstrated that through this program, it is possible to properly reproduce the building geometry and the external environmental conditions: the building model is created by means of the TRNSYS Build, and the external environmental conditions are applied by using the TRNSYS Studio [
18].
TRNSYS is able to provide the annual energy demands for each hour during the day. First of all, TRNSYS is based on a complex and complete weather data sheet containing the hourly variation of temperature, solar radiation, wind velocity and relative humidity. Consequently, the annual energy demand will be calculated as a sum of hourly load values. Moreover, material mass density and specific heat capacity are employed to underline the building thermal inertia. Finally, more detailed building structural models can be used as input, which can provide more insightful information.
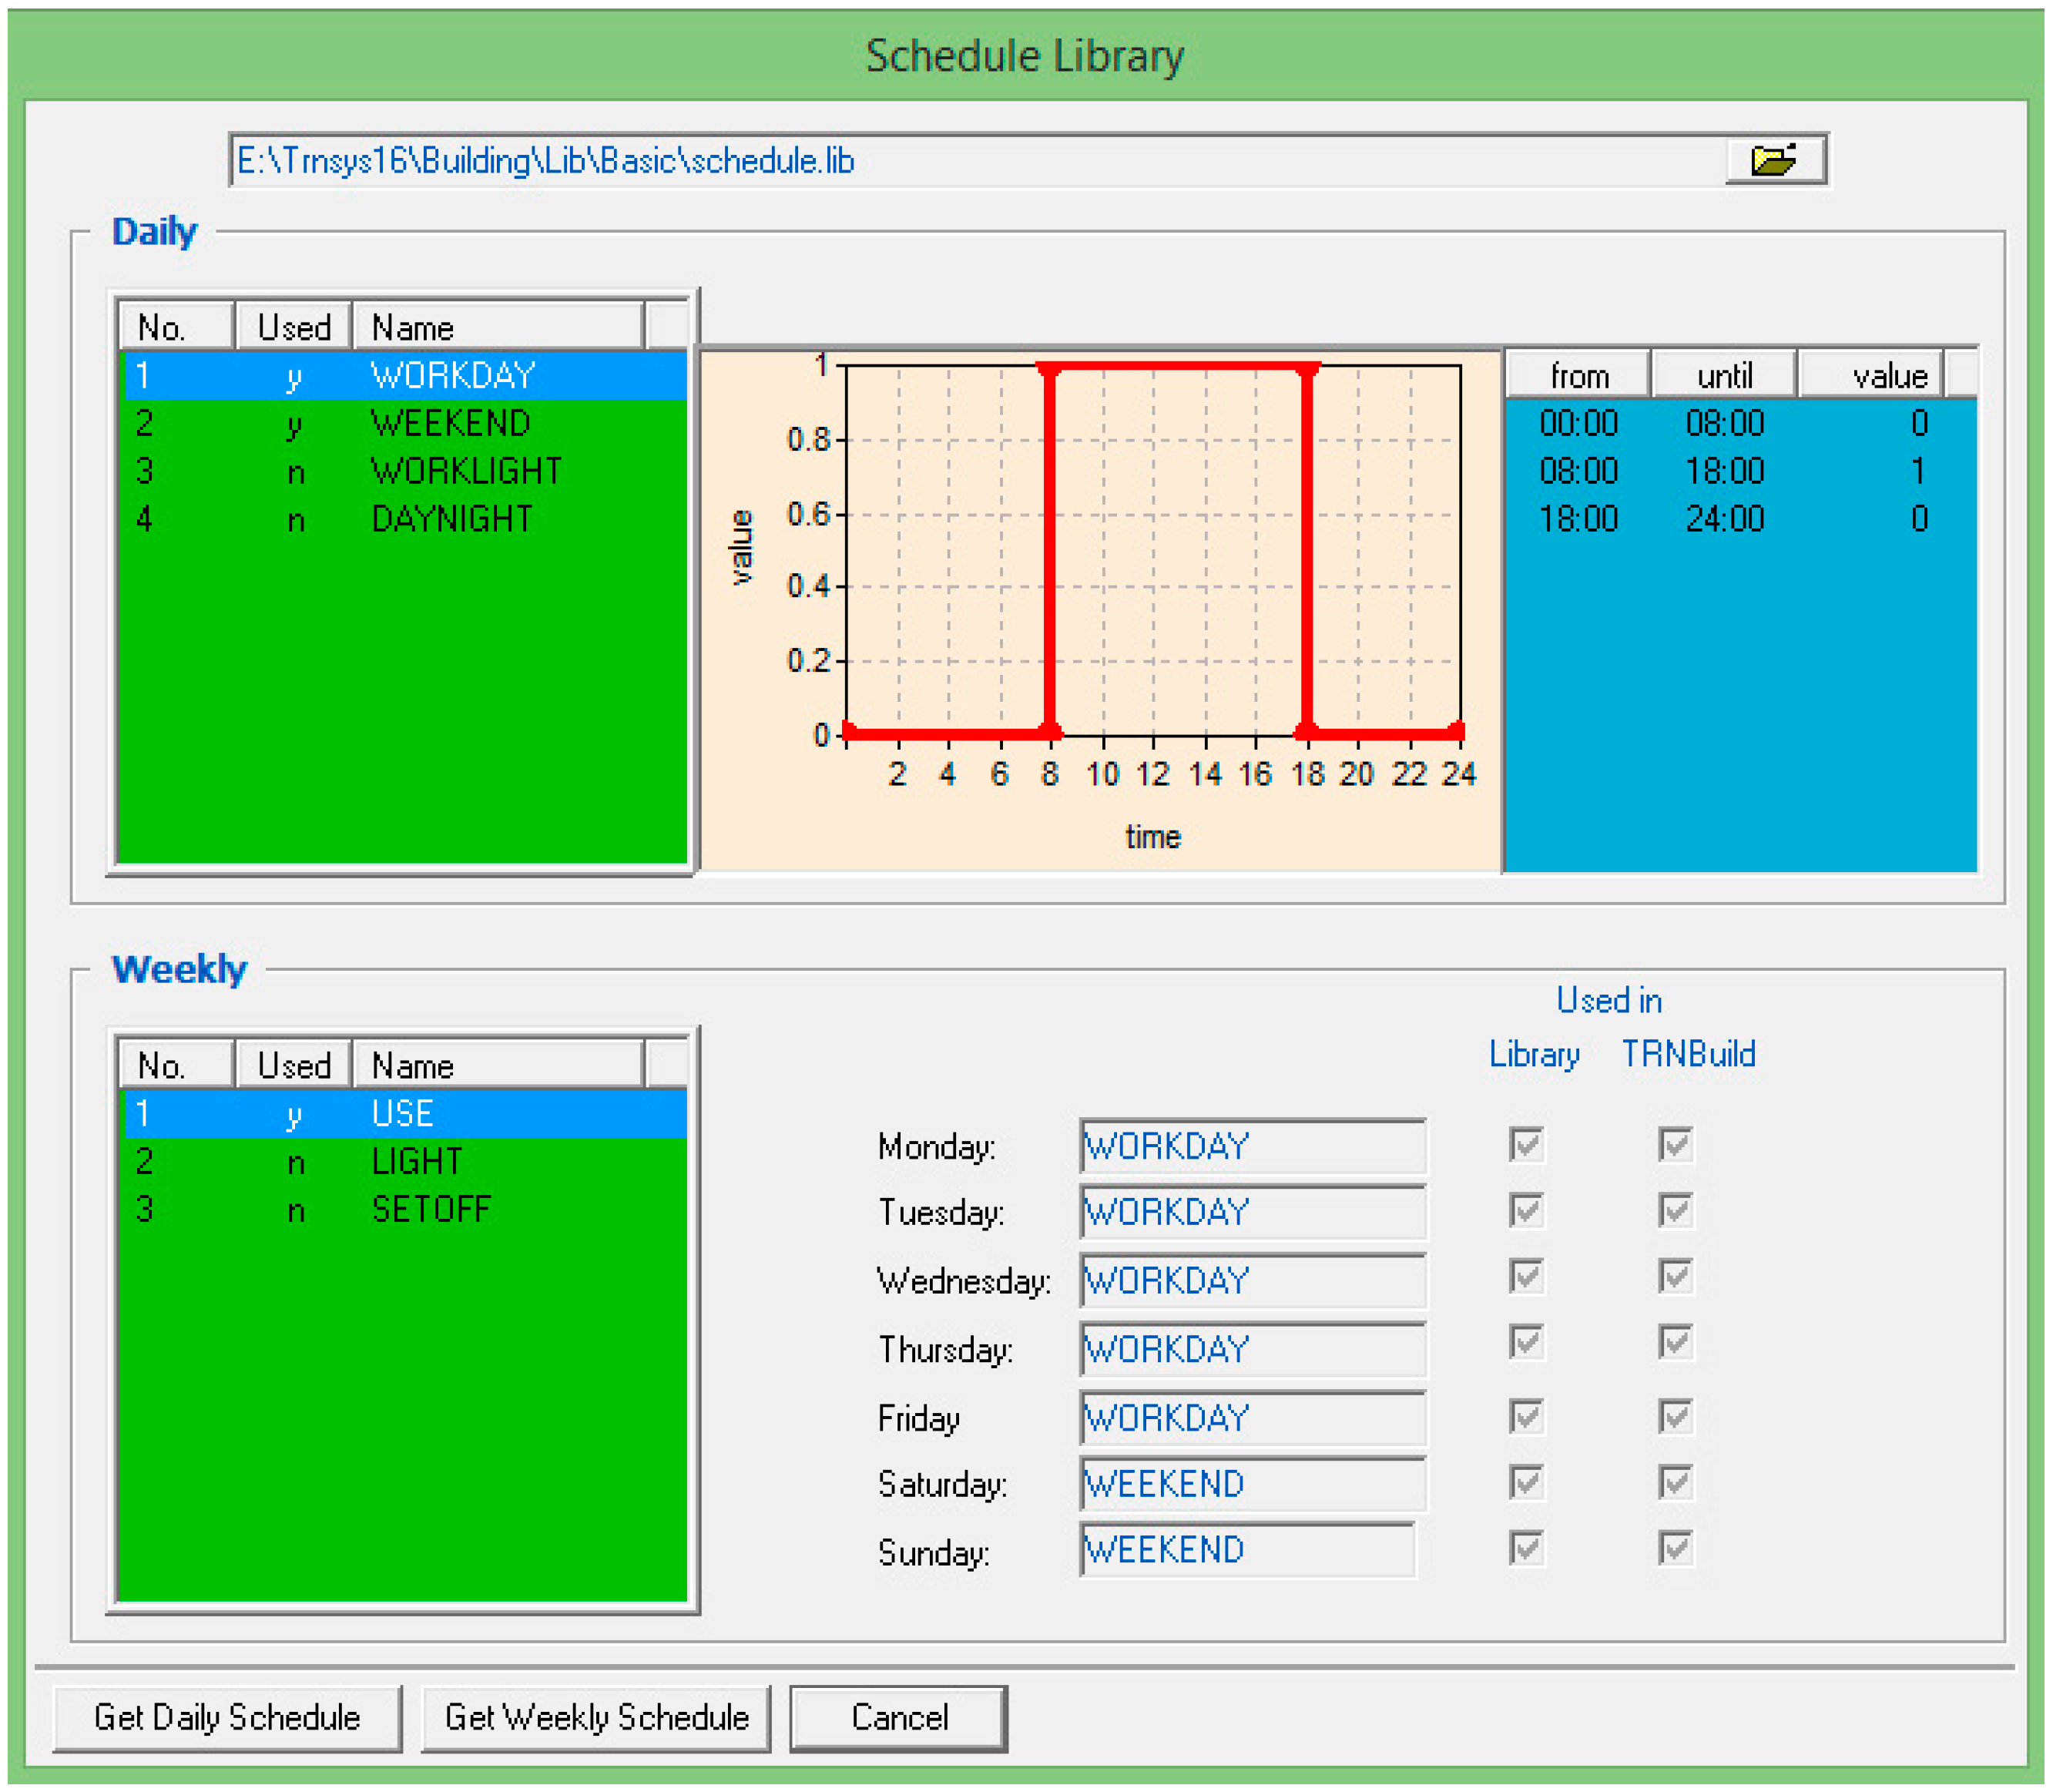
In order to analyze the building energy demands, an air conditioning system characterized by two different set-point temperatures was considered: the first one equal to 26 °C under summer conditions and the second one equal to 20 °C under winter conditions.
The building’s final employment is office use, where the workdays range from Monday to Friday. Through the TRNSYS Build, an on/off schedule for the plant operation was imposed: during the workdays, the plant is on for 10 hours, from 8:00 a.m. to 6:00 p.m., whereas on Saturday and Sunday, the plant is always off. The schedule adopted is shown in
Figure 3, and it is referred to as USE.
Buildings characterized by office use have an air change value equal to 5 volumes per hour.
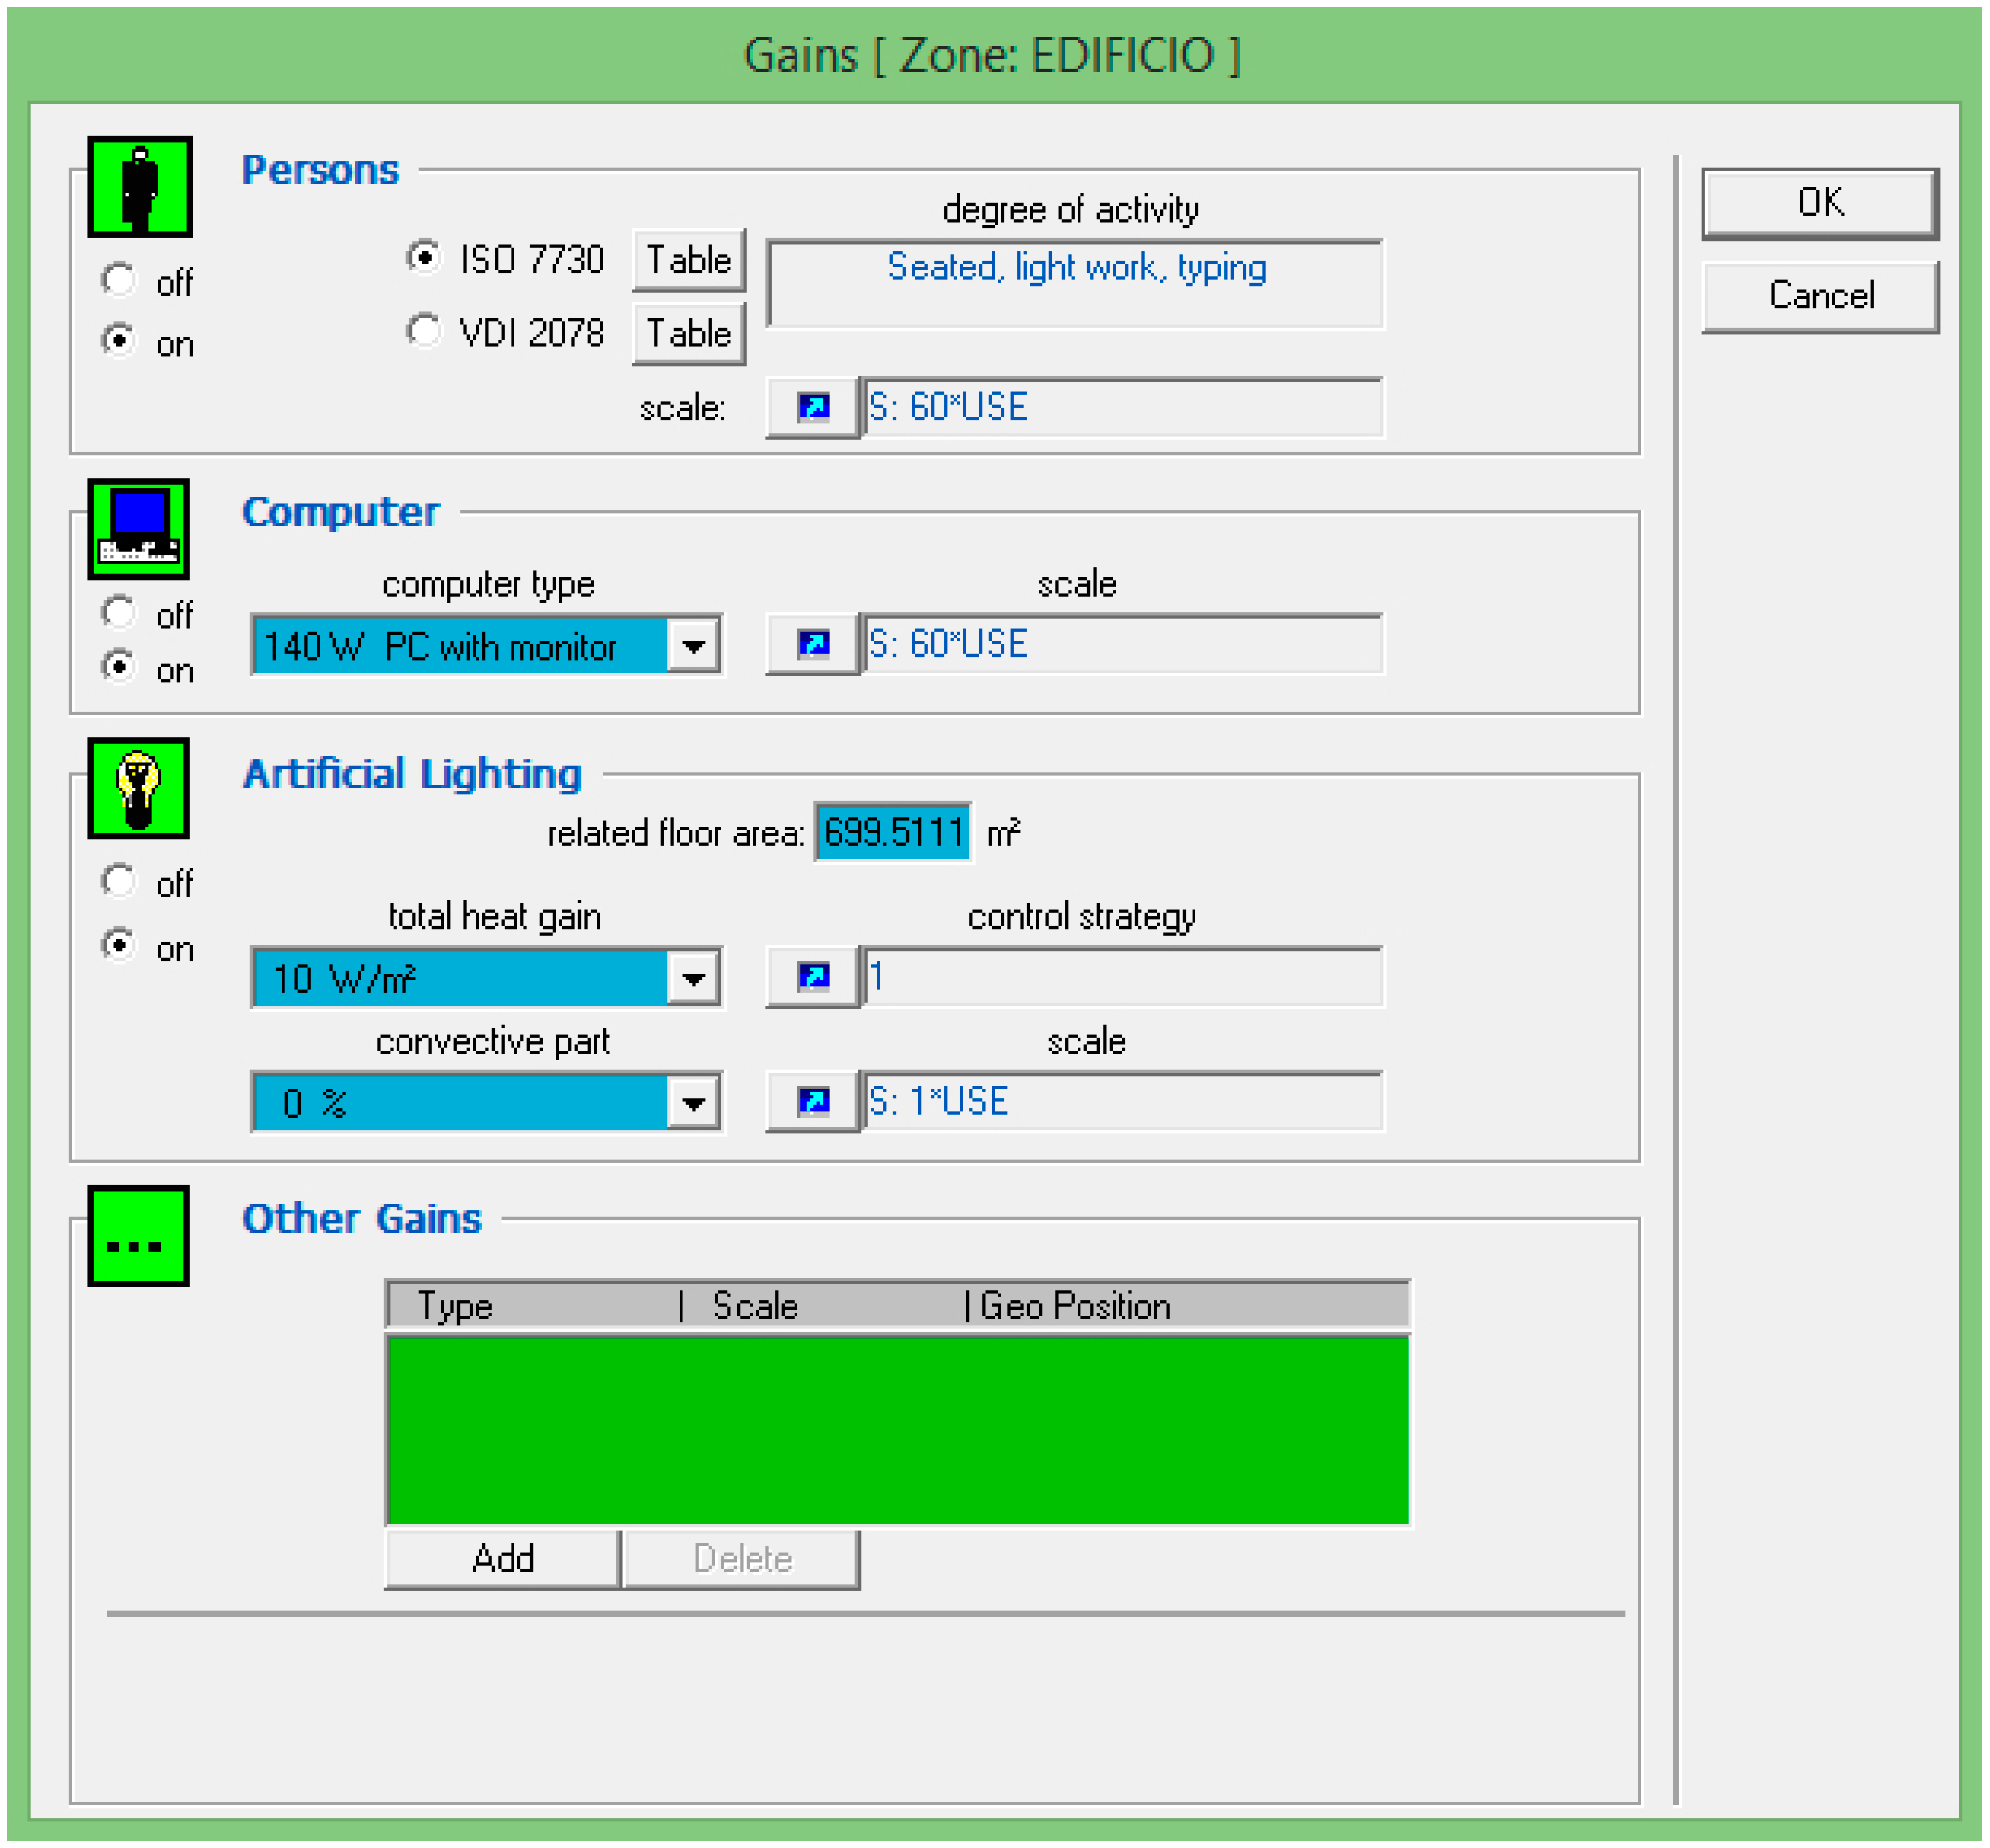
In order to assess the building energy performance, the internal gains due to the activity of 60 persons, the presence of 60 computers and the artificial lighting for the whole structure were considered. The internal gains set is shown in
Figure 4.
Figure 3.
Workday schedule.
Figure 3.
Workday schedule.
Figure 4.
Internal gains.
Figure 4.
Internal gains.
The heat gains related to the occupants refer to the ISO 7730 [
19], while the gains related to computers are equal to 140 W per PC. The scale factor is settled through the equation 60 × USE, where USE is the schedule function described above. For the artificial lighting, the heat gains are equal to 10 W/m
2, also scheduled by the USE function.
3. Results and Discussion
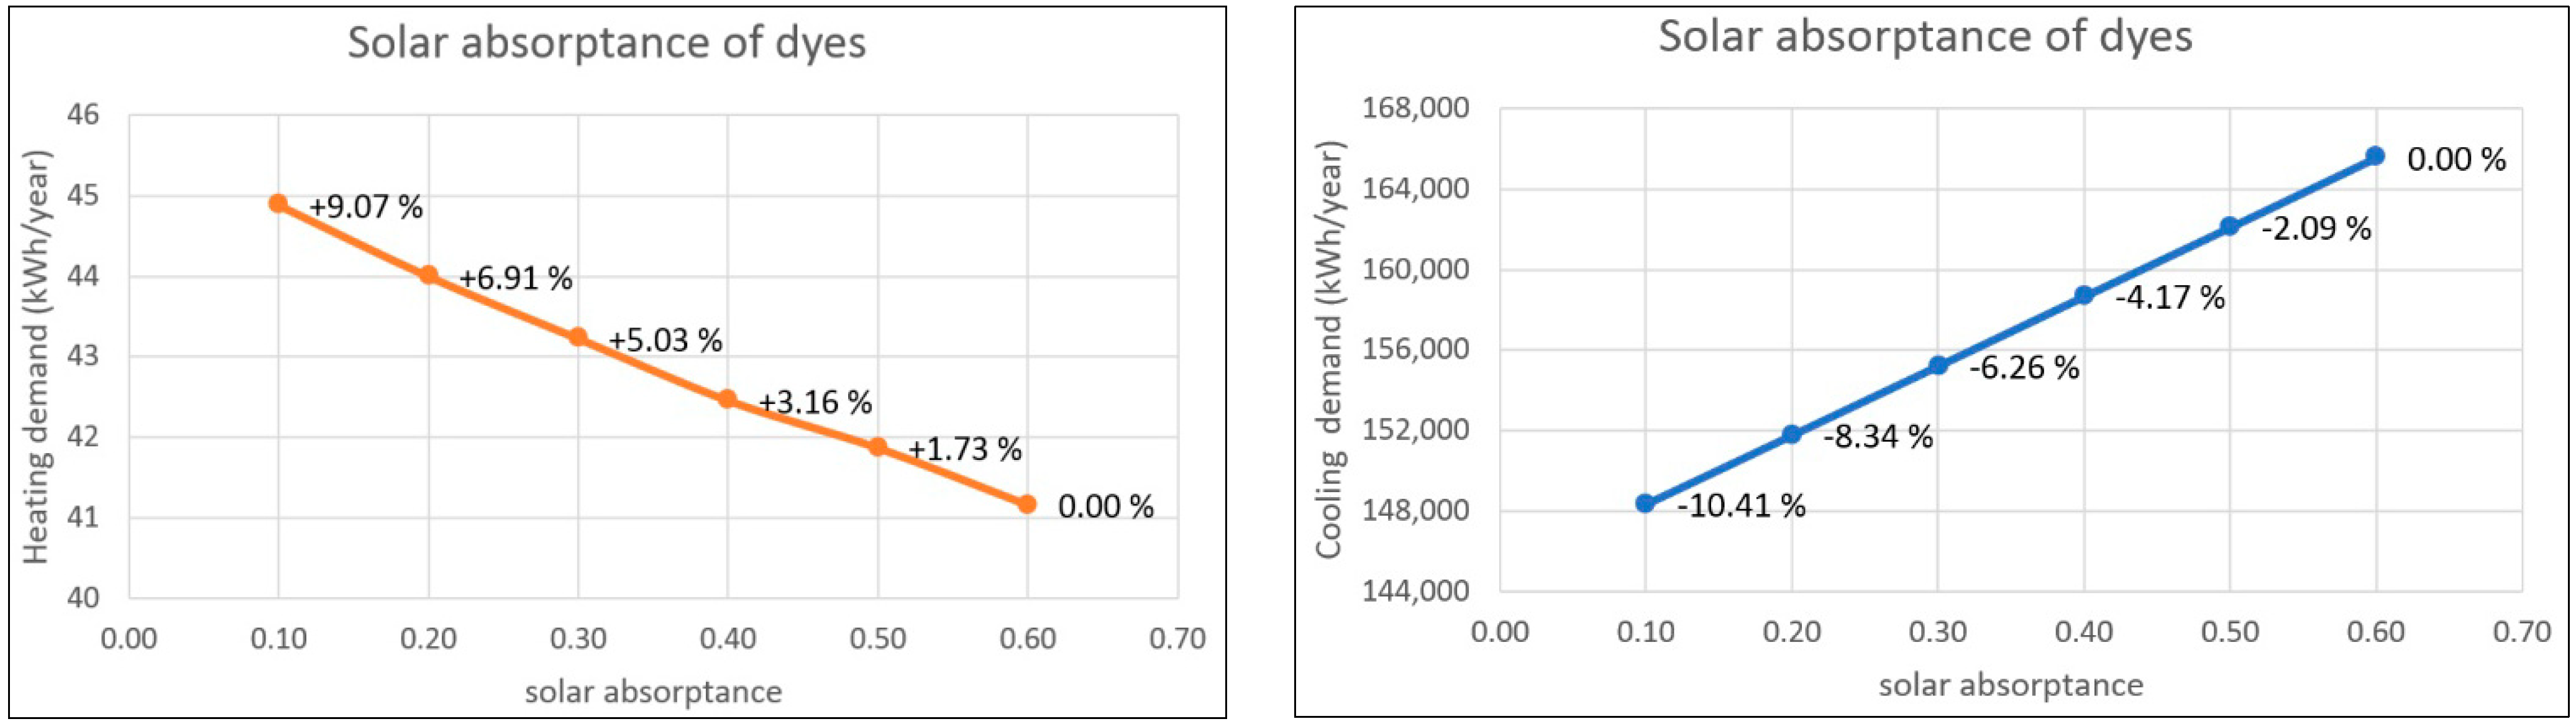
In this case study, the energy demand variations, both heating and cooling, depending on the dyes, windows and thermal transmittance of vertical and horizontal surfaces, were analyzed. Regarding the interventions on dyes, the variation of solar absorbance, from 0.6, which corresponds to a gray color, to 0.1, which corresponds to a white color, has been considered. The energy demand variations, both for heating and cooling, are shown in
Figure 5.
Figure 5.
Energy demand trend for solar absorbance variation.
Figure 5.
Energy demand trend for solar absorbance variation.
Considering the structural characteristics and the geographical position, the analyzed building is characterized by a low heating demand and a high cooling one. Starting from this, a color variation of the external surfaces, which leads to a solar absorbance coefficient decrease, causes a significant cooling demand reduction with a slight increase of the heating one.
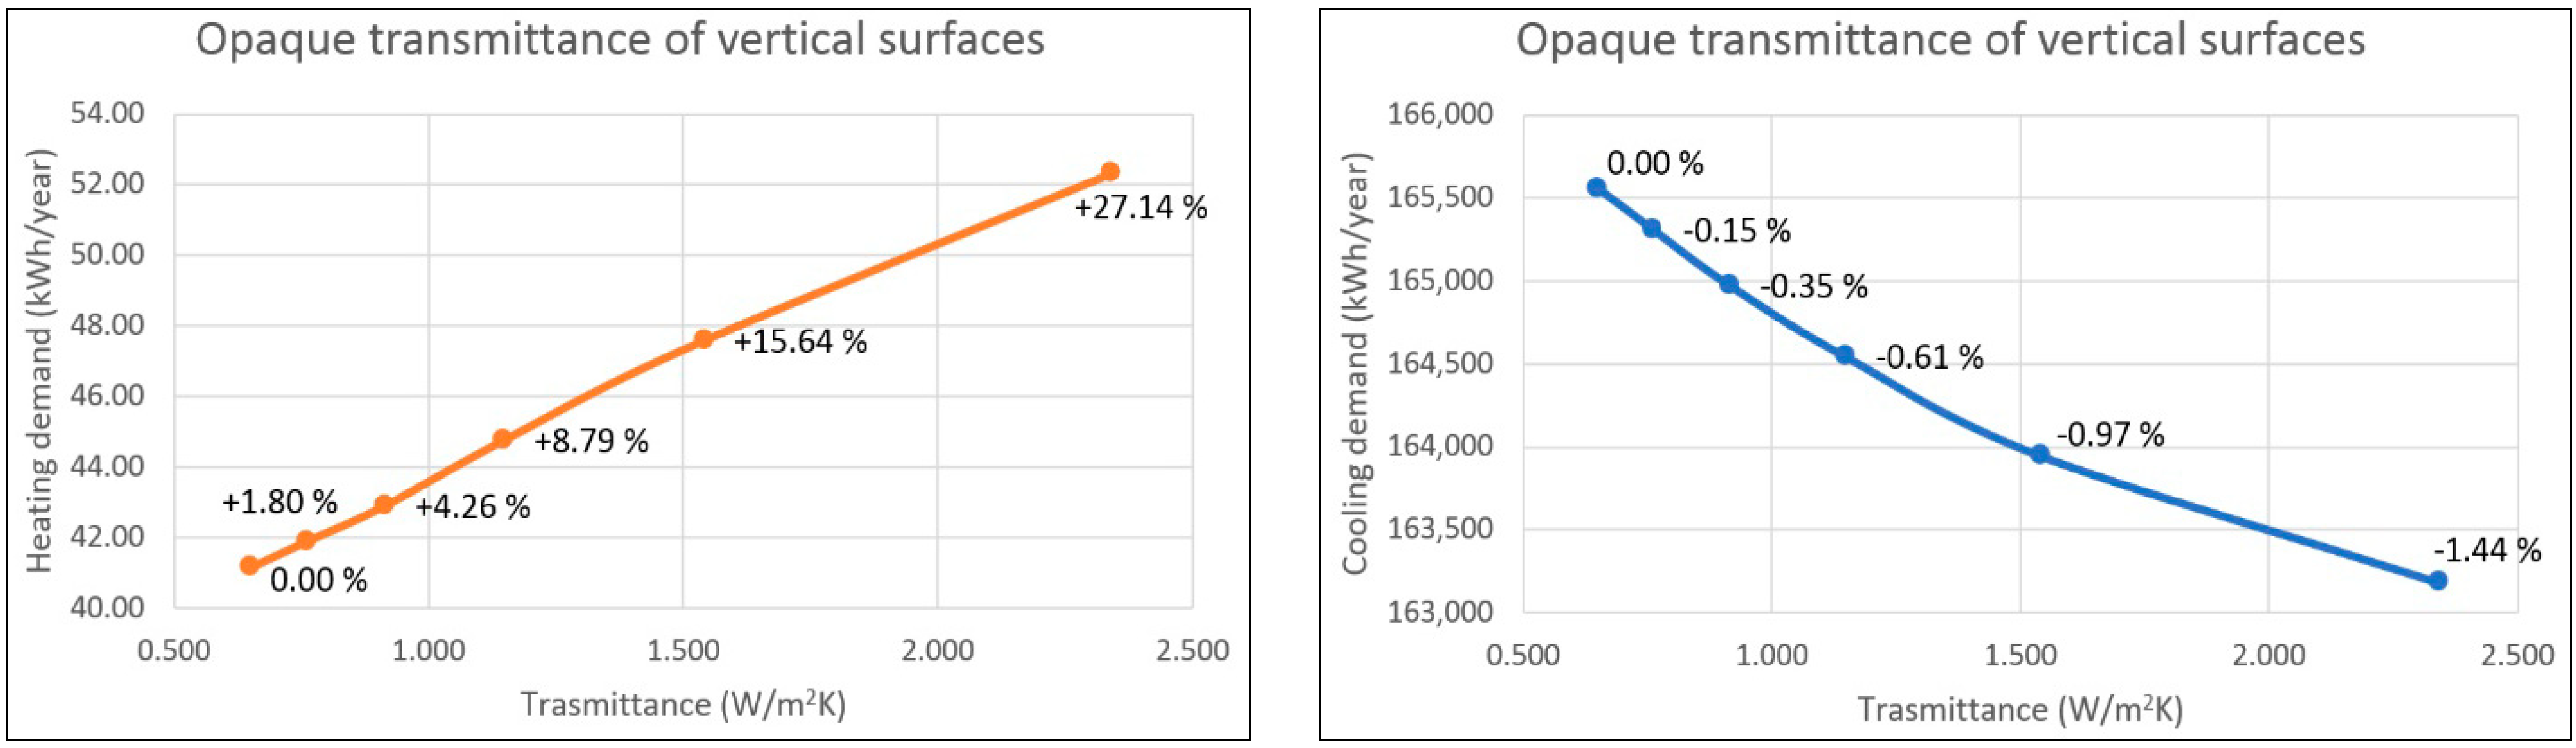
Regarding the interventions on the walls, the decrease of the insulating layer thickness produces the variation of the vertical opaque surfaces’ thermal transmittance, from 0.650 W/m
2K to 2.341 W/m
2K, and the subsequent energy demand variations, for both heating and cooling, are shown in
Figure 6.
Figure 6.
Energy demands trend for the vertical opaque surface’s transmittance.
Figure 6.
Energy demands trend for the vertical opaque surface’s transmittance.
As shown in
Figure 6, both the vertical surface thermal transmittance and the heating demand increase. On the contrary, the cooling demand decreases when the thermal transmittance grows.
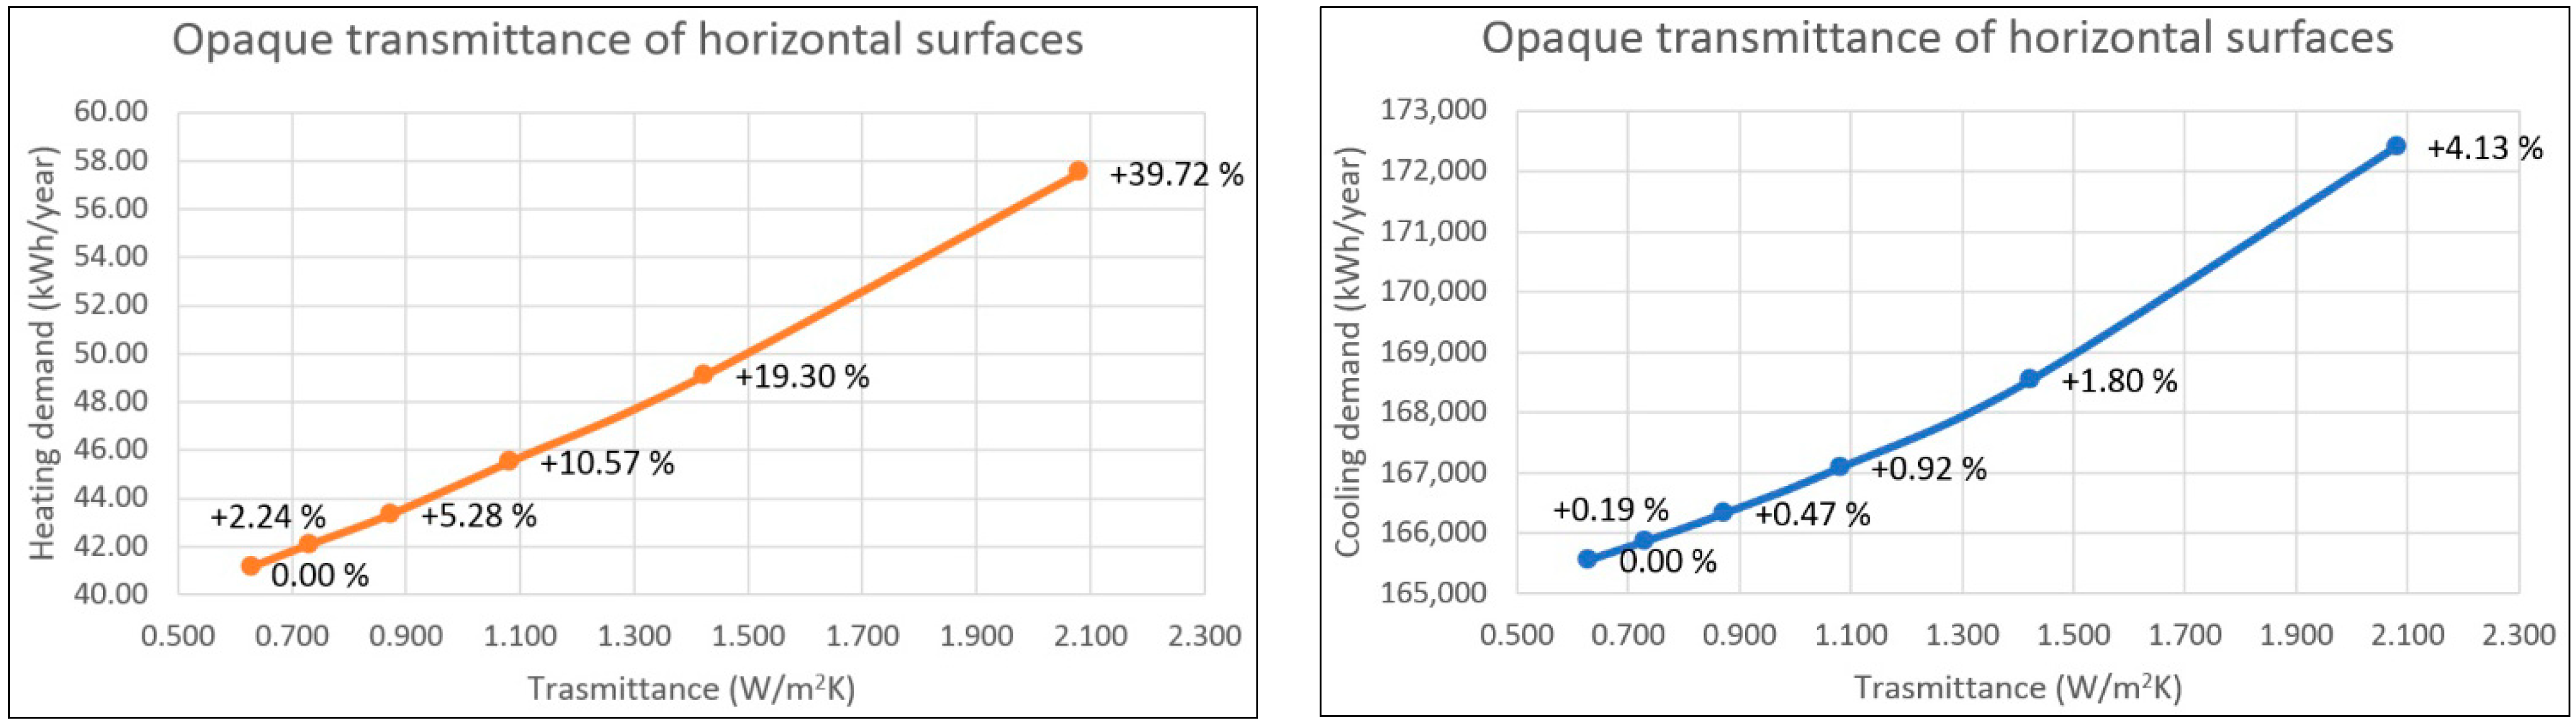
Regarding the interventions on the roof, the decrease of the insulating layer thickness produces the variation of the horizontal opaque surface’s transmittance, from 0.628 W/m
2K to 2.080 W/m
2K, and the energy demand variations, both for heating and cooling, are shown in
Figure 7.
Figure 7.
Energy demands trend for the horizontal opaque surface’s transmittance.
Figure 7.
Energy demands trend for the horizontal opaque surface’s transmittance.
The cooling demand increases together with the transmittance value. This happens because the solar radiation values in Rio de Janeiro are high. Therefore, in the part of the World characterized by this latitude, insulated roofs are needed.
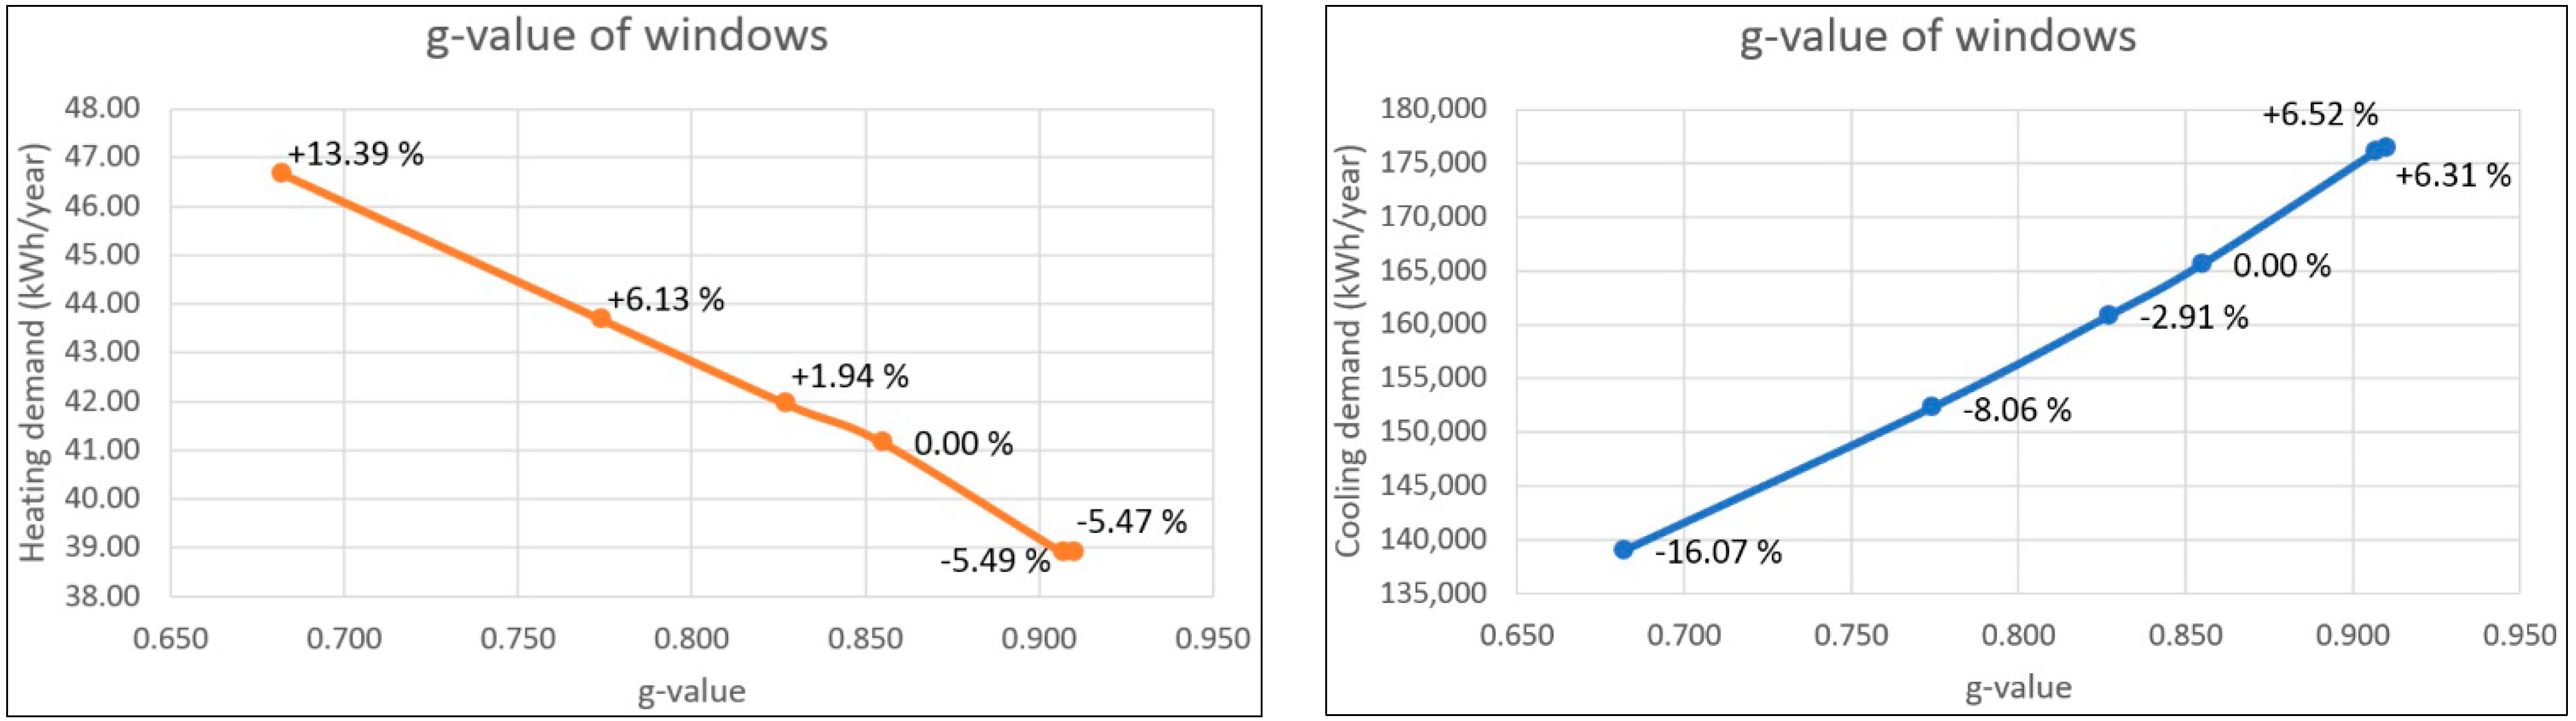
Regarding the interventions on transparent surfaces, different types of windows characterized by very similar values of thermal transmittance and strongly different
g-values (
Table 3) were considered. High thermal transmittance values and low
g-values are important for limiting cooling energy demands. Thus, the interventions on windows can be represented by the
g-value variation.
Table 3.
Types of windows.
Table 3.
Types of windows.
| Window | Transmittance (W/m2K) | g-value |
|---|
| Single (standard configuration) | 5.68 | 0.855 |
| Float 5 mm | 5.61 | 0.827 |
| Float 10 mm | 5.46 | 0.774 |
| Float 19 mm | 5.16 | 0.682 |
| Optiwhite 4 mm | 5.68 | 0.910 |
| Optiwhite 5 mm | 5.64 | 0.907 |
Figure 8 shows the energy demand variations, both for heating and cooling.
Figure 8.
Energy demand trend for the vertical opaque surface’s transmittance.
Figure 8.
Energy demand trend for the vertical opaque surface’s transmittance.
In this case, the rise of the g-value involves a considerable cooling demand increase due to the effect of the typical Rio de Janeiro solar radiation value.
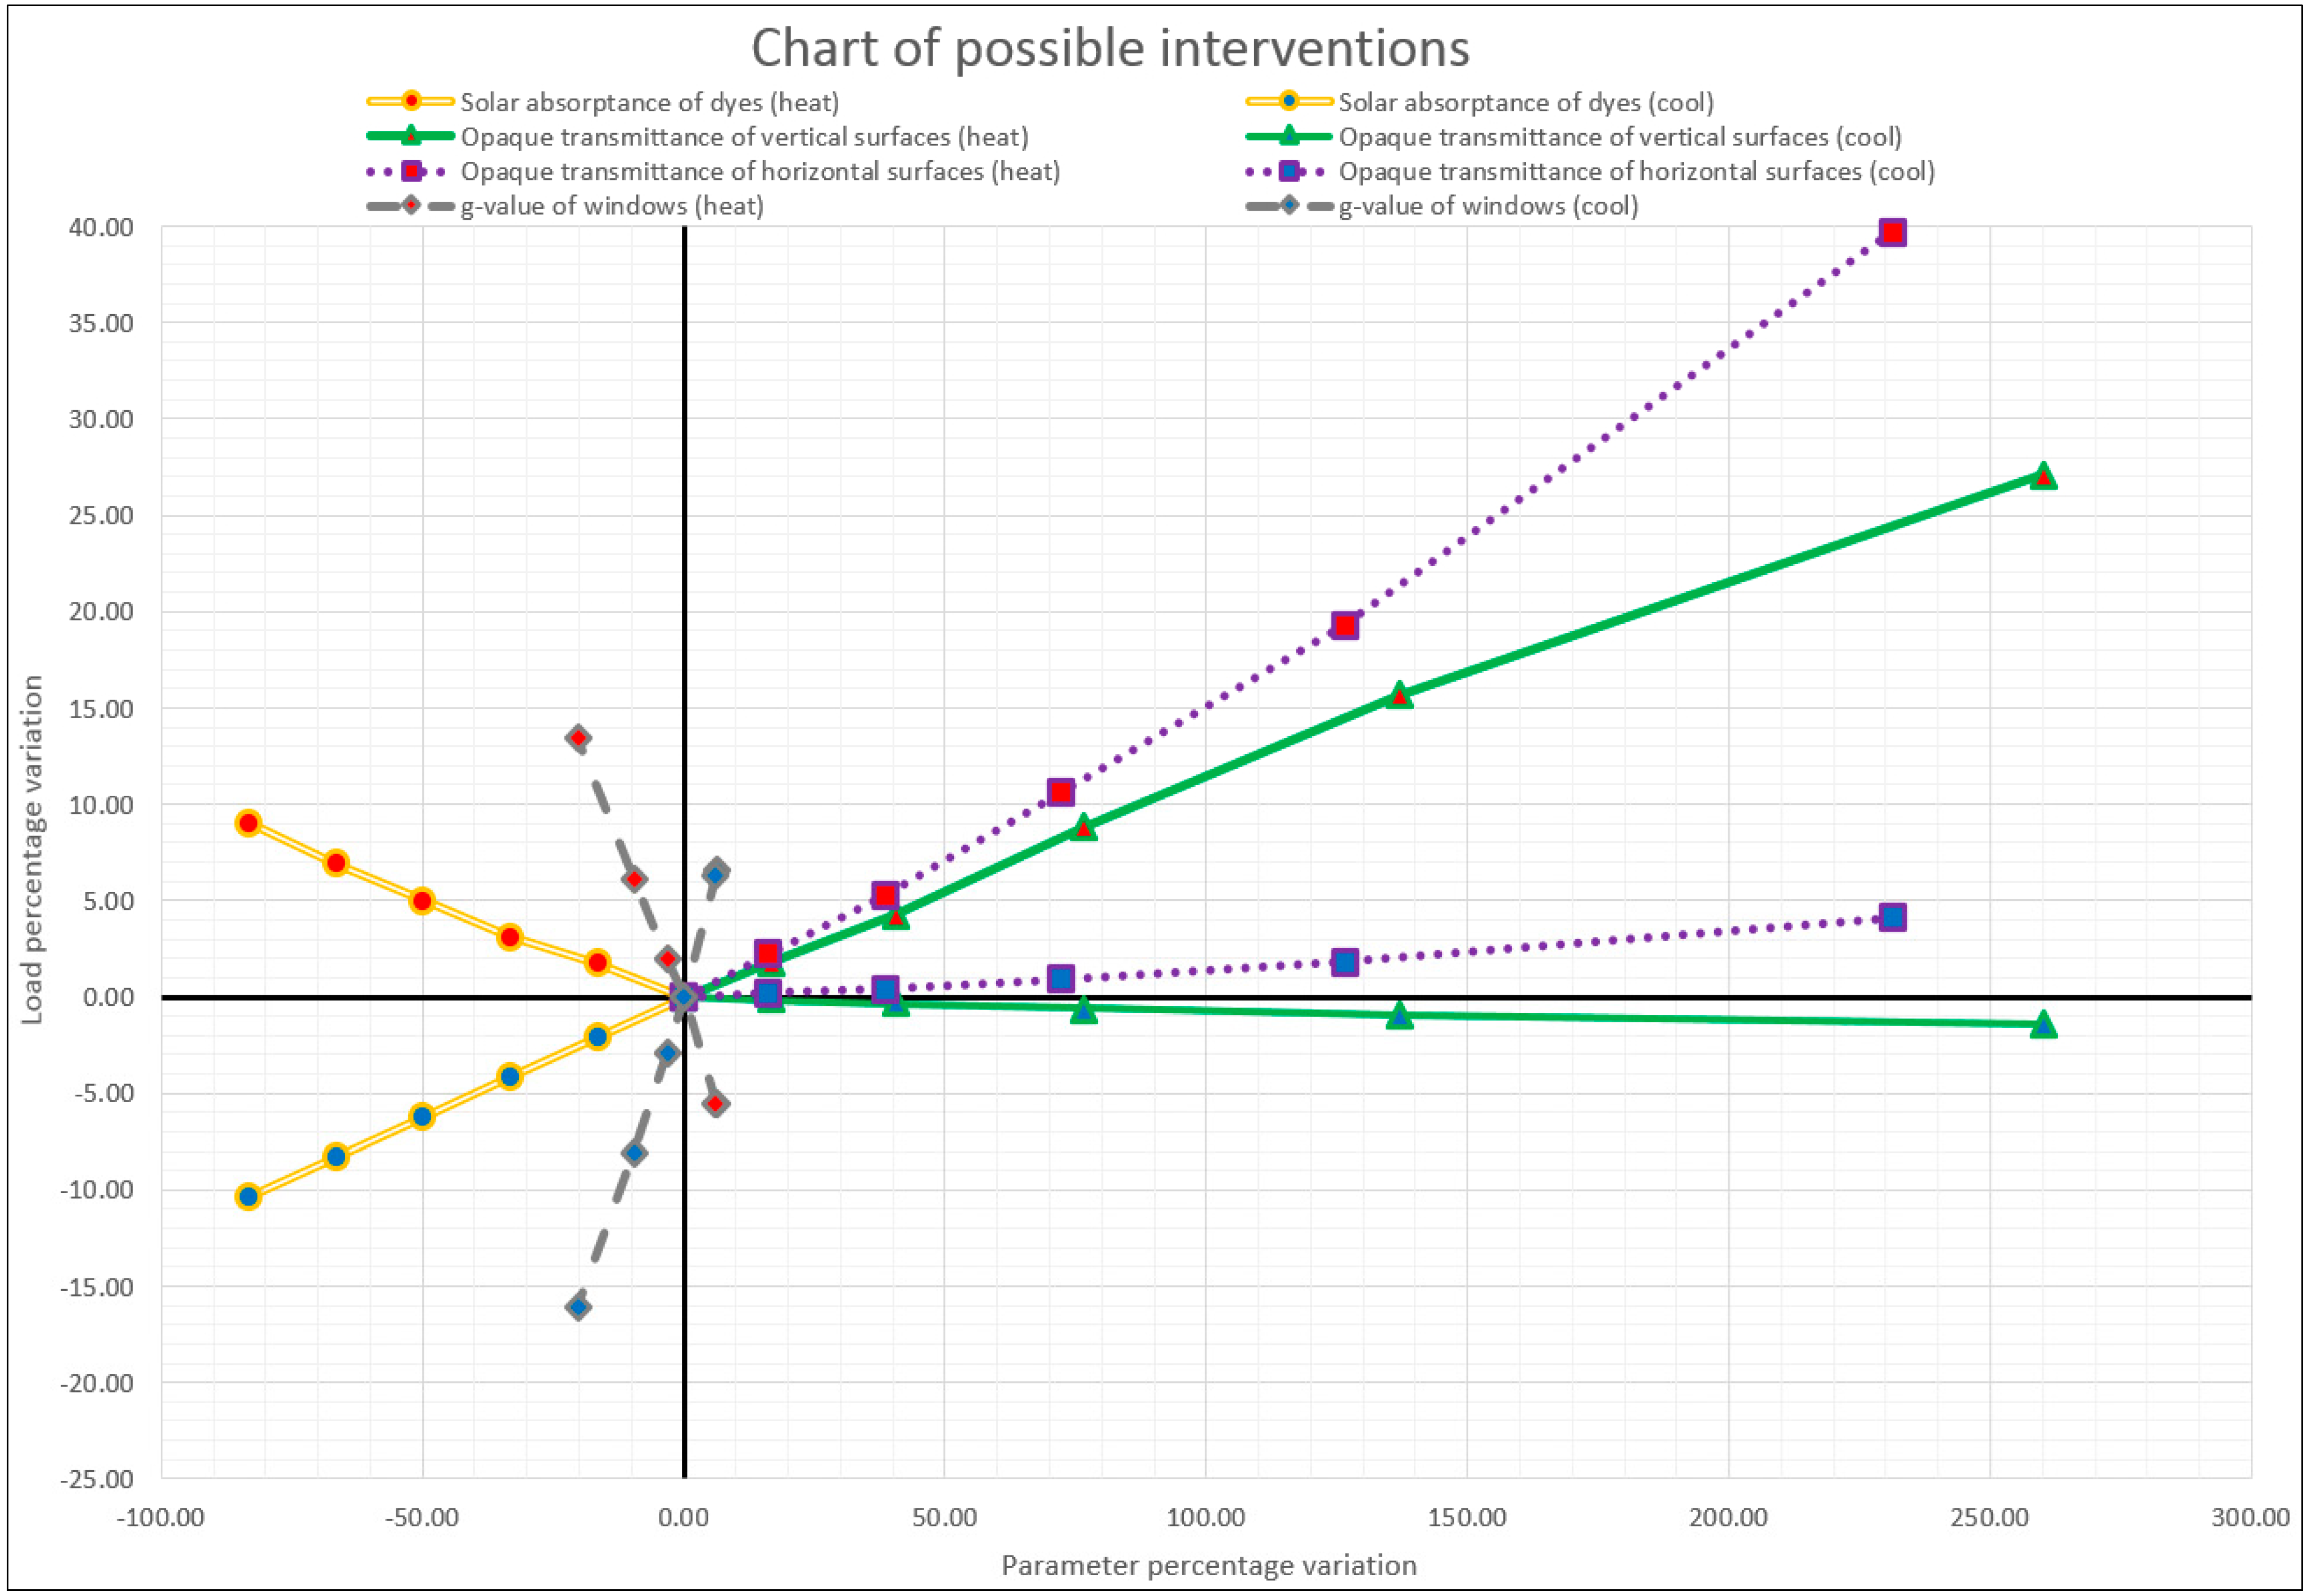
Figure 9 shows a graph that explains all of the intervention effects (separately analyzed). In the graph, both the ordinate and abscissa axis are expressed as percentage values. The graph shows, on the ordinate axis, the energy demand variation (heating and cooling) and, on the horizontal axis, the variation of the parameters related to each intervention. The percentage variations allow, at the same time, one to represent in a single graph all of the possible interventions and to compare their effectiveness.
Figure 9.
Chart of the intervention effect on energy demand, both for heating and cooling.
Figure 9.
Chart of the intervention effect on energy demand, both for heating and cooling.
The point characterized by 0%, for both energy demand and parameter variations, corresponds to the “standard configuration model” of the building. Through this graph, it is possible to immediately assess which intervention has an important energy savings effect.
- ▪
A variation of the dyes’ solar absorbance coefficient approximately equal to 84% can lead to an energy demand variation equal to ±10%;
- ▪
A variation of the g-value equal to 20% can bring an energy demand variation equal to ±15%;
- ▪
A variation of the vertical wall thermal transmittance approximately equal to 260% can result in a heating energy demand variation equal to +27% and a cooling one equal to −1.5%;
- ▪
A variation of the horizontal surfaces thermal transmittance approximately equal to 230% can result in a heating energy demand variation equal to +40% and a cooling one equal to +4%.
These values allow one to understand how a small variation of the dyes and window parameters have a high effect on the building’s energy performance. As
Figure 9 points out, a thermal transmittance variation of opaque vertical surfaces equal to 260% causes a cooling demand reduction of about 1.5%. The same effect can be reached with a decrease in the value of the solar absorbance or
g-value of about 20% and 5%, respectively.
A parameter variation causes an increase of the heating demand and a decrease of the cooling demand (or vice versa), but this phenomenon is not connected to the horizontal surfaces. Indeed, both heating and cooling energy demands increase with the rise of the transmittance value, because the analyzed area is characterized by a high value of solar radiation.
The graph shown in
Figure 9 makes clear which kind of interventions are reliable and efficient without inducing technicians to make possible design mistakes. Furthermore, this chart allows one to organize a plan of energy savings, defining a priority order for each intervention.
Considering the climatic area of Rio de Janeiro, the aim of the energy savings is essentially related to the decrease of the cooling demand.
Employing the information given by the chart shown in
Figure 9, all of the interventions related to vertical surfaces, dyes and windows and able to reduce the cooling demand value were applied to the analyzed building (the horizontal surfaces’ thermal transmittance increase was not considered, because, in
Figure 9, the purple curves are in the upper right region, which corresponds to an energy demand rise).
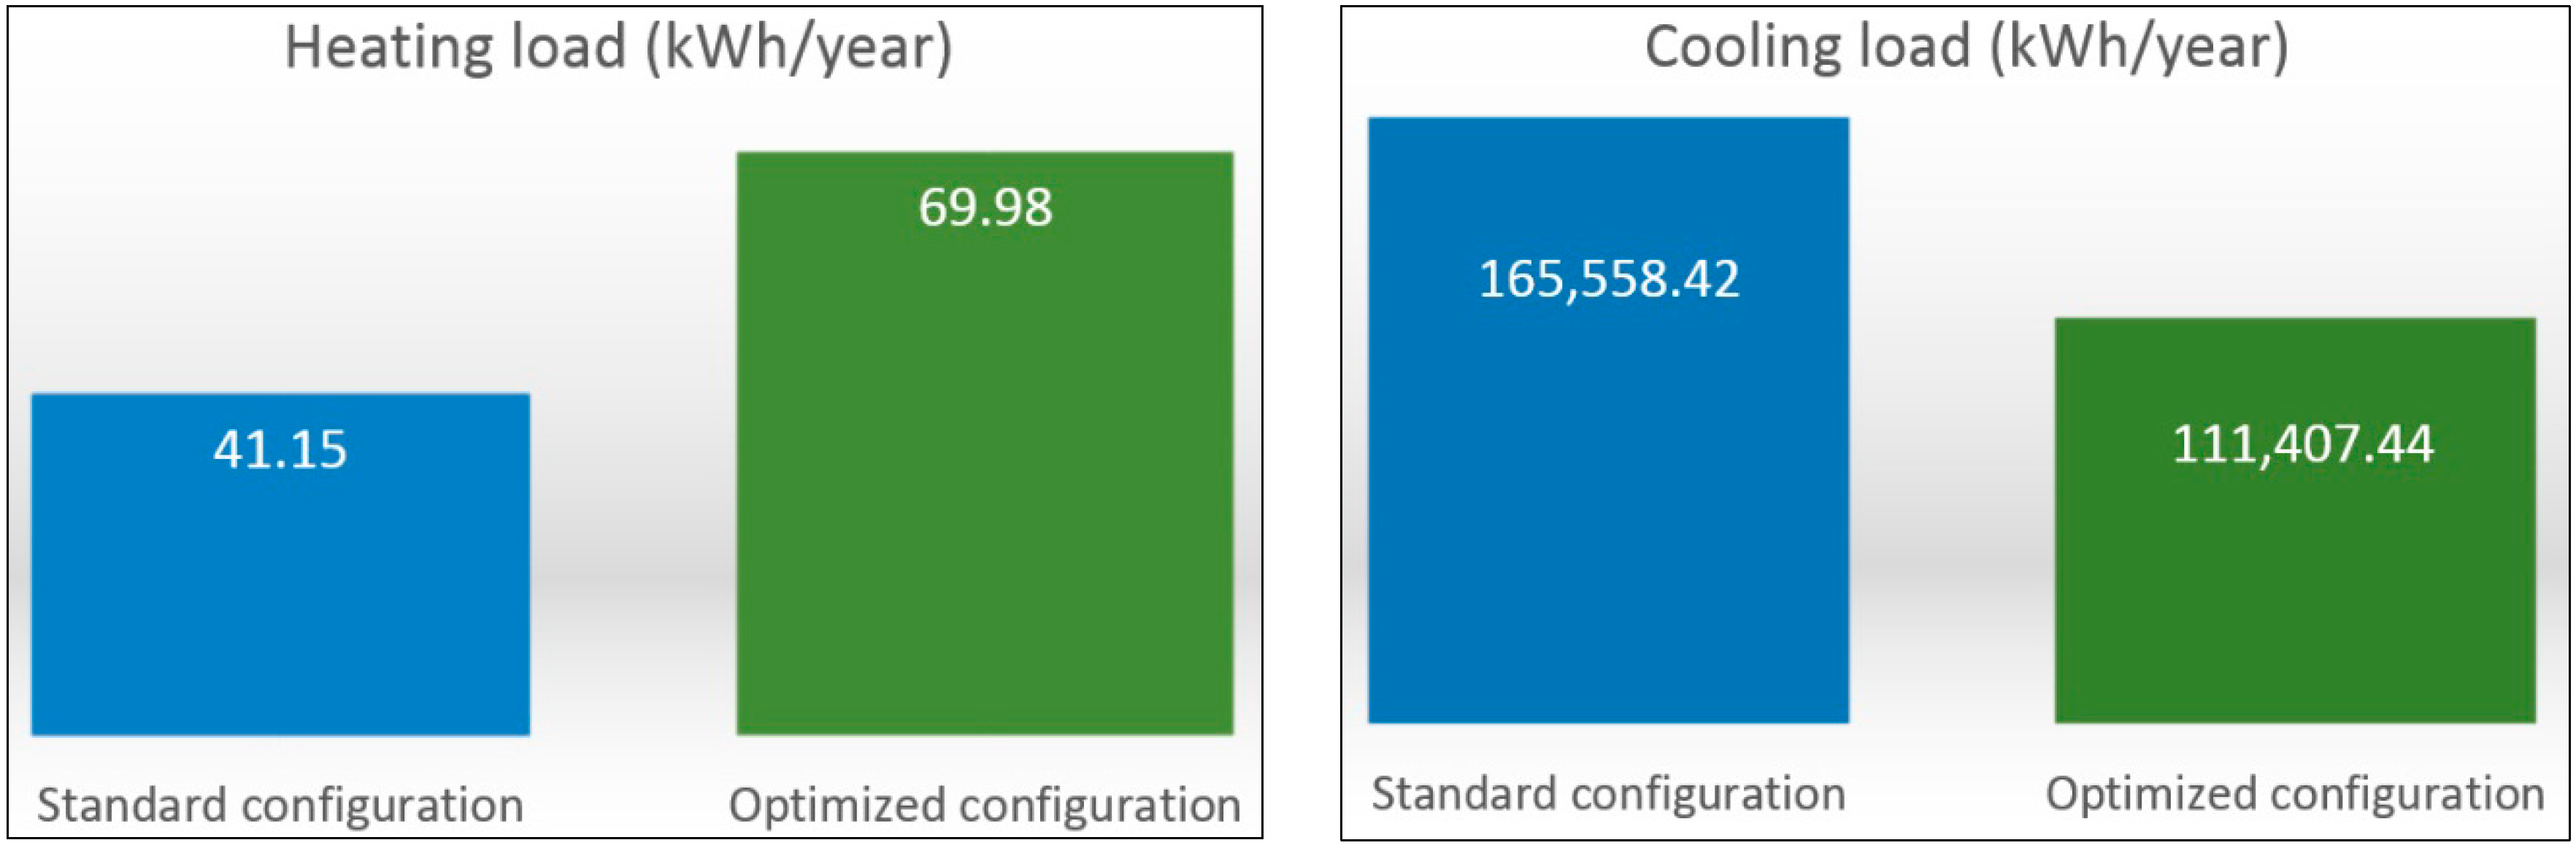
Figure 10 shows the annual energy demands of the starting configuration model and of the optimized one (considering the maximum possible energy savings measures).
Figure 10.
Comparison between the standard configuration and the most efficient configuration.
Figure 10.
Comparison between the standard configuration and the most efficient configuration.
The optimized configuration allows one to reduce the cooling demand by about −32.7%, but, on the other hand, it determines an increase of about +70% for the heating demand.
4. Conclusions
The aim of this study is to define the first step of an interesting approach for the assessment of building energy savings. Considering a single building located in Rio de Janeiro, the annual energy demands were calculated through a dynamic software and different energy efficiency interventions were simulated. Following, a graph was created to summarize the energy demand percentage variations as a function of the selected parameter variation, such as solar absorbance coefficient, vertical and horizontal surface thermal transmittance and window
g-value.
Figure 9 shows the specific influence of these parameters on annual energy demands. The employment of this graph is useful to immediately identify better solutions, without inducing technicians to make possible design mistakes. Indeed, for this particular case study,
Figure 9 allows one to exclude the interventions on the horizontal surface thermal transmittance.
It is worth noticing that this chart, designed for different geometrical configurations and boundary conditions, will lead to different graphical representations. Future developments of this study will consist of designing new charts by considering additional geometrical information, such as the surface/volume ratio, the window-wall ratio and other geographical areas (latitude, longitude and meters above sea level).
The final goal of this research is to accurately assess the relationship between “climate building interventions” and to identify the most effective intervention to choose, depending on the available economic budget.

 ,
, 


