Article

Taiwan’s Ecological Footprint (1994–2011)

1
Chung-Hua Institution for Economic Research, No. 75 Chang-Hsing Street, Taipei 10672, Taiwan
2
Department of Bio-Industry Communication and Development, National Taiwan University, No. 1, Sec. 4, Roosevelt Road, Taipei 10617, Taiwan
*
Author to whom correspondence should be addressed.
Sustainability 2014, 6(9), 6170-6187; https://doi.org/10.3390/su6096170
Submission received: 10 July 2014 / Revised: 11 August 2014 / Accepted: 1 September 2014 / Published: 10 September 2014
(This article belongs to the Special Issue Sustainable Land Use and Ecosystem Management)

Abstract

:
According to the 2011 edition of the National Footprint Accounts (NFA) published by the Global Footprint Network (GFN), humankind consumed the resources and services of 1.5 planets in 2008; the corresponding number in 1961 was 0.7 planets. North Americans have an ecological footprint of 8.7 global hectares per person whereas Africans have a footprint of only 1.4 global hectares per person. The global mean biological capacity is only 1.8 global hectares per person so human beings are overshooting ecological resources. The ecological footprint measures the resources that are consumed by humans from the biosphere, and serves as an index of the sustainability of development. The NFA includes the ecological footprints of over 200 countries and regions, but not Taiwan. Hence, Taiwan must establish and update its own ecological footprint databases. Ecological footprint is one indicator of the sustainability of development, and can be compared across nations. This study extends previous studies by analyzing Taiwan’s ecological footprint from 2008–2011. With reference to the ecological footprint accounts of the Global Footprint Network and the Taiwan’s ecological footprint analysis for 1997–2007, this study presents Taiwan’s ecological footprint from 2008–2011. Most of the data that are used herein are taken from the Food and Agriculture Organization, the International Energy Agency, Taiwan’s Council of Agriculture and Taiwan’s National Development Council. The results thus obtained reveal that Taiwan’s ecological footprint from 2008–2011 exceeded that from 1997–2007. To respond to this trend toward un-sustainable development and to help Taiwan move toward sustainability, carbon reduction and energy saving policies should be implemented to effectively manage Taiwan’s ecological resources.

1. Introduction

Human activities continuously change land coverage and the atmosphere; they directly and indirectly influence the global energy balance, and cause climate change [1]. Humans are slowly coming to understand that the issue of climate change must be considered with an eye to establishing a consensus around sustainable development. This awareness arises mainly from disasters that are caused by extreme climate events worldwide. The issue forces people to reflect on the relationship between social development and the environment. The IPCC has also noted that island states are particularly vulnerable to global warming [2]. Bueno et al. [3] found that various investigations of the effect of climate change on small Caribbean islands emphasize the loss of tourism and damage to infrastructure, which will reduce the economies of these islands by 10%.
The 2011 edition of National Footprint Accounts (NFA), published by the Global Footprint Network (GFN) suggests that humankind consumed ecological resources and services that are equivalent to 1.5 planets in 2008; the corresponding value in 1960 was only 0.7 planets. While North Americans had an ecological footprint of 8.7 global hectares (gha) per person, Africans had a footprint of 1.4 gha per person. Given a global average biocapacity of only 1.8 gha per person, human beings are over-exploiting the ecological resources of the planet.
In the latest NFA of the GFN [4], the six major categories of footprint are cropland, grazing land, fishing grounds, forest land, carbon uptake land and built-up land. The size of an ecological footprint is positively related to environmental impact but negatively related to the area of available bioproductive land per person; a larger footprint corresponds to less bioproductive land per person. Table 1 presents global ecological footprint data before 2009 [5,6,7,8].
Table 1. Global ecological footprint.
1961196519701975198019851990199520002005200620072009
Ecological Footprint2.292.432.602.612.632.452.512.412.472.582.592.702.60
Biocapacity3.723.453.132.852.622.422.252.091.951.831.811.781.80
Ecological Deficit−1.43−1.02−0.53−0.240.010.030.260.320.520.750.780.920.80
Source: [5,6,7,8].
The global ecological footprint in 1961 represented only 62% of the total resources of the biosphere. In the 1980s, total human demand exceeded the biocapacity of the earth, meaning that the demand of some people exceeded an amount that, if demanded by everyone, the earth’s resources could satisfy. The global ecological footprint became about 1.5 times the earth’s biocapacity in 2007. Accordingly, the global ecological deficit has increased rapidly over recent years, suggesting that overexploitation by human beings has overloaded the environment. Humans must address this issue and act to improve the sustainability of urban and rural development.
Lee and Chen [9] examined Taiwan’s ecological footprint and attempted to calculate the ecological footprint in 1997. However, since they did not take into account the equivalence factor [8], the ecological footprint that they estimated was inaccurate. In 2005, to capture accurately Taiwan’s ecological footprint and its long-term variation, the Council of Agriculture (COA) began a series of scientific projects to determine the country’s ecological footprint from 1994–2003. Through data collection and measurement, an ecological footprint database for Taiwan was thus established. To increase accuracy, the 2005 study used the equivalence factors proposed by the GFN. The results thus obtained revealed an increase in the ecological footprint from 1994–2003 [10]. A follow-up study in 2006 included the contribution of CO2 emissions to the footprint [11]. Wang et al. [12] calculated Taiwan’s ecological footprint from 1994–2007 and found that it was 6.54 gha per person in 2007. The total ecological footprint of Taiwan was 42 times the area of Taiwan. An analysis of ecological footprints can yield insight into the seriousness of the problem of global warming, and the ecological footprint is a useful tool for measuring sustainability [11]. This study extends the important results of studies of Taiwan’s ecological footprint in 1994–2007 and updates the national ecological footprint accounts to enable the trend in the ecological footprint from 2008–2011 to be analyzed.

2. Ecological Footprint

The ecological footprint is a tool for elucidating the relationship among humans’ living habits, patterns of consumption and use of natural capital [13]. The ecological footprint measures the human demand for natural resources and ecosystem services, and the dependence of human life on those resources and services [14]. The ecological footprint is a powerful indicator of the sustainability of development, as it considers the dynamics that are associated with the pressure that is exerted on the environment by the use of (renewable and non-renewable) resources as inputs and various outputs (such as waste or CO2) [15]. The ecological footprint was modified to deal with assessing several applications such as the exergy based ecological footprint [16,17,18], water footprint [19], pig-biogas-fish system [20], fruit production systems [21], etc. Therefore, the ecological footprint can be utilized to measure the dependency of both consumers and producers on the global ecosystem [22]. Nations in which some of the demand for resources cannot be met by domestic biocapacity depend on nations with excess resources. Accordingly, a new world map can be drawn in which nations are sorted into ecological creditor and debtor countries [14,23]. Biocapacity can then be regarded as a new ecological asset [7]. Although some studies have expressed doubt concerning the effectiveness of the ecological footprint as an indicator of environmental effect or economic development, some have demonstrated that ecological footprint is scientifically objective measurement of sustainability which can be calculated in a manner that is consistent with prevailing scientific views, to ensure that it explicitly quantifies the human use of resources [15,24]. International monitoring of ecological footprints, initiated by the World Wildlife Fund (WWF), has become important in the measurement of sustainable development [25].

2.1. Ecological Footprint Accounting Methods

The ecological footprint measures the areas of bioproductive land and water that are required to sustain human life. This land and water provide for consumption and are used to treat waste. The calculation of biocapacity in particular areas enables the human demand made on these areas to be compared with their available natural capital. Academics and practitioners around the world are increasingly emphasizing ecological footprint accounting [12,22,24,26]. The ecological footprint is a particularly important reference index for governments that are setting national sustainable development policies [27,28].
Wackernagel and Rees [22] introduced the concept of the ecological footprint. These authors calculated the ecological footprint of Vancouver, Canada. Wackernagel et al. [29] later calculated the ecological footprint of all of Canada. These two studies utilized six land uses—ocean, forest, cropland, grazing land, built-up land and fossil energy land. COA [10] used these six major categories of land to evaluate the ecological footprint of Taiwan from 1994–2003. In 2008, the GFN modified the six categories, replacing the fossil energy land footprint with the carbon footprint. Wang et al. [12] used the GFN’s methods of calculating the ecological footprint to analyze Taiwan’s ecological footprint from 2004–2007. In 2013, the GFN published the 2011 version of the method for calculating the ecological footprint. The major difference between the 2011 version and the 2008 version was in the approach to calculating changes in ocean absorption (The GFN [30] suggested that the ocean absorbs one third of all emitted CO2; however, the latest information from the IGBP suggests that the ocean absorbs only a quarter of all emitted CO2 [31]). The present study uses the more recent method from the GFN [4] to calculate the ecological footprint from 2008–2011.

2.1.1. Food and Wood Footprint Accounting

The food production footprint concerns the primary production of a particular area, which includes crops, fruits, vegetables and feed for livestock on croplands and grazing lands; it also includes non-processed seafood that is caught on a continental shelf or inland. The wood production footprint is the area of land that is required to provide the required harvested round wood and fuel wood from naturally or artificially forested areas. The ecological footprint that is associated with such production is calculated as shown in Formula (1).
Ecological footprint (gha) = [production + import − export (tons)]/global bioproductivity (tons/ha) × equivalence factor (gha/ha)
There are some cases where multiple derived products are created simultaneously from the same primary product. For example, soybean oil and soybean cake are both extracted simultaneously from the same primary product, in this case soybean [32]. To avoid double counting, the ecological footprint of a primary product includes the ecological footprints of the products that are derived from it.

2.1.2. Built-Up Land Footprint Accounting

The ecological footprint assumes that human settlements and infrastructure occupy areas of high agricultural yield. Some settled areas are completely covered and others may still be bioproductive, such as those that include gardens or parks. The ecological footprint of such areas is assumed to be a function of earlier agricultural productivity and the total area of built-up land equals the replaced area of cropland.
The built-up land footprint is calculated from the area of the land that is covered by human infrastructure, which includes transportation, housing, industrial structures and reservoirs for hydroelectric power generation. In 2007, the area of all built-up land around the world was 169.59 million hectares [32]. The 2010 edition of the National Footprint Accounts assumes that built-up land occupies what would previously have been cropland. This assumption is based on the observation that human settlements are typically located in fertile areas with the potential for supporting high-yielding cropland [33], according to the following Equation (2).
Built-up land ecological footprint (gha) = built-up land area (ha) × built-up land equivalence factor (gha/ha)

2.1.3. Carbon Footprint Accounting

Carbon uptake land is the largest contributor to humanity’s current total ecological footprint and increased more than tenfold from 1961–2007 [32]. The calculation of a carbon footprint involves the increase in demand for bioproductive areas, such as forest, that absorb CO2 that is emitted by, for example, fuel combustion as a result of human economic activity. In calculating the area of land for sequestration, a quarter of CO2 emissions, which are sequestered by the ocean, should be subtracted out [31]. The yield factor for carbon uptake land is assumed to be the same as that for forest land [32]. The annual rate of carbon uptake per hectare of forest land at world average yield (carbon uptake capacity) is 1.8 tons per hectare [23]. The relevant equation is as shown in Formula (3).
Carbon footprint (gha) = CO2 emissions (tons) × (1 − 1/4)/yield factor (carbon uptake capacity) (tons/ha) × carbon uptake land equivalence factor (gha/ha)

2.2. Framework for Evaluating Taiwan’s Ecological Footprint

Calculations of ecological footprint and biocapacity involve six types of land—cropland, grazing land, fishing ground, forest land, built-up land and carbon uptake land [32]. Table 2 presents the six land types and related ecological footprint categories.
Table 2. Land types and ecological footprint categories.
Ecological Footprint CategoryItemSub ItemLand Use Category
Cropland footprintCerealsRice, wheat, corn, sorghum, other grains, pork, poultry, cottonFood
Starchy rootsSweet potatoes, cassava, potatoes, othersFood
Sugars and honeySugars, honeyFood
Pulses and oilseedsSoybeans, peanuts, sesameFood
Vegetables and fruitLeafy greens, roots, bulbs & tubers, flowers & fruits, mushrooms, bananas, pineapples, citrus fruit, melons, othersFood
Grazing land footprintMeatsBeef, mutton, othersFood
Forest footprintWoodConifers, hardwoods, fire woods, mill-wood, bamboo
Fishing grounds footprintFish and seafoodFish, shrimp & crab, cephalopods, shell fish, othersFood
Carbon footprintCO2 uptake landCO2/POPCO2 uptake land
Built-up land footprintResidential area-Urban land
Commercial area Urban land
Industrial area Urban land
Public facility-Urban land
Land on which construction is proceedingABCDNon-urban land
Industrial land for specific purposes-Non-urban land
Land for recreation and leisure-Non-urban land
Land for traffic-Non-urban land
Land for cemetery-Non-urban land
Land used by kiln industry-Non-urban land

3. Calculation of Ecological Footprint

All data used herein are obtained from either the Taiwanese government or international organizations. Data concerning bioproductivity for food and wood are obtained from the UN Food and Agriculture Organization (FAO). Based on these data, the mean bioproductivity (kg/ha) and the yield factors for food and wood are estimated to yield an accurate ecological footprint (Table 3). With respect to the consumption of products in Taiwan, data on the import and export of food were obtained from the 2012 Report on Food Supply and Utilization, published by COA [34]. Data on wood production were obtained from the 2012 Agricultural Statistics Yearbook [35]. Import and export data were obtained from the 2012 Forestry Statistics, Forestry Bureau, COA. The data on built-up land, comprising urban and non-urban areas, were taken from the 2012 Urban and Regional Development Statistics, National Development Council (NDC). The data on CO2 emissions (CO2/pop) were taken from the Key World Energy Statistics, 2013, published by the IEA. Population data were taken from National Statistics 2013, published by Taiwan’s Statistical Bureau.

3.1. Calculation of Ecological Footprint of Taiwan in 2011

3.1.1. Food and Wood

The GFN method for calculating the ecological footprint in terms of food and wood and the data from FAO [36,37,38] and FAOSTAT [39] were used herein to estimate the “global mean productivity” in 2010, with the goal of determining the yield factors for food and wood, as shown in Table 3. Table 4 presents the 2011 ecological footprint in terms of cropland, grazing land, fishing grounds and forest land.
Table 3. Mean global bioproductivity of cropland, grazing land, fishing grounds and forest land.
CroplandProduction (1000 tons)Available Cropland Area (1000 ha)Exchange Rate (kg/ha)
Cereals2,476,4161,388,024.191784.13
Starchy roots747,7401,388,024.19538.71
Sugars and honey1,710,3051,388,024.191232.19
Pulses and oilseeds253,0431,388,024.19182.30
Vegetables and fruit1,776,2821,388,024.191279.72
Grazing landProduction (1000 tons)Available grazing land area (1000 ha)Exchange rate (kg/ha)
Meats296,1073,353,257.7987.63
Fishing groundsProduction (1000 tons)Available fishing grounds (1000 ha)Exchange rate (kg/ha)
Fish and seafood1,485,0001,900,000.00 (Because there are no new statistical data for fishing grounds, the data was from 2004)781.58
Forest landProduction (1000 m3)Forestry area (1000 ha)Exchange rate (m3/ha)
Wood3,405,2004,033,060.000.844
Table 4. Ecological footprint in terms of cropland, grazing land, fishing grounds and forest land areas in 2011 (before application of the equivalence factor) (All numbers are rounded).
CroplandProduction (1000 tons)Import (1000 tons)Export (1000 tons)Total Consumption (1000 tons)PopulationExchange Rate (kg/ha)Ecological Footprint (gha/per)
Cereals3,005,489,8606,542,756,334125,506,1899,422,740,00523,224,9121784.130.23
Starchy roots282,950,6671,477,920,79170,137,8071,690,733,65123,224,912538.710.14
Sugars and honey69,808,394682,375,96711,533,200740,651,16123,224,9121232.190.03
Pulses and oilseeds81,333,1702,513,783,33014,598,1402,580,518,36023,224,912182.300.61
Vegetables and fruits5,590,898,265831,748,062274,822,5656,147,823,76223,224,9121279.720.21
Total1.20
Grazing landProduction quantity (1000 tons)Import quantity (1000 tons)Export quantity (1000 tons)Total consumption quantity (1000 tons)Total populationExchange rate (kg/ha)Ecological footprint (gha/per)
Meats8,484,574134,931,0241,647,068141,768,53023,224,91287.630.07
Fishing groundsProduction quantity (1000 tons)Import quantity (1000 tons)Export quantity (1000 tons)Total consumption quantity (1000 tons)Total populationExchange rate (kg/ha)Ecological footprint (gha/per)
Fish and seafood1,221,405,226342,050,360677,433,090886,022,49623,224,912781.580.05
Forest landProduction quantity (m3)Import quantity (m3)Export quantity (m3)Total consumption quantity (m3)Total populationExchange rate (kg/ha)Ecological footprint (gha/per)
Wood24,213,1606,433,426,000491,195,0005,966,444,16023,224,912844.000.30

3.1.2. Built-Up Land

Built-up land is cropland that has been occupied by human settlements and infrastructure. The calculation of areas of urban and non-urban land is helpful in estimating areas of land that are used for human settlements and infrastructure. Table 5 shows the built-up land areas in 2011.
Table 5. Built-up land areas in 2011.
Urban LandResidential area64,075.79 (ha)
Commercial area7865.64 (ha)
Industrial area22,368.34 (ha)
Area of public facilities91,143.16 (ha)
Non-Urban LandArea of construction land63,860.57 (ha)
Area of land used for specific business purposes45,980.48 (ha)
Area of land used for recreational6326.86 (ha)
Area of land used for traffic infrastructure42,623.69 (ha)
Area of land used for cemetery8795.53 (ha)
Area of land used by pottery industry242.66 (ha)
Total353,282.71 (ha)
Dividing the total area of built-up land by population yields the built-up land footprint as,
353,283 (ha)/23,224,912 (person) = 0.02 (ha/person)

3.1.3. Carbon Footprint

According to the IEA [40], Taiwan emitted 11.30 tons of CO2 per capita in 2011. The yield factor (carbon uptake capacity) is 1.8 tons per hectare [23]. The ocean absorbs one quarter of emitted CO2, which should therefore be subtracted out. Therefore, the carbon footprint per capita in Taiwan is as follows.
11.31 (tons/person) × (1 − 1/4)/1.8 (tons/ha) = 4.71 (ha/person)
Summing these footprints yields an ecological footprint for 2011, before any adjustment using the equivalence factor of 6.36 (gha/person).

3.2. Ecological Footprint and Ecological Deficit from 2008–2011

To convert the ecological footprint to a standard form that can be used to make comparisons, each bioproductive area must be multiplied by an equivalence factor (weight).
Equivalence factors convert the area of a specific type of land, available or demanded, into units of global mean biologically productive area. Therefore, such factors vary by land use type and year. An equivalence factor is calculated as the ratio of the maximum potential ecological productivity of the average land with a particular use (such as cropland) to the mean productivity of all biologically productive lands on Earth [32]. Chambers et al. [41] used an equivalence factor to account for variations in productivity among categories of land. The WWF [42] has stated that the equivalence factor varies with land productivity, available technology and available tools. However, an equivalent factor varies from year to year. This study adopts data from Barrett and Simmons [43] and GFN [6,7,8,30] to obtain the equivalence factors for 2003, 2005, 2006, 2007 and 2008 (Table 6).
Table 6. Equivalence factor from 2003–2008.
Ecological Footprint2003 a2005 b2006 c2007 d2008 e
Cropland2.212.642.392.512.51
Grazing land0.480.500.510.460.46
Forest land1.351.331.241.261.26
Fishing grounds0.360.400.410.370.37
Carbon uptake land1.341.331.241.261.26
Built-up land2.212.642.392.512.51
Energy land1.35- --
Source: a [43], b [30], c [6], d [7] and e [8].
The data in 2004 were obtained using the equivalence factor for 2003 and other data were similarly adjusted by applying the preceding year’s equivalence factor. The data from 2008–2011 were, however, adjusted using the equivalence factor for 2008. Table 7 presents the ecological footprint in Taiwan from 1994 to 2011. Table 1 presents the data concerning global biocapacity in 1995, 2000, 2005, 2006, 2007 and 2009, which can be used to calculate the annual ecological deficits in Taiwan, which are provided in Table 8. Figure 1 plots the trends of the ecological footprint and the ecological deficit from 1994–2011 in Taiwan.
Table 7. Ecological footprint of Taiwan from 1994–2011.
199419951996199719981999200020012002
Ecological Footprint5.095.045.036.505.075.355.195.055.04
200320042005200620072008200920102011
Ecological Footprint5.145.466.015.615.865.405.336.075.93
Table 8. Ecological deficit of Taiwan from 1994–2011.
199419951996199719981999200020012002
Ecological Deficit2.842.952.944.412.983.263.243.103.09
200320042005200620072008200920102011
Ecological Deficit3.193.514.183.804.083.623.534.274.13
The ecological footprint of Taiwan increased in 2004 because that year was the first in which ecological footprint accounts included a carbon footprint, rather than a fossil energy footprint, which was used before 2003. Therefore, after 2004, the fossil energy footprint was replaced with the carbon footprint herein. According to GFN [8], the data source for calculating carbon footprints was Total Primary Energy Supply (TPES), rather than CO2 emissions (CDE).
Figure 1. Ecological footprint and ecological deficit of Taiwan from 1994–2011.
Sustainability 06 06170 g001
Figure 1 reveals two peaks in the ecological footprint in 1997 and 2010. Wang et al. [12] found that the consumption of meat, vegetables and fruit, and wood was higher in those years than in the other years. The area of the land that was associated with meat consumption fell from 1.014 ha in 1997 to 0.933 ha in 2003; the consumption of vegetables and fruit declined from 138.8 kg in 1997 to 125.3 kg in 2003 owing to extreme climate events and natural disasters, and the consumption of wood, especially firewood, mill-wood and bamboo, fell from 42,942 thousand tons in 1997 to 26,818 thousand tons in 2003.
In 2010, a new yield factor of global bioproductivity was adopted for calculating the ecological footprint of Taiwan. The COA [11] used the 2004 yield factor of global bioproductivity before 2009. The use of a different yield factor thereafter is responsible for the large difference between the results for 2004 and 2010. Global fishing production fell from 1,325,000 thousand tons in 2004 to 148,477 thousand tons in 2010, causing the yield factor to fall from 697.37 kg/ha in 2004 to 78.15 kg/ha in 2010. Accordingly, the fishing grounds footprint drastically increased and this increase was responsible for the fact that the ecological footprint in 2010 exceeded that in 2009. This result also explains why the fishing resources on continental shelves globally were depleted in 2010.
Table 9 shows the ecological footprint and ecological deficit using CO2 emissions (CDE) to calculate carbon footprints after 2004. Compared to the results from Figure 1 (using TPES), Figure 2 presents a huge difference between these two calculation methods. To better reflect the global warming phenomena, we suggest CO2 emissions be adopted to calculate carbon footprints, rather than TPES. Furthermore, this study only calculated CO2 emissions per capita and excluded the other five greenhouse gases (GHGs) required by the Kyoto Protocol, including CH4, N2O, HFCs, PFCs, and SF6 [44]. Future research should include the six GHGs to calculate the GHG footprints.
Table 9. Ecological footprint and ecological deficit using carbon footprints (CO2 emissions) from 2004–2011.
20042005200620072008200920102011
Ecological Footprint8.809.358.899.258.638.369.729.43
Ecological Deficit6.857.527.087.476.856.567.927.63
Figure 2. Ecological footprint and ecological deficit using different calculation methods after 2004.
Sustainability 06 06170 g002

4. Trend of Ecological Footprint in Taiwan

The ecological footprint in Taiwan increased annually from 1994–2011. The year 2004 separates two waves of development. The first wave was between 1994 and 2003, and the second wave was between 2004 and 2011, because the calculation of the footprint changed in that year from one in which a fossil energy footprint was used to one in which a carbon footprint was used. In the second wave, the smallest ecological footprint per capita was 8.36 gha, which value pertained in 2009, because in that year the forest footprint per capita was only 0.22 gha, rather than approximately 0.38 gha, as in the other years. The volume of imported wood fell from 6,748,959 m3 in 2008 to 3,896,868 m3 in 2009, returning to 6,610,690 m3 in 2010, mainly owing to the fluctuation in international trade that was caused by the financial crisis at the end of 2008.
In 2011, for example, the total population of Taiwan was 23,224,912 and the national ecological footprint was 219,010,920 gha, which is 61 times the area of Taiwan. In short, to supply the resources that are used by Taiwanese, 61 times the area of Taiwan is required. Table 8 shows the results concerning the ecological deficit in Taiwan from 1994–2011. In 2011, the ecological deficit in Taiwan was approximately 50 times its area. These results reveal several facts concerning the trend in the ecological footprint of Taiwan. First, the ecological footprint and ecological deficit have increased every year, revealing that consumption by Taiwanese have considerably exceeded the carrying capacity of the country. Second, the gradual decline in global biocapacity (Table 1) has increased Taiwan’s ecological deficit. Third, the use of cropland in Taiwan differs from that in other countries. Agricultural land in Taiwan tends to be limited, dispersed and intensely exploited. Consequently, one piece of land may be used to grow a crop and then graze animals. However, in calculations of the ecological footprint, cropland and grazing land are treated as different types of land, resulting in a large demand for land and a large footprint for Taiwan. Furthermore, the huge demand for agricultural products results in the frequent and intense use of farm land rapidly degrading the soil.
In addition to the increasing attention paid to the concepts of ecological footprint and ecological deficit, eco-efficiency has recently been applied to describe the effectiveness with which ecological resources are used to meet human demands [12,45]. Eco-efficiency is a ratio of economic value added to some measurements of environmental impacts; restated, the higher the value added, the more efficient is the use of environmental services [46]. Although the standard ecological footprint method alone does not allow for the complete evaluation of the different environmental profile [21], York et al. [47] measured ecological footprint under conditions of regional ecological resource use, and used GDP as the value of the regional human demand to yield the calculation for eco-efficiency. Through the ecological footprint of the time series to provide a comparison for per capita GDP in different years, it is possible to examine whether a country develops its economy environmentally [12]. Figure 3 reveals the eco-efficiency from 1994–2011. The value was the lowest in 1997, meaning that for a 2125 USD increase in per capita GDP, one global hectare per person of ecological footprint was formed. In 2011, Taiwan performed better in eco-efficiency; restated, each person in Taiwan increased GDP by 3382 USD, forming an ecological footprint of one global hectare per person. After 2006, the eco-efficiency values ranged from 2927–3382 USD, indicating a steady increase of eco-efficiency. Hence, the same amount of ecological resources can meet a larger human demand, or fewer resources can meet the same demand in Taiwan.
Figure 3. GDP trend and eco-efficiency of Taiwan from 1994–2011.
Sustainability 06 06170 g003

5. Conclusions and Suggestions

In the early 21st century, natural resources began significantly to limit economic development. As domestic demand increases, a country inevitably obtains various resources from other countries by international trade to maintain economic development and quality of life. However, as global resources are consumed, dependency on trade may stimulate a crisis of geopolitical competition. Successful economic development then no longer depends on active management and increasing availability of natural capital, requiring each country to focus on the sustainable use of resources [
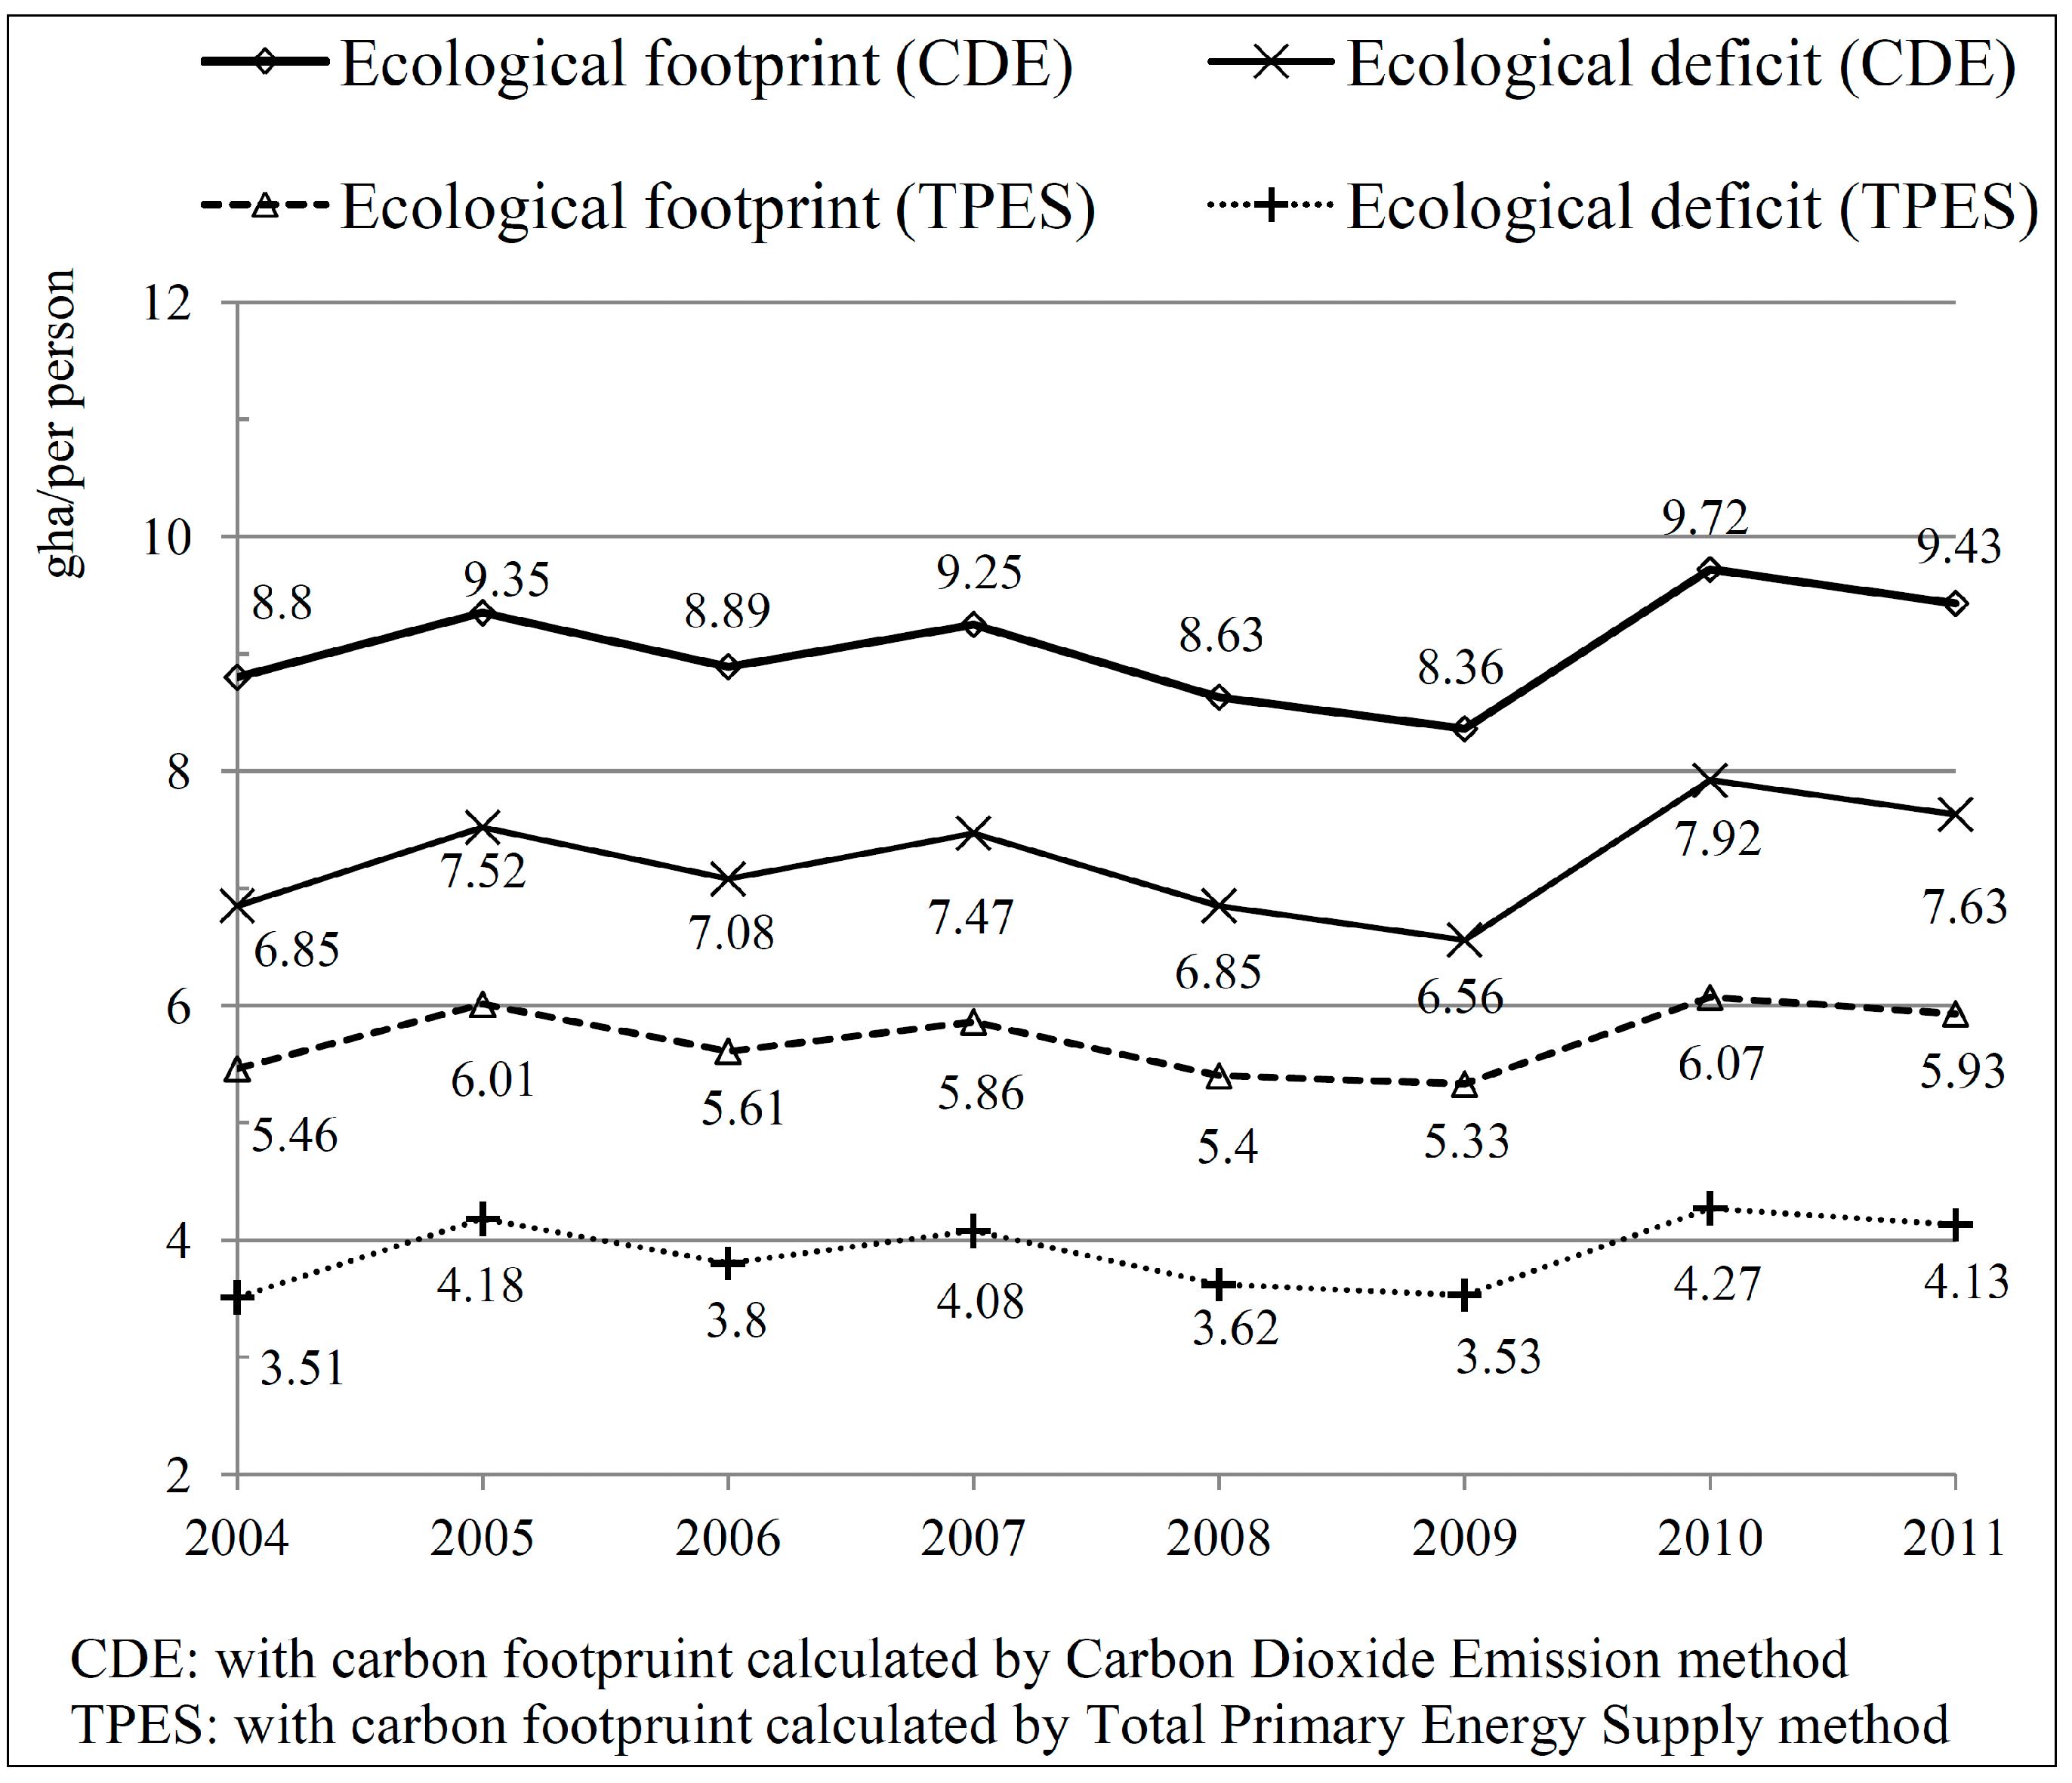
8]. The ecological footprint is a tool for estimating environmental sustainability. However, various methods for evaluating ecological footprints yield divergent results. To ensure confidence in, and consistency among, ecological footprint accounts and their use as a basis for setting sustainable development policies, the GFN [4] developed a standard method for calculating ecological footprints. In this study, the GFN’s latest method was used to calculate the ecological footprint and ecological deficit of Taiwan from 2004–2011. This study contributes by presenting the calculating changes in footprints in order to understand whether Taiwan appropriates resources from other countries. In fact, Taiwan did appropriate resources from other countries. In achieving its economic development, Taiwan induces impacts on the resources and environment of other countries. Taiwan’s case studies could become a reference for those countries which have been targeted for economic growth, especially the island states with few resources.
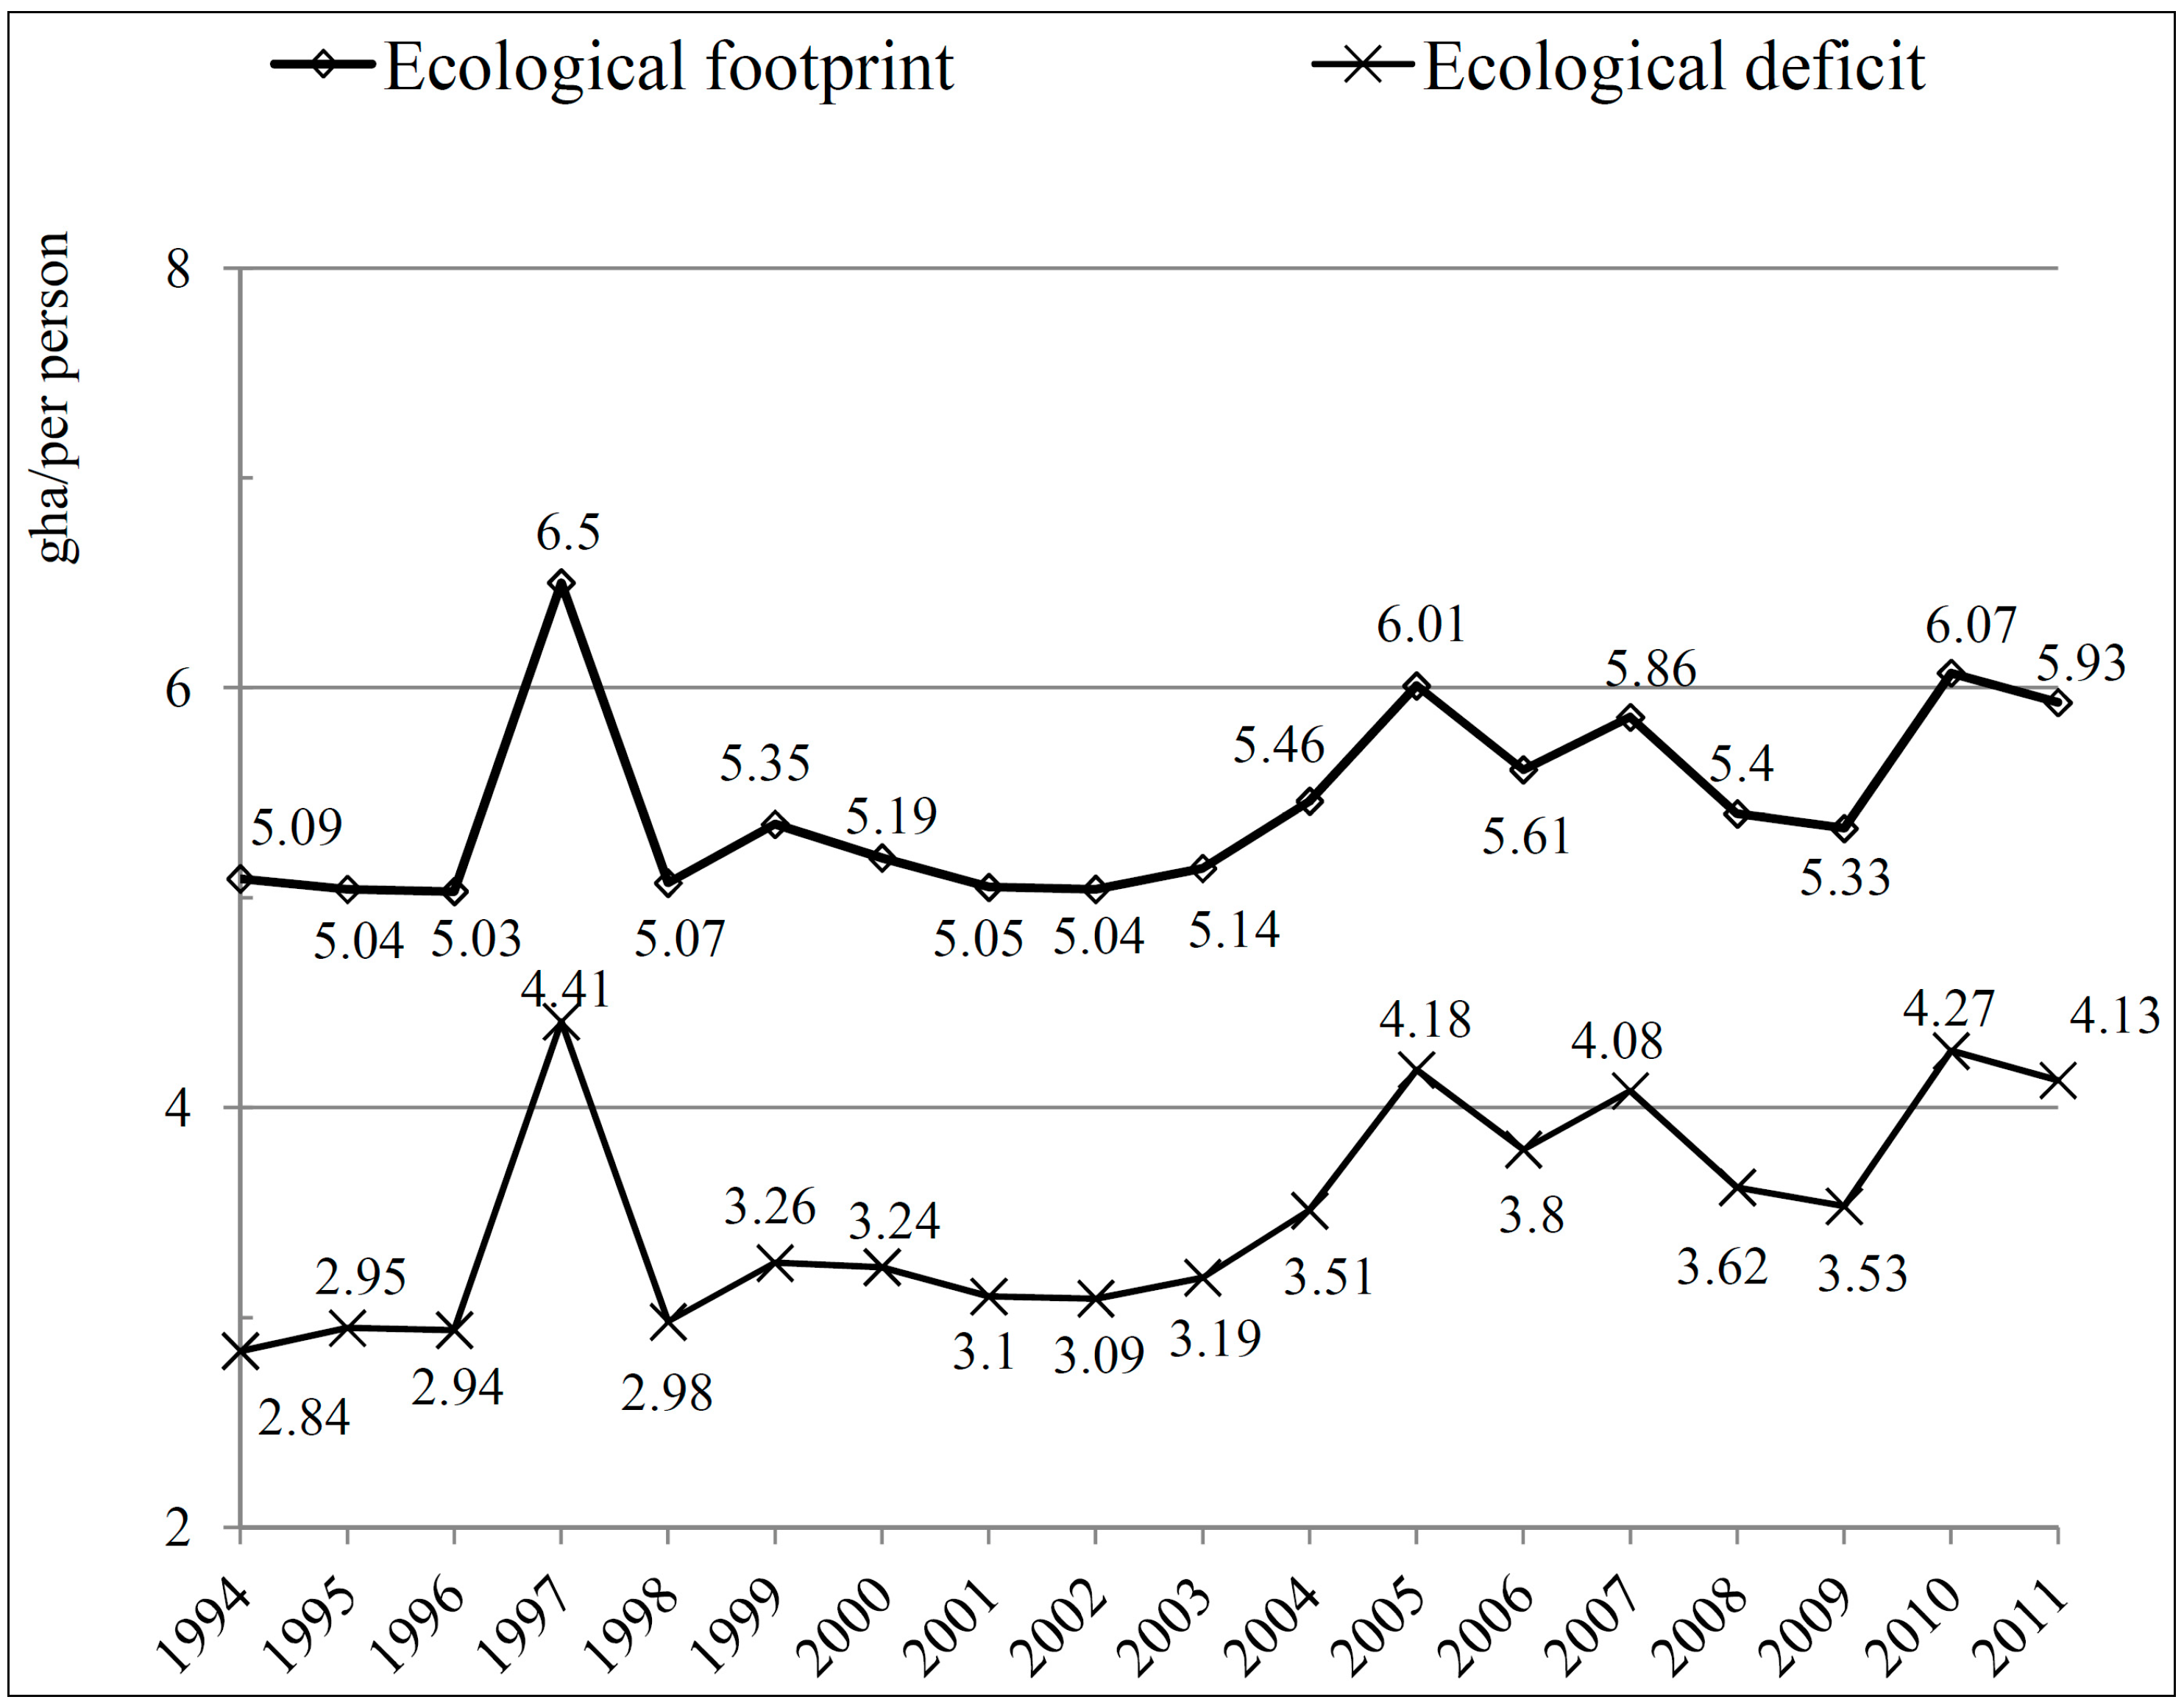
Research has revealed that the ecological footprint of Taiwan is slowly increasing. Based on data for 2011, the ecological footprint of Taiwan in that year was 219,010,920 gha, or 61 times the area of the country. The ecological deficit was approximately 50 times of the area of Taiwan. Both results reveal that the ecological footprint and the ecological deficit of Taiwan have increased annually, further suggesting that consumption by Taiwanese have far exceeded Taiwan’s carrying capacity. The increasing ecological deficit of Taiwan indicates that the Taiwanese are overusing global resources and placing tremendous pressures on the earth. The rising trend should remind Taiwanese to act immediately to reduce their ecological deficit.
Comparing with the data in 2007, which was based on the report of GFN [8], Taiwan’s ecological footprint was 5.86 gha per person which was the 12th ranking and lower than the United Arab Emirates (10.7), Qatar (10.5), Denmark (8.3), Belgium (8.0), USA (8.0), Estonia (7.9), Australia (6.8), Ireland (6.3), Kuwait (6.3), Finland (6.2) and the Netherlands (6.2). As for Asian countries, Taiwan was higher than Singapore (5.3), South Korea (4.9), Japan (4.7) and China (2.2). These results manifest the importance of comparing the ecological footprints of Taiwan with other countries.
Comparing the ecological footprint of Taiwan with that of Asian countries, the reasons for high ecological footprint and ecological deficit lead to examine specific land use systems and ecological footprints in consumption-based approaches. For example, the calculation of specific impact accounts in the ecological footprint drawn from Life Cycle Assessment (LCA) method will be possible to elaborate the recent debate about the needs for improving ecological footprint method [48]. Castellani and Sala [49] highlighted the methodology for a joint use of the two methods and found the relevance of energy and fossil fuel consumption as main drivers of impact. However, the process-flow LCA studies may suffer from truncation errors, a lack of full coverage of indirect upstream flows [50]. The joint approach between the two methods associated with the iterative nature of LCA process may make it difficult to standardize boundary setting principles for calculation. Using the Consumption Land Use Matrix [51] including food, mobility, shelter, goods and services is a more detailed method of sub-national calculation of human activities but is often limited by a lack of available personnel and financial resources for ecological footprint accounting practices [48]. Although this study is insufficient to generate improvements in analytical methodology, this study includes a carbon footprint from the Footprint Family which is an indicator emphasizing the expenditure analysis from the perspective of consumers rather than that of producers. As a consumption-based approach, these indicators have led to the establishment of a quantifiable and acceptable framework [48,52] and a basis for further detailed assessment.

5.1. Limitations

Any theoretical framework necessarily imposes limitations on empirical work. Consequently, this study presents a case study of Taiwan, and is hindered by the following limitations.

5.1.1. The Use of Different Sub-Items of Land Uses Yields Conservative Results

To ensure comparability of the results herein with those of international research, the categorization herein was based on the structure that was used by the FAO and the IEA. However, some of the statistical items in various domestic statistical yearbooks differ from those used by the FAO and the IEA, preventing the categorization of some sub-items, which were therefore omitted in the calculations, yielding excessively conservative results for the ecological footprint of Taiwan.

5.1.2. The Mixed Use of Land as Cropland and for Grazing May Result in the Double Counting of Some Land Areas

In Taiwan, most pasture is cropland. One piece of cropland may be rotated between crops or economic plants and pasture. For consistency with the GFN framework, the grazing lands are separated from croplands herein. This method may result in double counting in some calculations of land areas.

5.1.3. Lack of Bioproductivity and Equivalence Factor for Taiwan

This study uses data on global bioproductivity and the global equivalence factor from the GFN to determine the yield factors and land use adjustments in the accounting of the ecological footprint of Taiwan. However, to support ecological footprint accounting for the purposes of policy-making in Taiwan, a bank of long-term data on land bioproductivity and equivalence factors is required.

5.2. Suggestions

5.2.1. Evaluating Equivalence Factors and Yield Factors for Taiwan

Owing to Taiwan’s geographical characteristics, land use patterns and high population density, the yield factors and the equivalence factors that are used by the GFN may result in some errors in the ecological footprint accounts that are obtained herein. Accordingly, regular environmental surveys and thorough statistical data would provide more reliable ecological footprint accounting.

5.2.2. Establishment of Carbon Reduction Policies and Promotion of Energy Saving and Carbon Reduction

In the Third Symposium on the Ocean in a High CO2 World, 2012, 540 scientists from 37 countries reached a consensus that climate change has acidified the ocean at rates not seen for the past 55 million years. Reducing the CO2 level in the atmosphere is the only way to mitigate this effect [31].
According to the IEA [40], Taiwan’s CO2 emissions were as high as 11.31 tons per capita in 2011. The corresponding values for other Asian countries, China, South Korea, Singapore, Japan, Hong Kong, Thailand and Vietnam, were 5.92, 11.81, 12.49, 9.29, 6.37, 3.50 and 1.56 tons per capita, respectively. Taiwan ranked as the third greatest emitter in Asia and the 21st in the world. These data indicate the move toward sustainable development depends on shifting the “trade-off” between economic development and environmental protection in the direction of the latter. Environmental protection agencies promote energy conservation and carbon reduction. Governments will continue to seek to reduce emissions that are associated with industrial production and to reduce carbon consumption.

5.2.3. Promotion of Reduction of Food Waste and Recycling and Reuse in the Papermaking Industry

Research shows that Taiwanese residents are consuming an increasing amount of food. According to Taiwan’s Environmental Protection Agency (Taiwan EPA), the mass of recycled kitchen waste in 2004 was 299,265 tons and that in 2012 was 834,541, representing growth by a factor of 2.8 in eight years [53]. Therefore, the rise in the amount of food that is wasted by Taiwanese far exceeded the increase in their demand for food. If the government wants to reduce the food footprint, policies should seek to reduce kitchen waste. For example, the government could reduce the food footprint by criminalizing all-you-can-eat promotions. Government can reduce the forest footprint by encouraging the papermaking industry and industries that use wood to reduce wood utilization, and encourage the recycling and reuse of waste paper to reduce domestic demand for woods.

Acknowledgments

The authors would like to thank the Ministry of Science and Technology of the Republic of China, Taiwan, for financially supporting this research under Contract No. NSC102-2410-H-170-005-SS2 and Contract No. 103-2410-H-002 -182 -MY3. Ted Knoy is appreciated for his editorial assistance.

Author Contributions

The authors contributed equally to this work. Yung-Jaan Lee conceived and designed the study and drafted the manuscript. Li-Pei Peng analyzed the data with discussions, depicted all figures and handled all versions of the manuscript submission.

Conflicts of Interest

The authors declare no conflict of interest.

References

  1. IPCC. IPCC WGI Fifth Assessment Report; IPCC: Stockholm, Sweden, 2013. [Google Scholar]
  2. Mimura, N.; Nurse, L.; McLean, R.F.; Agard, J.; Briguglio, L.; Lefale, P.; Payet, R.; Sem, G. Small Islands. In Climate Change 2007: Impacts, Adaptation and Vulnerability. Contribution of Working Group II to the Fourth Assessment Report of the Intergovernmental Panel on Climate Change; Parry, M.L., Canziani, O.F., Palutikof, J.P., van der Linden, P.J., Hanson, C.E., Eds.; Cambridge University Press: Cambridge, UK, 2007; pp. 687–712. [Google Scholar]
  3. Bueno, R.; Herzfeld, C.; Stanton, E.A.; Ackerman, F. The Caribbean and Climate Change: The Costs of Inaction. 2008. Available online: http://sei-us.org/Publications_PDF/SEI-CaribbeanAndClimateChange-08.pdf (accessed on 5 July 2014).
  4. Borucke, M.; Moore, D.; Cranston, G.; Gracey, K.; Iha, K.; Larson, J.; Lazarus, E.; Morales, J.C.; Wackernagel, M.; Galli, A. Accounting for demand and supply of the Biosphere’s regenerative capacity: The National Footprint Accounts’ underlying methodology and framework. Ecol. Indic. 2013, 24, 518–533. [Google Scholar] [CrossRef]
  5. GFN. 2009 Data Tables in Hectares. 2009. Available online: http://www.footprintnetwork.org/en/index.php/GFN/page/ecological_footprint_atlas_2008/ (accessed on 5 July 2014).
  6. Ewing, B.; Goldfinger, S.; Oursler, A.; Reed, A.; Moore, D.; Wackernagel, M. The Ecological Footprint Atlas 2009; Global Footprint Network: Oakland, CA, USA, 2009. [Google Scholar]
  7. Ewing, B.; Moore, D.; Goldfinger, S.; Oursler, A.; Reed, A.; Wackernagel, M. The Ecological Footprint Atlas 2010; Global Footprint Network: Oakland, CA, USA, 2010. [Google Scholar]
  8. GFN. The National Footprint Accounts, 2011 Edition; Global Footprint Network: Oakland, CA, USA, 2012. [Google Scholar]
  9. Lee, Y.J.; Chen, A.C. From the ecological footprint concept to explore sustainable development in Taiwan (in Chinese). Econ. Soc. Discourse 1998, 22, 437–465. [Google Scholar]
  10. COA. Analysis and Comparison of Ecological Footprint Trend in Taiwan (1/2); COA: Taipei, Taiwan, 2005. [Google Scholar]
  11. COA. Analysis and Comparison of Ecological Footprint Trend in Taiwan (2/2); COA: Taipei, Taiwan, 2006. [Google Scholar]
  12. Wang, B.-C.; Chao, F.-Y.; Lee, Y.-J. Ecological footprint of Taiwan: A discussion of its implications for urban and rural sustainable development. Comput. Environ. Urban Syst. 2012, 36, 342–349. [Google Scholar] [CrossRef]
  13. Rees, W.E. Ecological footprint and appropriated carrying capacity: What urban economics leaves out. Environ. Urban. 1992, 4, 121–130. [Google Scholar] [CrossRef]
  14. Niccolucci, V.; Tiezzi, E.; Pulselli, F.M.; Capineri, C. Biocapacity vs. ecological footprint of world regions: A geopolitical interpretation. Ecol. Indic. 2012, 16, 23–30. [Google Scholar] [CrossRef]
  15. Bagliani, M.; Bravo, G.; Dalmazzone, S. A consumption-based approach to environmental Kuznets curves using the ecological footprint indicator. Ecol. Econ. 2008, 65, 650–661. [Google Scholar] [CrossRef]
  16. Chen, G.Q.; Chen, B. Ecological footprint accounting based on emergy—A case study of the Chinese society. Ecol. Model. 2006, 198, 101–114. [Google Scholar] [CrossRef]
  17. Chen, G.Q.; Chen, B. Resource analysis of the Chinese society 1980–2002 based on exergy—Part 1: Fossil fuels and energy minerals. Energy Policy 2007, 35, 2038–2050. [Google Scholar] [CrossRef]
  18. Shao, L.; Wu, Z.; Chen, G.Q. Exergy based ecological footprint accounting for China. Ecol. Model. 2013, 252, 83–96. [Google Scholar] [CrossRef]
  19. Shao, L.; Chen, G.Q. Water footprint assessment for wastewater treatment: Method, indicator, and application. Environ. Sci. Technol. 2013, 47, 7787–7794. [Google Scholar] [CrossRef]
  20. Wu, X.F.; Yang, Q.; Xia, X.H.; Wu, T.H.; Wu, X.D.; Shao, L.; Hayat, T.; Alsaedi, A.; Chen, G.Q. Sustainability of a typical biogas system in China: Emergy-based ecological footprint assessment. Ecol. Inf. 2014. [Google Scholar] [CrossRef]
  21. Cerutti, A.K.; Beccaro, G.L.; Bagliani, M.; Donno, D.; Bounous, G. Multifunctional ecological footprint analysis for assessing eco-efficiency: A case study of fruit production systems in Northern Italy. J. Clean. Prod. 2013, 40, 108–117. [Google Scholar] [CrossRef]
  22. McDonald, G.W.; Patterson, M.G. Ecological Footprints and Interdependencies of New Zealand Regions. Ecol. Econ. 2004, 50, 49–67. [Google Scholar]
  23. Wackernagel, M.; Rees, W. Our Ecological Footprint: Reducing Human Impact on the Earth; New Society: Gabriola Island, BC, Canada, 1996. [Google Scholar]
  24. Lammers, A.; Moles, R.; Walsh, C.; Huijbregts, M.A.J. Ireland’s footprint: A time series for 1983–2001. Land Use Policy 2008, 25, 53–58. [Google Scholar]
  25. Nie, Y.; Ji, C.; Yang, H. The forest ecological footprint distribution of Chinese log imports. For. Policy Econ. 2010, 12, 231–235. [Google Scholar] [CrossRef]
  26. Martín-Cejas, R.R.; Sánchez, P.P.R. Ecological footprint analysis of road transport related to tourism activity: The case for Lanzarote island. Tour. Manag. 2010, 31, 98–103. [Google Scholar]
  27. Barrett, J.; Birch, R.; Cherrett, N.; Wiedmann, T. Exploring the application of the ecological footprint to sustainable consumption policy. J. Environ. Policy Plan. 2005, 7, 303–316. [Google Scholar] [CrossRef]
  28. Erb, K.H. Actual land demand of Austria 1926–2000: A variation on ecological footprint assessments. Land Use Policy 2004, 21, 247–259. [Google Scholar]
  29. Wackernagel, M.; Onisto, L.; Bello, P.; Linares, A.C.; Lopez Falfan, I.S.; Garcia, J.M.; Guerrero, A.I.S.; Guerrero, M.G.S. National natural capital accounting with the ecological footprint concept. Ecol. Econ. 1999, 29, 375–390. [Google Scholar] [CrossRef]
  30. Ewing, B.; Reed, A.; Rizk, S.M.; Galli, A.; Wackernagel, M.; Kitzes, J. Calculation Methodology for the National Footprint Accounts, 2008 ed.; Global Footprint Network: Oakland, CA, USA, 2008. [Google Scholar]
  31. IGBP; IOC; SCOR. Ocean Acidification Summary for Policymakers—Third Symposium on the Ocean in a High-CO2 World; International Geosphere-Biosphere Programme: Stockholm, Sweden, 2013. [Google Scholar]
  32. Ewing, B.; Reed, A.; Galli, A.; Kitzes, J.; Wackernagel, M. Calculation Methodology for the National Footprint Accounts, 2010 ed.; Global Footprint Network: Oakland, CA, USA, 2010. [Google Scholar]
  33. Wackernagel, M.; Schulz, B.; Deumling, D.; Linares, A.C.; Jenkins, M.; Kapos, V.; Monfreda, C.; Loh, J.; Myers, N.; Norgaard, R.; et al. Tracking the ecological overshoot of the human economy. Proc. Natl. Acad. Sci. USA 2002, 99, 9266–9271. [Google Scholar] [CrossRef]
  34. COA. Food Supply and Utilization Annual Report. Council of Agriculture: Taiwan, 2012. Available online: http://eng.coa.gov.tw/list.php?catid=8844 (accessed on 5 July 2014).
  35. COA. Yearly Report of Taiwan’s Agriculture. Council of Agriculture: Taiwan, 2012. Available online: http://eng.coa.gov.tw/list.php?catid=8842 (accessed on 5 July 2014).
  36. FAO. The State of World Fisheries and Aquaculture 2012; FAO: Rome, Italy, 2012. [Google Scholar]
  37. FAO. FAO Statistical Yearbook 2012; FAO: Rome, Italy, 2012. [Google Scholar]
  38. FAO. FAO Statistical Yearbook 2013; FAO: Rome, Italy, 2013. [Google Scholar]
  39. FAOSTAT. FAOSTAT. 2010. Available online: http://faostat.fao.org/site/377/DesktopDefault.aspx?PageID=377#ancor (accessed on 5 July 2014).
  40. IEA. Key World Energy Statistics 2013; International Energy Agency: Paris, France, 2013. [Google Scholar]
  41. Chambers, N.; Simmons, C.; Wackernagel, M. Sharing Nature’s Interest; Earthscan: London, UK, 2000. [Google Scholar]
  42. WWF. EUROPE 2005: The Ecological Footprint; WWF: Morges, Switzerland, 2005. [Google Scholar]
  43. Barrett, J.; Simmons, C. An Ecological Footprint of the UK: Providing a Tool to Measure the Sustainability of Local Authorities; Stockholm Environment Institute: Stockholm, Sweden, 2003. [Google Scholar]
  44. Galli, A.; Wiedmann, T.; Ercin, E.; Knoblauch, D.; Ewing, B.; Giljum, S. Integrating ecological, carbon and water footprint into a “footprint family” of indicators: Definition and role in tracking human pressure on the planet. Ecol. Indic. 2012, 16, 100–112. [Google Scholar] [CrossRef]
  45. OECD. Eco-efficiency; OECD Publishing: Paris, France, 1998. [Google Scholar]
  46. Ehrenfeld, J.R. Eco-efficiency: Philosophy, theory, and tools. J. Ind. Ecol. 2005, 9, 6–8. [Google Scholar] [CrossRef]
  47. York, R.; Rosa, E.A.; Dietz, T. The ecological footprint intensity of national economies. J. Ind. Ecol. 2005, 8, 139–154. [Google Scholar] [CrossRef]
  48. Kitzes, J.; Galli, A.; Bagliani, M.; Barrett, J.; Dige, G.; Ede, S.; Erb, K.; Giljum, S.; Haberl, H.; Jungwirth, S.; et al. A research agenda for improving national Ecological Footprint accounts. Ecol. Econ. 2009, 68, 1991–2007. [Google Scholar] [CrossRef]
  49. Castellani, V.; Sala, S. Ecological footprint and life cycle assessment in the sustainability assessment of tourism activities. Ecol. Indic. 2012, 16, 135–147. [Google Scholar] [CrossRef]
  50. Lenzen, M. Errors in conventional and input-output-based life-cycle inventories. J. Ind. Ecol. 2001, 4, 127–148. [Google Scholar] [CrossRef]
  51. GFN. Glossary—Global Footprint Network. Available online: http://www.footprintnetwork.org/en/index.php/GFN/page/glossary/ (accessed on 31 July 2014).
  52. Chavez, A.; Ramaswami, A. Articulating a trans-boundary infrastructure supply chain greenhouse gas emission footprint for cities: Mathematical relationships and policy relevance. Energy Policy 2013, 54, 376–384. [Google Scholar] [CrossRef]
  53. EPA. Kitchen Waste Recycling Statistics. Environmental Protection Administration: Taiwan, 2014. Available online: http://210.69.101.110/epa/stmain.jsp?sys=100 (accessed on 5 July 2014). (In Chinese)

