1. Introduction
Sustainable tourism focusing on rural areas is recognized as a tool for rejuvenating traditional industries and creating income in rural and isolated areas. It also aims to minimize environmental and cultural heritage damage, optimize visitor satisfaction and maximize long-term economic growth for the region [
1]. Tourism in rural areas has grown partly as a result of government initiatives [
2,
3], and the Korean Government has been playing a leading role in the development of rural tourism since 2002 [
4,
5]. As a result, government-based rural tourism has emerged as one of the main economic activities in rural areas [
6].
Korean tourists’ demand for rural tourism facilities has been increasing due to higher disposable incomes, changing tastes and preferences and increased leisure time resulting from the introduction of the five-day working week in Korea [
6]. With demand for higher service quality and tourists becoming more information-driven, the numbers of travel or tourism industry providers that utilize local ecological and cultural resources have been increasing. Some domestic rural tourists visit rural areas for the experience (e.g., life experience, experience folk plays,
etc.), some to simply relax (e.g., resting and recreation, scenic viewing, visit natural forests) and some to visit their home town (e.g., visiting family, relatives and friends) [
7,
8,
9,
10]. However, despite the expectation of generating increased gross regional domestic product (GRDP) and new jobs, the growth has not been strong enough to stimulate the stagnant economy, especially in rural areas. Most Korean tourists in rural areas are short-term visitors with a 25.8% overnight stay rate and a 27.3% revisitation rate [
11].
Rural tourist motivations depending on individual needs may further influence the choice of destinations, tourists’ satisfaction and tourist behavior. Previous studies have predominantly focused on the attitudes of locals and residents to tourism development-related issues, rather than tourist behavior [
6]. Evaluation of satisfaction has focused on the visitors’ overall satisfaction with a destination and satisfaction with one of the components of the tourist experience: lodging, cruises, gastronomy, cultural/heritage experiences, tour guides,
etc. [
12,
13,
14,
15,
16,
17,
18,
19,
20]. Travel behavior differs according to visitors’ motivations, and tourists’ satisfaction influences their subsequent behavior, such as repeat visitation or the intention to recommend a particular destination to others. An understanding of what the first-time and repeat visitors are looking for and how they evaluate a destination service’s performance is warranted in order to develop programs aiming to convert first-time visitors into repeat visitors, to maintain the existing repeat visitor base and, consequently, to enhance sales and profits [
21].
Tourist perceptions of a destination depend on information sources, such as advertising, travel consultants and Internet advertising. Tourists seek to enhance the quality of their trip by decreasing the level of associated uncertainty through information searches [
22], since tourism is an experience-based good. A lack of information over a destination may influence tourists’ satisfaction, which will result from expectations, and information search behavior plays a role in the selection of a tourism product. Despite information sources having a significant relationship with tourist characteristics, behavior or satisfaction, research work on the effect of tourist preferences or usage level of information sources on tourist satisfaction has so far been insufficient.
This study aims to measure tourist satisfaction with destination attributes and to identify differences in satisfaction depending on information source preferences. This study has three specific objectives: (1) to profile the travel choice of Korean tourists visiting rural tourism destinations; (2) to investigate not only the contribution of satisfaction with destination attributes to the level of overall satisfaction, but also the effects of overall satisfaction on tourists’ revisitation and recommendations; and (3) to determine whether there is a relationship between tourist information searches and tourist satisfaction levels.
2. Literature Review
2.1. Tourists’ Destination Choices
Tourists’ objectives reflect the characteristics of individuals that influence the choice of destinations. The effects that motivational influences of this nature have on individuals have also been labeled as push factors [
23,
24,
25,
26,
27]. Many studies have attempted to identify push and pull motivational factors in different settings, such as nationality (e.g., [
28,
29,
30]), destinations (e.g., [
31,
32]), satisfaction (e.g., [
19,
33,
34]), destination loyalty (e.g., [
35]) and events (e.g., [
36,
37]). Jang and Wu [
38] suggested that common push factors found in the majority of studies included knowledge-seeking, relaxation and family togetherness, while the most frequently seen pull factors were natural and historic environments, cost, facilities, safety and accessibility. Factors, including escape, relaxation, relationship enhancement and self-development, seemed to comprise the central backbone of motivation of all travelers [
39].
2.2. Tourist Satisfaction
Tourist satisfaction is defined as a result of comparing tourists’ experiences in a destination visited and expectations about the destination [
40]. An analysis of the literature on satisfaction appears to suggest that satisfaction can be regarded as an evaluation of the producer, service or experience. In a tourism setting, consumer satisfaction refers to the extent to which the destination fulfills consumers’ performance criteria [
19]. Tourists interact with many different components of the destination (resort) product, which is a package of diverse attributes that includes not only the historical sites and spectacular scenery, but also services and facilities catering to the everyday needs of tourists [
41,
42].
A number of studies that have reported on the evaluation of tourist satisfaction have focused on the level of overall satisfaction. Cronin and Taylor [
43] concluded that, in predicting overall satisfaction, measuring service quality based on perceptions/experiences alone was superior to the disconfirmation-based approach. Satisfaction with services is related to the size and direction of the confirmation or disconfirmation experience, which are, in turn, affected by the person’s initial expectations [
44]. Tourist satisfaction levels have been analyzed with reference to a single component of the tourist experience: hotels [
12,
13], cruises [
14], gastronomy [
15,
16,
17,
18,
19] and tour guides [
20,
45]. Destination factors, such as the natural environment, the scenery, the culture, the availability of activities, facilities and entertainment, might be among the prime determinants of tourist satisfaction [
40,
46,
47,
48,
49].
The importance of understanding and managing tourist satisfaction stems from the fact that tourists behave differently according to their level of satisfaction [
19]. In regard to the relationship between tourist satisfaction and repeat visitation, as satisfaction increased, word-of-mouth activity increased [
33,
50], and tourists who have enjoyed better than expected experiences are more likely to return in the future [
51]. The level of overall satisfaction with holiday experiences had the greatest impact on the intention to revisit the same destination [
34]. The positive effect that overall satisfaction and/or satisfaction with different aspects of a destination have on a tourists’ intention to revisit it or recommend it to others has been analyzed [
35,
52,
53,
54,
55,
56].
There was a study that assessed the satisfaction of different service quality; the likelihood of revisiting and recommending is positively related to tourists’ overall satisfaction levels [
57]. According to Yuksel [
21], the first-time and repeat visitor groups develop their return intention and satisfaction based on slightly different aspects of their holiday destination. While both first-time and repeat visitors commonly regard the quality of food, quality of accommodation, hospitality and safety as reasons to come back, they consider different additional services to develop their return intentions. First-time visitors are likely to return in a few years’ time, and repeat visitors are likely to return next year to the same destination [
58]. On the other hand, some studies have revealed that it is highly likely that a dissatisfied customer never returns [
59,
60,
61]. Partial domestic Korea research has been conducted to check on the satisfaction with the tourist motivation and intention to revisit [
62,
63], and it is mainly limited to festival programs or the physical characteristics of the destinations (e.g., souvenirs, public relations, amenities, food,
etc.) and facilities [
64,
65,
66]. There is a report that shows that “fun” and “escape from daily lives” are the most influential factors leading to increased satisfaction and has found that this satisfaction leads to future revisits [
67].
2.3. Tourist Information Search
An inquiry into the information search behavior of a potential tourist involves determining what to search (information contents) and where to search (information channels) [
68]. Moutinho [
25] defined information search as an expressed need to consult various sources prior to making a purchase decision. This definition identified three major factors emphasized in the tourism information search literature: motives, determinants and sources. Tourist information search was conceptualized as a dynamic process wherein individuals use various amounts and types of information sources in response to internal and external contingencies to facilitate travel planning [
22].
Information sources are classified into internal and external sources [
69]. Internal information sources may have been actively acquired at one time from previous personal experience, either with the specific destination or with similar destinations [
70], and past information searches or passively through low-involvement learning, where customers are repeatedly exposed to marketing stimuli [
69]. External information sources are categorized as follows: personal (e.g., word-of-mouth, advice from friends and relatives), marketer-dominated (e.g., advertisements in print and electronic media), neutral (e.g., travel agents and travel guides) and experiential sources, like direct contact with a retailer [
71,
72,
73]. Information, from either internal or external sources, is necessary for choosing a destination and for making onsite decisions about travel modes, attractions, location activities and lodging [
74,
75,
76,
77].
The search is often predominantly for external information sources [
78]. Tourists use a combination of certain external sources, such as word-of-mouth advice, published travel guides [
79], professional services and advice offered by travel agencies [
80]. The Internet serves as a communication channel for e-travelers and suppliers of travel services and products [
80]. Many tourists utilize the Internet and online resources for their information needs [
81].
The influence of situational factors (e.g., prior experience with a destination, purpose of trip) on tourism information search behavior [
77,
82] or the relationship between information sources and trip characteristics [
83,
84] have been revealed. The effect of tourism motivations on information search behavior was examined, suggesting that there was a gap between the level of escapist motivation and the level of activist motivation [
85]. Cai, Lehto and O’Leary [
86] investigated U.S.-bound Chinese tourists and discovered that leisure tourists were more likely to use informal sources, such as friends and relatives, than tourists with other purposes. Package tourists are likely to choose personal information sources, and independent tourists are likely to choose non-commercial information sources [
87].
Several pieces of previous research have been conducted on the specific sources used, with much of this work being in relation to destinations [
88]. Information sources, such as news media and word-of-mouth, have a positive influence on perception [
89], and the variety (amount) and type of information sources determine tourists’ perceptual/cognitive evaluation, which forms their affection for the tourist destination [
90]. In an overview of research on tourist information use, Kerstetter and Cho [
91] revealed inconsistencies in the findings. Some studies have shown that as experience with a destination increases, the search for external information decreases, while other studies have indicated the opposite. Repeat visitors to a place may not always wish to collect additional information from external sources, as they can rely on past experiences, while external information searches seem typical for first-timers to a destination [
22]. Baloglu [
92] uncovered that first-timers tend to use commercial information sources, while repeaters often use both commercial and non-commercial sources. Shanka and Taylor [
93] found that repeat visitors employed a wider variety of information sources than did first-timers. A study conducted by Lehto
et al. [
94] indicates that tourists’ information search endeavors are not necessarily reduced as experience with a destination increases.
Little has been written on the information search preference and tourists’ satisfaction. Recently, there was a report on satisfaction results from tourism information searches on the Internet [
95]. It revealed not only that tourism information has a positive effect on its recommended intentions, but also the relationship between satisfaction of tourism information and tourists’ satisfaction is significantly positive [
96]. E-word-of-mouth acceptance is related positively to intention to visit [
97].
3. Methodology
3.1. Survey Questionnaire
A questionnaire with four sections was designed as follows: Section I consisted of a few miscellaneous questions that aimed to elicit respondents’ travel choices on rural tourism; that is, types of travel companions, purpose and method, length of stay, frequency and revisitation. Section II was to comprehend respondents’ overall level of satisfaction with their trip and their likelihood of revisiting rural areas that they had already visited and recommending them to others after their holiday experience. To investigate factors influencing tourists’ overall satisfaction, the level of satisfaction with different aspects of the destination was also measured, namely, satisfaction with the physical environment, social environment and experience programs. Section III comprised usage and preference in relation to tourist information sources. Information sources were further grouped under six attributes, such as Government Publications, Multimedia, Travel Consultants, Internet Advertising, Community and Word-of-Mouth. The final section contains socio-demographic variables; namely, Gender, Age, Household member, Occupation and Monthly Personal Income.
Respondents were asked to evaluate their satisfaction with each tourist-attracting attribute according to a five-point Likert scale, where 1 = very dissatisfied and 5 = very satisfied. A number of studies have used a summative overall measure of satisfaction (e.g., [
98,
99,
100]. In this study, a single overall measure of satisfaction [
101] was also used, and the respondents were asked to rate their satisfaction with the overall travel experience on a five-point Likert scale (1 = very dissatisfied and 5 = very satisfied). Tourists’ intention to revisit and their willingness to recommend to others was evaluated with the five-point Likert scale, with 1 being most unlikely and 5 being most likely. The usage level of the selected 15 information sources was rated on a five-point Likert scale, where 1 = most underused and 5 = most used. Survey participants were asked to fill in demographic characteristics and travel choice on a nominal scale, as well as questions on the visitors’ purpose of participating in a rural experience program, which allowed for the selection of multiple choices.
3.2. Data Acquisition
The survey on rural tourism was conducted from February to March, 2012, targeting people aged 18-years-old or above who have experienced domestic rural trips in Korea. Survey answers were mostly provided by people living in the Seoul metropolitan area, who are potential visitors to rural areas, as well as by urban residents in other regions. The sampling method is simple random sampling, which means that every person has the same probability of being chosen. In other words, each individual is chosen randomly and entirely by chance, such that each individual has the same probability of being chosen at any stage during the sampling process, and each subset of
k individuals has the same probability of being chosen for the sample as any other subset of
k individuals [
102]. A total of 322 questionnaire samples were obtained from tourists, with a final total of 300 samples (excluding 22 responses that were unreliable or insincerely answered) being used in this study.
3.3. Analysis
The data was analyzed in four stages. First, a descriptive-statistics analysis was employed to explore the socio-demographic characteristics of respondents. Travel purposes were investigated using a multiple response analysis, and travel choice attributes according to the types of travel companion were applied to a cross-tabulation analysis. These were further verified using chi-squares.
Factor analysis has been widely used in visitor satisfaction research [
52,
57,
101]. Tourist satisfaction in relation to different aspects of the destination was clustered into four dimensions using exploratory factor analysis (EFA). EFA with varimax rotation was used to identify the underlying usage of information sources and data reduction by means of factor analysis useful in cluster analysis, because it eliminated correlation among the variables [
6]. This study used the criteria suggested by Hair
et al. [
103] (pp. 122, 129): (1) factor loadings equal to or above 0.50; (2) eigenvalues equal to or above 1.0; and (3) results of the factor analysis explaining at least 60% of the total variance. Confirmatory factor analysis (CFA) was employed to verify the dimensions of visitors’ attribute satisfaction. A path analysis using the arithmetic mean value of each questionnaire item was conducted in order to comprehend the effects of the dimensions on the overall satisfaction and the willingness to revisit and recommend to others. The relationship between information search behavior and overall tourists’ satisfaction was examined by multiple regression analysis after conducting EFA. Six dimensions were identified by EFA, and Cronbach’s α was computed to check the internal consistency of items with each dimensions. The SPSS (ver. 18.0) and AMOS (ver. 7.0) programs were used for data analysis.
4. Results
4.1. Socio-Demographics and Trip Profiles of Respondents
The socio-demographic traits of the samples are presented in
Table 1. More males (52.7%) were found in the sample, and 59.7% of respondents were aged below 40. In terms of household members on the basis of the first child, households having graduates were 36.7%, followed by households having children in middle and high school (19.0%), children in elementary school (17.0%) and preschoolers (10.7%). A total of 26.0% of participants were students, and 22.0% were white-collar workers, followed by housewives (16.0%), professionals (14.7%), sales and service workers (11.0%) and blue-collar workers (7.7%). Finally, more than half (55%) of respondents earned between US$ 2000 and US$ 4000 a month, while only 8.7% of respondents earned more than US$ 5000 a month.
Table 1.
Socio-demographic traits of the respondents.
Table 1.
Socio-demographic traits of the respondents.
| Frequency (%) | | Frequency (%) |
|---|
| Gender | | Occupation | |
| Male | 158 (52.7) | White-collar worker | 66 (22.0) |
| Female | 142 (47.3) | Blue-collar worker | 23 (7.7) |
| Age | | Sales and Service | 33 (11.0) |
| 18–29 years | 98 (32.7) | Professional | 44 (14.7) |
| 30–39 years | 81 (27.0) | Housewife | 48 (16.0) |
| 40–49 years | 66 (22.0) | Student | 78 (26.0) |
| 50 and above | 55 (18.3) | Others | 8 (2.7) |
| Household member based on the age of first child | | Monthly personal income (US$) | |
| Preschoolers | 32 (10.7) | Up to 2000 | 28 (9.3) |
| Children in elementary | 51 (17.0) | 2001–3000 | 74 (24.7) |
| Children in middle and high schools | 57 (19.0) | 3001–4000 | 91 (30.3) |
| More that graduates | 110 (36.7) | 4001–5000 | 52 (17.3) |
| Elderly parents | 26 (8.5) | 5001–6000 | 29 (9.7) |
| Couples | 24 (8.0) | More than 6001 | 26 (8.7) |
As presented in
Table 2 below, in the travel companion section, family get-togethers topped the list while friends or couples, single travelers and business associates came next in the list. With regard to travel choice according to companion types (
Table 3), single travelers preferred relaxation the most (28.2%) and family-type companionship had more chances of relaxation, followed by leisure, cultural experience and ecological observation. Friends or couples chose relaxation as the most preferred tourism objective purpose, compared to leisure and cultural experiences (34.3%). Forty-six people traveling with business associates said that they preferred leisure the most.
Table 2.
Rural tourism choices according to the types of companionship.
Table 2.
Rural tourism choices according to the types of companionship.
| | Single (n = 65) | Family (n = 122) | Friends/Couples (n = 67) | Business Associates (n = 46) |
|---|
| Relaxation (n = 163) | Frequency | 46 | 62 | 35 | 20 |
| % of tourism purpose | 28.2 | 38.0 | 21.5 | 12.3 |
| % of companion types | 70.8 | 50.8 | 52.2 | 43.5 |
| Leisure (n = 110) | Frequency | 20 | 44 | 23 | 23 |
| % of tourism purpose | 18.2 | 40.0 | 20.9 | 20.9 |
| % of companion types | 30.8 | 36.1 | 34.3 | 50.0 |
| Ecological observation (n = 75) | Frequency | 13 | 35 | 12 | 15 |
| % of tourism purpose | 17.3 | 46.7 | 16.0 | 20.0 |
| % of companion types | 20.0 | 28.7 | 17.9 | 32.6 |
| Cultural experience (n = 103) | Frequency | 21 | 40 | 23 | 19 |
| % of tourism purpose | 20.4 | 38.8 | 22.3 | 18.4 |
| % of companion types | 32.3 | 32.8 | 34.3 | 41.3 |
As can be seen from
Table 3, in terms of travel methods, 214 out of 300 respondents chose an individual tour, followed by group tours (n = 74) and package tours (n = 12). People traveling alone chose only an individual tour, and family get-togethers preferred individual tours the most. Visitors who traveled with friends or partners mostly planned individual tours, while business associates did not plan individual tours.
Most respondents preferred a two-day, one-night trip (n = 117) with their companions, followed by a three-day, two-night trip (n = 97). Among the 117 respondents who went on a two-day, one-night trip, family get-togethers had the highest number, followed by visitors who traveled with friends or a partner. Single travelers and business associate-type companions preferred a three-day, two-night trip the most. As for travel frequency, twice a year was the top choice made by respondents, followed by once a year and three times a year. One hundred of the 300 respondents were unlikely to revisit the same destination, and more than one-third of the respondents would intend to revisit within one to two years or after two years.
4.2. The Relationship between Tourists’ Satisfaction, Revisitation and Recommendation
The EFA was applied to understand the contribution of satisfaction with destination attributes to the level of overall satisfaction (
Table 4). A four-factor solution with eigenvalues greater than one and a factor loading above 0.5, accounting for 63.36% of the total variance, was chosen. In terms of the variables, factor loadings varied from 0.564 to 0.871, which is above the suggested threshold value of 0.30 for practical and statistical significance [
104]. Cronbach’s α for the four dimensions ranged from 0.700 to 0.835, indicating high internal consistency and a generally agreed upon lower limit of 0.60 for research at the exploratory stage [
105].
Table 3.
Travel choice according to the types of companion.
Table 3.
Travel choice according to the types of companion.
| Companion Types | Total | χ2 | p-value |
|---|
| Single (n = 65) | Family (n = 122) | Friends/Couples (n = 67) | Business Associates (n = 46) |
|---|
| Travel method | Individual tour | 65 | 98 | 51 | - | 214 | 147.07 | 0.00 *** |
| Group tour | - | 22 | 13 | 39 | 74 |
| Package tour | - | 2 | 3 | 7 | 12 |
| Length of stay | 1-day-trip | 8 | 16 | 9 | - | 33 | 34.18 | 0.00 *** |
| 2 days, 1 night | 17 | 57 | 29 | 14 | 117 |
| 3 days, 2 nights | 27 | 38 | 15 | 18 | 98 |
| 4 days, 3 nights | 8 | 9 | 7 | 10 | 34 |
| 5 days, 4 nights | 1 | - | 3 | - | 4 |
| 7 days+ | 4 | 2 | 4 | 4 | 14 |
| Annual travel frequency | Once | 19 | 25 | 25 | 13 | 82 | 20.18 | 0.06 * |
| Twice | 25 | 44 | 27 | 18 | 114 |
| Three times | 6 | 31 | 11 | 5 | 53 |
| Four times | 5 | 9 | 1 | 4 | 19 |
| Five times+ | 10 | 13 | 3 | 6 | 32 |
| None | 19 | 33 | 36 | 12 | 100 |
| Revisitation | Within 3 months | 5 | 7 | 2 | 1 | 15 | 37.60 | 0.00 *** |
| 3 – 6 months | 4 | 15 | 3 | 2 | 24 |
| 6 – 12 months | 9 | 19 | 2 | 7 | 37 |
| 1 – 2 years | 12 | 36 | 10 | 16 | 74 |
| After 2 years | 16 | 12 | 14 | 8 | 50 |
Table 4.
Underlying dimensions of visitors’ satisfaction with destination attributes.
Table 4.
Underlying dimensions of visitors’ satisfaction with destination attributes.
| Satisfaction/dimensions | Eigenvalue | Variance Explained (R %) | Cronbach’s α | Factor Loading |
|---|
| Ecological and cultural attractions | 2.936 | 18.347 | 0.799 | |
| Ecological observations/learning about natural attractions | | | | 0.731 |
| Learning in museum or about heritage | | | | 0.838 |
| Experience of new lifestyle | | | | 0.709 |
| Variety of historic/cultural sites | | | | 0.772 |
| Interest in places where popular television dramas and commercials were filmed | | | | 0.567 |
| Physical infrastructure | 2.850 | 17.810 | 0.835 | |
| Transportation convenience | | | | 0.822 |
| Accessibility | | | | 0.871 |
| Variety of lodging facilities | | | | 0.719 |
| Quality and cleanliness of convenient facilities | | | | 0.745 |
| Service quality | 2.673 | 16.704 | 0.820 | |
| Friendliness of local people | | | | 0.704 |
| Helpfulness of Welcome Center | | | | 0.841 |
| Reasonable price and service in lodging facilities and restaurants | | | | 0.854 |
| Availability of local travel information | | | | 0.564 |
| Relaxation and activities | 1.680 | 10.501 | 0.700 | |
| Beautiful natural landscape | | | | 0.627 |
| Peaceful and restful atmosphere | | | | 0.850 |
| Safety and variety of sports/outdoor recreation | | | | 0.574 |
| Kaiser–Mayer–Olkin (KMO) = 0.83, Bartlett’s test of sphericity = 1927.91(p < 0.00), total variance extracted (%) = 63.36 |
The CFA procedure was applied to verify the validity of the four dimensions. The value of the chi-square statistic is χ² = 63.96, with an associated significance value of
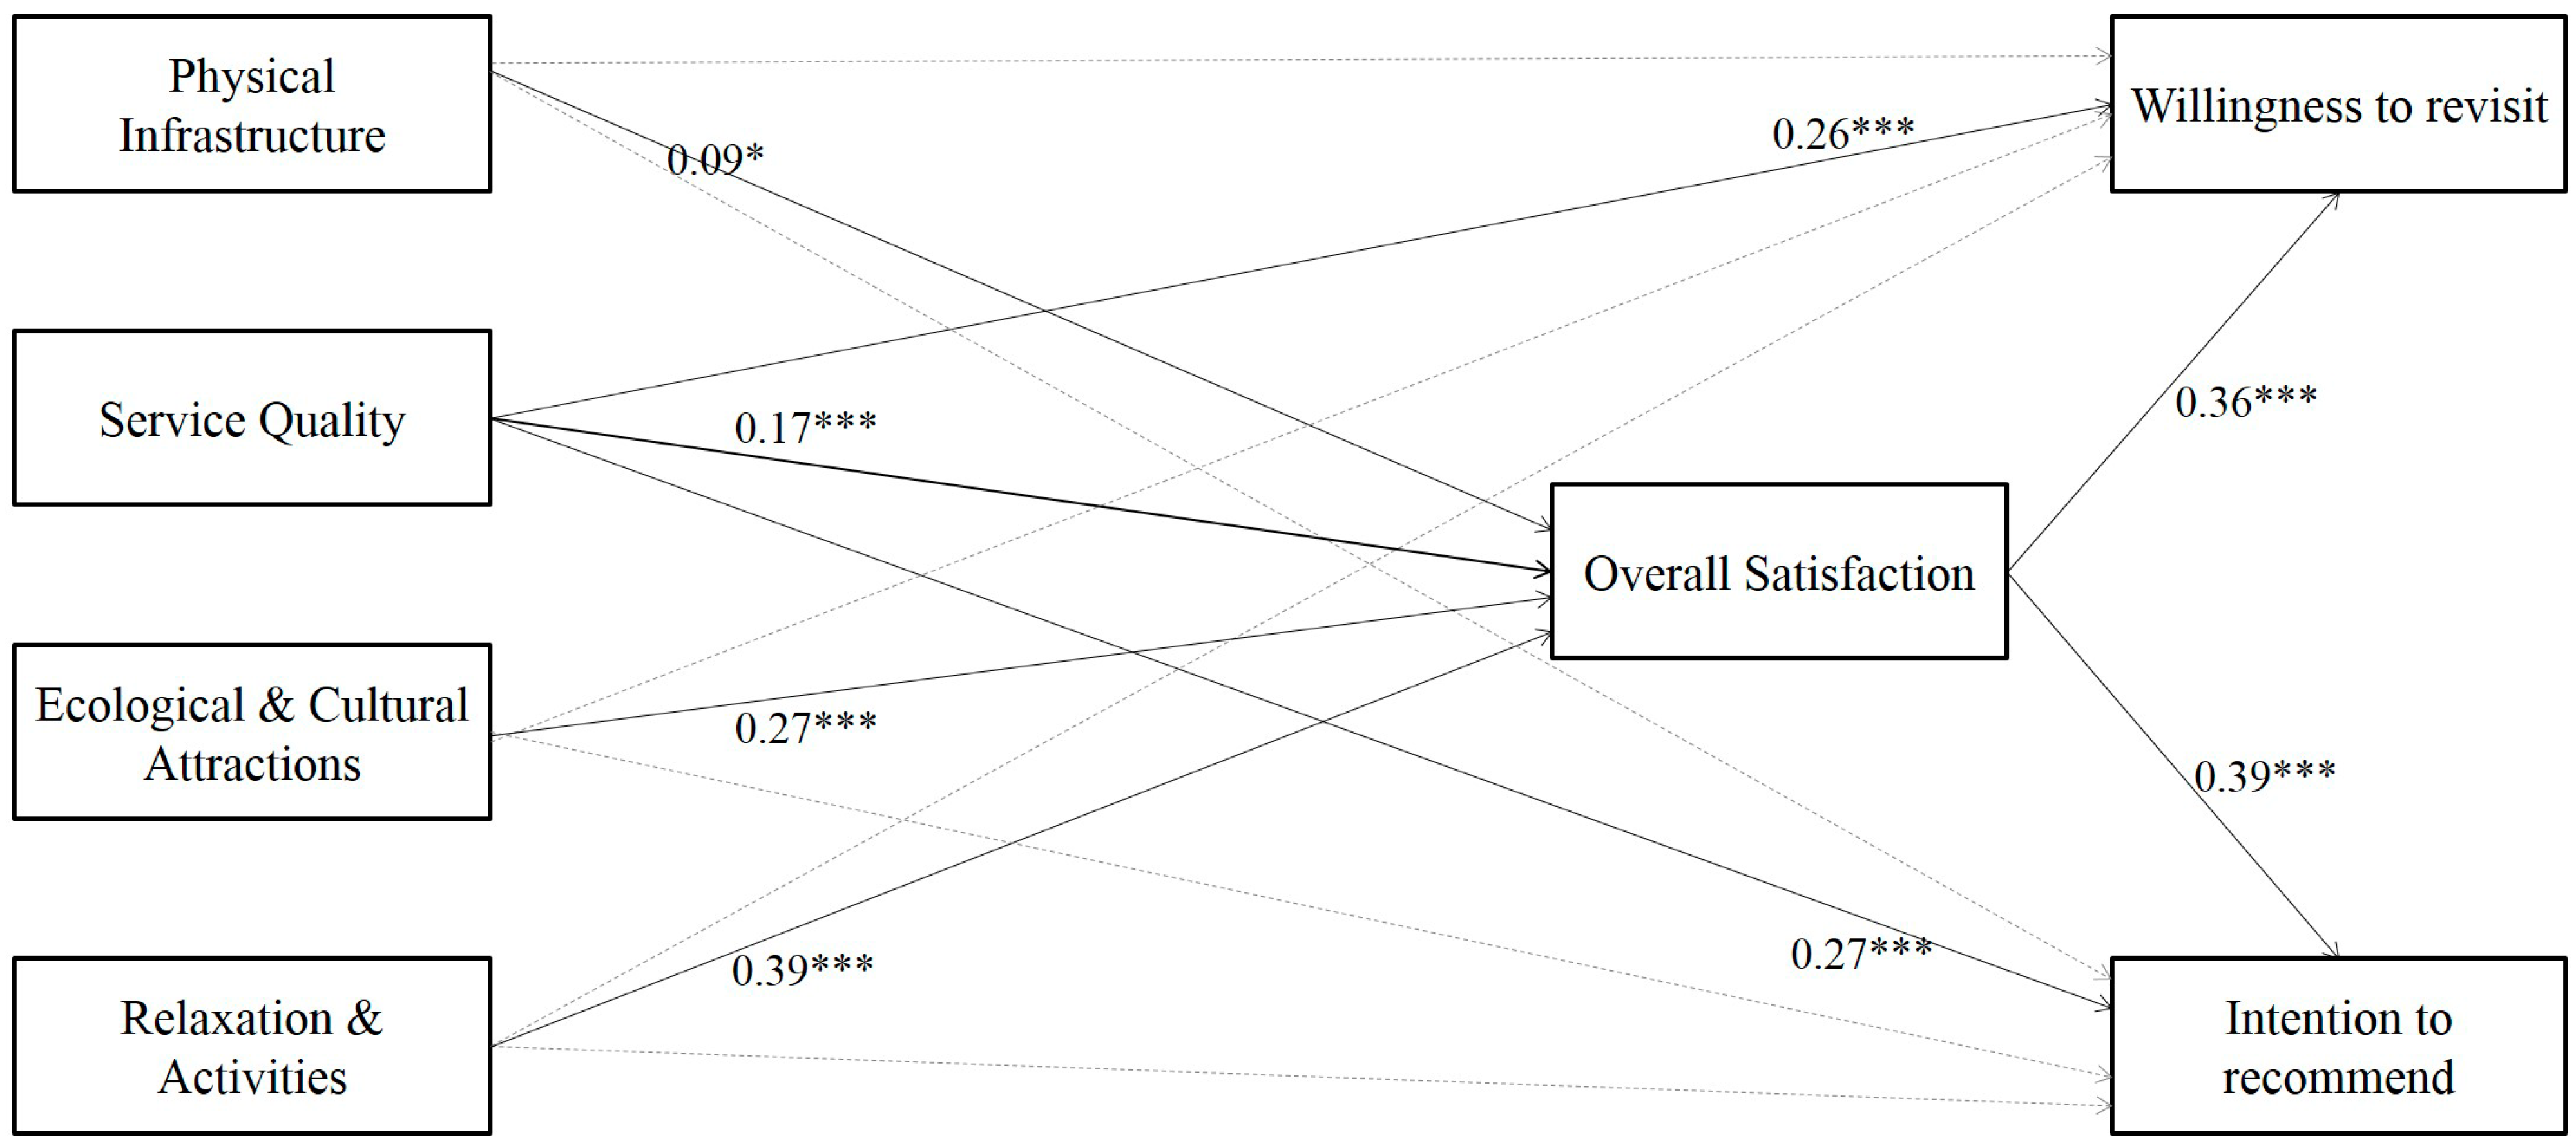
p = 0.0001. Since the factors satisfy the recommended standard level of the fit RMR (Root Mean Square Residual) < 0.05, GFI (Goodness of Fit Index) > 0.9, NFI (Normed Fit Index) > 0.9, CFI (Comparative Fit Index) > 0.9, it can be concluded that they have a relatively good fit (RMR = 0.05, GFI = 0.95, NFI = 0.90, CFI = 0.89). Looking into the effects of the contribution of satisfaction with destination attributes to the level of overall satisfaction, tourists’ overall satisfaction was related to the satisfaction with destination attributes, such as infrastructure, service quality and experience programs (
i.e., ecological and cultural attractions, and relaxation and activities) positively (
Figure 1 and
Table 5). Decisions on revisiting and recommending the tour had a significant relationship with the quality of services (
Table 5), and in both cases, the values of direct effects were greater than those of indirect effects (
Table 6).
Figure 1.
Standardized regression coefficient of the confirmatory factor analysis (CFA) model.
Figure 1.
Standardized regression coefficient of the confirmatory factor analysis (CFA) model.
Table 5.
Tourists’ overall satisfaction, revisitation and recommendation by satisfaction of destination attributes.
Table 5.
Tourists’ overall satisfaction, revisitation and recommendation by satisfaction of destination attributes.
| | | | Estimate | Standard Error | Construct Reliability | Significance |
|---|
| Physical infrastructure | → | Overall satisfaction | 0.09 | 0.05 | 1.87 | 0.06 * |
| Service quality | → | Overall satisfaction | 0.17 | 0.06 | 2.61 | 0.00 *** |
| Ecological and cultural attractions | → | Overall satisfaction | 0.27 | 0.06 | 4.95 | 0.00 *** |
| Relaxation and activities | → | Overall satisfaction | 0.39 | 0.07 | 5.97 | 0.00 *** |
| Physical infrastructure | → | Willingness to revisit | 0.08 | 0.06 | 1.19 | 0.24 |
| Service quality | → | Willingness to revisit | 0.26 | 0.09 | 2.92 | 0.00 *** |
| Ecological and cultural attractions | → | Willingness to revisit | 0.05 | 0.08 | 0.67 | 0.51 |
| Relaxation and activities | → | Willingness to revisit | 0.05 | 0.09 | 0.51 | 0.61 |
| Physical infrastructure | → | Intention to recommend | 0.01 | 0.05 | 0.16 | 0.87 |
| Service quality | → | Intention to recommend | 0.27 | 0.07 | 3.65 | 0.00 *** |
| Ecological and cultural attractions | → | Intention to recommend | 0.08 | 0.07 | 1.27 | 0.21 |
| Relaxation and activities | → | Intention to recommend | 0.05 | 0.08 | 0.58 | 0.56 |
| Overall satisfaction | → | Willingness to revisit | 0.36 | 0.08 | 4.56 | 0.00 *** |
| Overall satisfaction | → | Intention to recommend | 0.39 | 0.07 | 6.01 | 0.00 *** |
Table 6.
Effect coefficients of overall satisfaction, revisitation and recommendation by satisfaction of destination attributes.
Table 6.
Effect coefficients of overall satisfaction, revisitation and recommendation by satisfaction of destination attributes.
| Effect | Physical infrastructure | Service quality | Ecological and cultural attractions | Relaxation and activities | Overall satisfaction |
|---|
| Overall satisfaction | direct | 0.088 | 0.166 | 0.274 | 0.386 | - |
| indirect | - | - | - | - | - |
| Total | 0.088 | 0.166 | 0.274 | 0.386 | - |
| Willingness to revisit | direct | 0.076 | 0.255 | 0.052 | 0.048 | 0.358 |
| indirect | 0.031 | 0.06 | 0.098 | 0.138 | - |
| Total | 0.107 | 0.315 | 0.15 | 0.186 | 0.358 |
| Intention to recommend | direct | 0.008 | 0.266 | 0.082 | 0.045 | 0.392 |
| indirect | 0.034 | 0.065 | 0.107 | 0.151 | - |
| Total | 0.042 | 0.331 | 0.189 | 0.196 | 0.392 |
5. Conclusions
Previous domestic research has investigated the satisfaction levels of specific consumers; those who have visited rural tourist sites despite not only being categorized individually, but also family and community units. Furthermore, service satisfaction for physical infrastructure has been the focus. Therefore, it is not only hard to find the demands and needs of potential rural tourists, but also there is a limit to developing only physical elements to stimulate and enhance the rural tourist destinations. Revisitation to a destination is a crucial factor of rural tourism, and, thus, visitor satisfaction is important for sustainable rural tourism.
This study attempts to understand the travel patterns and preferences of visitors by identifying travel choices according to the types of companionship. Considering the fact that the purpose of traveling is to focus on leisure and cultural experiences, including relaxation, new strategies that can help advertise the cultural resources and activities of a tourist destination are necessary. There is a significant distinction in rural tourism’s purpose and length of stay, suggesting that it is necessary to diversify and differentiate tour programs for each travel companion type. An unwillingness to revisit may be related to low satisfaction levels with a destination. This result suggests that local communities related to rural tourism need to develop many interesting activities depending on travel purposes or tourists’ preferences, and this may offer options for future rural development.
The importance of tourist satisfaction makes it necessary to measure those factors influencing tourists’ satisfaction with different aspects of a destination and increase the likelihood of revisitation and recommendation. From these results, visitors’ intentions to revisit and intentions to recommend are influenced by the satisfaction level of local services, showing that there must be efforts to improve the quality of services in order to vitalize rural tourism. Providing high quality service and ensuring customers’ satisfaction are widely recognized as important factors leading to the success of regional tourism industries [
34,
60,
106]. Quality services and tourist satisfaction develop long-term relationships with tourists and, in turn, bring about destination loyalty [
63].
Information acquisition may be regarded as the starting point in the tourist decision-making process. Tourists spend a lot of time looking for information before choosing their tourist destination in order to reduce the uncertainty surrounding travel offers and tourist attractions. If we are assuming that tourists’ satisfaction occurs due to the difference between expectations and the reality of the tourist destination, then searching for tourist information will have a large influence on satisfaction. The preference for specific information sources may also influence not only potential tourists’ decision-making, such as travel destination and program choices, but also tourists’ satisfaction with a destination. Understanding tourists’ information search behavior provides tourism marketers with some evidence to support destination marketing and promotion. This study showed that Korean tourists prefer to respond to formal government sources, the Internet and word-of-mouth. Even more, these information sources can increase tourists’ satisfaction, implying that the positive correlation between tourists’ satisfaction and information source reflects the reliability and credibility of those sources. Furthermore, repeat visitors may be also influenced by these positive information sources, and tourist destination promotion will result in other economic incentives in rural areas. Regarding where marketers might dedicate resources to communicate with potential customers, they need to pay attention to understanding the potential differences in tourist searches in response to diverse environmental conditions.
This study generally focused on understanding the satisfaction, willingness to revisit and recommend and information preference of domestic Korean rural tourists based on a convenience sample. Unfortunately, it does not investigate the relationship between information search behavior and destination selection. Additional studies are needed to examine the reasons why tourists focus on specific information sources and their preferences in regard to information content.


