1. Introduction
The aim of this paper is to propose a new urban eco-logistic model that can be applied to a set of well-connected neighbouring cities that share the objective of implementing green deliveries to urban areas. In Europe, 80% of people live in urban areas. Because of the high population density, lack of infrastructure and pollution problems, urban freight transport faces many difficulties. City logistics identify ways to regulate access, circulation and the parking of commercial vehicles in urban centres and to implement policies without restrictions that harm economic and social prosperity and are conducive to relocation of economic activities and population [
1]. Such logistical activities are necessary for the harmonious growth of every urban area, even if they are also the main cause of pollution, noise and accidents. The “urban diseases” besetting modern cities are traffic congestion and environmental pollution [
2]. As highlighted in [
3], the rapid development of the demand for urban transportation has a negative impact on urban surroundings and on the environment. The situation is worsening with the increase of new trends in supply chain management (e.g., just-in-time delivery, fragmentation of loads), with small parcels often carried by “empty” vehicles [
4]. A recent study of EU countries shows that in 60% of cities, there are significant difficulties in terms of urban logistics management; 55% of vehicle emissions are caused by goods distribution and 40% of these goods is delivered to city centres [
3].
With regard to city logistics, four groups of key players can be identified [
5]:
retailers (shops, economic activities, etc.);
carriers and warehouse companies;
residents (inhabitants);
administrators (at national, regional and local levels).
All of them pursue different goals and have different points of view. Authorities and residents have the same problems (logistical externalities): crashes, traffic congestion, noise, air pollution, vibrations, etc. caused by trucks and small delivery vehicles, worsening both quality of life and the urban environment. On the other hand, carriers have to deliver/receive goods at the right time/quantity/quality and as cheaply as possible to maximise their profits. Moreover, they need to show their own brand (on circulating vehicles), advertising their presence to customers and often neglecting the related externalities. Finally, retailers demand improved logistical services in terms of city accessibility, on-time deliveries, storage and handling solutions.
These different demands make sustainability in urban logistics a challenging target.
The sustainability concept can be illustrated by the following question: how can a certain piece of freight be transported, in the most efficient and environmentally friendly mode, travelling the shortest distance and without loss of time from its origin to its destination at the urban area at minimal cost, using minimal land and causing minimal pollution [
6]? From an economic perspective, an activity is sustainable when all its related costs are covered by the incomes that it generates. From an environmental perspective, an activity is sustainable when it is harmonised, without negative effects or risks for the environment. Sustainable logistics, especially that focused on product distribution, is a research area developed since the 1990s [
7], and terms like eco-logistics are increasingly used to define a sustainable environmental logistics [
8]. In the field of eco-logistics, several topics have been developed and studied: closed loop supply chain and reverse logistic models [
9,
10] and methodologies to reduce vehicle use [
11] and/or to promote the use of clean vehicles [
4].
Sustainable urban logistics,
i.e., the application of sustainable methodologies to urban logistics, is a new research area. The imbalance between supply and demand in the urban transport system is becoming evident, especially because of the lack of land resources and environmental capacity. These circumstances further increase urban traffic, reducing average vehicle speed, increasing accident numbers and pollution [
12]. The reduction of carbon dioxide emissions is one of the most pursued targets in eco-logistics. According to the Transport, Energy and Carbon Dioxide: Towards Sustainable Development report of the International Energy Agency (2009), freight transportation causes about 25% of the total carbon dioxide emission [
13], and it is mandatory to reduce this negative effect on urban areas [
14] by reducing the number of vehicles and adopting a sustainable transportation model.
In the 2000s, several European cities tried to implement eco-logistic solutions to supply the economic activities located within their areas.
Table 1 reports the main results of this approach. A common result (or solution) is the outsourcing of
the last mile delivery from traditional carriers to a third party. All European projects are limited to a single urban area. For this reason, these projects can be defined as “last mile sustainable single city eco-logistic solutions.” This type of urban logistic model presents several benefits:
- -
a reduction of the traffic congestion as an effect of the reduction of circulating vehicles;
- -
a general reduction of the noise level, pollution and vibrations;
- -
a decrease in the number of deliveries per retailer (maintaining the goods required quantities);
- -
an increase of efficiency in transportation (a unique point, i.e., the transportation hub, serves all the retailers).
On the other hand, the main limitations are the following:
- -
each city has a dedicated transportation hub demonstrating that the applicability of the solution is limited to medium-large cities;
- -
the position of the transportation hub near the city centre can have a negative effect on traffic congestion, pollutant gas emissions and noise in urban areas;
- -
all the involved actors (retailers, carriers, residents, administrators) can maximise their advantage only if they adopt a cooperative strategy. The state of the art, however, is that freight companies are typically not available to collaborate and to outsource the last mile delivery to a third party for many reasons: the revenues are limited (the city centre area is narrow), their brand is not visible to the final retailers, they cannot perform door-to-door selling.
The final result is that (e.g., in the city of Vicenza) the application of sustainable urban logistics is possible only thanks to mandatory legislation promulgated by the local authorities.
This study proposes a new eco-logistic solution derived for similarity from the “last mile sustainable single city eco-logistic solutions” reported in
Table 1 but with some specific differences like a two-stage distribution network and a multi-city system. The novelty of this study is a significant level of new insights into the sustainable urban logistics in the case of (even very) small cities. In Italy, and also in the rest of the Europe, the most common situation is fragmented urban areas with a high number of nearby small city centres. As a result, finding an innovative sustainable urban logistic model that can be applied in these contexts is a challenging issue. This model is able to integrate the distribution of goods in a cluster of linked small cities located in the same area, where a considerable last part of the transportation (
i.e., the last 50 miles) is outsourced to a single centralised subject that performs green deliveries to urban areas. The basic hypothesis of our study is that in the considered area a certain number of well-connected neighbouring cities exist and share the objective of implementing a common last 50 miles eco-logistic system. The distance of 50 miles is in accordance with the typical dimension of an Italian province.
This solution overcomes the previously cited limitations and offers several benefits:
a single transportation hub serving more than one city can be located far from urban areas;
the possibility of collecting the deliveries sent to a large area (i.e., more than 2000 km2 in the presented case study) in a single transportation hub represents a great savings (in terms of time and cost) for the freight companies;
implementation of a simpler reverse logistics focused on the recycling of packages and wastes (the Eco Logistic Hub (ELH) collects the recyclable wastes).
The limitations of the proposed urban logistic model have been discussed in the conclusion section.
The area selected for this study and described in the last part of the paper is located in the province of Vicenza (northern Italy), covering its main cities (Bassano del Grappa, Thiene, Schio and Valdagno) in the foothills (the so-called Pedemontana Veneta zone). The study allows us to analyse the problem from all players’ points of view and to analyse both its economic and environmental profitability within a real multi-city context.
The paper is organised as follows:
Section 2 presents the proposed eco-logistic model.
Section 3 shows the used methodology while
Section 4 reports the Pedemontana Veneta. It shows as a first step the research of the “on-site” data collection, while
Section 5 reports as a second step the multi-scenario analysis for the economic and environmental profitability of the proposed model.
Section 6 presents the conclusion.
Table 1.
Main eco-logistic projects developed in European cities for sustainable urban transportation.
Table 1.
Main eco-logistic projects developed in European cities for sustainable urban transportation.
| City | Inhabitants | Project Year | Transportation Hub Details | Electric Vehicle | Natural Gas Vehicles | Handling Activities | Perishable Products | Traffic Limitations for Traditional Motorised Vehicles | Pollution Reduction | Project Cost [€] |
|---|
| La Rochelle [15] | 77,376 | 2001 | 1 hub 750 m2 | 9 | - | 90,000 items/year | No | | CO2: 1.6 ton/year | 760,000 |
| Barcelona [15] | 1,602,386 | 1997 | 2 hubs | - | - | | yes | Different limitations for each zone | - | |
| Kassel [15] | 198,589 | 1994 | 1 hub | - | - | 6 tons/day | no | | - | |
| Ferrara [15] | 133,398 | 2002 | 1 hub 7500 m2 (2500 m2 at low temperature) | - | 30 | | yes | Different limitations for vehicle type | - | 6,700,000 |
| Copenhagen [15] | 569,557 | 1996 | | - | - | | No | Different limitations for vehicle type | - | 270,000 |
| Leida [15] | 117,342 | 1997 | | 5 | - | | No | Different limitations for vehicle type | - | |
| Norimberga [15,16] | 490,085 | 1996 | 1 hub 1600 m2 | 1 | - | 750,000 items/year | No | | | |
| Siena [15,17] | 52,774 | 1999 | 1 hub 500 m2 | 6 | 12 | | No | every day 24/24 | - | 1,748,000 |
| Genova [15,18] | 592,995 | 2003 | 1 hub 700 m2 | 8 | 2 | 70,000 items/year | No | Different limitations for product type | - | 1,550,000 |
| Monaco [15,19] | 35,881 | 1989 | | N/A | N/A | | yes | every day 24/24 for weight >3.5 tons | - | |
| Padova [20,21] | 210,494 | 2004 | 1 hub 1000 m2 | - | 4 | 413,000 items/year | yes | Different limitations for each zone | CO2: 38.4 ton/year CO: 202 kg/year NOx: 163 kg/year VOC: 58.1/year PM10: 41.4 kg/year | |
| Vicenza [22,23] | 113,639 | 2003 | 1 hub 160 m2 | 6 | - | 47,000 delivery/year | yes | every day 24/24 | - | |
| Rome [24,25] | 2,874,038 | 2012 | 1 hub 9000 m2 | 15 | - | 1000 delivery/day | yes | working days 6:30–18:00 others 14:00–18:00 | - | |
| Utrecht [26] | 316,448 | 1994 | | 1 | - | N/A | yes | | CO2:51 ton/year | 711,000 |
| Lucca [27,28] | 89,204 | 2008 | 1 hub 1000 m2 | 2 | - | 1400 delivery/day | No | Different limitations for product type | CO2: −20%; CO: −10%; NOx: −18%; PM10: −27% | 1,423,000 |
| Parma [29,30] | 189,656 | 1995 | 1 hub 1500 m2 | - | 6 | 8700 delivery/year | yes | every day 7:30–19:30 | - | 2,050,000 |
| Stockholm [31] | 914,909 | 2001 | | - | 2 | 6000 delivery/year | yes | every day 06:00–11:00 | 100 ton CO2/year | |
| Hasselt [32] | 70,584 | 2013 | 1 hub 680 m2 | 2 | 1 | | No | | - | 45% private financing |
2. Urban Eco-Logistic Model Description
The traditional model for urban logistics typically has a distribution centre near the city centre where the products (perishable and non-perishable) are collected from the primary suppliers and then delivered to the retailers within the urban area (
Figure 1). The effects of such an organisation are the following:
vehicles used for high volume/weight are unsuitable for urban transportation
vehicle saturation can be low, especially when the number of customers in the same city centre is not high
the number of vehicles moving within the city centre can be very high, as well as the number of vehicles that perform a delivery to the same retailer
the total distance covered by all vehicles can be very high as an effect of the low transportation efficiency level.
All these conditions negatively affect the sustainability of urban logistics in terms of emissions, pollution, noise, vibrations and life quality.
Figure 1.
Traditional urban logistics.
Figure 1.
Traditional urban logistics.
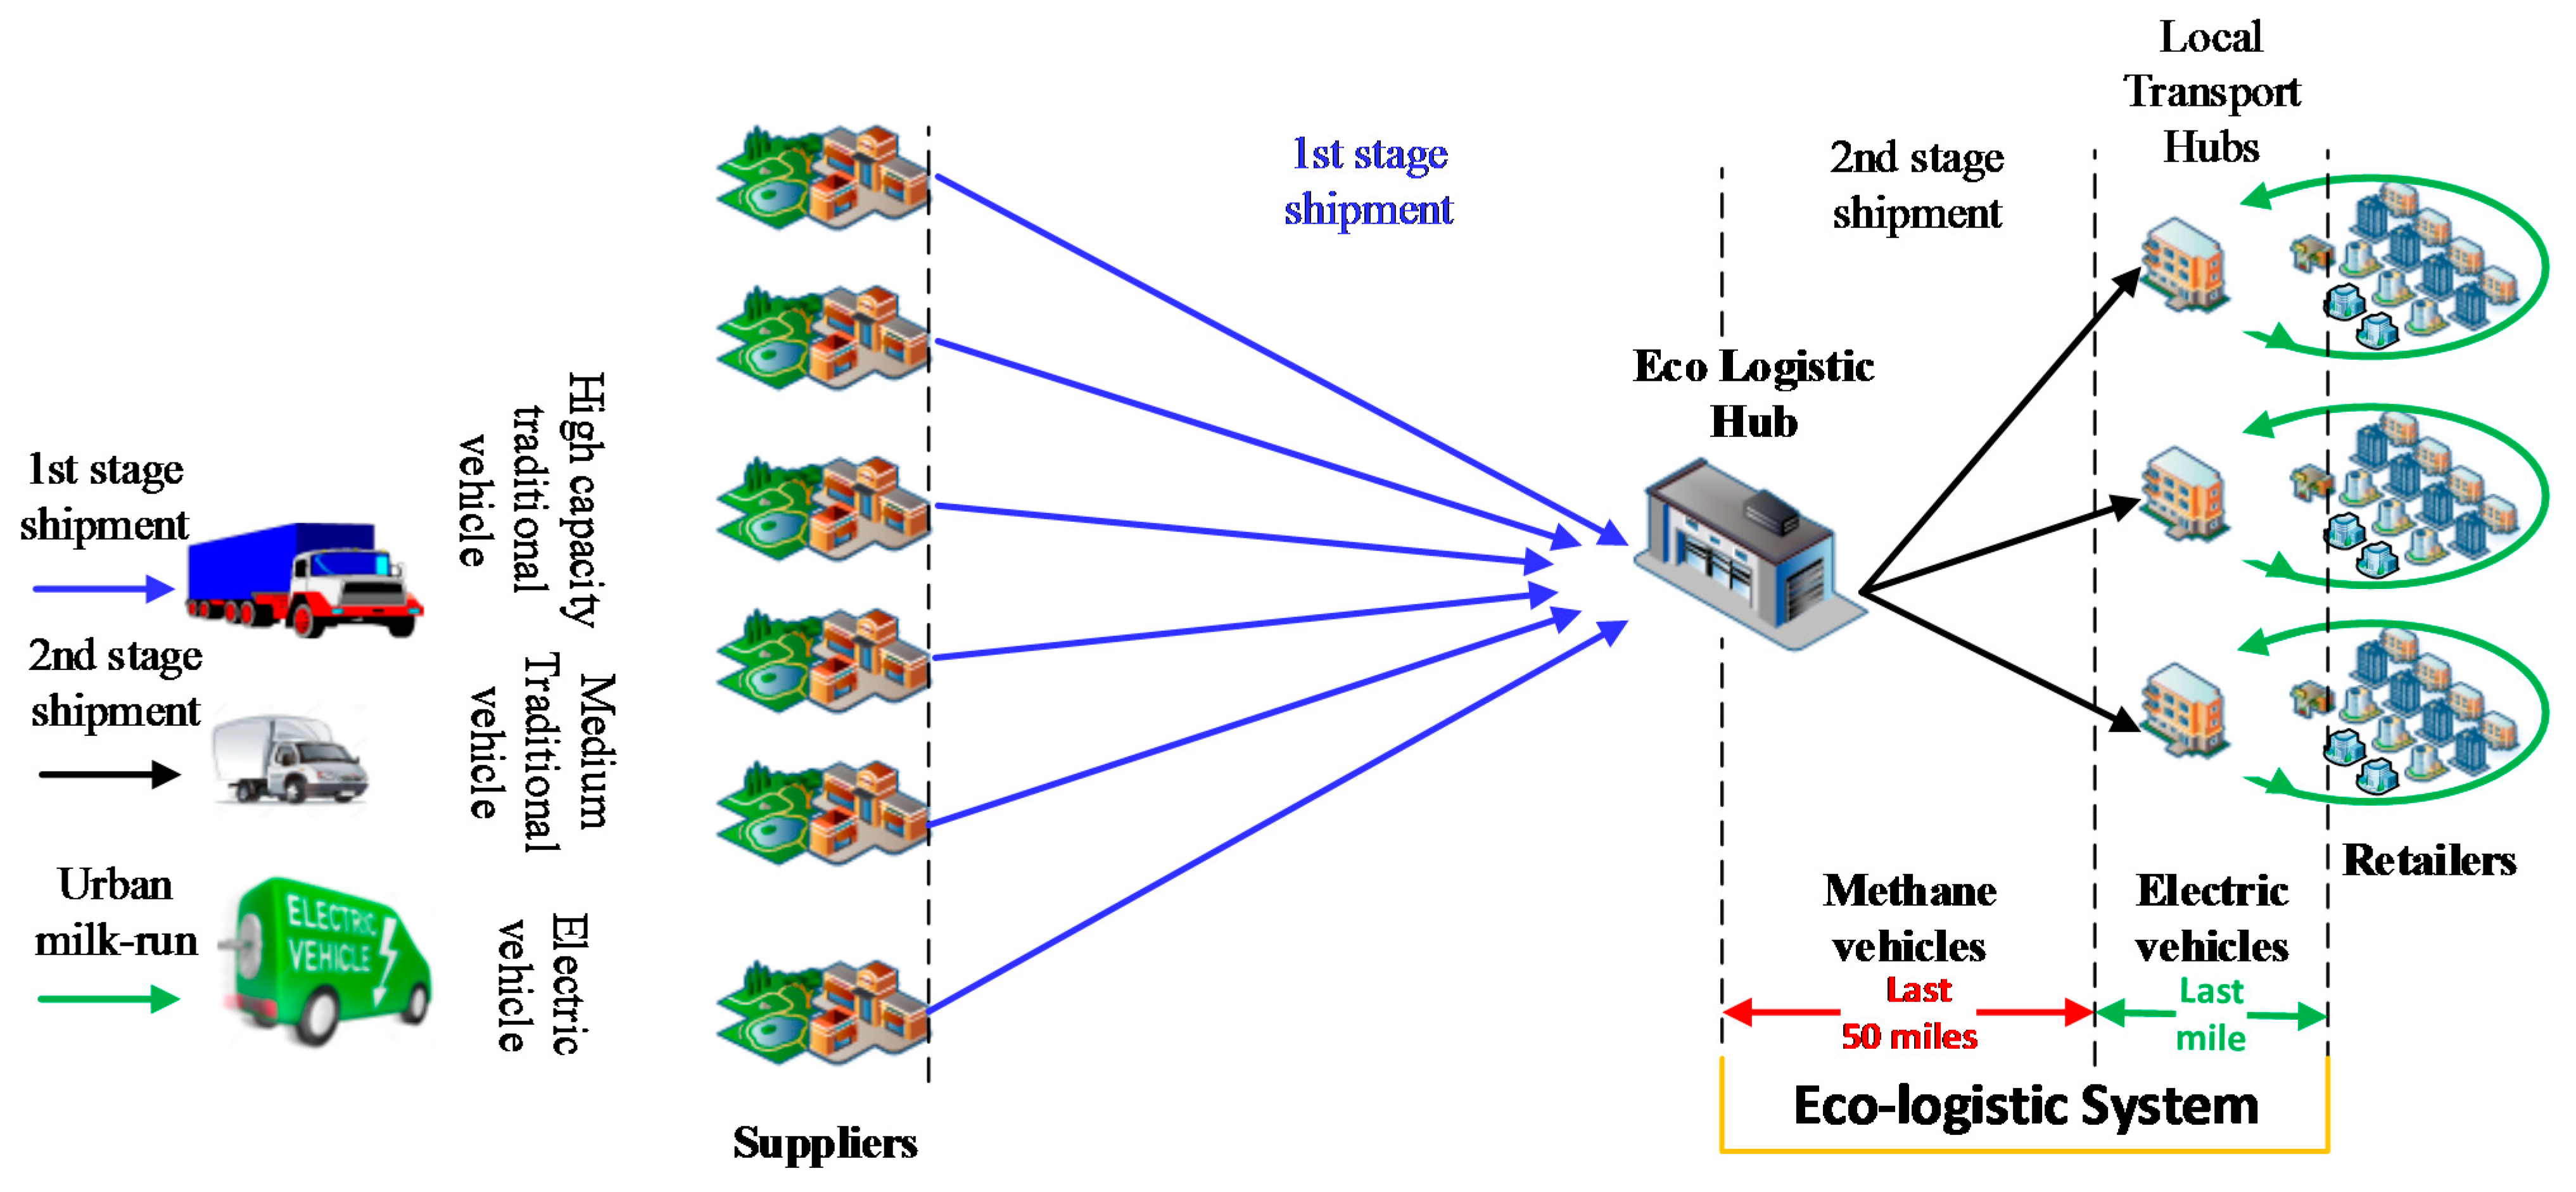
The new model for urban eco-logistics is designed to cover the last 50 miles of the journey to the final retailer and its structure is in
Figure 2. Its main features are the following:
the last 50 miles of transportation are outsourced to a third party that implements a sustainable urban logistics using electric vehicles;
the distribution network is composed of two stages: from the ELH to the Urban Transit Points (UTP) for each city and from each TP to the final retailers; there is a TP for each city close to the centre whereas the ELH is located in the barycentre of the area to be served;
the number of the involved cities is more than one; they are all located in the same area with good connections.
Figure 2.
Innovative urban eco-logistic system.
Figure 2.
Innovative urban eco-logistic system.
As mentioned in the literature review, several cities tried to adopt sustainable eco-logistic solutions. On the other hand, they implemented the so-called last mile delivery model, limiting the intervention area to a single urban area. The proposed model aims to implement a multi-city last 50 miles sustainable eco-logistic solution, overcoming the last mile delivery limitations. All the characteristics of the proposed approach are summarised in
Table 2, which further reports the basic differences, comparing the solutions applied in other European cities.
A fundamental condition necessary for the proposed solution is that all the involved actors (administrators, retailers, carriers, residents) could obtain a win-win result. Considering the last mile delivery approach, the main limitation is owed to carrier companies that are not available to outsource the last mile delivery to a third party. On the other hand, considering the proposed solution, the benefits achieved by retailers and freight carriers are greater. In fact, the outsourcing of the last 50 miles of transportation implies important cost saving for freight carriers as they can collect all deliveries for a large area (50 miles) from a unique point (ELH) with a substantial reduction in the travel distance. On the other hand, the possibility to include a greater number of retailers located in several cities allows the carriers to achieve important economies of scale in covering their fixed costs.
Table 3 summarises the main benefits of implementing the last 50 miles sustainable eco-logistic solution for all the involved actors.
Table 2.
Main characteristics of the proposed sustainable urban logistic model.
Table 2.
Main characteristics of the proposed sustainable urban logistic model.
| | Last 50 Miles Multi-City Sustainable Eco-Logistic Solution | Last Mile Sustainable Eco-Logistic Single-City Solution * |
|---|
| City Typology | Many involved small cities (and city centres), all located in the same country area (50 miles). These cities are well connected by expressways. | One medium/large city. |
| Number and Location of Hubs | One ELH located in the barycentre of the involved cities to serve and close to the main highways. | One or more hubs close to the city centre. |
| Distribution Network Characteristics | Two-level distribution network. First level from ELH to TPs, second level from TPs to the customers (retailers). There is a TP for each city close to the city centre. The ELH can store goods, offering an additional storage service to the retailers. The TPs do not store any item. They are used just for moving items from middle-high capacity green vehicles to small capacity electric vehicles adapted for the city centre. | One-level distribution network. From ELH close to the city centre to the customers (retailers). The ELH can store goods, offering an additional storage service to the retailers. |
| Logistics Characteristics | The traditional forward distribution network model is substituted by innovative reverse/closed loop logistics models; collecting solid recyclable wastes and e-commerce goods represents a further element of interest in the research. | The typical applied logistic model is the forward logistics model, with flows from suppliers to customers (retailers) without reverse flows. |
| Vehicle Characteristics | From the ELH green vehicles with middle-high volume capacity are moving to the TPs. From TPs a certain number of electric vehicles perform the last mile deliveries. | The used vehicles can be different. Low emission vehicles or electric vehicles. |
| Outsourcing Characteristics | All the freight companies deliver the goods assigned to the retailers to the ELH. All the activities within the ELH and for the final delivery are outsourced to a third party that implements sustainable urban logistics. | The basic approach is the same even if for some cities there is the possibility of the freight companies performing the last mile of deliveries using green vehicles. |
Table 3.
Main benefits of implementing the proposed sustainable urban logistic model.
Table 3.
Main benefits of implementing the proposed sustainable urban logistic model.
| Player | Benefits |
|---|
| Administrators | Reduction of pollution in the urban area and related health costs Reduction of street use and vibrations in historical buildings in the urban area and related maintenance costs Reduction of traffic congestion and noise in the urban area Improved liveability, with positive effect on tourism Positive effect on the administration’s and city’s image |
| Retailers | Reduction of the number of deliveries for day (maximum one per day) Time windows definition for deliveries to retailers according their constraints Increase in the offered services (storage, solid recyclable wastes and e-commerce goods collected through closed loop supply chain) |
| Freight carriers | Collection of the deliveries of a large area (50 miles) from a unique point (ELH) with a substantial reduction in the travelled distance Increased efficiency of picking activities in own warehouses and those of the transporters thanks to the centralisation of the deliveries in the ELH |
| Residents | Reduction of pollution, noise, vibration, traffic congestion in the urban area General improvement of liveability of the urban area |
Economic and Environmental Sustainability of the Proposed Urban Eco-Logistic Model
The economic and environmental sustainability of the proposed model can be derived by using the following mathematical model.
The two main functions considered are:
Equation (1) quantifies the total profits and Equation (2) the total saving in terms of equivalent CO2 emitted in the atmosphere and connected with the use of electric vehicles instead of the traditional fuel-driven vehicles for the last mile distribution.
The yearly revenues in Equation (1) are evaluated according to the following equations: Equation (3) defines the revenue due to handling operations for the outsourced storing service, Equation (4) defines the revenue due to shipping service, Equation (5) defines the revenue for the outsourced storing service.
The yearly costs for the implementation and use of the eco-logistic system are as follows: Equation (6) defines the total rent cost for the warehouse building, Equation (7) defines the cost of labor, Equation (8) defines the cost of vehicles. M is divided by
, the average density of the beverage products (that is typically 1000 kg/m
3) in order to obtain the average delivery volume for non-beverage products.
The number of operators employed in the warehouse activities (handling, loading/unloading) are defined in Equation (9). Equation (10) reports the drivers of methane vehicles while Equation (11) reports the drivers of electric vehicles.
To compute Equation (2), the terms
are evaluated in Equations (12) and (13) on the basis of the Ecoinvent v.2.0 database [
33] and the following equations:
4. Step 1: “On Field” Data Collection
The Pedemontana Veneta is an important highway, about 100 km long, designed to connect the industrial districts of Vicenza and Treviso in the north-east of Italy. It links up Montecchio Maggiore (Vicenza province) with Spresiano (Treviso province) through the industrial districts of Thiene-Schio, Bassano del Grappa and Treviso. The possibility of quickly connecting small cities has induced the transportation sector and the local authorities to review the urban logistics of the Pedemontana Veneta area, especially in the Vicenza province, where several small cities are located. In this context, a feasibility study applying the innovative “last 50 miles sustainable eco-logistic solution” is developed.
Figure 3 details the Pedemontana Veneta highway, highlighting all the cities that are (or could be in the near future) involved in the urban logistic review.
Four different representative cities in the area, located along the Pedemontana Veneta highway, were investigated: Bassano del Grappa (urban population 70,000 inhabitants), Thiene (25,000 inhabitants), Schio (40,000 inhabitants.) and Valdagno (26,500 inhabitants). They represent the most important cities in terms of traffic flows, retailers and dimensions (
Table 4).
The ELH is located in a barycentre position [
34,
35] and the UTP locations are in the urban proximity (last mile) of each city (see
Figure 3). Moreover, considering the future locations to be served (green points,
i.e., new cities to be included) and the highway positions (A31 highway and Pedemontana Veneta), this decision is further reinforced.
Figure 3.
Pedemontana Veneta: analysed cities (red) and potential cities for inclusion (green).
Figure 3.
Pedemontana Veneta: analysed cities (red) and potential cities for inclusion (green).
As defined in the previous section “on field” research has been developed using a questionnaire. The aim of the questionnaire is to collect the main variables to develop the economic and environmental profitability of the proposed urban eco-logistic model. About the urban retailer survey, 407 questionnaires were filled, covering about the 33.9% of the total statistical population of about 1200 retailers working within the considered urban areas.
Table 4.
Involved cities.
Table 4.
Involved cities.
| City | Inhabitants | Total Area [km2] | Urban City Centre [km2] | Number of Central Retailers | Position [Lat, Long] |
|---|
| Bassano del Grappa | 43,000 | 40.60 | 12.5 | 700 | 45°46′07″ N 11°44′12″ E |
| Schio | 40,000 | 60.22 | 7.0 | 200 | 45°43′00″ N 11°22′00″ E |
| Thiene | 24,000 | 19.7 | 4.5 | 200 | 45°42′26″ N 11°28′43″ E |
| Valdagno | 26,500 | 50.22 | 4.0 | 100 | 45°39′00″ N 11°18′00″ E |
The main findings are as below.
Figure 4 presents the retail sector distribution.
Figure 4.
Retail type distribution in the four cities.
Figure 4.
Retail type distribution in the four cities.
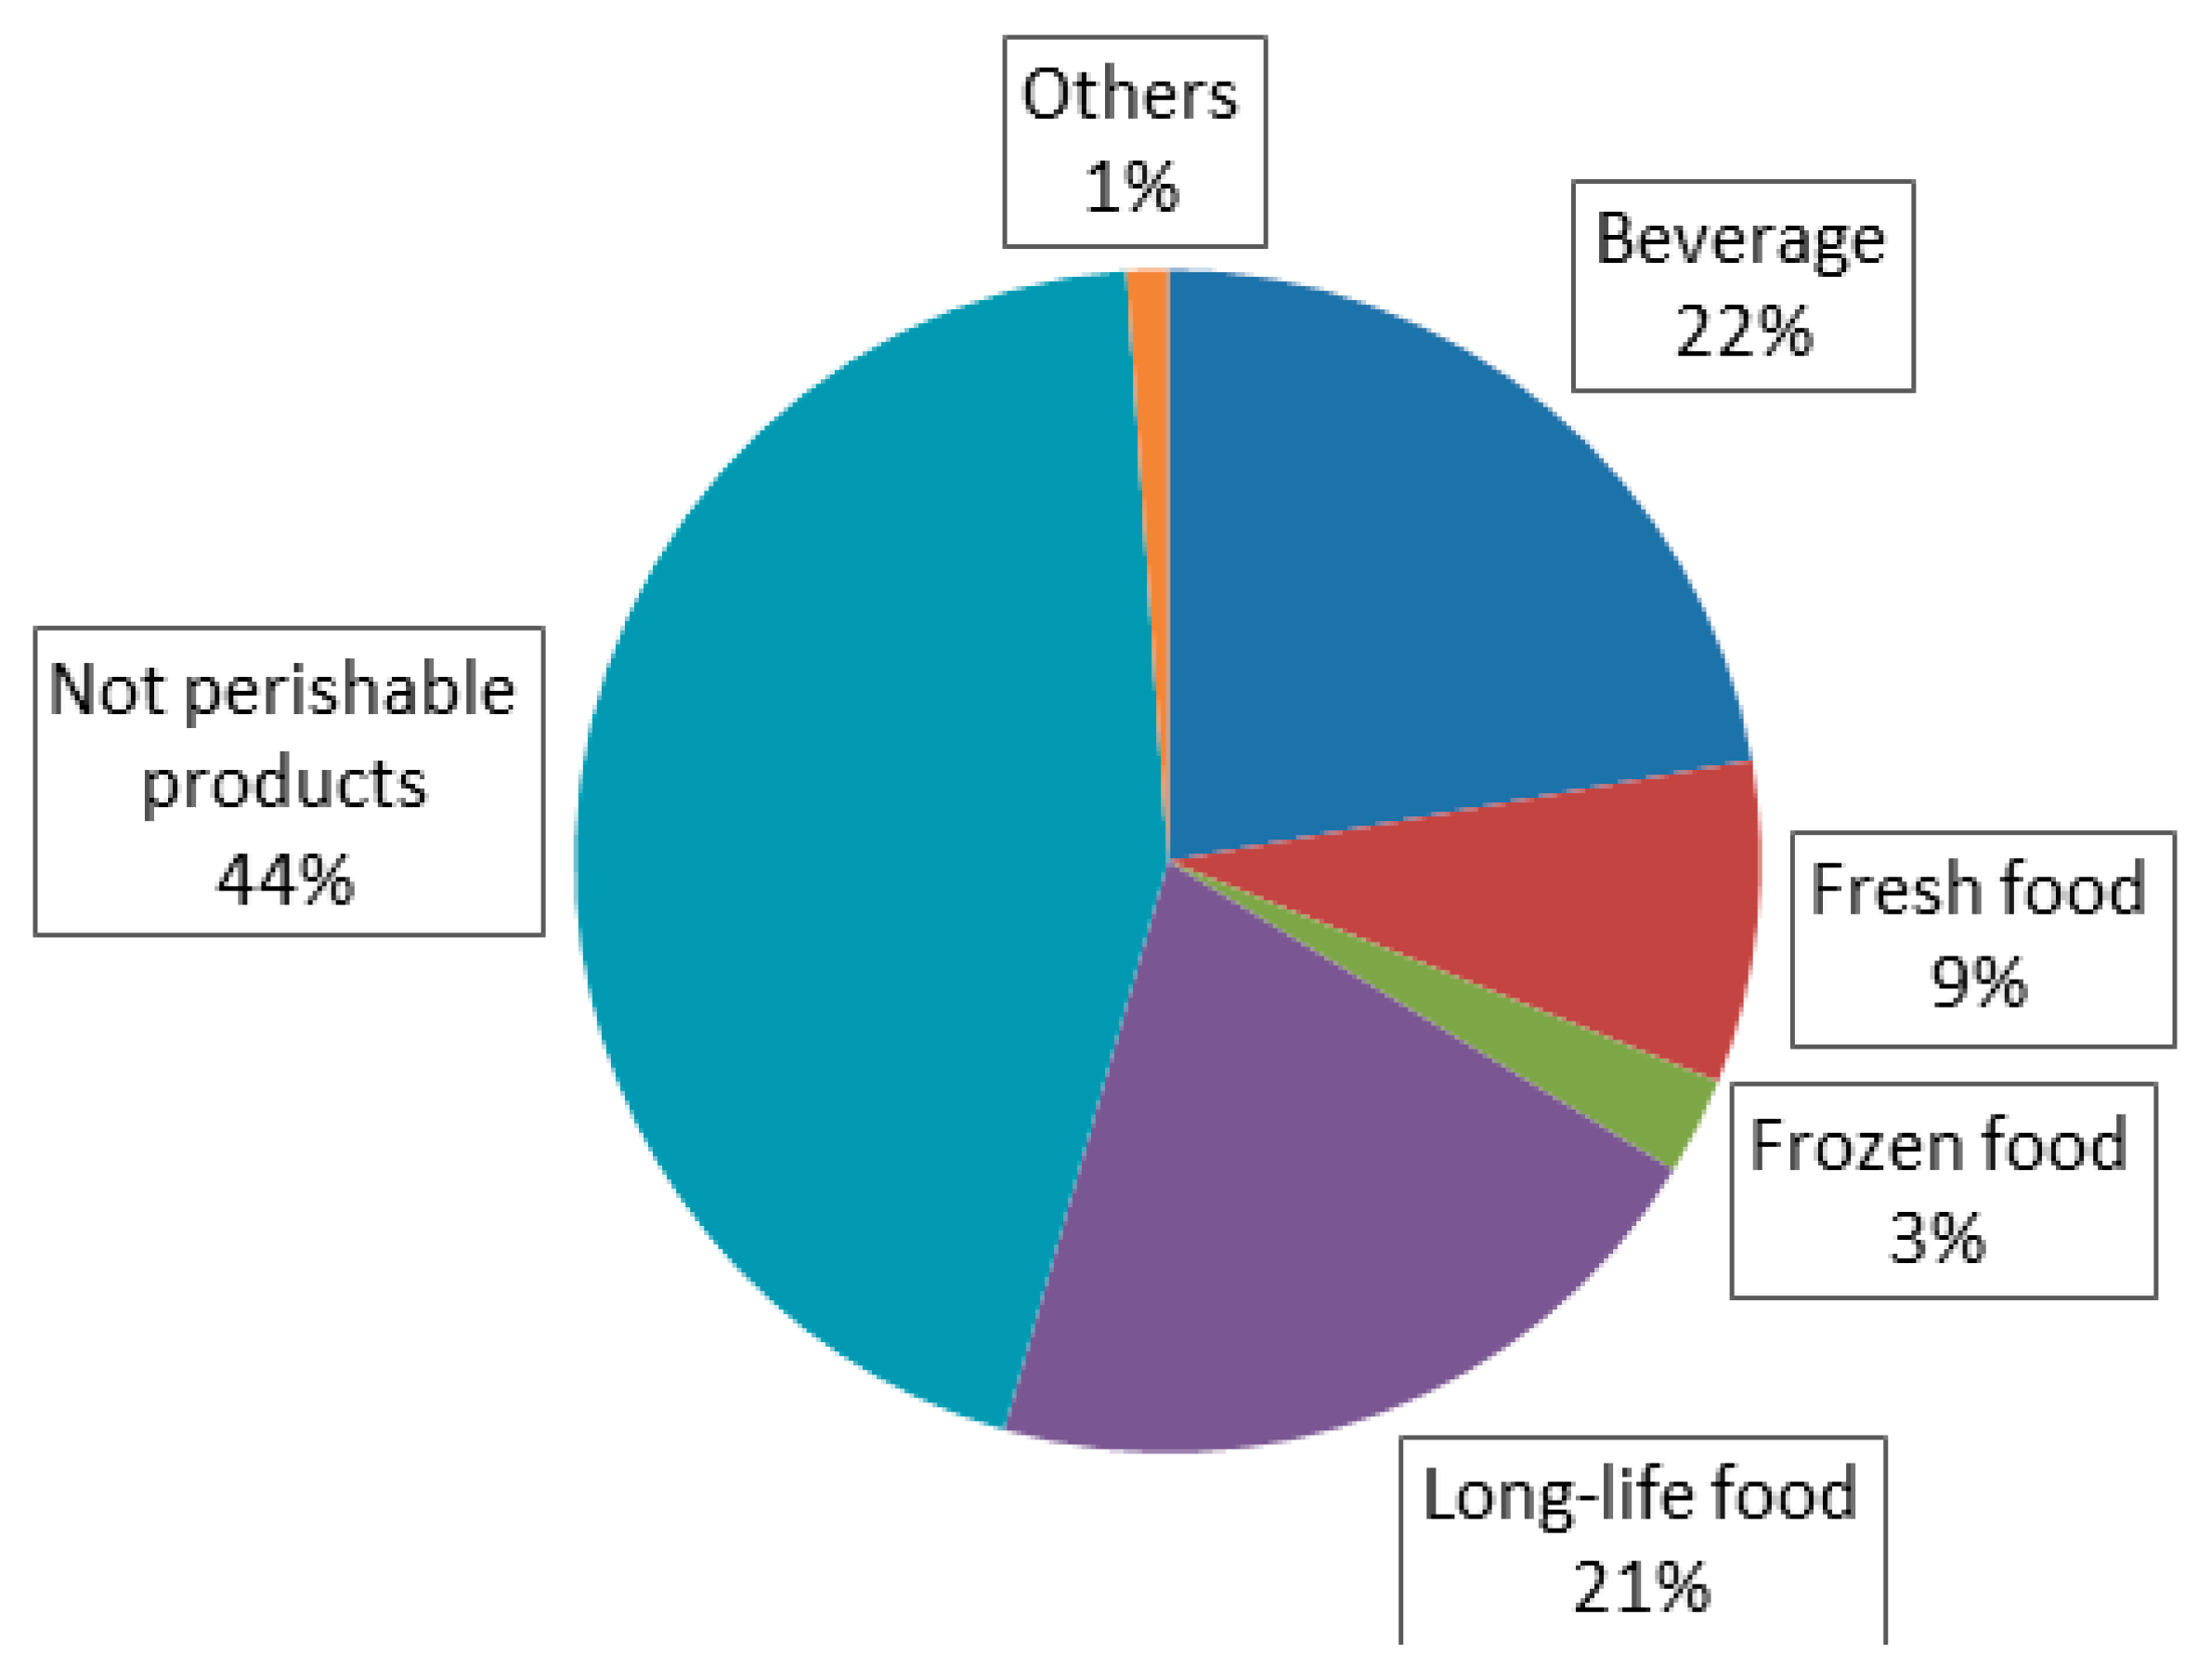
Figure 5 shows the incidence, per product sector, of the products sold in the city centres. Goods that do not require temperature controlled delivery (non-perishable products, long-life food and beverage) account for 87% of the total deliveries, while the total food sector occupies 55% of the market. These data are the results of the questionnaire survey. Finally,
Table 5 reports some key survey findings for the eco-logistic distribution system in the Pedemontana Veneta case.
Figure 5.
Product sector distribution in the four cities.
Figure 5.
Product sector distribution in the four cities.
Table 5.
Survey findingS for the eco-logistic distribution system in the Pedemontana Veneta case.
Table 5.
Survey findingS for the eco-logistic distribution system in the Pedemontana Veneta case.
| City | N° Surveys | Average Delivery Interval [Days] | Average Freight Quantity | Average Freight Volume [m3/Week] |
|---|
| Not Beverage [kg/Week] | Beverage [kg/Week] |
|---|
| | | Average | Std. Dev. | Average | Std. Dev. | Average | Std. Dev. | Average | Std. Dev. |
| Bassano del Grappa | 103 | 5.07 | 1.81 | 56.54 | 25.64 | 16.48 | 13.25 | 1.625 | 0.477 |
| Schio | 124 | 5.82 | 1.88 | 63.79 | 30.99 | 16.33 | 15.20 | 1.625 | 0.505 |
| Thiene | 11 | 4.65 | 1.79 | 53.18 | 26.63 | 16.09 | 13.37 | 1.638 | 0.445 |
| Valdagno | 70 | 4.82 | 1.77 | 53.71 | 28.69 | 17.50 | 14.18 | 1.603 | 0.465 |
| Total | 407 | 5.14 | 1.82 | 57.44 | 28.85 | 16.54 | 14.30 | 1.624 | 0.47 |
5. Step 2: Multi-Scenario Analysis
A multi-scenario approach has been developed as the second step.
Table 6 defines the context in which the problem is defined showing the values in accordance with the market.
Table 7 shows the key design parameters and their potential range of variation, in accordance with what was collected in Step 1 (
Table 5).
Table 6.
Pedemontana Veneta case parameters.
Table 6.
Pedemontana Veneta case parameters.
| Parameter | Value | Parameter | Value |
|---|
| 200,000 [€/year] | | 20 [m3] |
| 5,000 [€/year vehicle] | | 0.8 |
| 35,000 [€/(man year)] | | 0.5 [1/day] |
| 6 [€/pallet slot] | | 5 [min/delivery] |
| 2 [€/pallet handled] | w | 48 [week/year] |
| 6,000 [€/year forklift] | | 2 [h] |
| 6,000 [€/year vehicle] | | 20 [km/h] |
| 5 [min/pts] | | 100 |
| 2.5 [kg/h] | | 0.25 [min/UL] |
| 7 [h/charge] | | 2.5 [m3/UL] |
| 22 [kWh/charge] | | 1 [m2/UL] |
| 0.365 [kgCO2 eq/km] | | 0.96 [min/day] |
| 0.611 [kgCO2 eq/kgfuel] | | 120 [€/(m2 year)] |
| 0.443 [kgCO2 eq/kWh] | l | 4 |
| ρ | 300 [kg/m3] | | 100 [m2] |
| 5 [min/pts] | | |
Table 7.
Multi-scenario parameters.
Table 7.
Multi-scenario parameters.
| Parameter | Values | Parameter | Values |
|---|
| [1; 3; 5; 10; 15] [pallet] | | [4; 8; 12; 16; 20; 24; 28; 32] [kg/delivery] |
| [2; 3; 4; 5; 6; 7] [€/delivery] | | [300; 600; 900; 1200; 1500; 1800; 2100] |
| f | [0.5; 1; 1.5; 2; 5] [deliveries/week] | | [1; 1.3; 1.6; 1.9; 2.1; 2.4; 2.7; 3] [m3/delivery] |
| [5; 10; 15; 20] [m] | | [1; 3; 5; 10; 15] [m3] |
| [1; 5; 10] [%] | | [0.02; 0.03; 0.04; 0.05; 0.06] [€/kg] |
The main results of this analysis are shown in
Figure 6 and depict the economic profitability of the proposed eco-logistic system. The profits (P) were analysed as a function of fixed delivery charge
and the variable delivery charge
, varying
, given
min,
, PT = 1 pallet,
[delivery/week],
[m
3/delivery] and
[kg/delivery] according to the survey findings of
Table 5.
The green area represents positive profits while the red area represents negative conditions. Considering the equilibrium case,
, the increasing of
increases the feasibility range for the fixed and variable charges. For this case study, the four cities accounted for 1200
(see
Table 4). The result was that feasible charges are, for example,
. [€/delivery] and
. [€/kg]. These values are in accordance with the freight distribution market of northern Italy.
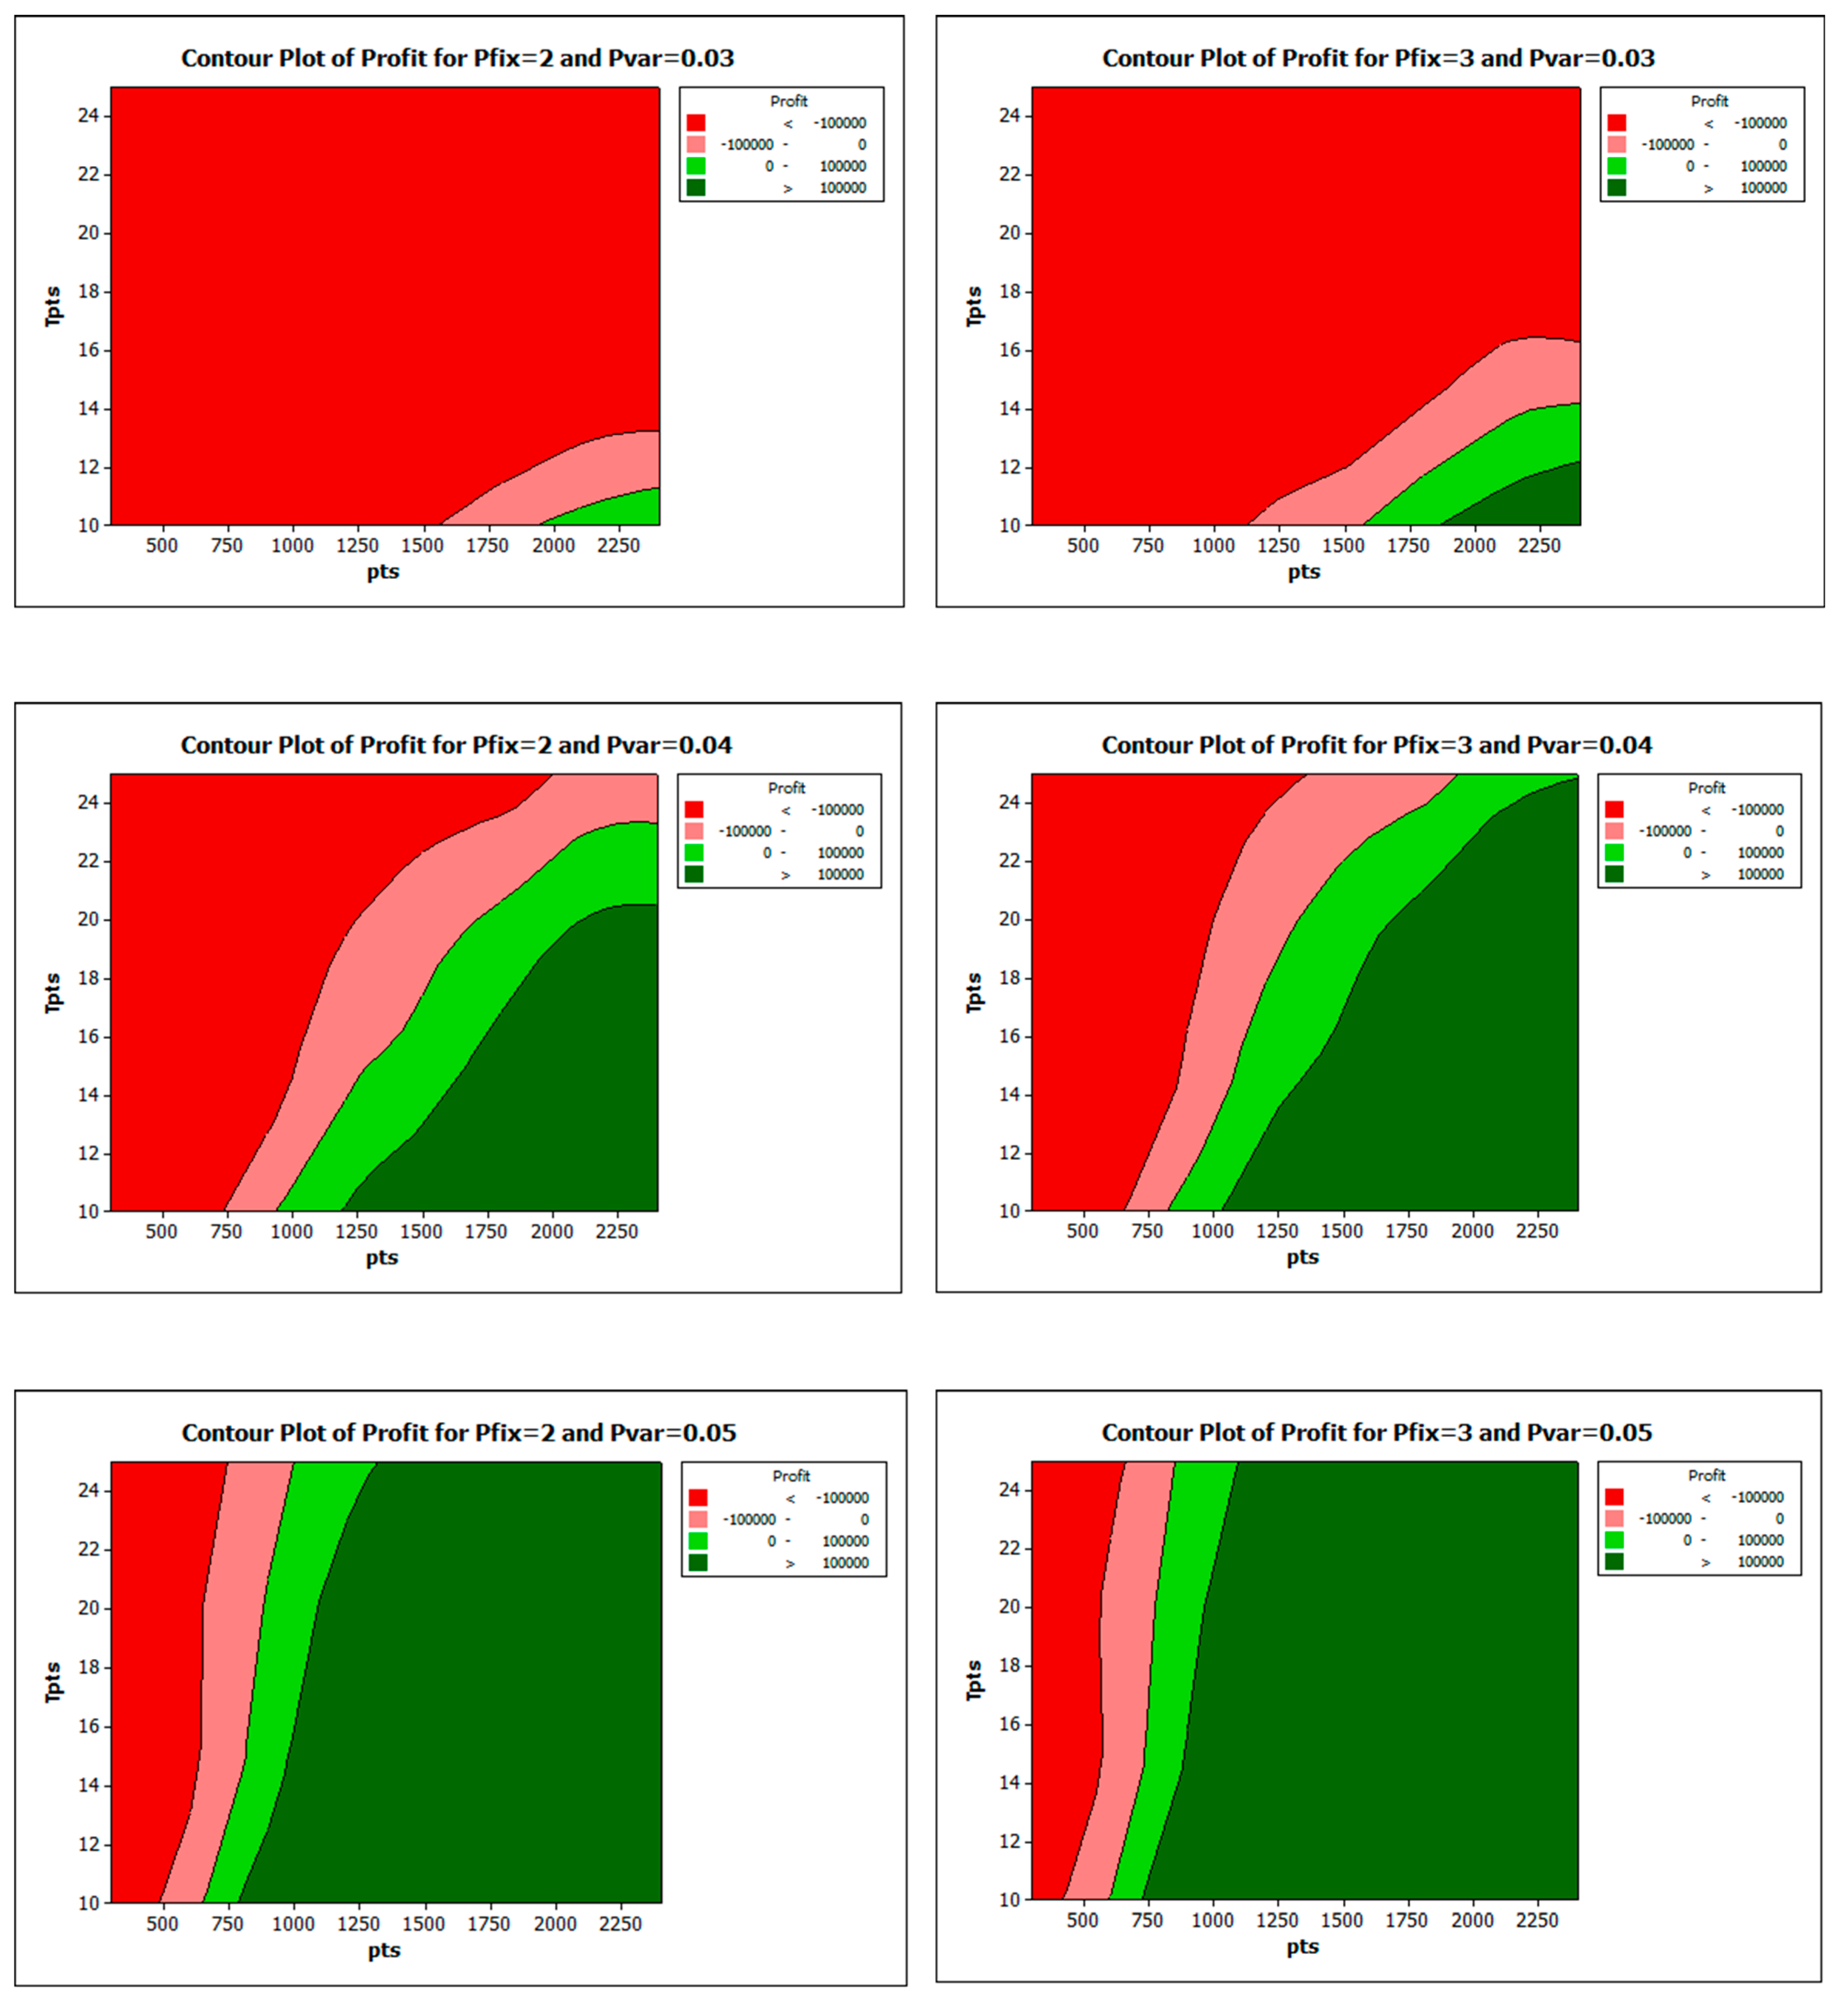
Figure 7 depicts the profitability conditions in terms of points to be served,
, and delivery time,
, ranging
and
according to the previous considerations. The figures show that in the case of
and
or
and
the economic sustainability (P>0), for
>800, is not strongly influenced by
. Conversely, in the case of
,
,
and
the economic sustainability is substantially affected by
and
. Finally, in the case of
,
,
and
the economic sustainability is generally not guaranteed. The values of charges that make the proposed urban logistic model sustainable are perfectly aligned with the market costs of distribution.
Considering the environmental impact of the eco-logistic system, and applying the model of Equation (2), the gas emission savings (measured in [kgCO
2eq/year]) deriving from the adoption of electric vehicles for the last mile distribution are evaluated.
Figure 8 shows
varying
. The environmental benefits are relevant and in the case of study condition (
), the emission savings are potentially over 168,000 [kgCO
2eq/year]. This level of CO
2 saving corresponds to 84% of the actual annual CO
2 emissions, demonstrating how the application of such a logistic model can radically change the environmental impact of urban distribution.
The economic sustainability of the proposed urban logistic model is strongly influenced by the number of points to be served (see the results reported in
Figure 6,
Figure 7 and
Figure 8) and the CO
2 equivalent emission savings demonstrate how the application of such a logistic solution can improve the environmental impact of urban distribution. Considering the market costs of delivery charges, the breakeven amount of points to be served is about 1000 making the proposed model profitable. Moreover, the possibility of involving a wider area allows important scale economies, enforcing its economic and environmental impact. As a consequence, the local administrators and all the other involved key actors (retailers, carriers and warehouse companies) have to collaborate on overtaking the traditional single city logistics, towards the proposed multi-city logistcs concept. In this context, the main and most difficult change is the integration of several urban city areas in a unique distribution platform that need a unique integrated local legislation. The future steps of this research will reveal if the local politicians of such different but close cities will be able to reach this target.
Figure 6.
Economic profitability of fixed and variable . charge of the eco-logistic system, given .
Figure 6.
Economic profitability of fixed and variable . charge of the eco-logistic system, given .
Figure 7.
Economic feasibility of the eco-logistic system: vs. (ranging and ).
Figure 7.
Economic feasibility of the eco-logistic system: vs. (ranging and ).
Figure 8.
Gas emission savings, Etot from the eco-logistic system in the Pedemontana Veneta case ( [min/delivery]).
Figure 8.
Gas emission savings, Etot from the eco-logistic system in the Pedemontana Veneta case ( [min/delivery]).
6. Conclusions
Because of the high population, lack of infrastructure and pollution problems, urban freight transport faces a lot of difficulties. For this reason, several EU cities have tried to implement eco-logistic solutions. Each of them uses a similar model with a single and large transportation hub, where the consolidated last mile deliveries are outsourced.
This study’s novelty is the implementation of a new eco-logistic solution able to integrate the distribution of goods in a cluster of linked small cities, where the last relevant part of transportation (the last 50 miles) is outsourced to a single centralised subject that performs green deliveries to urban areas. The distribution network is composed of two travel stages. The former is from the eco-logistic hub (located in a barycentric position) to the urban transit point of each city; the latter is from the transit point to the final retailer. The application of the proposed urban logistics is investigated through a feasibility study within the Pedemontana Veneta area (northern Italy), involving four different cities,
i.e., Bassano del Grappa, Thiene, Schio, and Valdagno. The general outcomes are as follows:
the proposed urban logistic model overcomes the limitation of the last mile sustainable urban logistics already applied in different EU cities, permitting the integration of several small cities and increasing the achievable benefits for traditional carriers;
the economic sustainability of the proposed urban logistic model is strongly influenced by the number of points to be served; the possibility of involving a wider area allows important economies of scale, enforcing its profitability;
the economic sustainability of the proposed urban logistic model is demonstrated by the analysis of the applicable charges; the values of charges that make it sustainable are aligned with the market costs of distribution;
the CO2 equivalent emission savings are about 84% in respect of the same distribution executed by diesel or methane vehicles; this demonstrates how the application of such a logistic model can improve the environmental impact of urban distribution.
On the her hand, there are some limitations in the proposed urban logistics model.
It is based on a multi-city system. This model assumes a perfect collaboration between all the involved cities and their key actors (administrators, retailers, residents carriers and warehouse companies) in making a “sustainable urban area.” In reality, this could be a slow process that needs different steps of integration, communication and objectives sharing. Secondly, in the economic sustainability analysis of the proposed eco-logistic model it has considered the investment in new facilities (considering the related annual costs) but not the investment of changing the system. Costs related to the initial integration, communication and collaboration of the different involved cities to ramp up the new system, even if difficult to compute, can not be negligible.
Future research steps are as follows:
Step 1: the sensitising of the area administrators to the achievable results, highlighting how the proposed logistic model, economically sustainable with just four cities involved, can be applied to include other cities;
Step 2: consensus among the involved administrations leading to the final design of urban distribution according to the proposed model.


