2. Methods and Data
According to Odum’s idea of energy hierarchy, in which all energy transformations can be arranged in a hierarchy from sunlight to electrical power (requiring many joules of the former to obtain one joule of the latter), a central concept is the unit emergy value, the amount of emergy needed to produce one unit of output [
36]. Transformity, defined as the amount of seJ required to produce one joule of available energy at the output, is the most widely used unit emergy value, but other values such as specific emergy (expressed in seJ/g) and emergy per unit of currency (seJ/$) are also frequently used [
37]. From the unit emergy values of rain, wind, fossil fuels, minerals and so on, other natural and human-made products have been analyzed and many more unit values have been estimated, which in turn have been used in more detailed analyses of different kinds [
24,
38,
39].
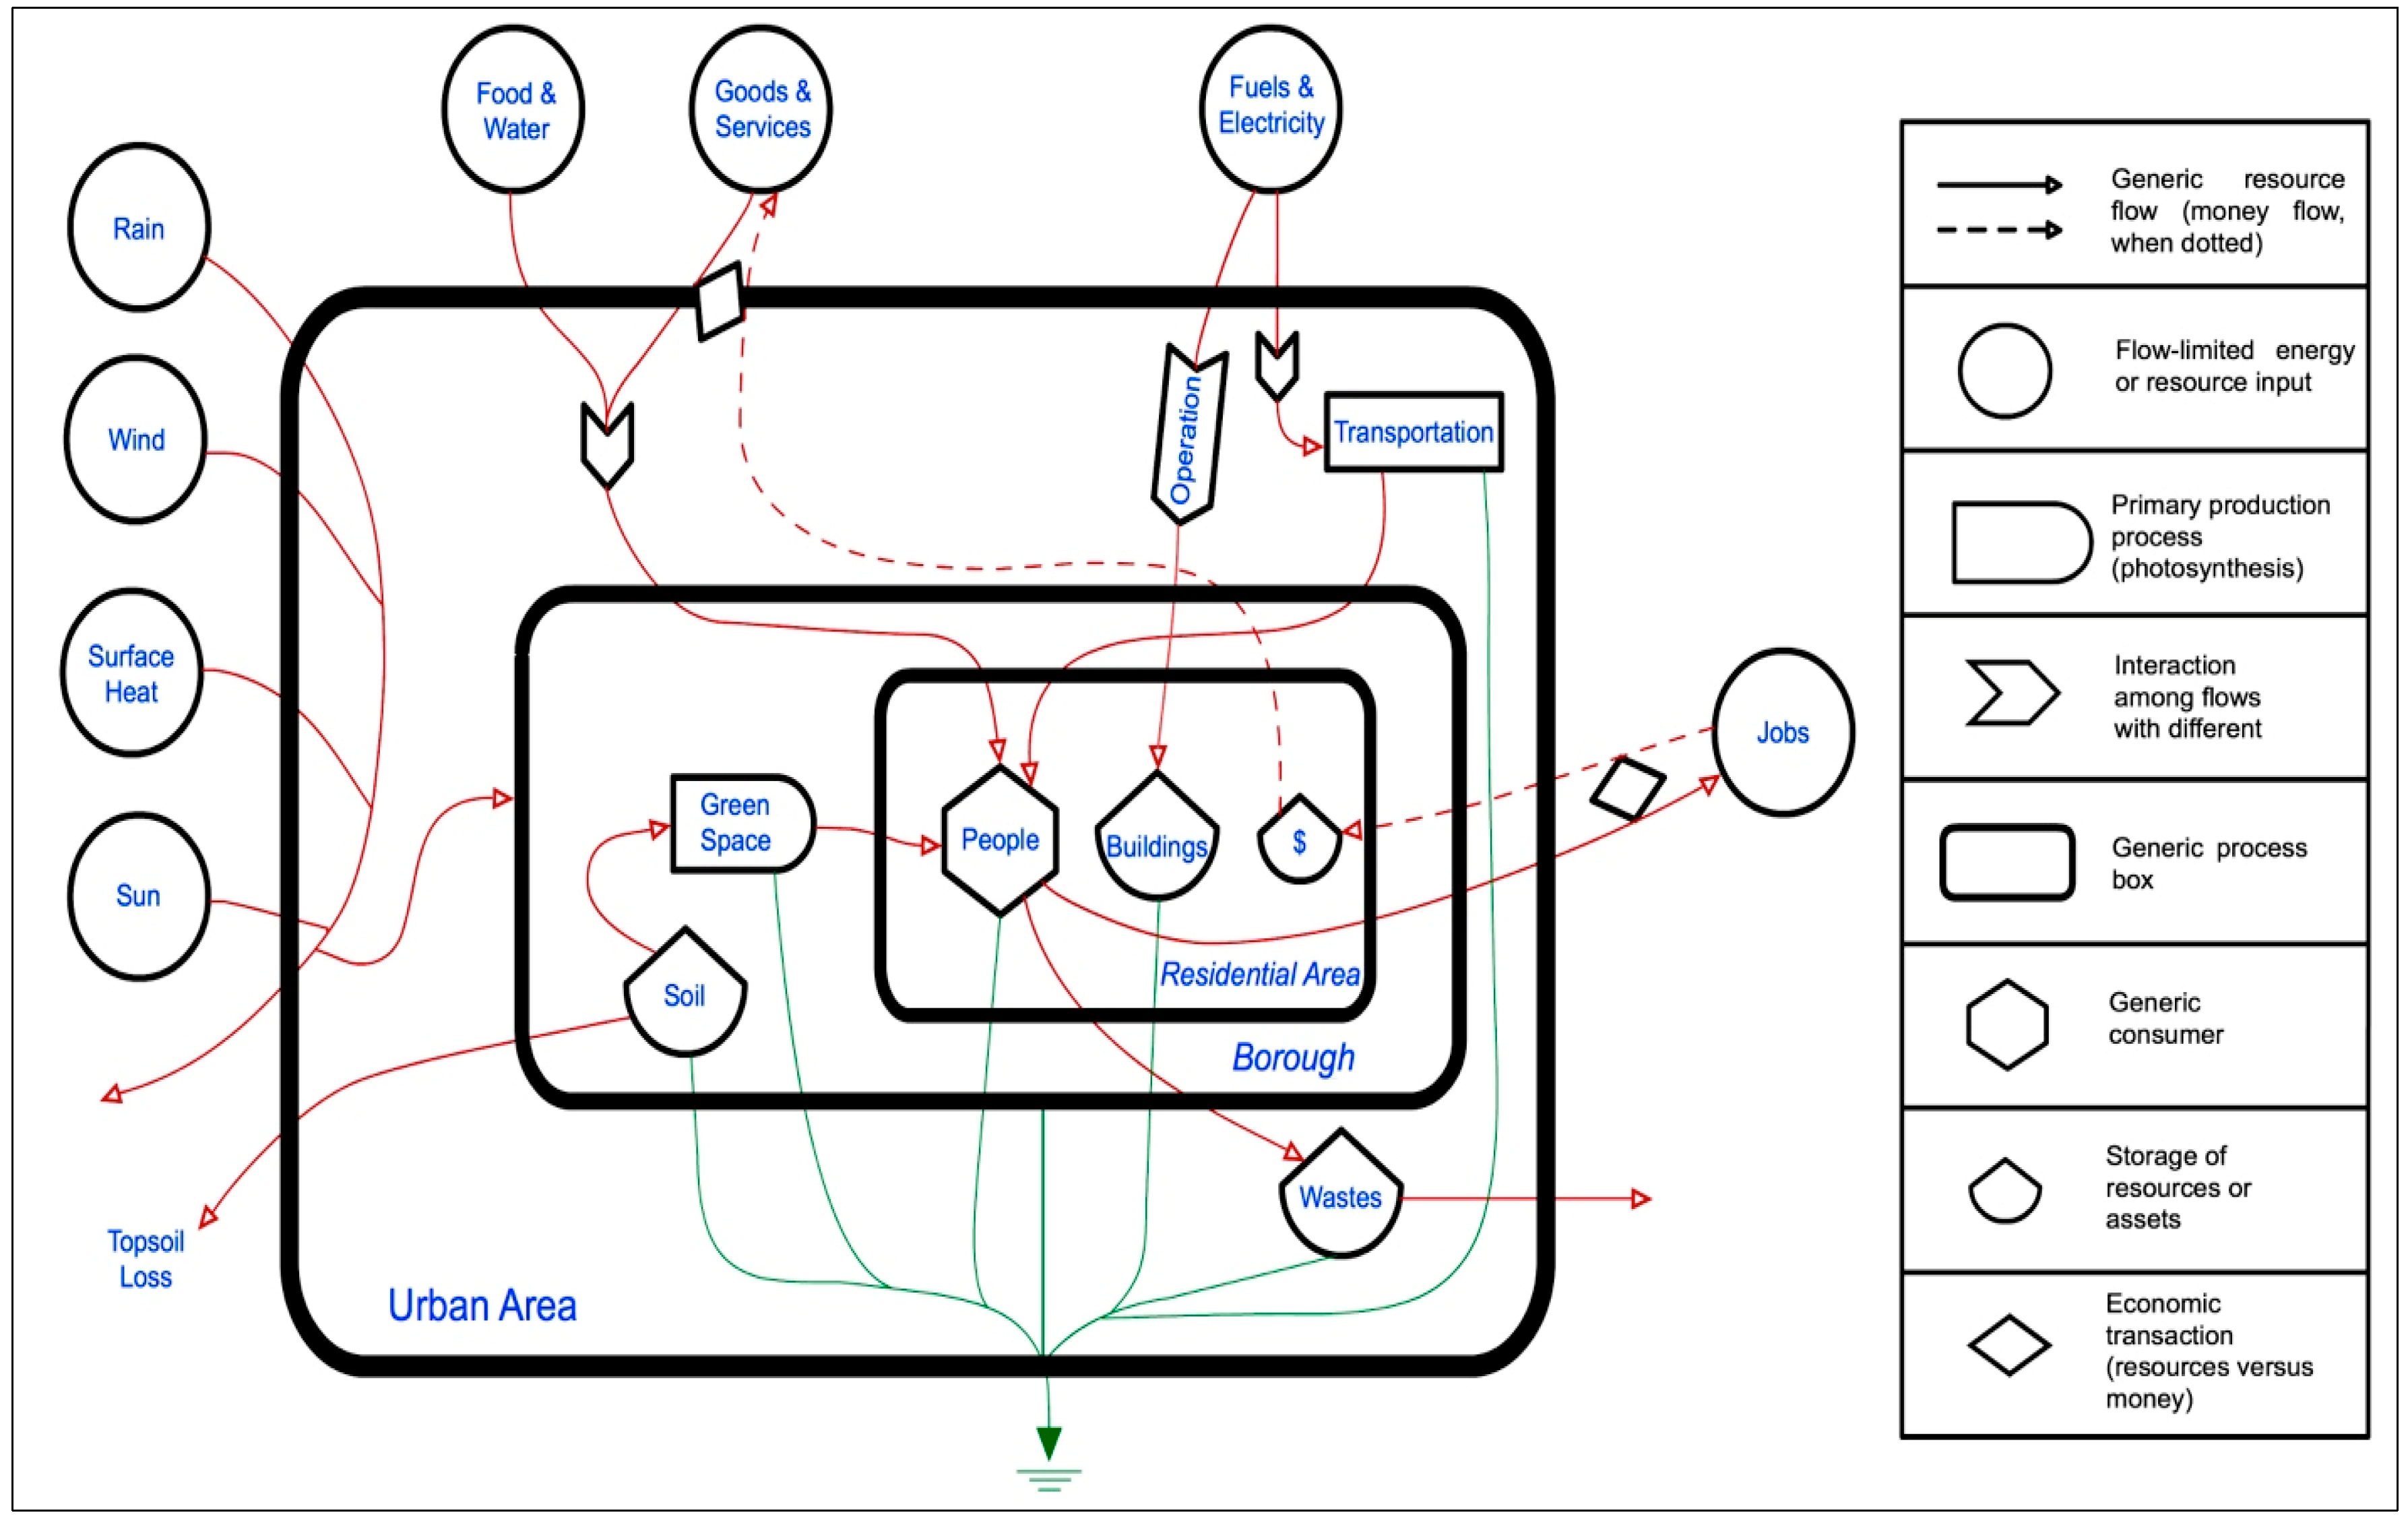
An emergy evaluation begins with the definition of the system under the analysis diagram (
Figure 1), including the main input and output flows of materials, energy, money,
etc. For the analysis of the boroughs, the main flows considered were sunlight, kinetic energy from wind, evapotranspiration from rain, surface heat flux, local topsoil loss, food, water, acquired goods and services, and electricity and fuels, for both the operation of the dwellings and the transport of the residents.
After the formulation of the diagram, a table is integrated with the raw data to calculate the corresponding emergy flows (
Table 1), which are obtained through a multiplication by the appropriate unit emergy values [
37].
Total emergy used (
U) was calculated as the sum of emergy from items 5–20 and the highest emergy input among items 1–4 in
Table 1 to avoid double counting [
27,
40]. The global emergy budget (15.83 × 10
24 seJ/year) used in this study was calculated from solar insolation, deep earth heat and tidal energy [
37,
39].
Figure 1.
Diagram of the main flows considered in the analysis of the boroughs.
Figure 1.
Diagram of the main flows considered in the analysis of the boroughs.
Table 1.
Emergy synthesis of material, energy and economic flows in the boroughs (Ville-Marie).
Table 1.
Emergy synthesis of material, energy and economic flows in the boroughs (Ville-Marie).
| Item | Quantity | Unit | Transformity (seJ/J, g, $) | Reference (Transformity) | Emergy (seJ/Year) |
|---|
| Renewable resources (R) | |
| 1 | Solar radiation | 7.31 × 10¹⁶ | J/year | 1.00 | [21] | 7.31 × 10¹⁶ |
| 2 | Wind | 1.96 × 10¹⁴ | J/year | 2.45 × 10³ | [39] | 4.81 × 10¹⁷ |
| 3 | Rain (evapotranspiration) | 1.76 × 10¹³ | J/year | 3.10 × 10⁴ | [39] | 5.45 × 10¹⁷ |
| 4 | Surface heat flux | 2.34 × 10¹³ | J/year | 1.07 × 10⁴ | After [39] | 2.51 × 10¹⁷ |
| Local non-renewable resources (N) | |
| 5 | Topsoil loss | 9.60 × 10⁷ | g/year | 2.29 × 10⁹ | [39,41] | 2.20 × 10¹⁷ |
| Purchased (imported) resources (F) | |
| 6 | Cereals | 6.44 × 10⁹ | g/year | 9.82 × 10⁸ | [21,42] | 6.32 × 10¹⁸ |
| 7 | Fruits | 5.76 × 10⁹ | g/year | 1.23 × 10⁹ | [21,42] | 7.05 × 10¹⁸ |
| 8 | Vegetables | 1.11 × 10¹⁰ | g/year | 5.96 × 10⁹ | [21,38] | 6.60 × 10¹⁹ |
| 9 | Meat | 6.76 × 10⁹ | g/year | 3.17 × 10¹⁰ | [38,43] | 2.15 × 10²⁰ |
| 10 | Fish | 6.72 × 10⁸ | g/year | 1.53 × 10¹¹ | [21,43] | 1.03 × 10²⁰ |
| 11 | Milk and other diaries | 9.58 × 10⁹ | g/year | 2.41 × 10¹⁰ | [21,38] | 2.30 × 10²⁰ |
| 12 | Eggs | 7.58 × 10⁸ | g/year | 1.07 × 10¹¹ | [38] | 8.11 × 10¹⁹ |
| 13 | Sugars and syrups | 2.42 × 10⁹ | g/year | 1.55 × 10⁸ | [37,38] | 3.75 × 10¹⁷ |
| 14 | Potable water | 8.84 × 10¹² | g/year | 3.00 × 10⁶ | [42] | 2.65 × 10¹⁹ |
| 15 | Natural gas | 2.42 × 10¹⁵ | J/year | 4.00 × 10⁴ | [44] | 9.66 × 10¹⁹ |
| 16 | Electricity | 6.04 × 10¹⁴ | J/year | 6.23 × 10⁴ | [45] | 3.76 × 10¹⁹ |
| 17 | Gasoline | 8.02 × 10⁹ | g/year | 2.92 × 10⁹ | [44] | 2.34 × 10¹⁹ |
| 18 | Diesel | 7.66 × 10⁸ | g/year | 2.83 × 10⁹ | [44] | 2.17 × 10¹⁸ |
| 19 | Electricity (transport) | 1.85 × 10¹³ | J/year | 6.23 × 10⁴ | [45] | 1.15 × 10¹⁸ |
| 20 | Acquired goods and services (spending) | 3.94 × 10⁸ | $/year | 1.54 × 10¹² | [26] | 6.09 × 10²⁰ |
Finally, from the aggregate emergy flows estimated (renewable resources,
R; local non-renewable resources,
N; and purchased or imported resources,
F), performance indices and indicators, which are dealt with in the results and discussion sections, are calculated for their interpretation as a support in decision-making processes [
46], in this case, in urban planning contexts.
Emergy-based indicators (
Table 2) help to compare the environmental performance of the boroughs stressing the support needed for the dwellers activities, estimated through the emergy from the used resources’ emergy. Based on the requirements for the estimation of these indicators, the appropriated data were selected and elaborated on.
Table 2.
Emergy-based indicators considered in the study cases.
Table 2.
Emergy-based indicators considered in the study cases.
| Indicator | Calculation | Unit | Indication |
|---|
| Empower per household (EH) | U/borough’s number of households (occupied dwellings) | seJ/household year | Living quality and intensity of resource utilization |
| Per capita emergy (Ucap) | U/borough’s number of dwellers | seJ/person year | Standard of living and intensity of resource utilization |
| Empower density of the habitable area (EDHab) | U/borough’s total residential floor area | seJ/m2 year | Intensity of resource utilization |
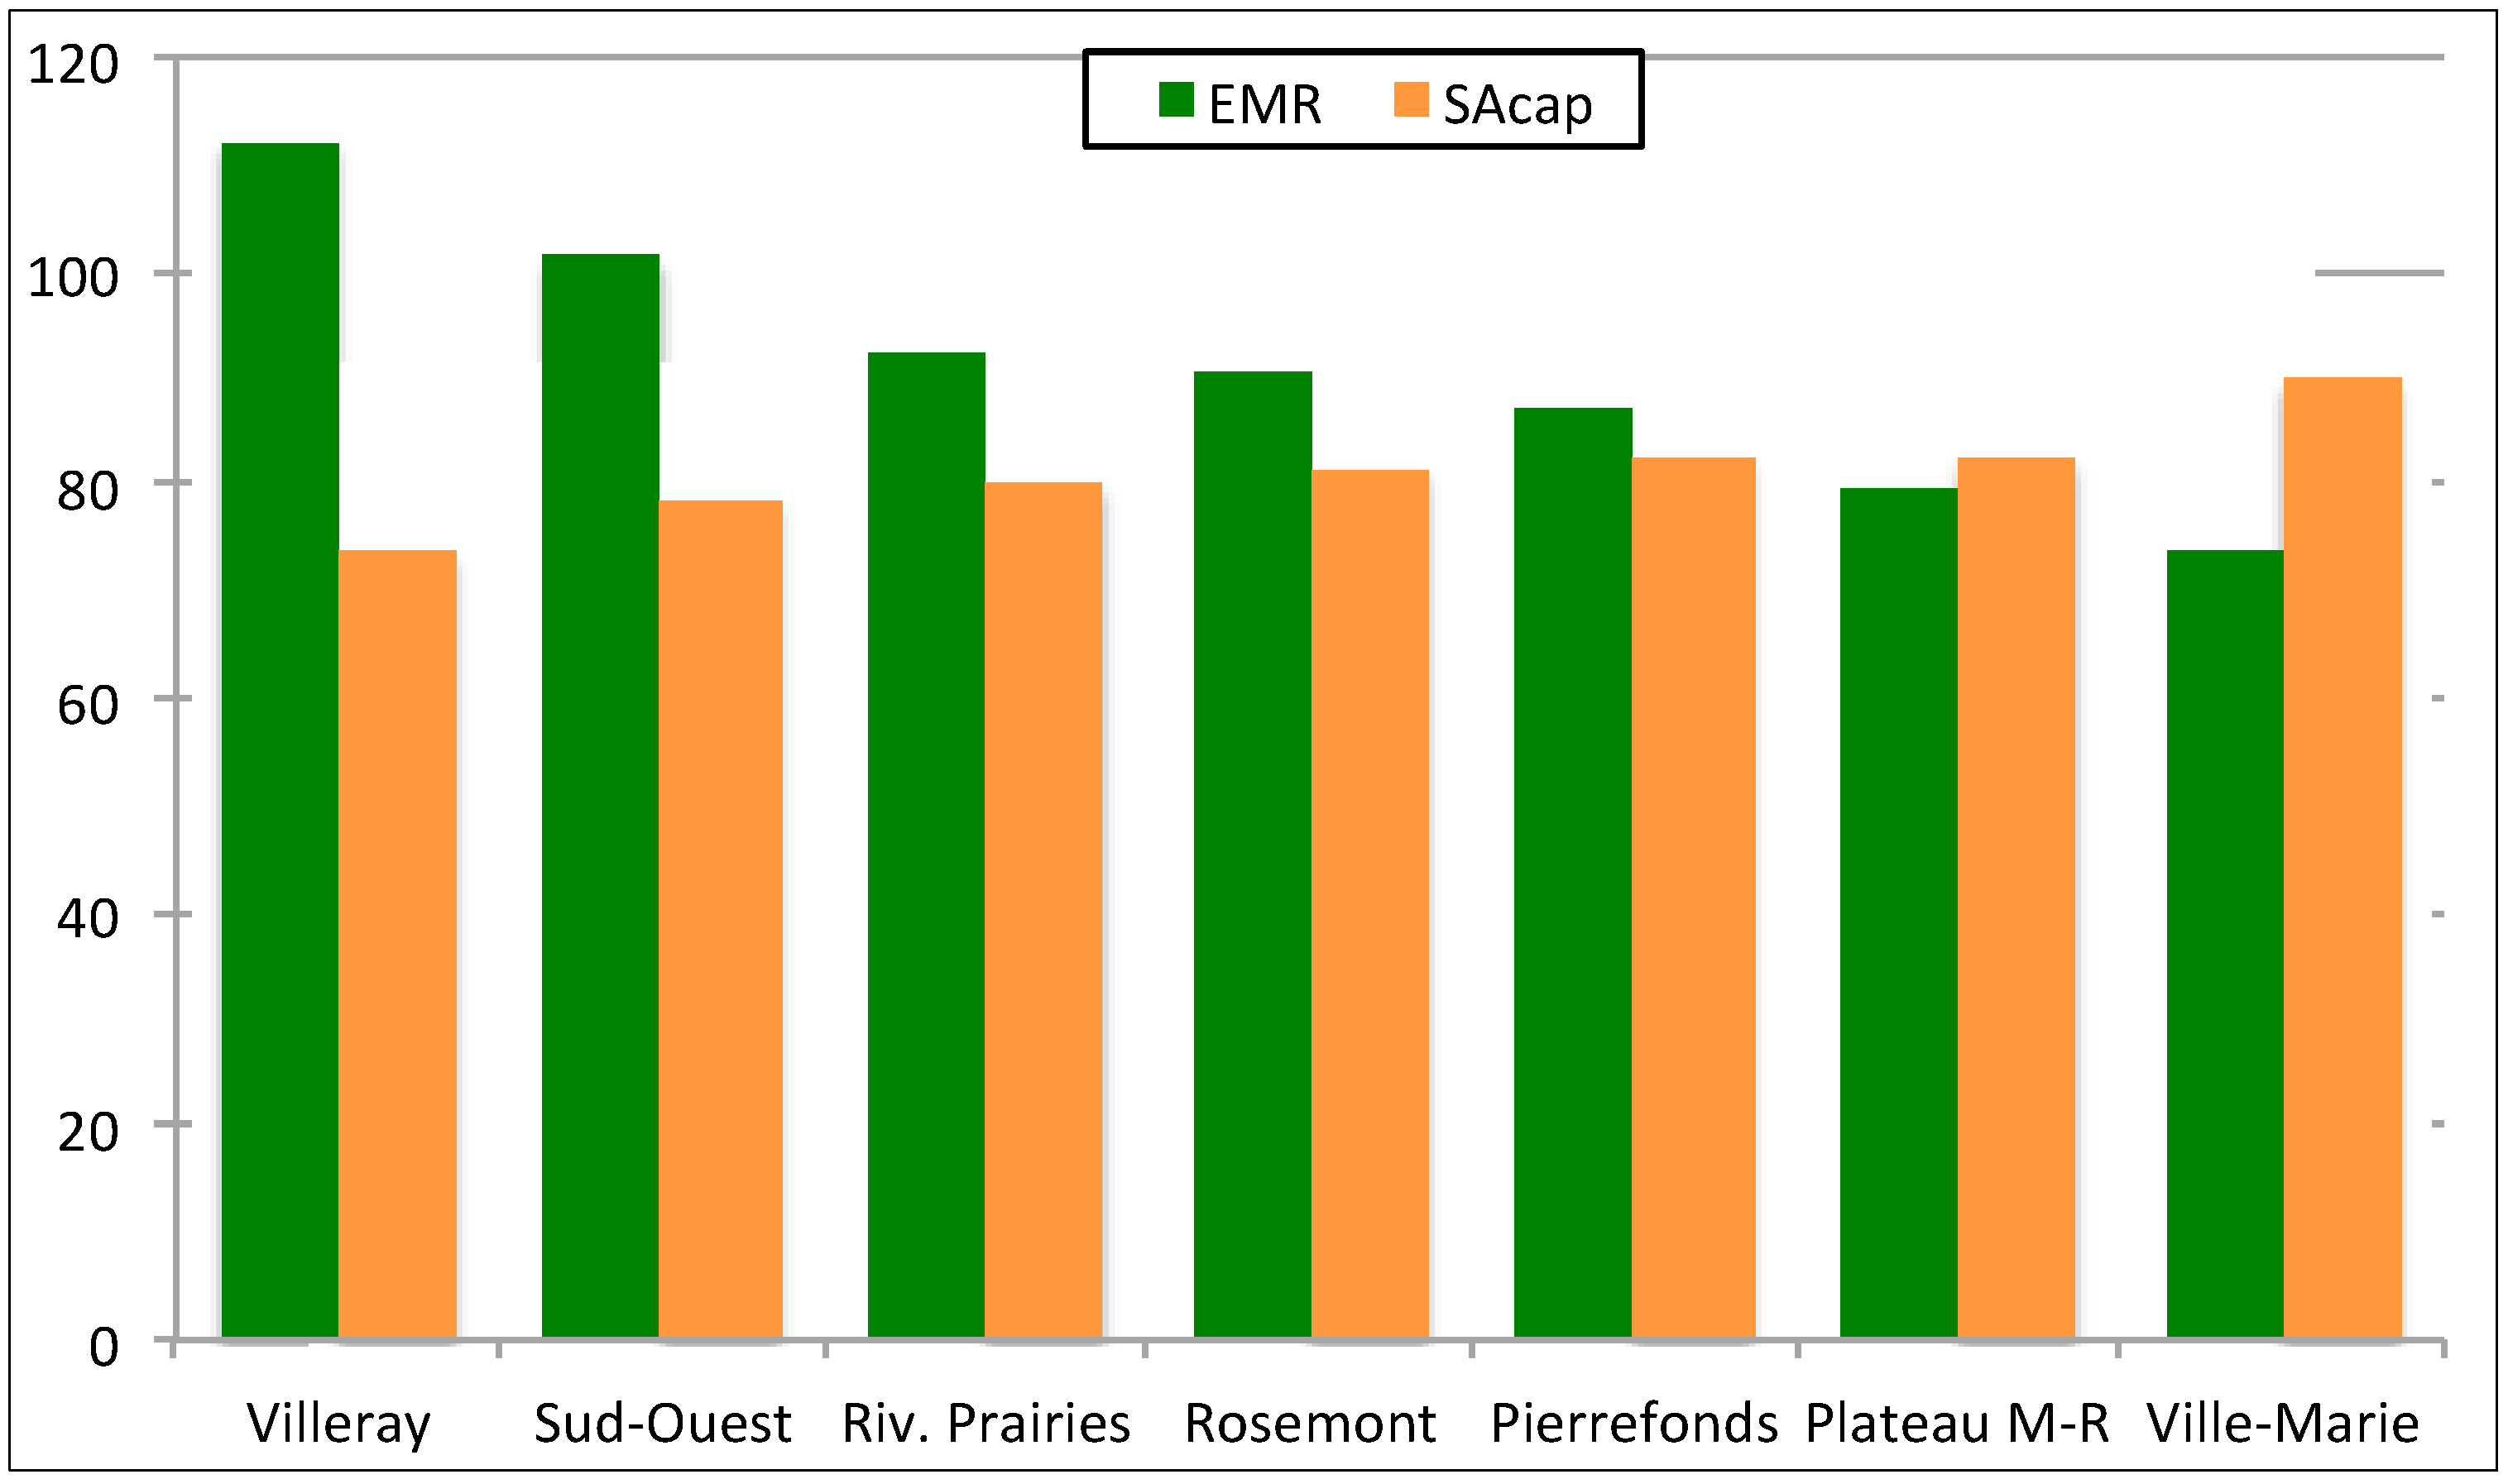
| Emergy to money ratio (EMR) | U/total income of borough’s households | seJ/USD | Ecological-economic efficiency |
| Per capita support area (SAcap) | ([N+F]borough/[(N+F)/area]Montreal)/borough’s number of dwellers | m2/person | Emergy-based ecological footprint |
| Emergy sustainability index (ESI) | [U/F]/[(N+F)/R] | - | Long term sustainability |
Seven boroughs of the City of Montreal (Le Plateau-Mont-Royal, Le Sud-Ouest, Pierrefonds-Roxboro, Rivière-des-Prairies-Pointe-aux-Trembles, Rosemont-La Petite-Patrie, Ville-Marie and Villeray-Saint-Michel-Parc-Extension), with different characteristics, such as housing types, green area coverage, per household income, number of residents per dwelling and distance to downtown, were analyzed.
One of the most important aspects defining urban form is density of occupation, expressed through the number of dwellings per unit area [
9]. Accordingly, the gross residential density of the boroughs ranged around three values: above 150, about 100 and below 35 dwellings per hectare.
Table 3 shows the main attributes used in the analysis of the boroughs, presented in descending order of gross residential density.
Table 3.
Main characteristics of the boroughs.
Table 3.
Main characteristics of the boroughs.
| Case | Gross Density (dw/ha) | Area (ha) | Per household Income (USD/year) | Total Households | Floor Area (ha) | Total Dwellers | Dist. to DT (km) | Green Area (%) |
|---|
| Ville-Marie | 161.1 | 1652 | 46,511 | 43,250 | 859 | 74,265 | 0.84 | 30.8 |
| Plateau M-R | 151.1 | 813 | 40,684 | 56,045 | 890 | 98,275 | 2.93 | 9.4 |
| Villeray | 103.2 | 1649 | 33,138 | 62,865 | 975 | 141,765 | 7.31 | 12.4 |
| Rosemont | 99.3 | 1585 | 37,501 | 70,085 | 1129 | 130,570 | 5.85 | 15.3 |
| Sud-Ouest | 94.4 | 1568 | 35,715 | 33,005 | 559 | 68,080 | 3.73 | 17.7 |
| Riv. Prairies | 30.3 | 4228 | 49,004 | 40,635 | 885 | 102,470 | 17.42 | 12.7 |
| Pierrefonds | 18.5 | 2706 | 57,415 | 23,730 | 821 | 64,285 | 23.31 | 16.4 |
Residential floor area in each borough was calculated, with the help of ArcView GIS software, through the reported gross residential density [
35] and the weighted mean of the floor area ratio,
i.e., floor space/plot area, established in the Master Plan of Montreal [
47]. Distance to downtown was considered as that of the straight line between the centroid of each borough and the corner of two of the most significant streets in the business and commercial heart of the city (it was estimated also with the afore-mentioned GIS software). Similarly, distance to two of the major employment areas (one located to the east and the other to the west of the island) was examined. Green area coverage was also compiled from the reported in the Island of Montreal’s Master Plan [
47].
Two of the main sources of statistical data were the City of Montreal’s socio-demographic profiles of boroughs [
48] and economic profiles of boroughs [
49]. It is important to note that the calculations in this paper were made taking into account only the population housed in private homes (total dwellers in
Table 3), which means around 95% of total population in the boroughs, and the occupied dwellings (total households in
Table 3). Unavailable data at the borough level were scaled down, as in the case of food consumption, for which national averages for urban regions were adjusted through the expenditure on food in each borough. For the estimation of emergy from natural resources, data coming from long periods were used; owing to the fact that environmental inputs of regional systems are frequently calculated using long-term averages [
40]. Also, data corresponding to monetary flows (currency values are expressed in US dollars) were brought to present value by applying price indexes when needed [
19,
50].
Table 4 shows the way in which data were processed and the main information sources.
Table 4.
Data elaboration and sources.
Table 4.
Data elaboration and sources.
| Item | Elaboration | Sources |
|---|
| Natural resources | Long period averages | [51,52,53] |
| Food | Per capita averages for urban regions adjusted by food spending in the boroughs | [49,54] |
| Water | Consumption by house type | [55,56] |
| Electricity and natural gas from house operations | Average of energy consumption by house type and by number of residents | [57] |
| Fuels and electricity from transport | Split mode, average trip length, vehicle and public transport performance | [58,59,60,61] |
| Goods and services | Household expenditure in the boroughs | [49] |
3. Results
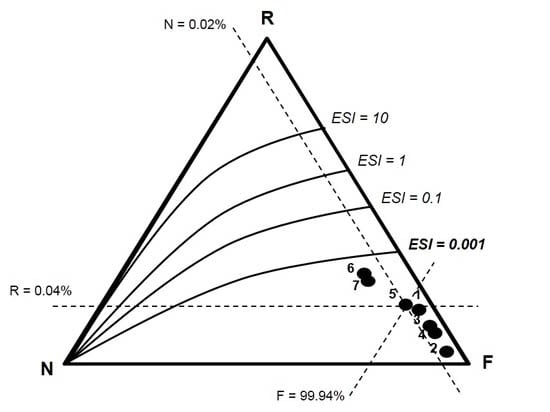
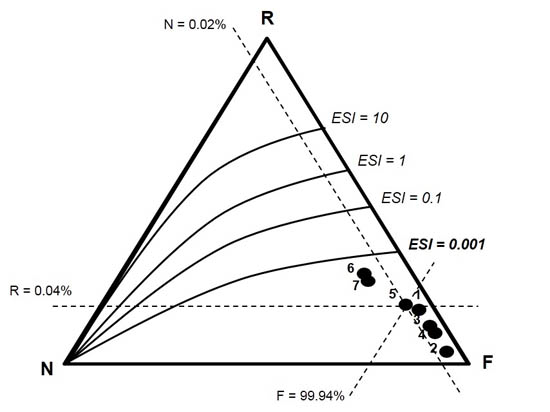
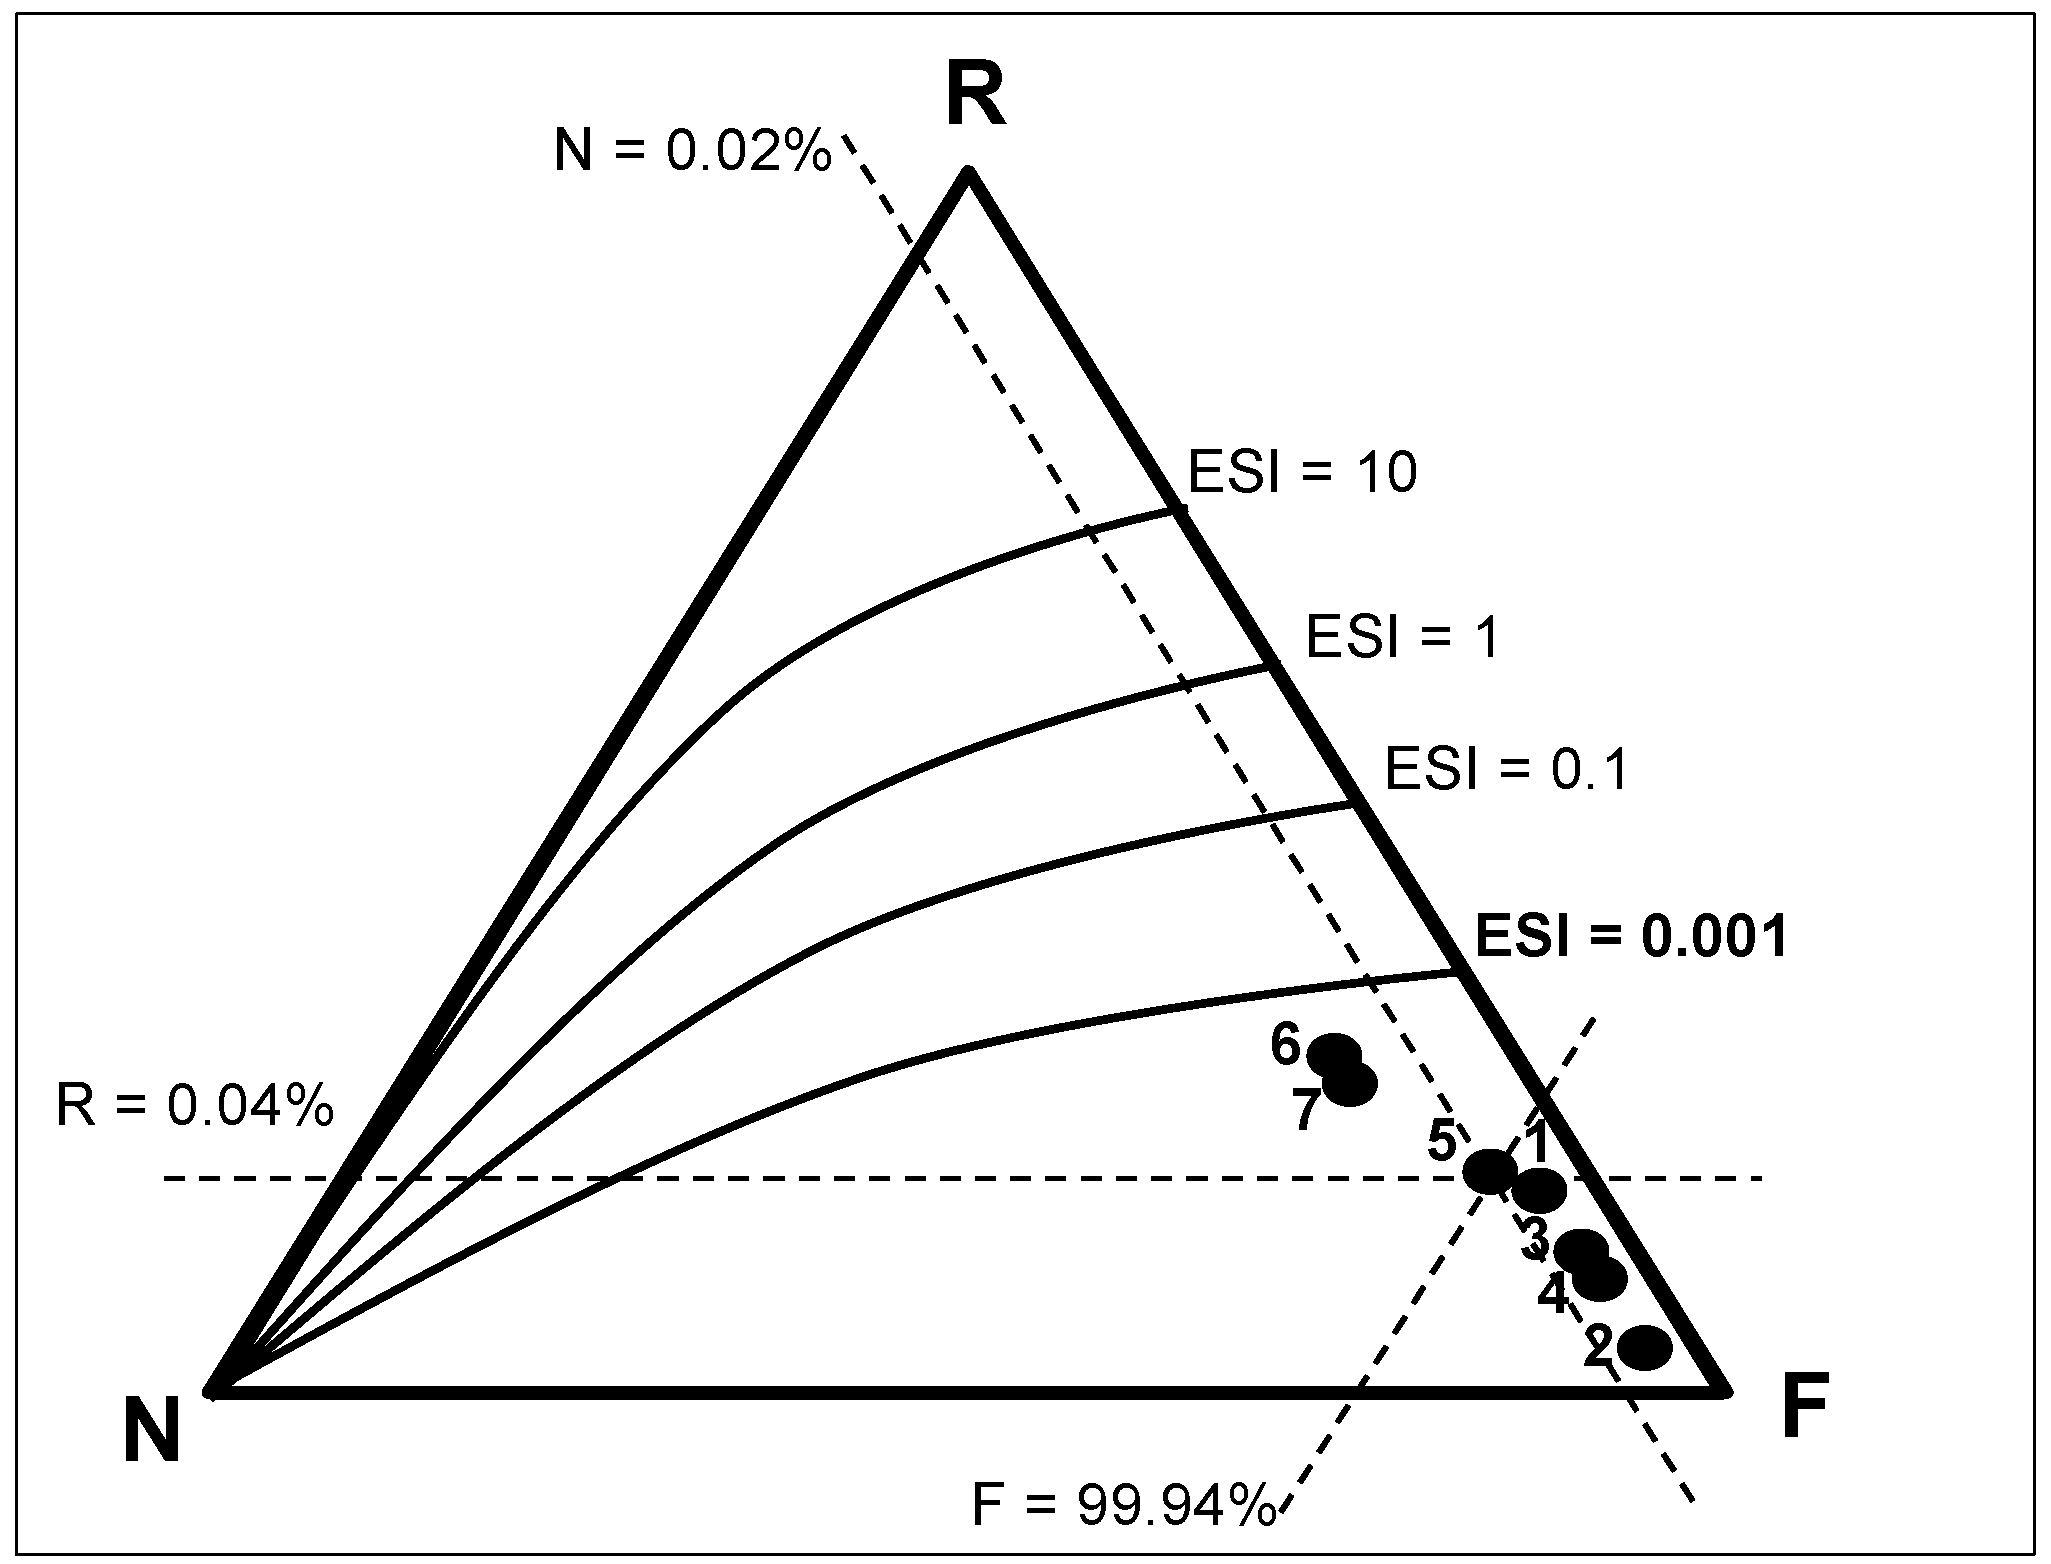
In the analyzed boroughs,
U varied depending on the number of residents, household size, income, distance to downtown and mixing of house types, among other aspects. As expected,
F was the dominant flow sustaining the day-by-day activities in each borough with an average of 99.94% of
U, while
R and
N averaged about 0.04% and 0.02%, respectively.
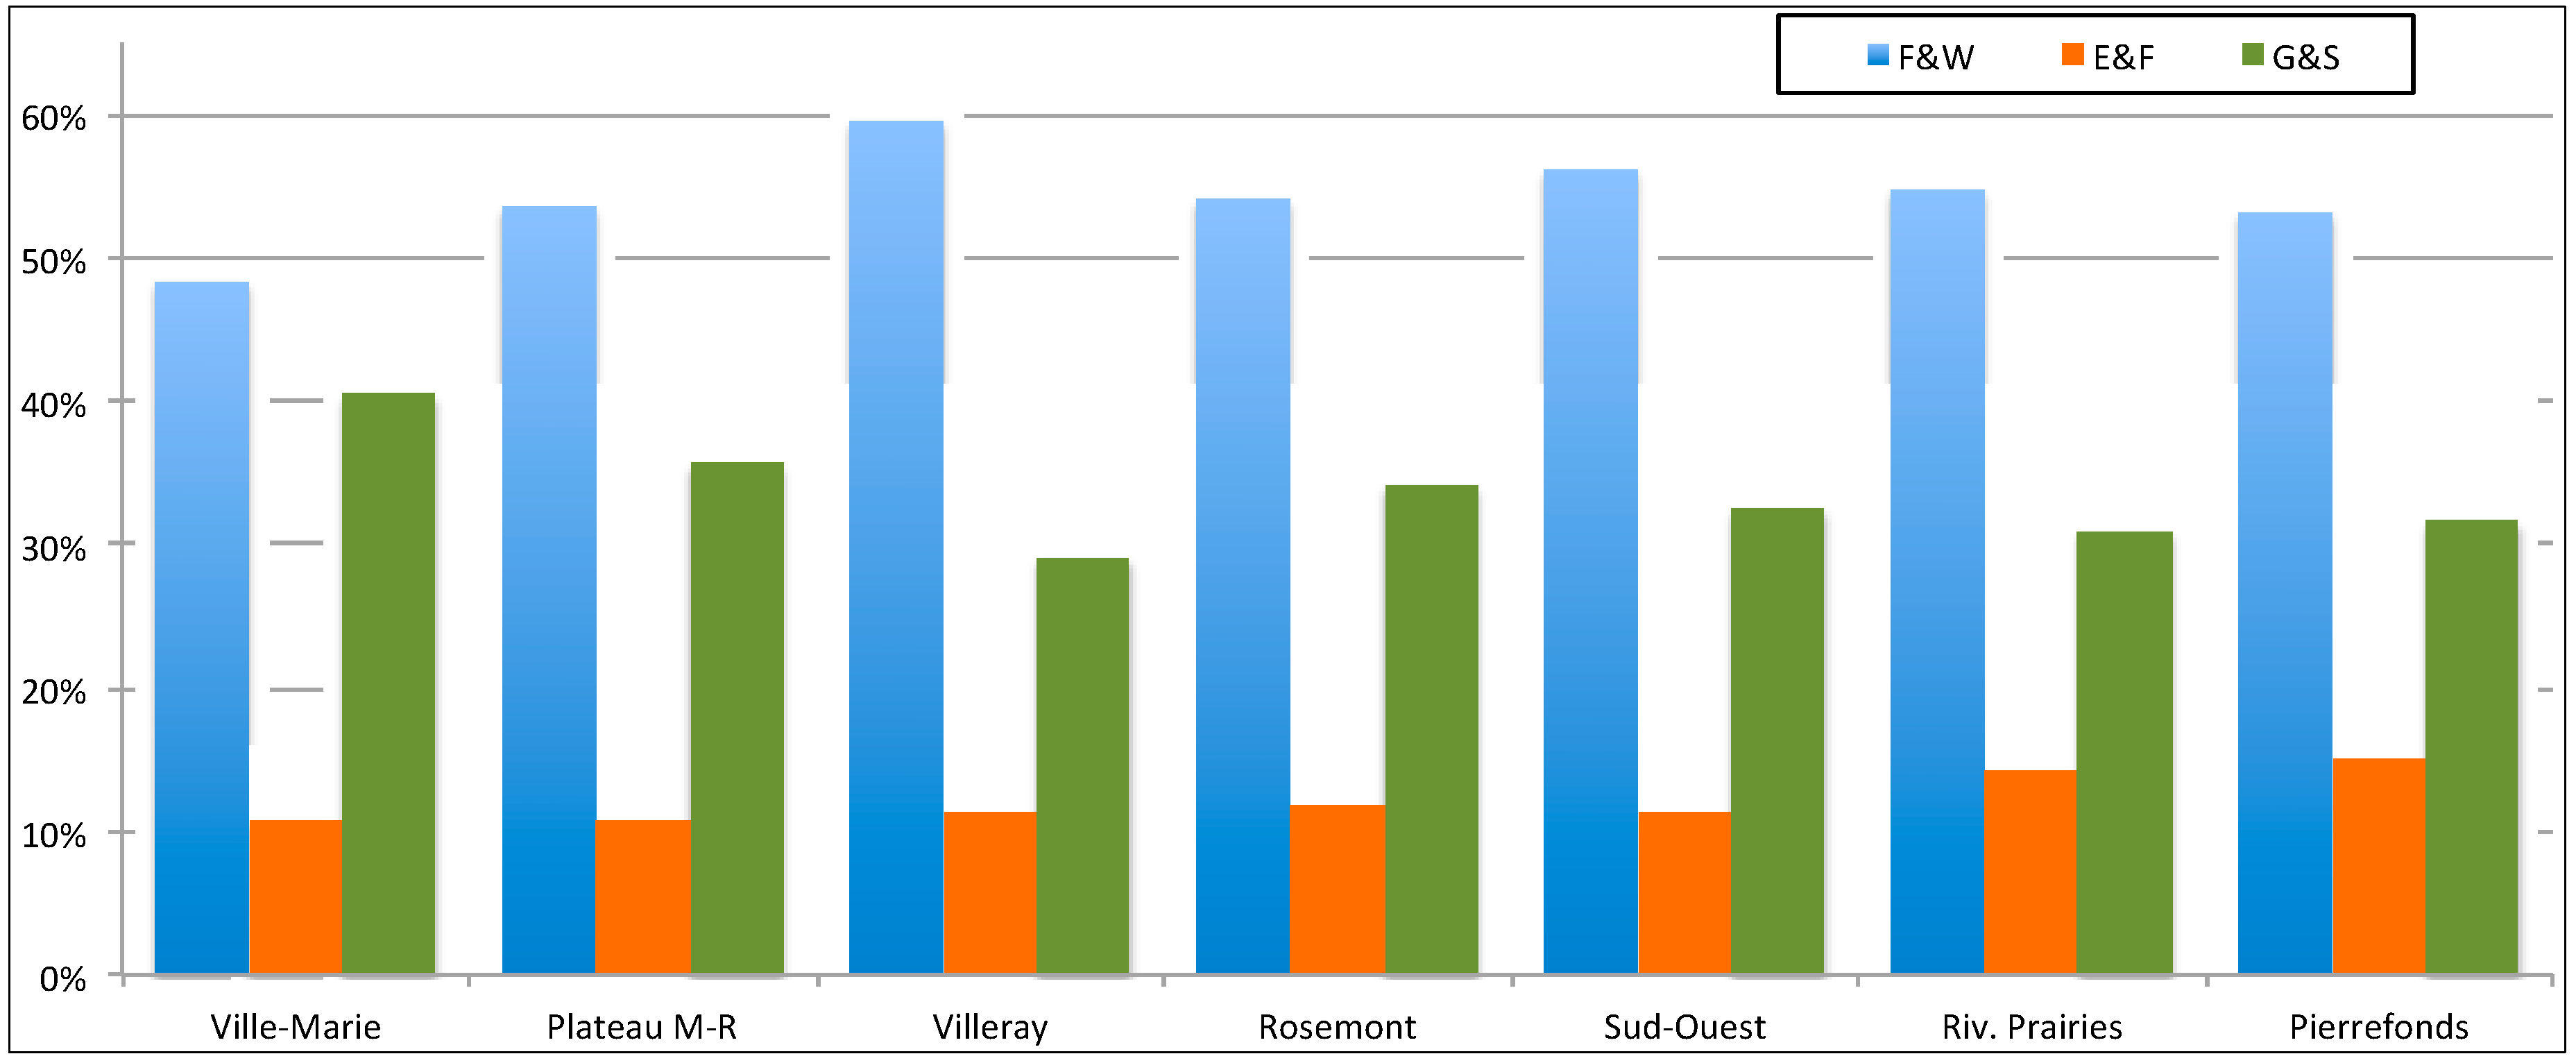
Figure 2 shows the main aggregated emergy flows, as a percentage of
U, calculated for the seven cases; they are presented in descending order of gross residential density.
Figure 2.
Purchased emergy as a percentage of the total emergy used in the seven boroughs (F&W: food and water; E&F: electricity and fuels; G&S: goods and services).
Figure 2.
Purchased emergy as a percentage of the total emergy used in the seven boroughs (F&W: food and water; E&F: electricity and fuels; G&S: goods and services).
Comparisons among cases with different characteristics are usually carried out favoring the utilization of intensity indicators instead of total quantities to attenuate such differences [
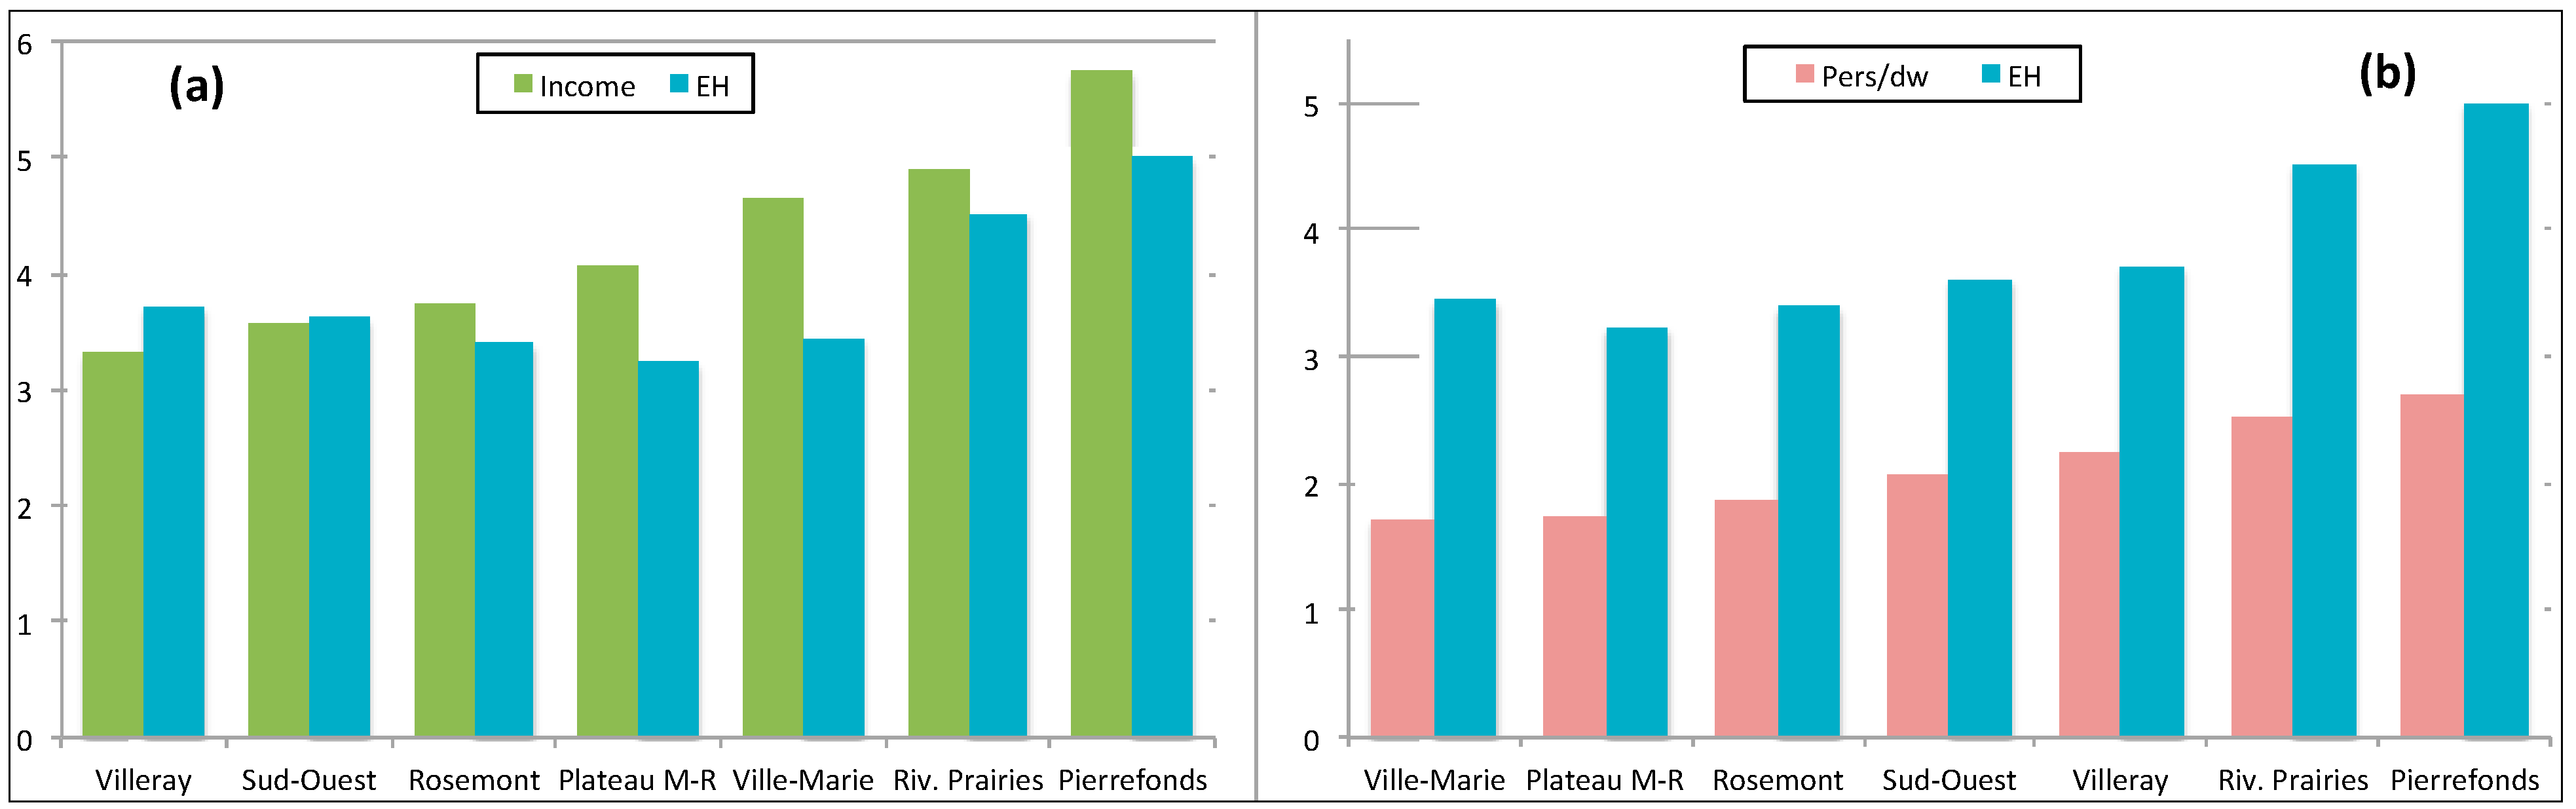
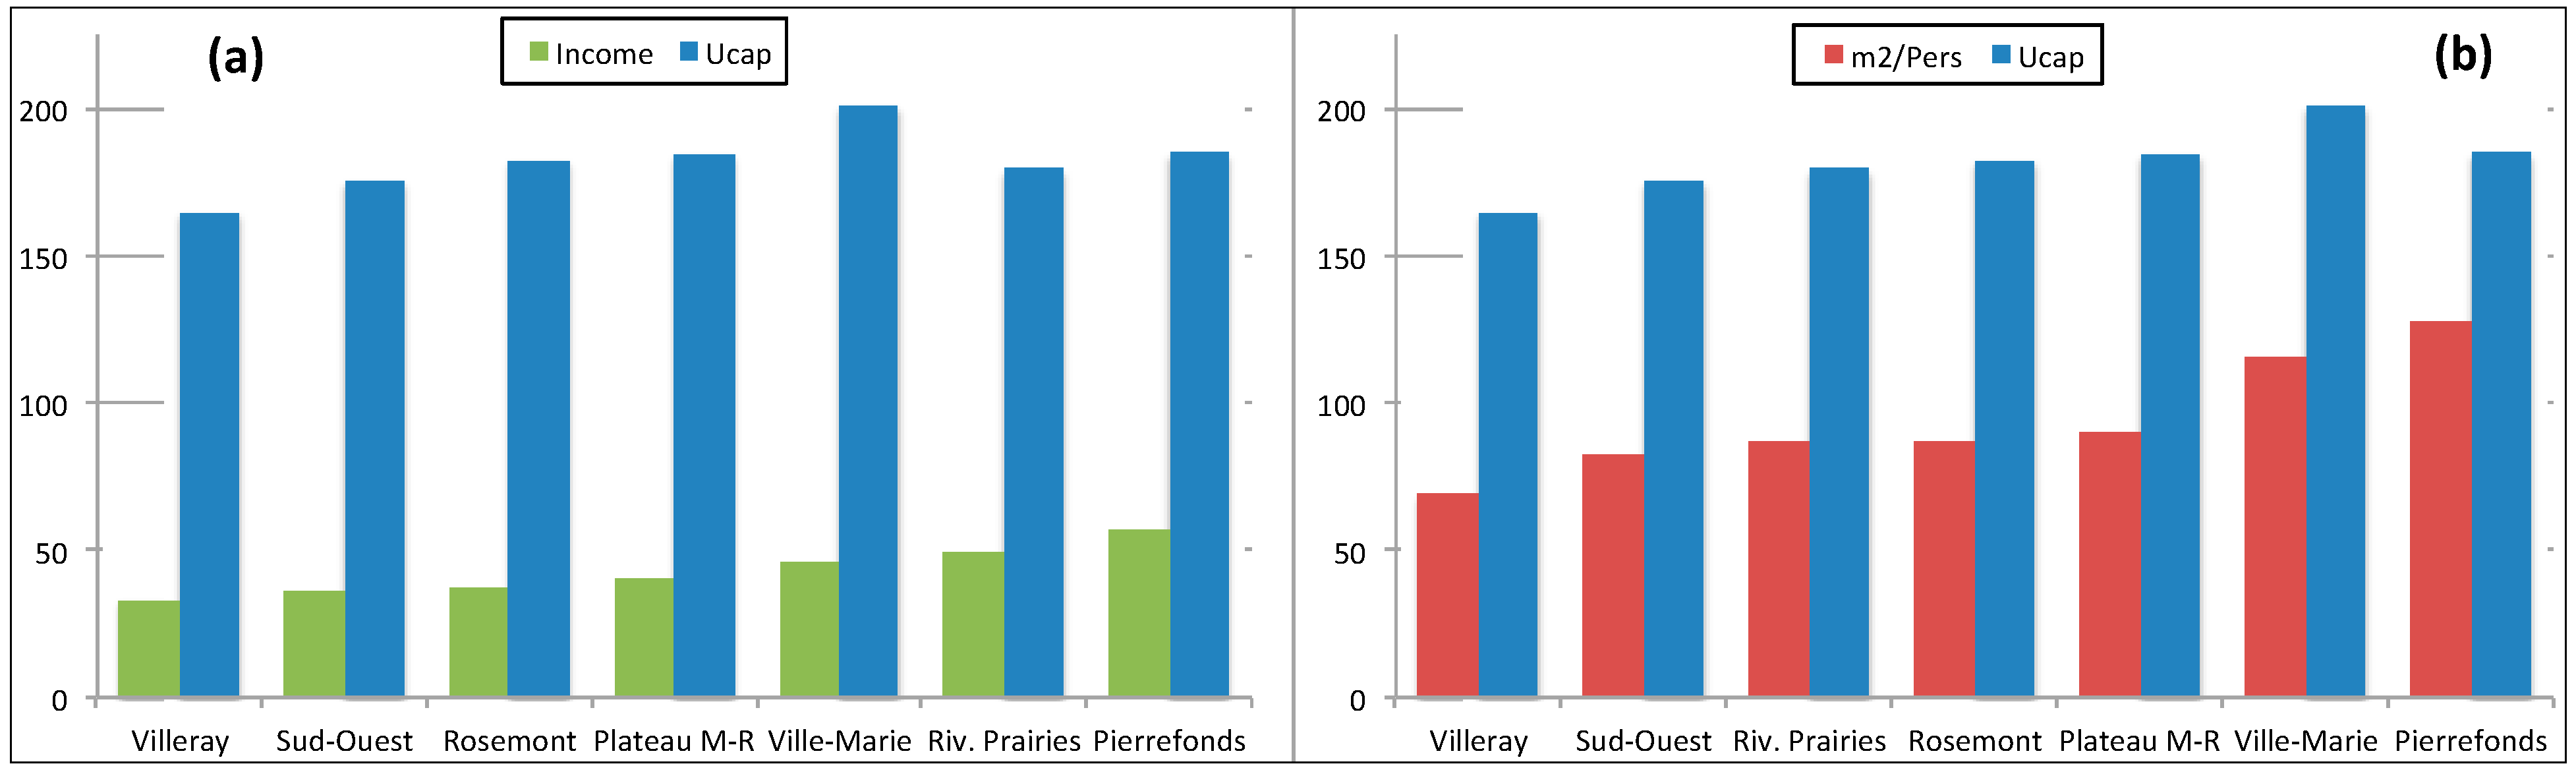
24]. In this work, the emergy requirements were considered mainly on a per occupant basis, on a per household basis, and on a per unit area of habitable space basis, in all cases, higher values of
Ucap,
EH and
EDHab indicating higher resource utilization intensity (
Table 2).
Emergy from food and water averaged 54% of
U in the boroughs. Plateau M-R and Ville-Marie presented the highest and the lowest per resident uses (9.88 × 10
15 and 9.70 × 10
15 seJ/person year, respectively) and Villeray and Pierrefonds showed the highest and the lowest per square meter of floor area utilization values (1.43 × 10
14 and 7.69 × 10
13 seJ/m
2 year, respectively). Emergy from acquired goods and services averaged 33%, with Ville-Marie exhibiting the highest per capita use (8.20 × 10
15 seJ/person year) and Villeray the lowest (4.80 × 10
15 seJ/person year), and Plateau M-R and Pierrefonds showing the largest and the smallest per square meter uses (7.25 × 10
13 and 4.57 × 10
13 seJ/m
2 year, respectively). For its part, emergy from total electricity and fuels consumption ranged around 12% of
U in the boroughs; Pierrefonds presented the highest per occupant use (2.80 × 10
15 seJ/person year) and Villeray the lowest (1.86 × 10
15 seJ/person year), while, Rivière Prairies and Ville-Marie exhibited the largest and the smallest per square meter uses (2.95 × 10
13 and 1.87 × 10
13 seJ/m
2 year, respectively).
Table 5 summarizes the main indicators estimated from the analysis of the emergy flows.
Table 5.
Emergy-based indicators calculated for the seven boroughs.
Table 5.
Emergy-based indicators calculated for the seven boroughs.
| Case | Ucap | EH | EDHab | EMR | SAcap | ESI |
|---|
| Ville-Marie | 2.01 × 10¹⁶ | 3.45 × 10¹⁶ | 1.74 × 10¹⁴ | 7.41 × 10¹¹ | 89.76 | 0.00037 |
| Plateau M-R | 1.84 × 10¹⁶ | 3.23 × 10¹⁶ | 2.04 × 10¹⁴ | 7.95 × 10¹¹ | 82.42 | 0.00013 |
| Villeray | 1.65 × 10¹⁶ | 3.72 × 10¹⁶ | 2.40 × 10¹⁴ | 1.12 × 10¹² | 73.66 | 0.00021 |
| Rosemont | 1.82 × 10¹⁶ | 3.40 × 10¹⁶ | 2.11 × 10¹⁴ | 9.06 × 10¹¹ | 81.53 | 0.00019 |
| Sud-Ouest | 1.75 × 10¹⁶ | 3.62 × 10¹⁶ | 2.13 × 10¹⁴ | 1.01 × 10¹² | 78.37 | 0.00038 |
| Riv. Prairies | 1.79 × 10¹⁶ | 4.52 × 10¹⁶ | 2.08 × 10¹⁴ | 9.23 × 10¹¹ | 80.14 | 0.00067 |
| Pierrefonds | 1.85 × 10¹⁶ | 5.01 × 10¹⁶ | 1.45 × 10¹⁴ | 8.72 × 10¹¹ | 82.58 | 0.00066 |
5. Conclusions
Residential land use of seven boroughs in Montreal was evaluated, stressing the “free” environmental work supporting long-term sustainability of the daily activities through the quantification and analysis of the material, energetic and economic flows and the calculation of indicators using the emergy synthesis method to examine their response with respect to the variation of urban planning parameters.
As expected, total emergy used varied principally according to household size, income level, distance to downtown and mixing of house types, while imported emergy was by far the dominant flow sustaining each borough’s activities. The highest proportions of emergy from food and water, from electricity and fuels and from acquired goods and services, with respect to total emergy used, were obtained for the borough with the lowest per household income, for the borough the furthest away from downtown and for the most centrally located borough, respectively. The overall contribution of these flows to total emergy use, in descending order, was: food and water, goods and services, and electricity and fuels. Also, regarding resource utilization per unit floor area, the lowest rate corresponded to the borough with the largest available space per person, for the cases of food and water and of goods and services, and to the borough with the second largest available space per person, for the case of electricity and fuels.
A strong positive linear correlation between household size and per household empower was confirmed: the highest per household emergy utilisations corresponded to the boroughs combining the highest incomes and the largest household sizes. For its part, the per capita emergy range of variation was not broad, however, a gradual increment was observed when income increased, with a maximum for the borough with the highest per resident utilization rate of emergy from goods and services. In addition, some influence of per resident habitable space on per capita emergy was noted; in general, a greater amount of the former corresponded to a higher value of the latter. In turn, emergy from fuels and electricity for the transport of dwellers was highly influenced by distance to downtown, while gross residential density did not appear to be correlated neither to per capita emergy from total energy use nor to per capita emergy from electricity and fuels used for the operation of dwellings.
With respect to the emergy-based ecological footprint and the emergy to money ratio, a general trend was observed: higher per capita land areas needed to support the activities in the boroughs corresponded to lower ecological economic efficiencies. In the long-term sustainability assessment through the emergy sustainability index, the best performances corresponded to the two boroughs the furthest away from downtown, which may be explained by their green area coverage, the low residential land use area to total area rate and the low habitable area to lot area ratio. Results suggest that allocation of green area coverage is an important parameter for the control of land use intensity, which in turn would influence urban form and the configuration of the transport system structure. Urban green space potential for accommodating local waste treatment systems, for acting as a greenhouse gas emissions sink and for promoting human health should be considered in future work.
With the procedure used for calculating resource use intensity in the seven boroughs, it is possible to generate a tool to support decision-making in urban planning for assessing future development scenarios. Hypothetical residential intensities might be weighted for the comparison of development alternatives or, inversely, occupation intensities intervals may be determined for particular projects, if their possible locations are known. Finally, it will be very important to examine more cases to confirm or discard the results obtained in this work. From a wider perspective, future research should consider emergy modeling at urban planning zoning scales, based on the variables that were found to more significantly affect the intensity of resource utilization.


