
Predicting the Trend of Taiwan’s Electronic Paper Industry by an Effective Combined Grey Model


Abstract
:1. Introduction
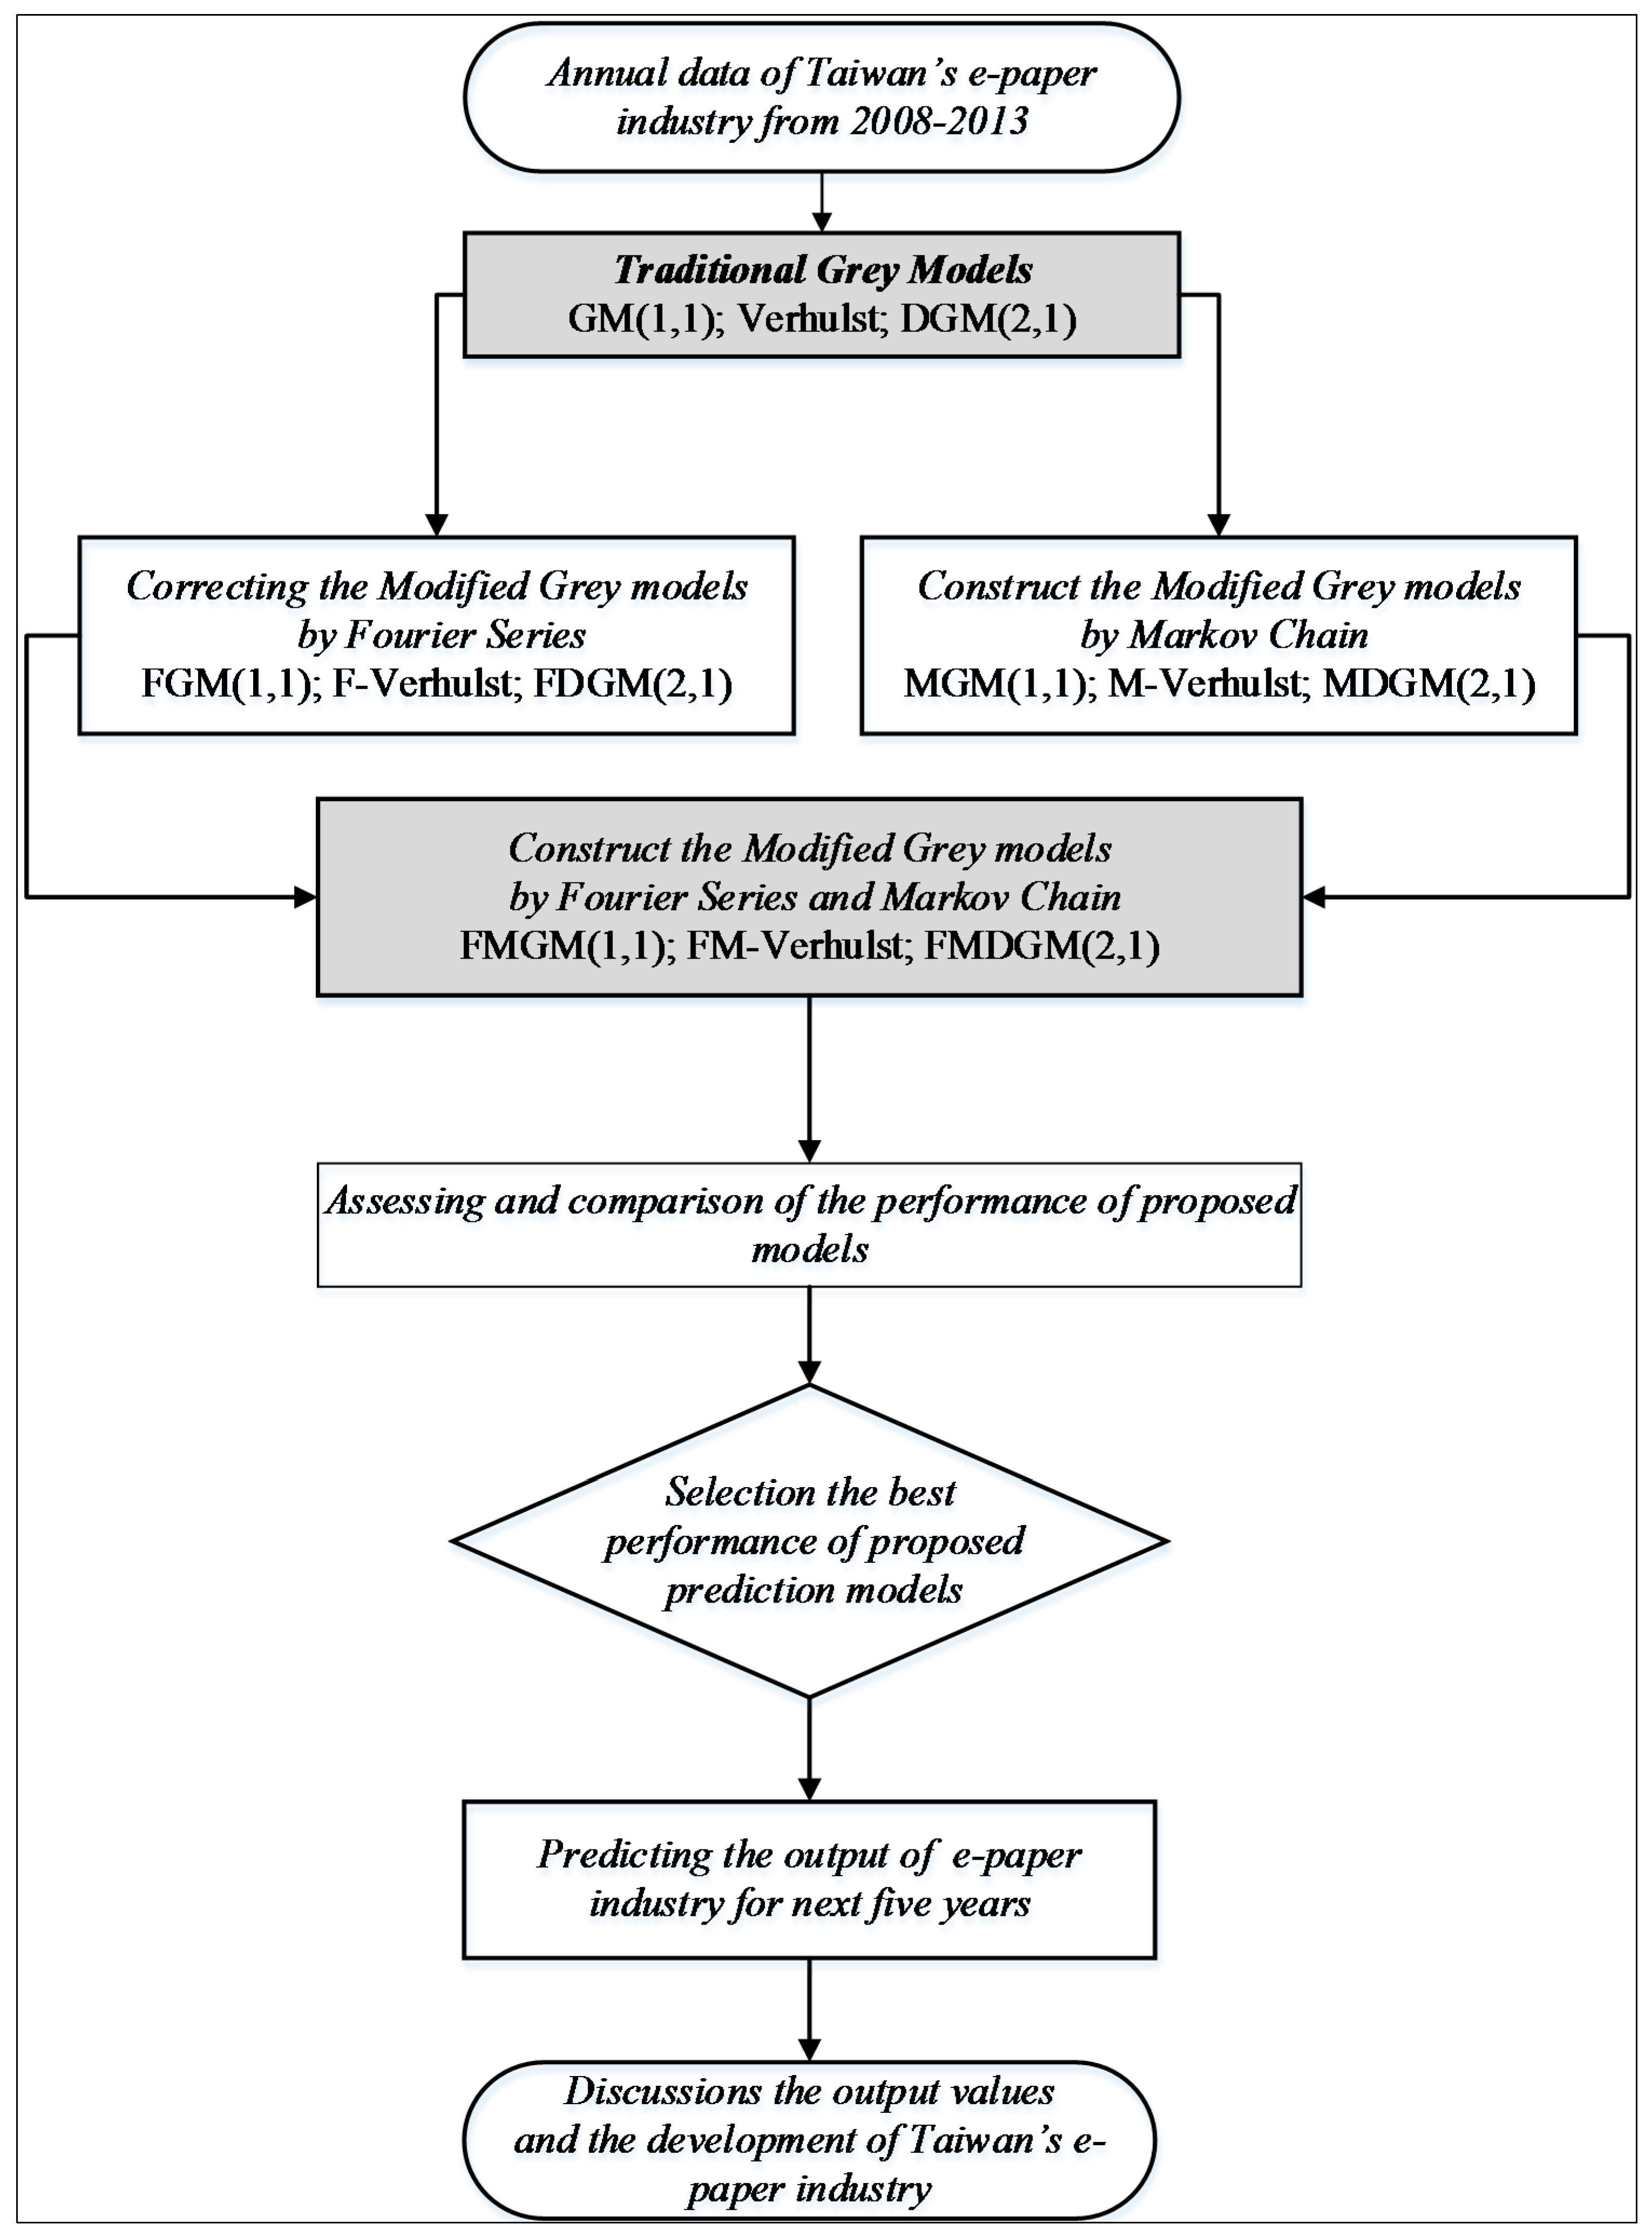
2. Methodology
2.1. Basic Grey Forecasting Model GM(1,1)
2.2. Direct Grey Forecasting Model DGM(2,1)
2.3. Grey Verhulst Model
2.4. Fourier Residual Modified Model (FGM)
2.5. Grey Markov Model (MGM)
2.6. Fourier Markov Grey Modified Model (FMGM)
2.7. Evaluating Performance of the Prediction Models

| Grade Level | MAPE | Accuracy (ρ) ρ = 1 − MAPE |
|---|---|---|
| Excellent | <0.01 | >0.95 |
| Good | <0.05 | >0.90 |
| Qualified | <0.10 | >0.85 |
| Unqualified | ≥0.10 | ≤0.85 |
| Range of Developing Coefficient | Forecasting Capability | |
|---|---|---|
| 1 | The model can be used for medium and long-term forecasting | |
| 2 | The model is suitable for short-term forecasting | |
| 3 | The model is carefully employed in short-term forecasting | |
| 4 | The model should be modified with residual | |
| 5 | The model is not suitable for forecasting | |

3. Results and Discussion
| GM(1,1) | DGM(2,1) | Verhulst | |
|---|---|---|---|
| a | 0.18369 | −0.92298 | |
| b | 8763.24 | 0.7029 × 10⁻⁵ |

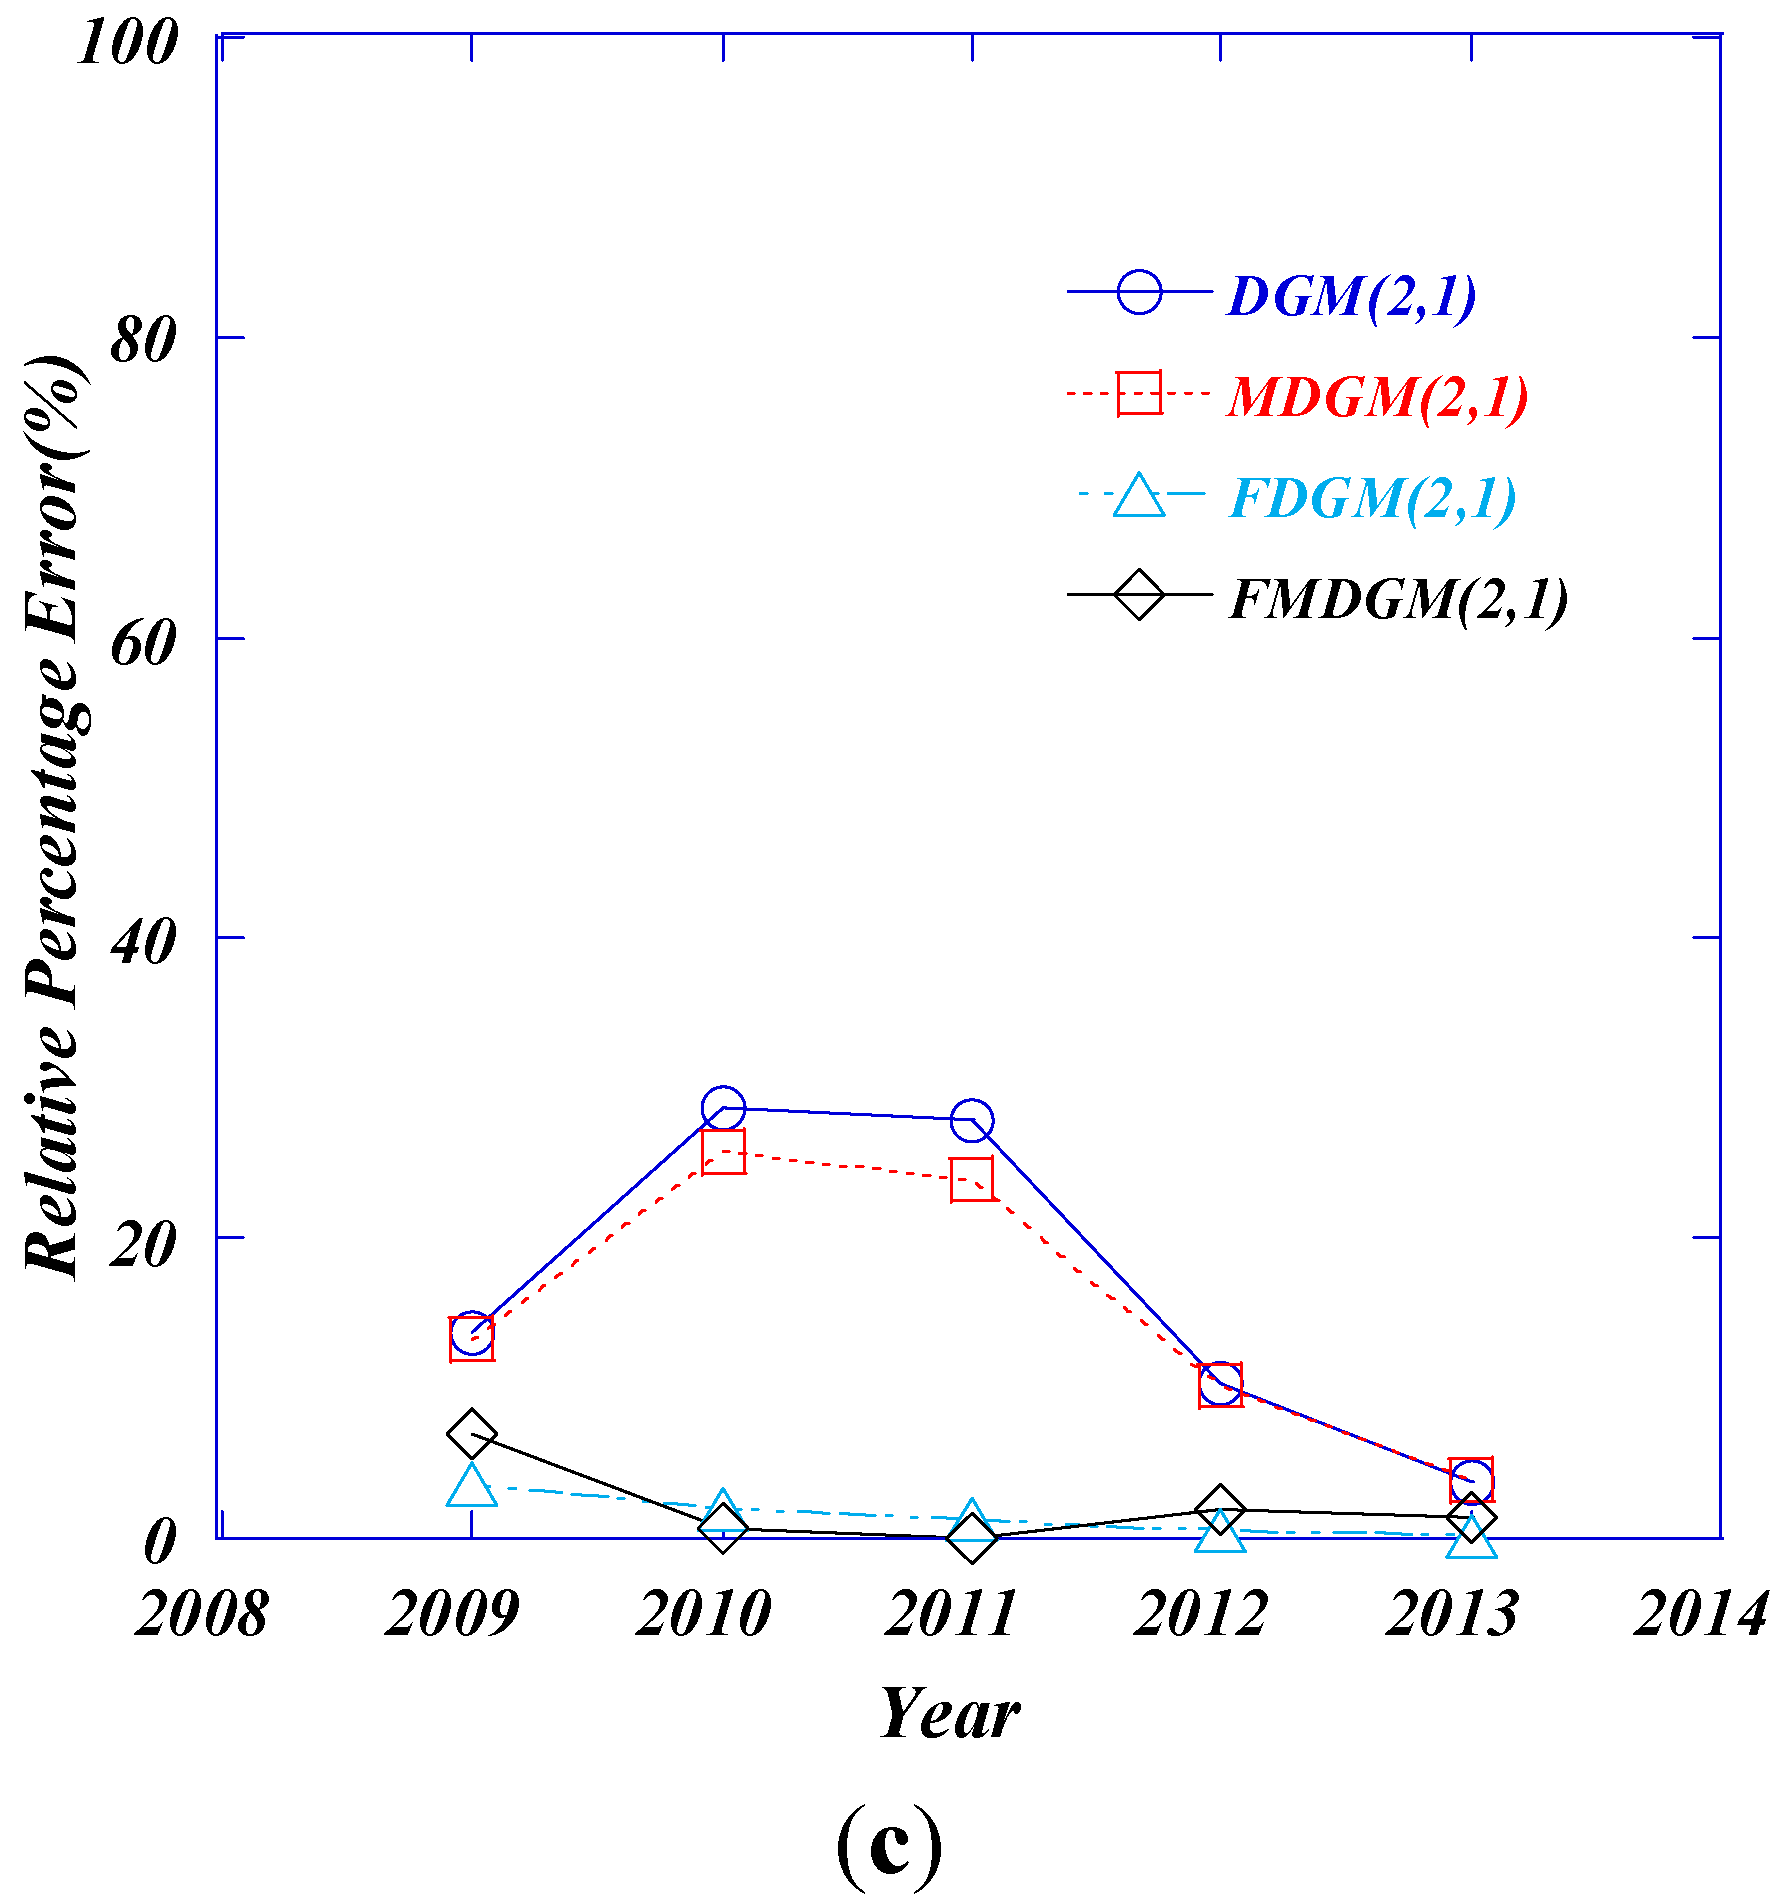
| Year | Actual Values (NTD Million) | Traditional Grey Models | |||||
| GM(1,1) | Verhulst | DGM(2,1) | |||||
| Predicted | RPE (%) | Predicted | RPE (%) | Predicted | RPE (%) | ||
| 2008 | 2090 | 2090 | 2090 | 2090 | |||
| 2009 | 6994 | 13,864.34 | 98.23 | 3046.10 | 56.45 | 6034.48 | 13.72 |
| 2010 | 18,268 | 16,855.67 | 7.73 | 7066.44 | 61.32 | 13,027.28 | 28.69 |
| 2011 | 26,130 | 20,492.41 | 21.58 | 14,714.57 | 43.69 | 18,846.61 | 27.87 |
| 2012 | 26,430 | 24,913.81 | 5.74 | 24,759.73 | 6.32 | 23,689.39 | 10.37 |
| 2013 | 26,705 | 30,289.15 | 13.42 | 29,766.25 | 11.46 | 27,719.50 | 3.80 |
| MAPE (%) | 29.34 | 35.85 | 16.89 | ||||
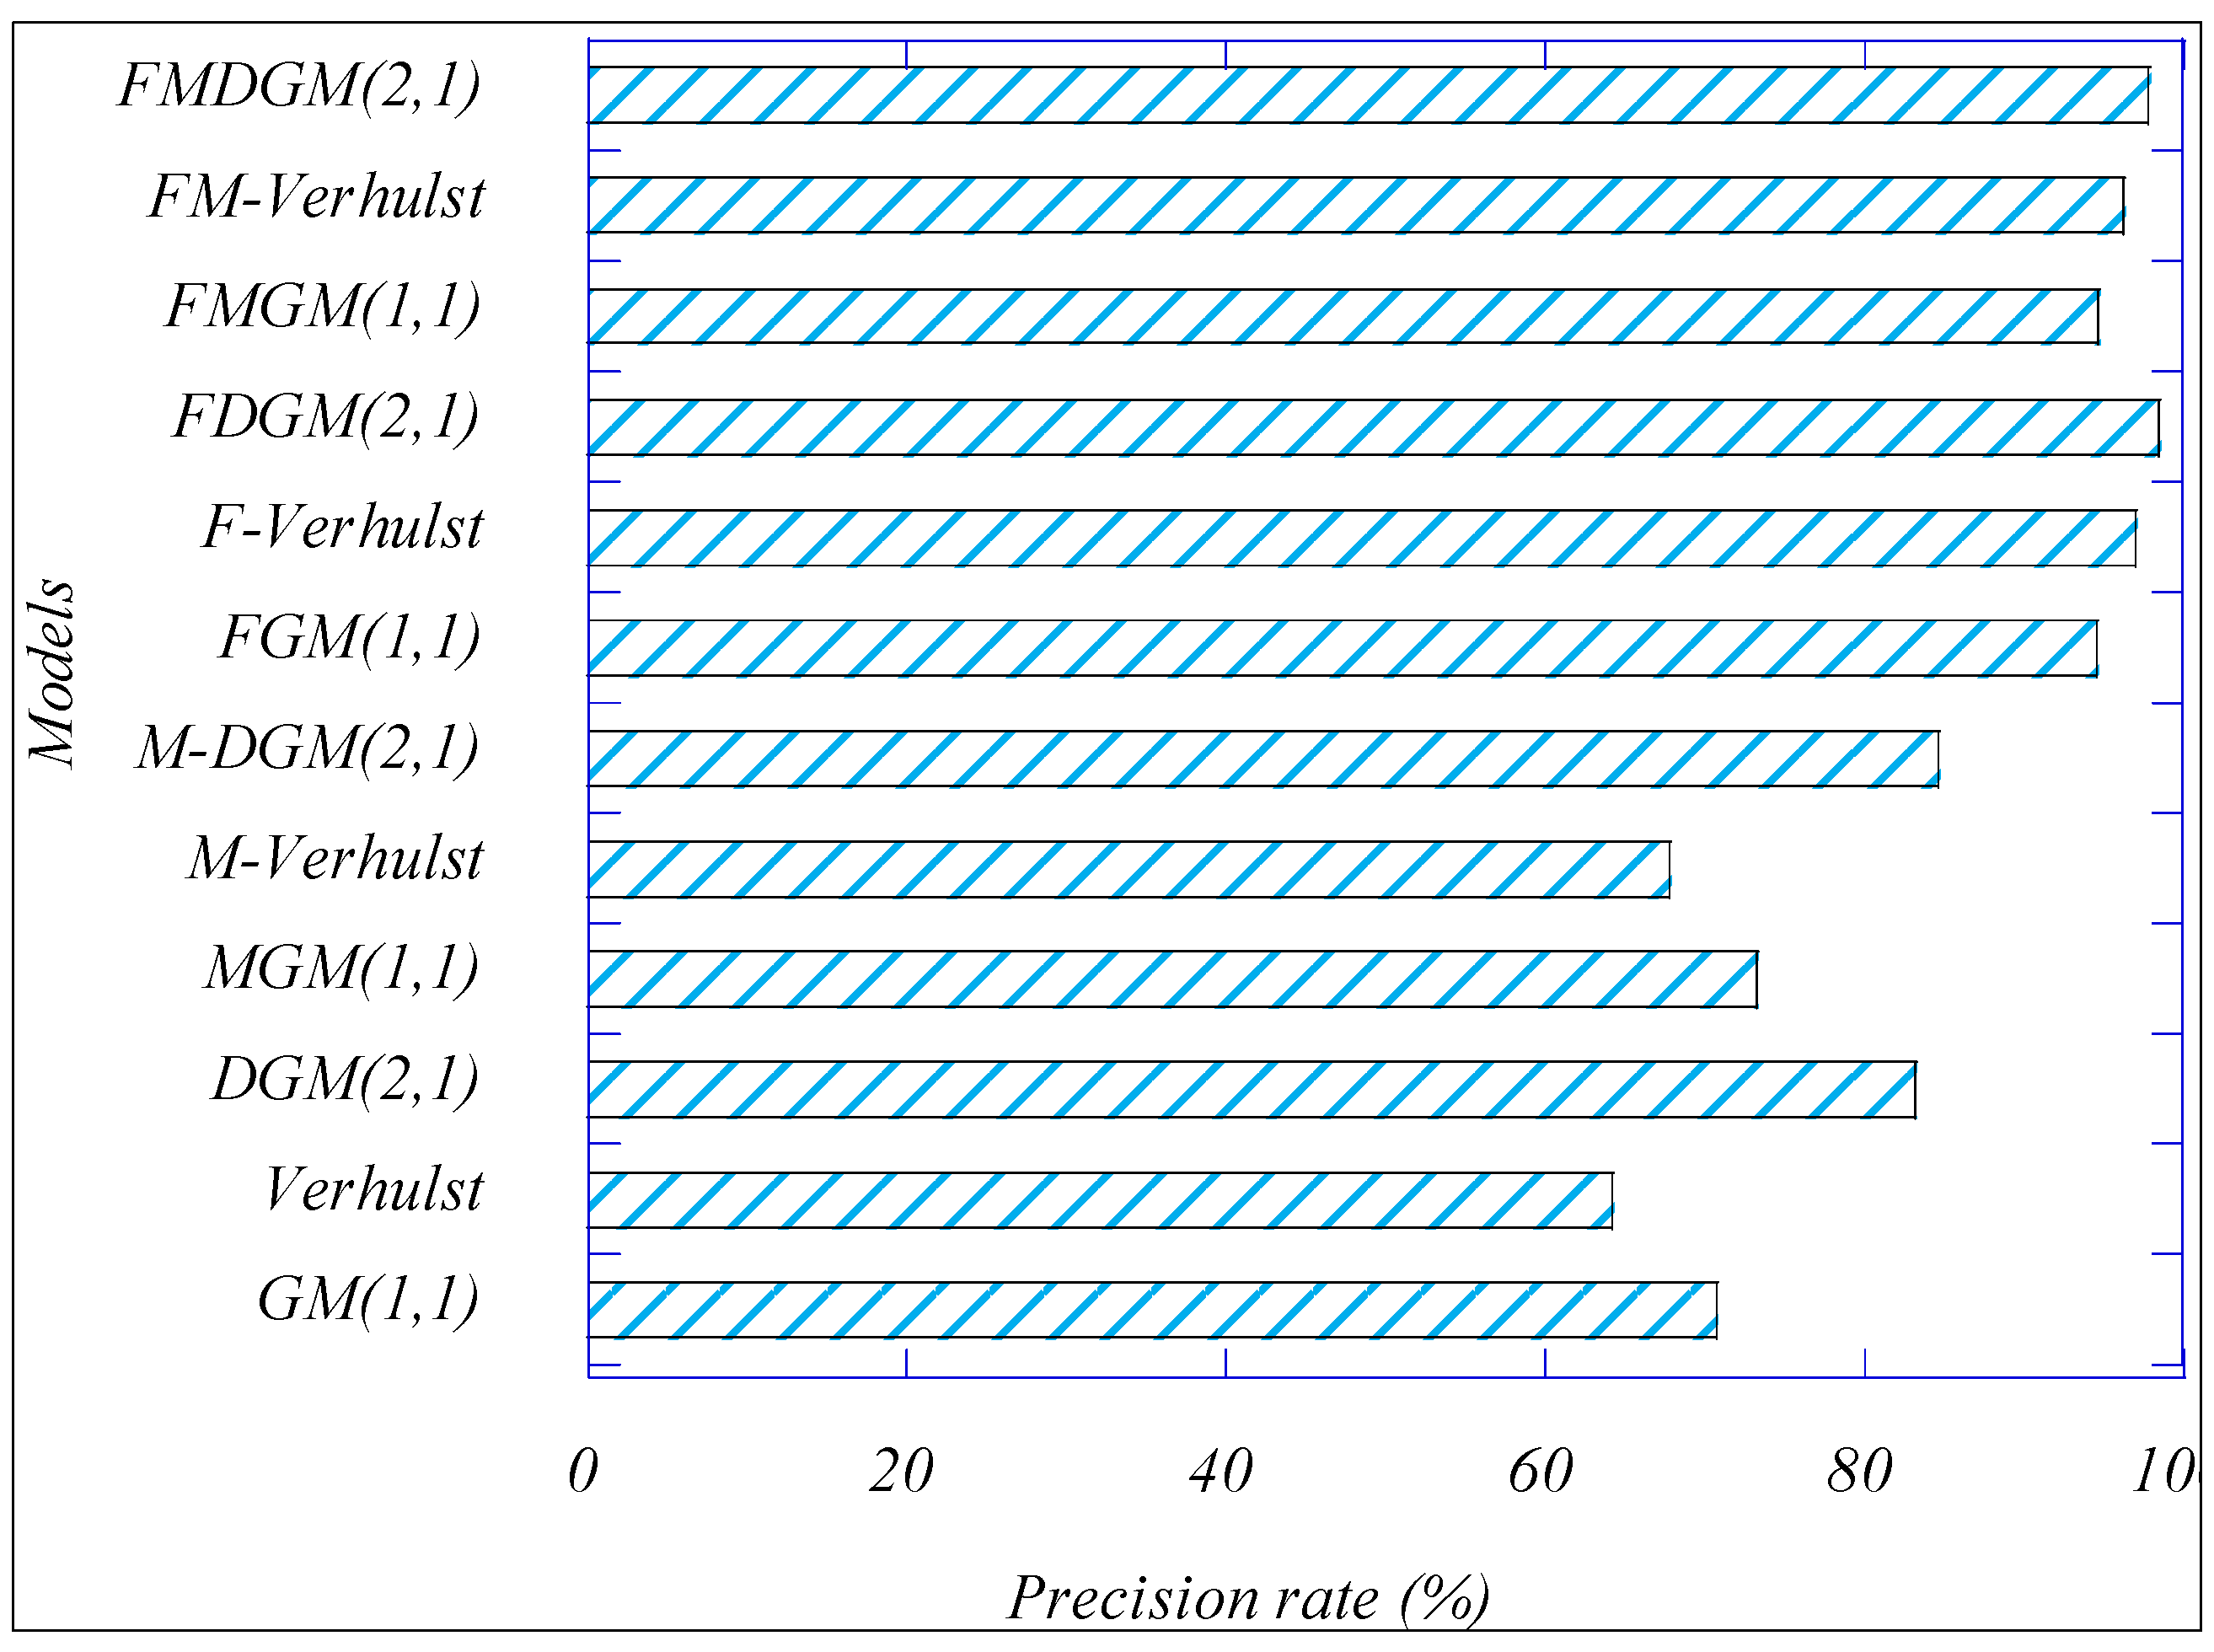
| Precision (%) | 70.6 | 64.15 | 83.11 | ||||
| Predicting level | Unqualified | Unqualified | Unqualified | ||||
| Year | Actual Values (NTD million) | Markov Grey Models(MGM) | |||||
| MGM(1,1) | M-Verhulst | MDGM(2,1) | |||||
| Predicted | RPE (%) | Predicted | RPE (%) | Predicted | RPE (%) | ||
| 2008 | 2090 | 2090 | 2090 | 2090 | |||
| 2009 | 6994 | 13,252.30 | 89.48 | 3186.29 | 54.44 | 6066.24 | 13.27 |
| 2010 | 18,268 | 17,300.63 | 5.29 | 9206.62 | 49.60 | 13,559.04 | 25.78 |
| 2011 | 26,130 | 20,937.43 | 19.87 | 15,854.76 | 39.32 | 19,878.37 | 23.93 |
| 2012 | 26,430 | 25,358.83 | 4.05 | 24,899.92 | 5.79 | 23,721.15 | 10.25 |
| 2013 | 26,705 | 30,734.03 | 15.08 | 29,906.43 | 11.99 | 27,751.26 | 3.92 |
| MAPE (%) | 26.75 | 32.23 | 15.43 | ||||
| Precision (%) | 73.25 | 67.77 | 84.57 | ||||
| Predicting level | Unqualified | Unqualified | Unqualified | ||||
| Year | Actual Values (NTD Million) | Fourier Residual Modified Models(FGM) | |||||
| FGM(1,1) | F-Verhulst | FDGM(2,1) | |||||
| Predicted | RPE (%) | Predicted | RPE (%) | Predicted | RPE (%) | ||
| 2008 | 2090 | 2090 | 2090 | 2090 | |||
| 2009 | 6994 | 8155.12 | 16.60 | 6431.62 | 8.04 | 6738.79 | 3.65 |
| 2010 | 18,268 | 17,559.72 | 3.80 | 18,930.99 | 3.62 | 18,625.82 | 1.96 |
| 2011 | 26,130 | 26,114.90 | 0.50 | 25,619.65 | 1.95 | 25,806.25 | 1.24 |
| 2012 | 26,430 | 27,162.71 | 2.70 | 26,592.78 | 0.62 | 26,596.02 | 0.63 |
| 2013 | 26,705 | 25,534.55 | 4.38 | 26,951.96 | 0.92 | 26,760.12 | 0.21 |
| MAPE (%) | 5.53 | 3.03 | 1.54 | ||||
| Precision (%) | 94.47 | 96.97 | 98.46 | ||||
| Predicting level | Good | Excellent | Excellent | ||||
| Year | Actual Values (NTD million) | Fourier Markov Grey Modified Models(FMGM) | |||||
| FMGM(1,1) | FM-Verhulst | FMDGM(2,1) | |||||
| Predicted | RPE (%) | Predicted | RPE (%) | Predicted | RPE (%) | ||
| 2008 | 2090 | 2090 | 2090 | ||||
| 2009 | 6994 | 7915.23 | 13.17 | 6191.73 | 11.47 | 6498.90 | 7.07 |
| 2010 | 18,268 | 17,319.84 | 5.19 | 18,691.10 | 2.31 | 18,385.93 | 0.64 |
| 2011 | 26,130 | 26,452.52 | 1.23 | 25,957.27 | 0.60 | 26,143.87 | 0.05 |
| 2012 | 26,430 | 27,500.33 | 4.05 | 26,930.41 | 1.89 | 26,933.64 | 1.90 |
| 2013 | 26,705 | 25,872.17 | 3.12 | 27,289.58 | 2.19 | 27,097.74 | 1.47 |
| MAPE (%) | 5.35 | 3.71 | 2.23 | ||||
| Precision (%) | 94.65 | 96.26 | 97.77 | ||||
| Predicting level | Excellent | Excellent | Excellent | ||||

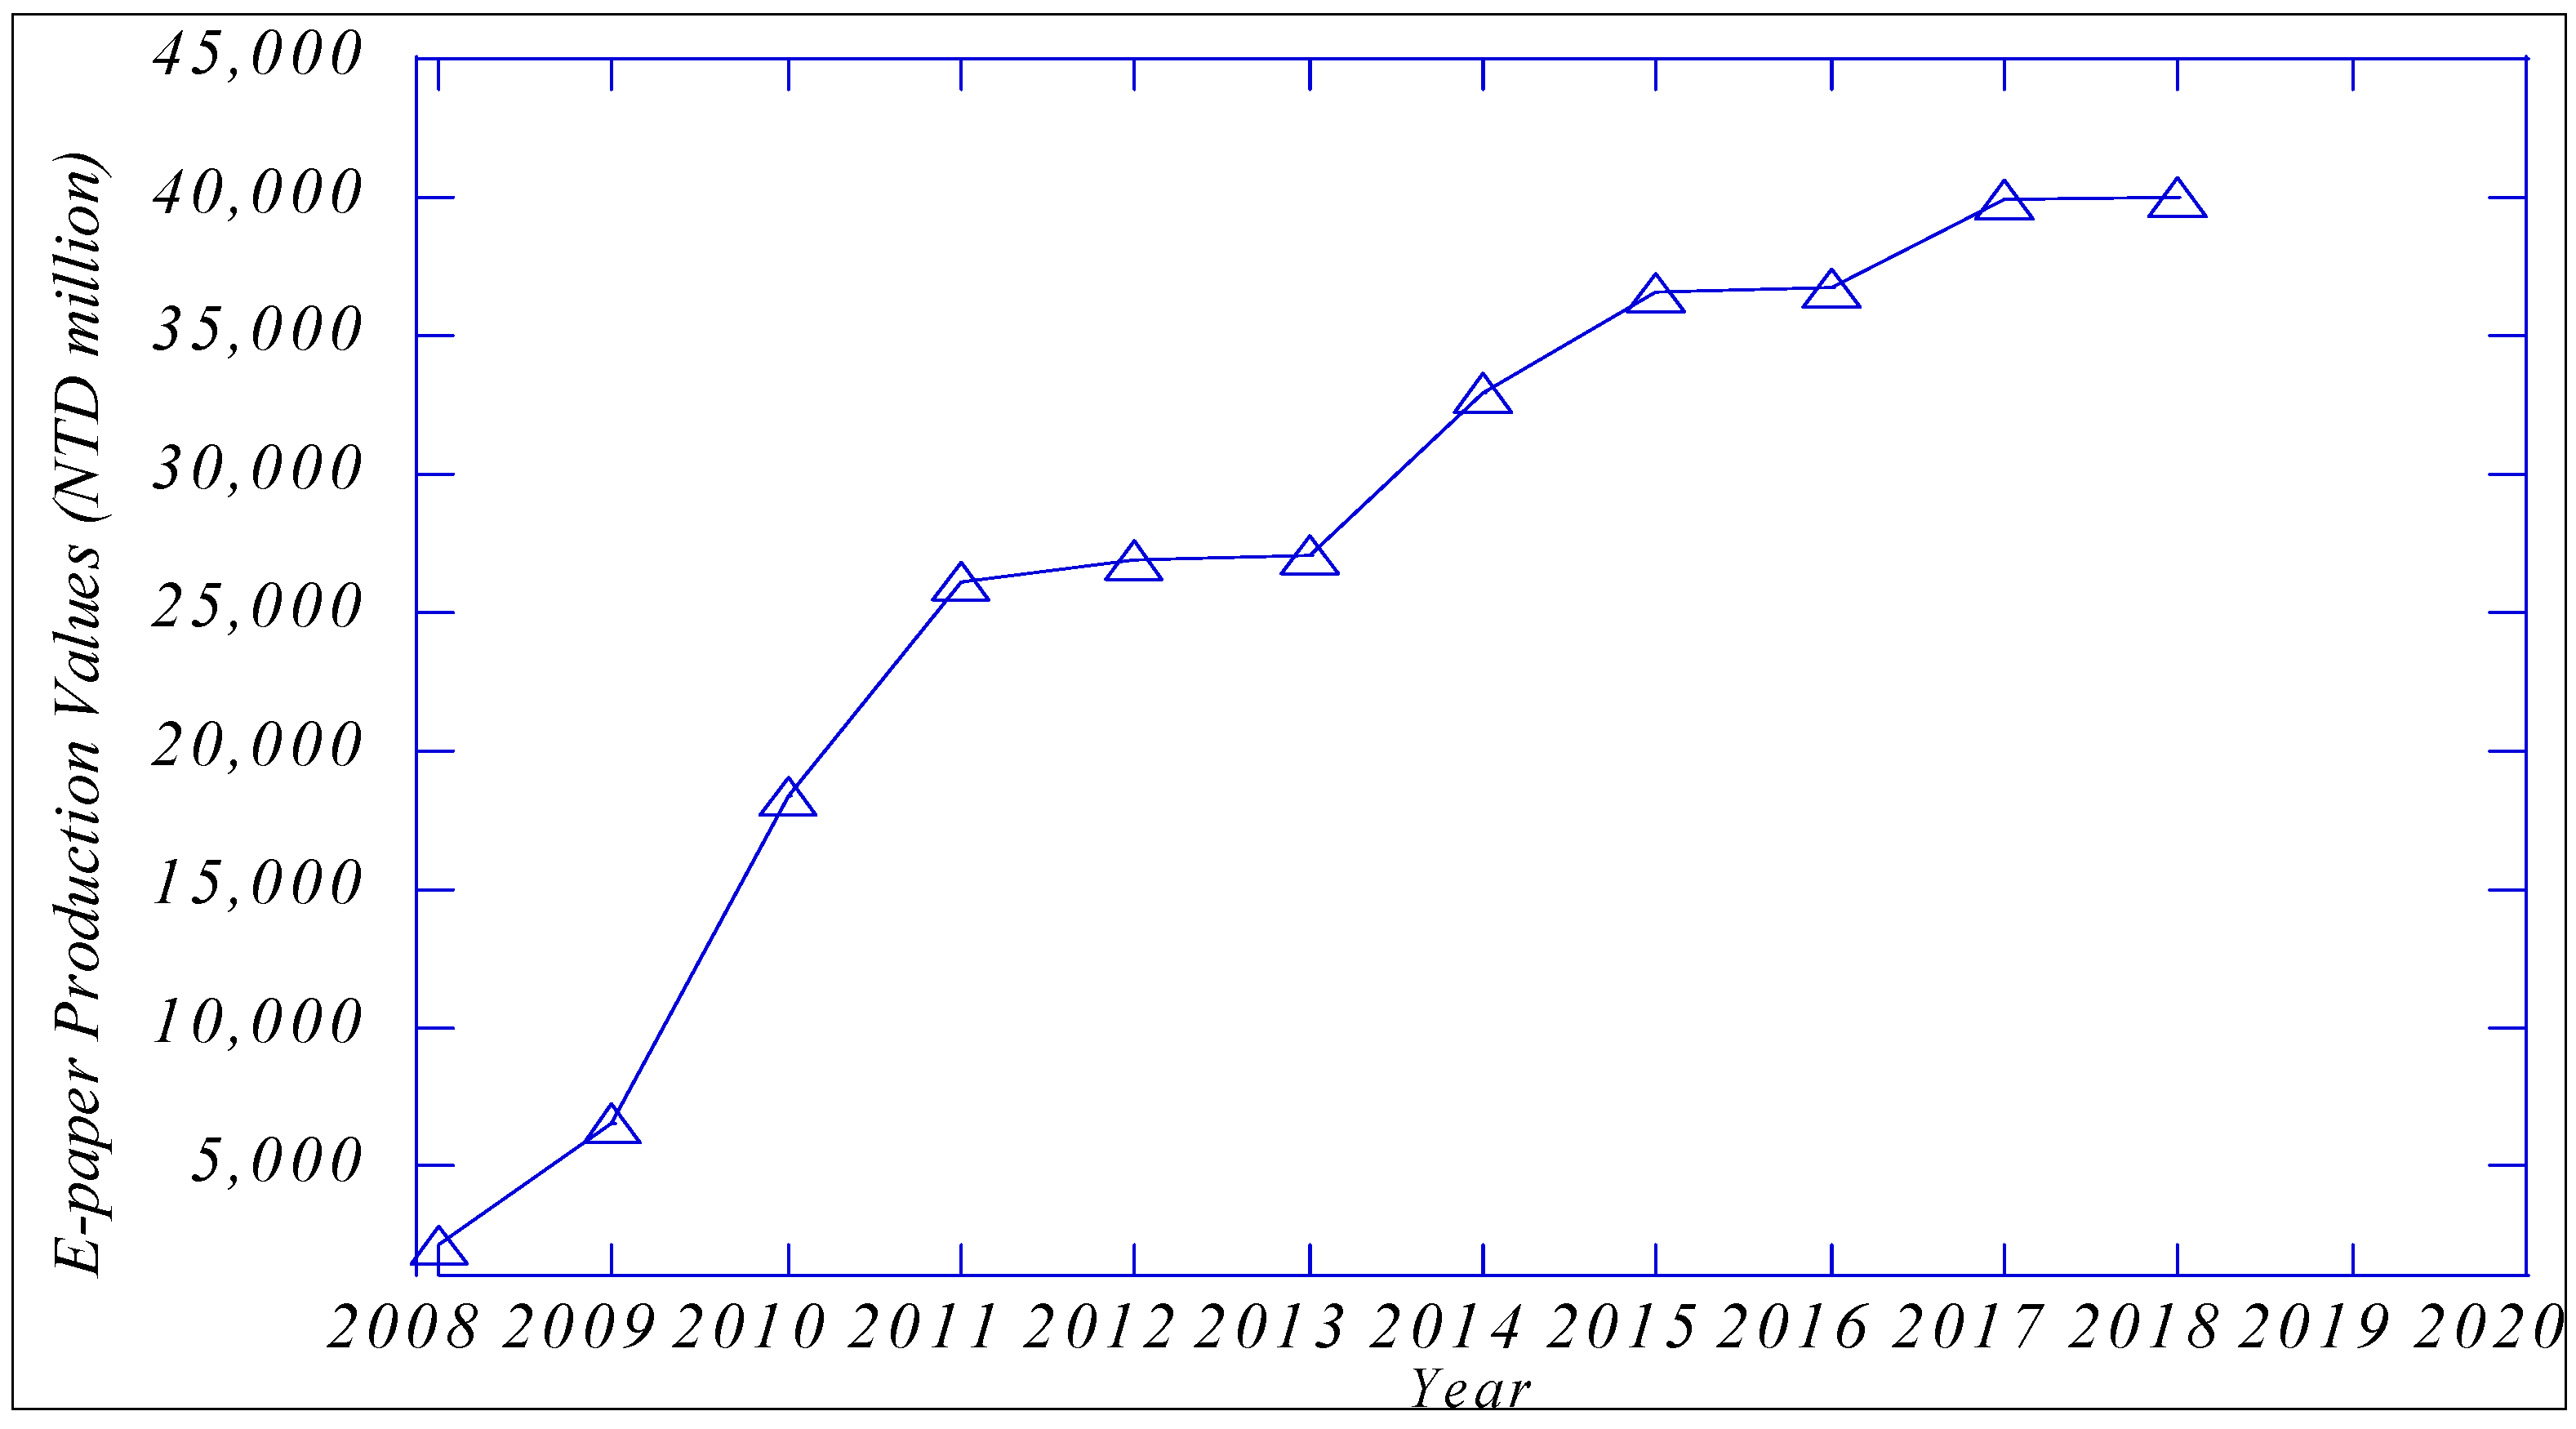
| Year | Output of E-Paper Industry (Unit: NTD Million) |
|---|---|
| 2014 | 32,954.83 |
| 2015 | 36,562.72 |
| 2016 | 36,729.07 |
| 2017 | 39,911.26 |
| 2018 | 40,024.76 |

4. Conclusions
Author Contributions
Conflicts of Interest
Nomenclature
Original series | |
First-order generated sequence by AGO | |
Coefficients of the grey different equation | |
Discrete time | |
| , , , , | Forecasted series |
| , | Residual error sequence of k point |
Length of sequence in model | |
Minimum deployment frequency of Fourier series | |
Parameters of Fourier series | |
Transition state of Markov chain | |
State space of the Markov chain | |
Transition probability matrix | |
Step of transition | |
Corresponding weigh for the state . |
Greek symbols
Accuracy rate |
Subscripts
Indices |
Superscripts
Indices | |
Transpose of matrix |
References
- Simon, F.; Colin, B. OLEDS and E-PAPER: The Disruptive Potential for the European Display Industry; Institute for Prospective Technological Studies, European Commission Joint Research Centre: Seville, Spain, 2009. [Google Scholar]
- Genuth, I. The Future of Electronic Paper. Available online: http://thefutureofthings.com/3081-the-future-of-electronic-paper (5 August 2015).
- Display Search Report. Available online: http://www.displaysearch.com/cps/rde/xchg/displaysearch/hs.xsl/090826_e_paper_display_revenues_forecast_reach_9_6b_by_2018.asp (accessed on 5 August 2015).
- Ho, J.; Kok, C. Rise of E-book Devices Boosts Taiwan Firms-Makers of Key Electronics Components Are Hoping to Grab an Early Lead in the Fast-Growing Market. Available online: http://www.wsj.com/articles/SB10001424052748704107204574474364163205796 (accessed on 5 August 2015).
- Heikenfeld, J. Prospects for Emerging e-Paper Technologies, and a New Breakthrough in Electrofluidic Displays. Available online: http://gammadynamics.net/wp-content/uploads/2011-IDW-Jason-Heikenfeld-Invited-Paper-EP5-13.pdf (accessed on 5 August 2015).
- Moriya, S.; Miyamoto, T.; Saeki, T.; Kawai, H.; Nebashi, S. Flexible electrophoretic display with inkjet printed active matrix backplane. In Proceedings of the International Conference on Digital Printing Technologies (NIP) & Digital Fabrication, Anchorage, AK, USA, 17–21 September 2007; pp. 839–842.
- Bai, P.F.; Hayes, R.A.; Jin, M.L.; Shui, L.L.; Yi, Z.C.; Wang, L.; Zhang, X.; Zhou, G.F. Review of paper-like display technologies. Prog. Electromagn. Res. 2014, 147, 95–116. [Google Scholar] [CrossRef]
- Lahey, B.; Girouard, A.; Burleson, W.; Vertegaal, R. Paper-phone: Understanding the use of bend gestures in mobile devices with flexible electronic paper displays. In Proceedings of the SIGCHI Conference on Human Factors in Computing Systems, Vancouver, BC, Canada, 7–11 May 2011; pp. 1303–1312.
- Amundson, K.; Ewing, J.; Kazlas, P.; McCarthy, R.; Albert, J.D.; Zehner, R.; Drzaic, P.; Rogers, J.; Bao, Z.; Baldwin, K. Flexible, active matrix display constructed using a microencapsulated electrophoretic material and an organic-semiconductor-based backplane. SID Symp. Dig. Tech. Pap. 2001, 32, 160–163. [Google Scholar] [CrossRef]
- Heikenfeld, J.; Drzaic, P.; Yeo, J.; Koch, T. Review paper: A critical review of the present and future prospects for electronic paper. J. Soc. Inf. Disp. 2011, 19, 129–156. [Google Scholar] [CrossRef]
- EInk. Lucent Technologies Demonstrate World’s First Flexible Electronic Ink Display With Plastic Transistors—Innovation Marks Significant Milestone in the Development of Electronic Paper. Available online: http://www.eink.com/press_releases/e_ink_lucent_plastic_transistors_112000.html (accessed on 5 August 2015).
- AUO Unveils Flexible E-Paper Technology. Available online: http://www.auo.com.tw/?sn=107&lang=en-US&c=10&n=299 (accessed on 5 August 2015).
- Chen, J.; Liu, C.T. Technology advances in flexible displays and substrates. Access IEEE 2013, 1, 150–158. [Google Scholar] [CrossRef]
- Local Players Building Taiwan into Global E-paper Production Center: Acquiring Foreign Technology Suppliers is among Strategies Used. The Free Library. Available online: http://www.thefreelibrary.com/Local+players+building+Taiwan+into+global+e-paper+production+center%3a...-a0209239010 (accessed on 5 August 2015).
- Wei, S. The Influence of the Financial Crisis on European City Tourism as Predicted by Tourism Experts. Master’s Thesis, MODUL University Vienna, Austria, 2010. [Google Scholar]
- Kang, D.; Jang, W.; Lee, H.; Joung, H. A review on technology forecasting methods and their application area. Int. Sch. Sci. Res Innov. 2013, 7, 394–398. [Google Scholar]
- Firat, A.; Woon, W.; Madnick, S. Technological forecasting—A Review. In Composite Information Systems Laboratory (CISL); Massachusetts Institute of Technology: Cambridge, MA, USA, 2008. [Google Scholar]
- Jun, S. A forecasting model for technological trend using unsupervised learning, database theory and application. Int. J. Bio-sci. Bio-technol. 2011, 258, 51–60. [Google Scholar]
- Porter, A.L.; Cunningham, S.W.; Banks, J.; Roper, A.T.; Mason, T.W.; Rossini, F.A. Forecasting and Management of Technology; Wiley: Hoboken, NJ, USA, 2011. [Google Scholar]
- Pao, H.T.; Chih, Y.Y. Comparison of linear and nonlinear models for panel data forecasting: Debt policy in Taiwan. Rev. Pac. Basin Financ. Mark. Polic. 2005. [Google Scholar] [CrossRef]
- Sun, C.; Lin, G.T.R. Hybrid grey forecasting model for Taiwan’s Hsinchu science industrial park. J. Sci. Ind. Res. 2009, 68, 354–360. [Google Scholar]
- Hsu, L.C. Applying the grey prediction model to the global integrated circuit industry. Technol. Forecast. Soc. Change 2003, 70, 563–574. [Google Scholar] [CrossRef]
- Wang, C.H.; Hsu, L.C. Using genetic algorithms grey theory to forecast high technology industrial output. Appl. Math. Comput. 2008, 195, 256–263. [Google Scholar] [CrossRef]
- Deng, J.L. Introduction to grey system theory. J. Grey Syst. 1989, 1, 1–24. [Google Scholar]
- Hossain, M.U.; Meng, L.; Farzana, S.; Thengolose, A.L. Estimation and prediction of residential building energy consumption in rural area of Chongqing. Int. J. Eng. 2013, 26, 955–962. [Google Scholar] [CrossRef]
- Kumar, U.; Jian, V.K. Time series models (Grey Markov, grey model with rolling mechanism and singular spectrum analysis) to forecast energy consumption in India. Energy 2010, 35, 1709–1716. [Google Scholar] [CrossRef]
- Wu, H.; Chen, F. Chinese exchange rate forecasting based on the application of grey system DGM(2,1) model in post-crisis era. In Proceedings of the 2010 3rd International Conference on Information Management, Innovation Management and Industrial Engineering, Kunming, China, 26–28 November 2010; pp. 592–595.
- Jiang, Y.; Yao, Y.; Deng, S.; Ma, Z. Applying grey forecasting to predicting the operating energy performance of air cooled water chillers. Int. J. Refrig. 2004, 27, 385–392. [Google Scholar] [CrossRef]
- Lin, Y.H.; Lee, P.C. Novel high-precision grey forecasting model. Autom. Construct. 2007, 16, 771–777. [Google Scholar] [CrossRef]
- Liu, S.F.; Dang, Y.G.; Fang, Z.G. Grey System Theory and Application; Science Press: Beijing, China, 2004. [Google Scholar]
- Xie, N.M.; Liu, S.F. Discrete GM(1,1) and mechanism of grey forecasting model. Syst. Eng. Theory Pract. 2005, 1, 93–99. [Google Scholar]
- Li, J.J. The optimization DGM(2,1) model and its application. J. Grey Syst. 2012, 24, 181–186. [Google Scholar]
- Kong, X.H.; Wei, Y. Optimization of DGM(2,1). J. Grey Syst. 2009, 12, 9–14. [Google Scholar]
- Shao, Y.; Su, H. On approximating grey model DGM(2,1). AASRI Proced. 2012, 1, 8–13. [Google Scholar] [CrossRef]
- Li, G.D.; Masuda, S.; Yamaguchi, D.; Nagai, M.; Wang, C.H. An improved grey dynamic GM(2,1) model. Int. J. Comput. Math. 2010, 87, 1617–1629. [Google Scholar] [CrossRef]
- Erdal, K.; Baris, U.; Okyay, K. Grey system theory_ based models in time series prediction. Expert Syst. Appl. 2010, 37, 1784–1789. [Google Scholar]
- Wang, X.; Meng, M. Forecasting electricity demand using grey-Markov model. In Proceedings of the Seventh International Conference on Machine Learning and Cybernetics, Kunming, China, 12–17 July 2008.
- Wei, L.; Fei, M. Modelling and stability analysis of grey-fuzzy predictive control. Neurocomputing 2008, 72, 197–202. [Google Scholar] [CrossRef]
- Yao, A.W.L.; Chi, S.C. Analysis and design of a Taguchi-grey based electricity demand predictor for energy management systems. Energy Convers. Manag. 2004, 45, 1205–1217. [Google Scholar] [CrossRef]
- Hsu, Y.T.; Liu, M.C.; Yeh, J.; Hung, H.F. Forecasting the turning of stock market based on Markov-Fourier grey model. Expert Syst. Appl. 2009, 36, 8597–8603. [Google Scholar] [CrossRef]
- Lin, C.T.; Lee, I. Artificial intelligence diagnosis algorithm for expanding a precision expert forecasting system. Expert Syst. Appl. 2009, 36, 8385–8390. [Google Scholar] [CrossRef]
- Wen, K.L. Grey Systems: Modeling and Prediction; Yang’s Scientific Research Institute: Tucson, AZ, USA, 2004. [Google Scholar]
- Wen, K.L.; Huang, Y.F. The development of grey Verhulst toolbox and the analysis of population saturation state in Taiwan-Fukien. In Proceedings of the IEEE International Reference on Systems, Man and Cybernetics, The Hague, The Netherlands, 10–13 October 2004; Volume 6, pp. 5007–5012.
- Shen, D.H.; Wu, C.M.; Du, J.C. Application of grey model to predict acoustical properties and tire/road noise on asphalt pavement. In Proceedings of the IEEE Intelligent Transportation Systems Conference, Toronto, ON, Canada, 17–20 September 2006; pp. 175–180.
- Guo, Z.; Song, X.; Ye, J. A Verhulst model on time series error corrected for port throughput forecasting. J. East. Asia Soc. Trans. Stud. 2005, 6, 881–891. [Google Scholar]
- Li, Z.; Wang, W.; Chen, M. Improved Grey-Markov chain algorithm for forecasting. Kybernetes. 2009, 38, 329–338. [Google Scholar]
- Hasantash, G.H.; Mostafaei, H.; Kordnoori, S. Modelling the errors of EIA’s oil prices and production forecasts by the Grey-Markov model. Int. J. Econ. Financ. Issues. 2012, 2, 312–319. [Google Scholar]
- Zhang, Y. Predicting model of traffic volume based on Grey-Markov. Mod. Appl. Sci. 2010, 4, 46–50. [Google Scholar] [CrossRef]
- Lee, C.; Lin, C.T.; Chen, L.H. Accuracy analysis of the grey Markov forecasting model. J. Stat. Manag. Syst. 2004, 7, 567–580. [Google Scholar] [CrossRef]
- Tan, C.H.; Chang, H.P. Residual correction method of Fourier series to GM(1,1) model. In Proceedings of the First National Conference on Grey Theory and Application, Kaohsiung, Taiwan, 2 November 1996; pp. 93–101.
- Ma, H.; Zhang, Z. Grey prediction with Markov chain for crude oil production and consumption in China. Adv. Intell. Soft Comput. 2009, 56, 551–561. [Google Scholar]
- Liu, S.; Deng, J. The application area of GM(1,1). Syst. Eng. Theory Pract. 2000, 5, 121–124. [Google Scholar]
© 2015 by the authors; licensee MDPI, Basel, Switzerland. This article is an open access article distributed under the terms and conditions of the Creative Commons Attribution license (http://creativecommons.org/licenses/by/4.0/).
Share and Cite
Huang, Y.-F.; Wang, C.-N.; Dang, H.-S.; Lai, S.-T. Predicting the Trend of Taiwan’s Electronic Paper Industry by an Effective Combined Grey Model. Sustainability 2015, 7, 10664-10683. https://doi.org/10.3390/su70810664
Huang Y-F, Wang C-N, Dang H-S, Lai S-T. Predicting the Trend of Taiwan’s Electronic Paper Industry by an Effective Combined Grey Model. Sustainability. 2015; 7(8):10664-10683. https://doi.org/10.3390/su70810664
Chicago/Turabian StyleHuang, Ying-Fang, Chia-Nan Wang, Hoang-Sa Dang, and Shun-Te Lai. 2015. "Predicting the Trend of Taiwan’s Electronic Paper Industry by an Effective Combined Grey Model" Sustainability 7, no. 8: 10664-10683. https://doi.org/10.3390/su70810664
APA StyleHuang, Y.-F., Wang, C.-N., Dang, H.-S., & Lai, S.-T. (2015). Predicting the Trend of Taiwan’s Electronic Paper Industry by an Effective Combined Grey Model. Sustainability, 7(8), 10664-10683. https://doi.org/10.3390/su70810664