Article

Using Social Media for Emergency Response and Urban Sustainability: A Case Study of the 2012 Beijing Rainstorm

1
State Key Laboratory of Information Engineering in Surveying, Mapping and Remote Sensing, Wuhan University, Wuhan 430079, China
2
School of Statistics and Mathematics, Zhongnan University of Economics and Law, Wuhan 430073, China
3
Department of Geography, Kent State University, Kent, OH 44240, USA
4
College of Environment and Planning, Henan University, Kaifeng 475001, China
*
Authors to whom correspondence should be addressed.
Sustainability 2016, 8(1), 25; https://doi.org/10.3390/su8010025
Submission received: 3 October 2015 / Revised: 15 December 2015 / Accepted: 22 December 2015 / Published: 28 December 2015
(This article belongs to the Special Issue Geo-Informatics in Resource Management & Sustainable Ecosystem)

Abstract

:
With the proliferation of social media, information generated and disseminated from these outlets has become an important part of our everyday lives. For example, this type of information has great potential for effectively distributing political messages, hazard alerts, or messages of other social functions. In this work, we report a case study of the 2012 Beijing Rainstorm to investigate how emergency information was timely distributed using social media during emergency events. We present a classification and location model for social media text streams during emergency events. This model classifies social media text streams based on their topical contents. Integrated with a trend analysis, we show how Sina-Weibo fluctuated during emergency events. Using a spatial statistical analysis method, we found that the distribution patterns of Sina-Weibo were related to the emergency events but varied among different topics. This study helps us to better understand emergency events so that decision-makers can act on emergencies in a timely manner. In addition, this paper presents the tools, methods, and models developed in this study that can be used to work with text streams from social media in the context of disaster management and urban sustainability.

1. Introduction

Social media has become a universal phenomenon in our society [1]. As a new data source, social media have been widely used in knowledge discovery in fields related to health [2], human behaviour [3,4,5], social influence [6,7], and market analysis [8,9,10]. Li et al. [11] presented a framework of news recommendation based on social media that was developed to meet the dynamic nature of a discussion forum. By soliciting individual data of food-related activities from social media, Chen and Yang [12] studied the relationship between people’s preferences for food and the exposure to their immediate food environment in Columbus, Ohio, USA.
Social media contains a wealth of location information, which can help us understand some of the phenomena associated with the geographic location and reveal the law hidden behind the phenomenon. Li [13] investigated the relationships between tweets and photo densities to explore the socioeconomic characteristics of creators by geographic data. To reflect a geographic region’s status on Twitter, Lee et al. [14] proposed an event detection system based on geographic regularity of the tweets. In addition, Cheng and Wicks [15] employed space-time scan statistics to detect statistically significant space-time events. Using the 2012 US Presidential Election candidates as a case study, Tsou et al. [16] analyzed the spatial distribution of web pages and related social media (Twitter) messages, which can facilitate the tracking of ideas and social events disseminated in cyberspace from a spatial-temporal perspective.
Using check-in data in location-based social networks, a model of human mobility dynamics was developed to capture and predict human mobility patterns [17]. By combining with a probabilistic topic model, Ferrari et al. [18] presented an approach that automatically extracted urban activity patterns from location-based social network data. Furthermore social network data with GPS was applied in studying the correlation between users and locations in terms of user-generated GPS trajectories [19].
At the same time, social media has played an increasingly important role in disaster emergency responses [20]. Social media can be used in disaster preparedness, response, and recovery.
Social media, as a source of spatio-temporal information, can help us understand the state of emergency events. Using the Red River event as a case study, Starbird et al. [21] identified mechanisms of information production, distribution, and organization using messages from Twitter. A case study of the 2010 Yushu Earthquake was conducted to investigate the role of social media in responing to major disasters and enabled us to gain insights into harnessing the power of microblogging [22]. Using Hurricane Sandy as a case study, Guan and Chen [23] demonstrated temporal–spatial patterns of Twitter activities particularly near coastal areas and in large urban areas to explore the relationship between hurricane damages and Twitter activities.
Social media can provide rapid and immediate real-time information about events that helps provide greater situational awareness leading to better decision-making. Using social media as a human-centric sensor, we may detect a wildfires at an earlier stage, which was essential to dealing with such a large-area natural disaster [24,25]. A probabilistic spatiotemporal model for a target event based on twitter was constructed to find the center of the event location, which was implemented as an earthquake reporting system in Japan [26]. Chae et al. [27] presented a visual analytical system to analyze the extracted public behaviour responses from social media during and after natural disasters that helped to increase situational awareness of local events and improve both planning and investigation.
Furthermore, information from the general public based on social media can enhance emergency situation awareness across a range of crisis types [28]. During the 2010 Haitian earthquake, social media technology was integrated with emergency knowledge management to improve the efficiency of crisis response in a dynamic and challenging environment [29].
In order to explore how to use social media to obtain timely emergency information, we present in the subsequent sections a computational platform for mining topic-based emergency information. With a case study to analyze the social media text streams during and after the 2012 Beijing Rainstorm, we first classified the social media text streams related to the 2012 Beijing Rainstorm by different topics of the text messages. Using a trend analysis, we not only studied the relationship between overall trends of social media text streams but also the trend of emergency events. We also found a very strong correlation between stages of development of emergency events and the fluctuations of Sina-Weibo for different topics. Combined with spatial statistical analysis methods, we discovered the distributions of Sina-Weibo by different message topics. We also detected clusters in the spatial distribution of Sina-Weibo. All of this can help to understand how the emergency events evolved and what were impacted by the events. This understanding will benefit decision-makers by allowing timely decisions emergencies for effective mitigation efforts and better allocation of resources. This paper discusses the tools, methods, and models we developed for making use of social media in the context of disaster management.
The remainder of this paper is structured as following: Section 2 reviews related work. Section 3 describes the social media and the unique characteristics of data from social media. Section 4 introduces the trend analysis and spatial analysis methods used in this study on 2012 Beijing Rainstorms. We then conclude our discussion with a summary of the findings and directions for further works.

2. Related Work

The fast development of Information and Communication Technologies (ICTs) facilitated public participation in emergency responses through social media. Yin et al. [28] examined how to detect unexpected incidents from the mass social media text streams. Different from extracting whole messages of the incidents that most researchers used, Qu et al. [22] devised and applied a message classification scheme to classify the contents of incident-related text messages. They found that the classified categories of message contents are often too generalized to provide specific information about emergency responses. Although Vieweg et al. [30] utilized a qualitative coding scheme to derive detailed categories for the messages, the scheme needed a great deal of manual work and was difficult to use when dealing with high volumes of messages due to a lack of automatic procedures.
Using a machine learning algorithm, Imran et al. [31] classified message contents into four categories—“Caution/Advice”, “Donation”, “Casualty/damage” and “Information Source”. This work was similar to our approach in terms of ways to categorize text messages. However, in our search, we paid particular attention to classify and directly extract disaster-related topics from real-time text streams so that we could model them by topics of text contents with a supervised learning algorithm that used a set of iterative procedures for extracting keywords and accumulating learned contents in the processes.
In order to reveal temporal trends of incidents, De Longueville et al. [24] counted the number of relevant tweets per hour and used the results to construct a temporal trend of tweets. It was demonstrated that the trend fitted well with the time line of the major events related to the Marseille Fire. In other works [32,33,34], observable correlations between tweets aggregated by time intervals and disease occurrences were found to be statistically significant. This further suggested the feasibility of using social media text streams as an analogue to different types of events in our society.
The aforementioned studies showed overall trends of incidents but few directly addressed disaster-related topics. To fill this gap, we report here our study of the relationship between development trends of emergency events and the fluctuations of Sina-Weibo under different topics.
Researchers have also explored the usage of the spatial tags in social media’s text messages during incidents. By combining web-search engines and keywords search with real-world coordinates, a new approach has emerged that allowed us to track and analyze message contents on public social networks for studying human thoughts and communication patterns [35]. An example is Chae et al. [28] that investigated the distribution of Twitter users as a geospatial heat map. Such map can help detect the seriously damaged areas in disasters. Combining texts with the location of twitters and visualizing the tag clouds on an interactive map, a scalable approach to detecting spatial cluster, Tom et al. developed a new way to track and model abnormal events. Another example is one that used a clustering-based space partition method to detect normal and abnormal patterns as shown by geo-located twitter messages [14]. In this paper, we demonstrate a new way of applying spatial statistical analysis to analyze Sina-Weibo messages to study the spatial distribution of the incidents, even the anomalies.

3. Social Media and Its Data Characteristics

Social media is a type of social interaction between people. With social media, people create, share or exchange information and ideas in virtual communities and networks. Sina-Weibo (e.g., http://us.weibo.com), a Twitter-like microblogging system, is the most popular microblogging service in China [22]. The unique characteristics of Sina-Weibo are as follows:
(1)
Short, topical text messages: Different from other blogging sites, the length of Sina-Weibo text messages is limited to 140 words or less, and emoticons are allowed to express emotions. During emergency events, the concerns of different groups are often different. For example, those who dispatch resources to affected areas would have different concerns from what the victims are concerned with. These would also change over time as emergency events developed. Topical tags of the text messages help followers to discern them based on their interests and needs.
(2)
Time-sensitivity: the popularity of smart handheld mobile devices and the development of modern communication technology make it easier to publish one’s thoughts and ideas via Sina-Weibo. When an emergency occurs, affected individuals usually post the information of the events to social networks immediately. People in social networks can publish their concerns, views, or even suggestions about the events after seeing the information. The timely posting and discussions reflect how people are concerned with the events and, in many cases, also where these people are located.
(3)
Location information: Sina-Weibo encourages users to share location information. By analyzing the Sina-Weibo published in 2013, we find that 6.656% of the total number of Sina-Weibo contains GPS information.

4. Emergency Information Mining and Analysis

During emergency events, social media text streams contain a large number of emergency information at different spatio-temporal scales and about different topics. By analyzing the vast amounts of social media text streams, it is possible to obtain emergency information regarding event scenes, status of rescues, and influence of the event. Developmental trend of events, as well as people’s concerns during the different phases of the events, can be revealed by analyzing the changing trends over time about the number of social media text streams being sent out. Using geographic attributes of social media text streams, emergency information on the spatial distribution pattern of event can be extracted, and spatial clusters of text messages about the emergency can be detected.

4.1. The Classification and Location of Emergency Information

As the first step in analyzing Sina-Weibo, we formulated a classification and location model. This model combines a latent Dirichlet allocation (LDA) algorithm [36] and a support vector machine (SVM) algorithm [37] to classify Sina-Weibo text streams in real time. We first used the LDA algorithm to classify Sina-Weibo text streams posted by topics of concerns in the initial stage of the emergency event. Then, we utilized the classification results as training samples for the SVM algorithm. Thus, each Sina-Weibo text obtained in real time was classified using SVM algorithm. It should be noted that additional steps might be needed for the model. First of all, because of the noise of the text, text pre-processing was necessary for the original Sina-Weibo texts. Given that the contents of Sina-Weibo texts were time-sensitive during the unfolding of emergency events, the emergency information classification model should be reconstructed iteratively with regular time intervals. Therefore, as shown in the Figure 1, the specific processes of the model were as follows:
(1)
For the original Sina-Weibo texts, Chinese word segmentation was applied to the original Sina-Weibo text first. In addition, Sina-Weibo emoticons, which conveyed important semantic information, should be added to the dictionary for Chinese word segmentation. Then, stop words, which are composed by a pointless word, are removed.
(2)
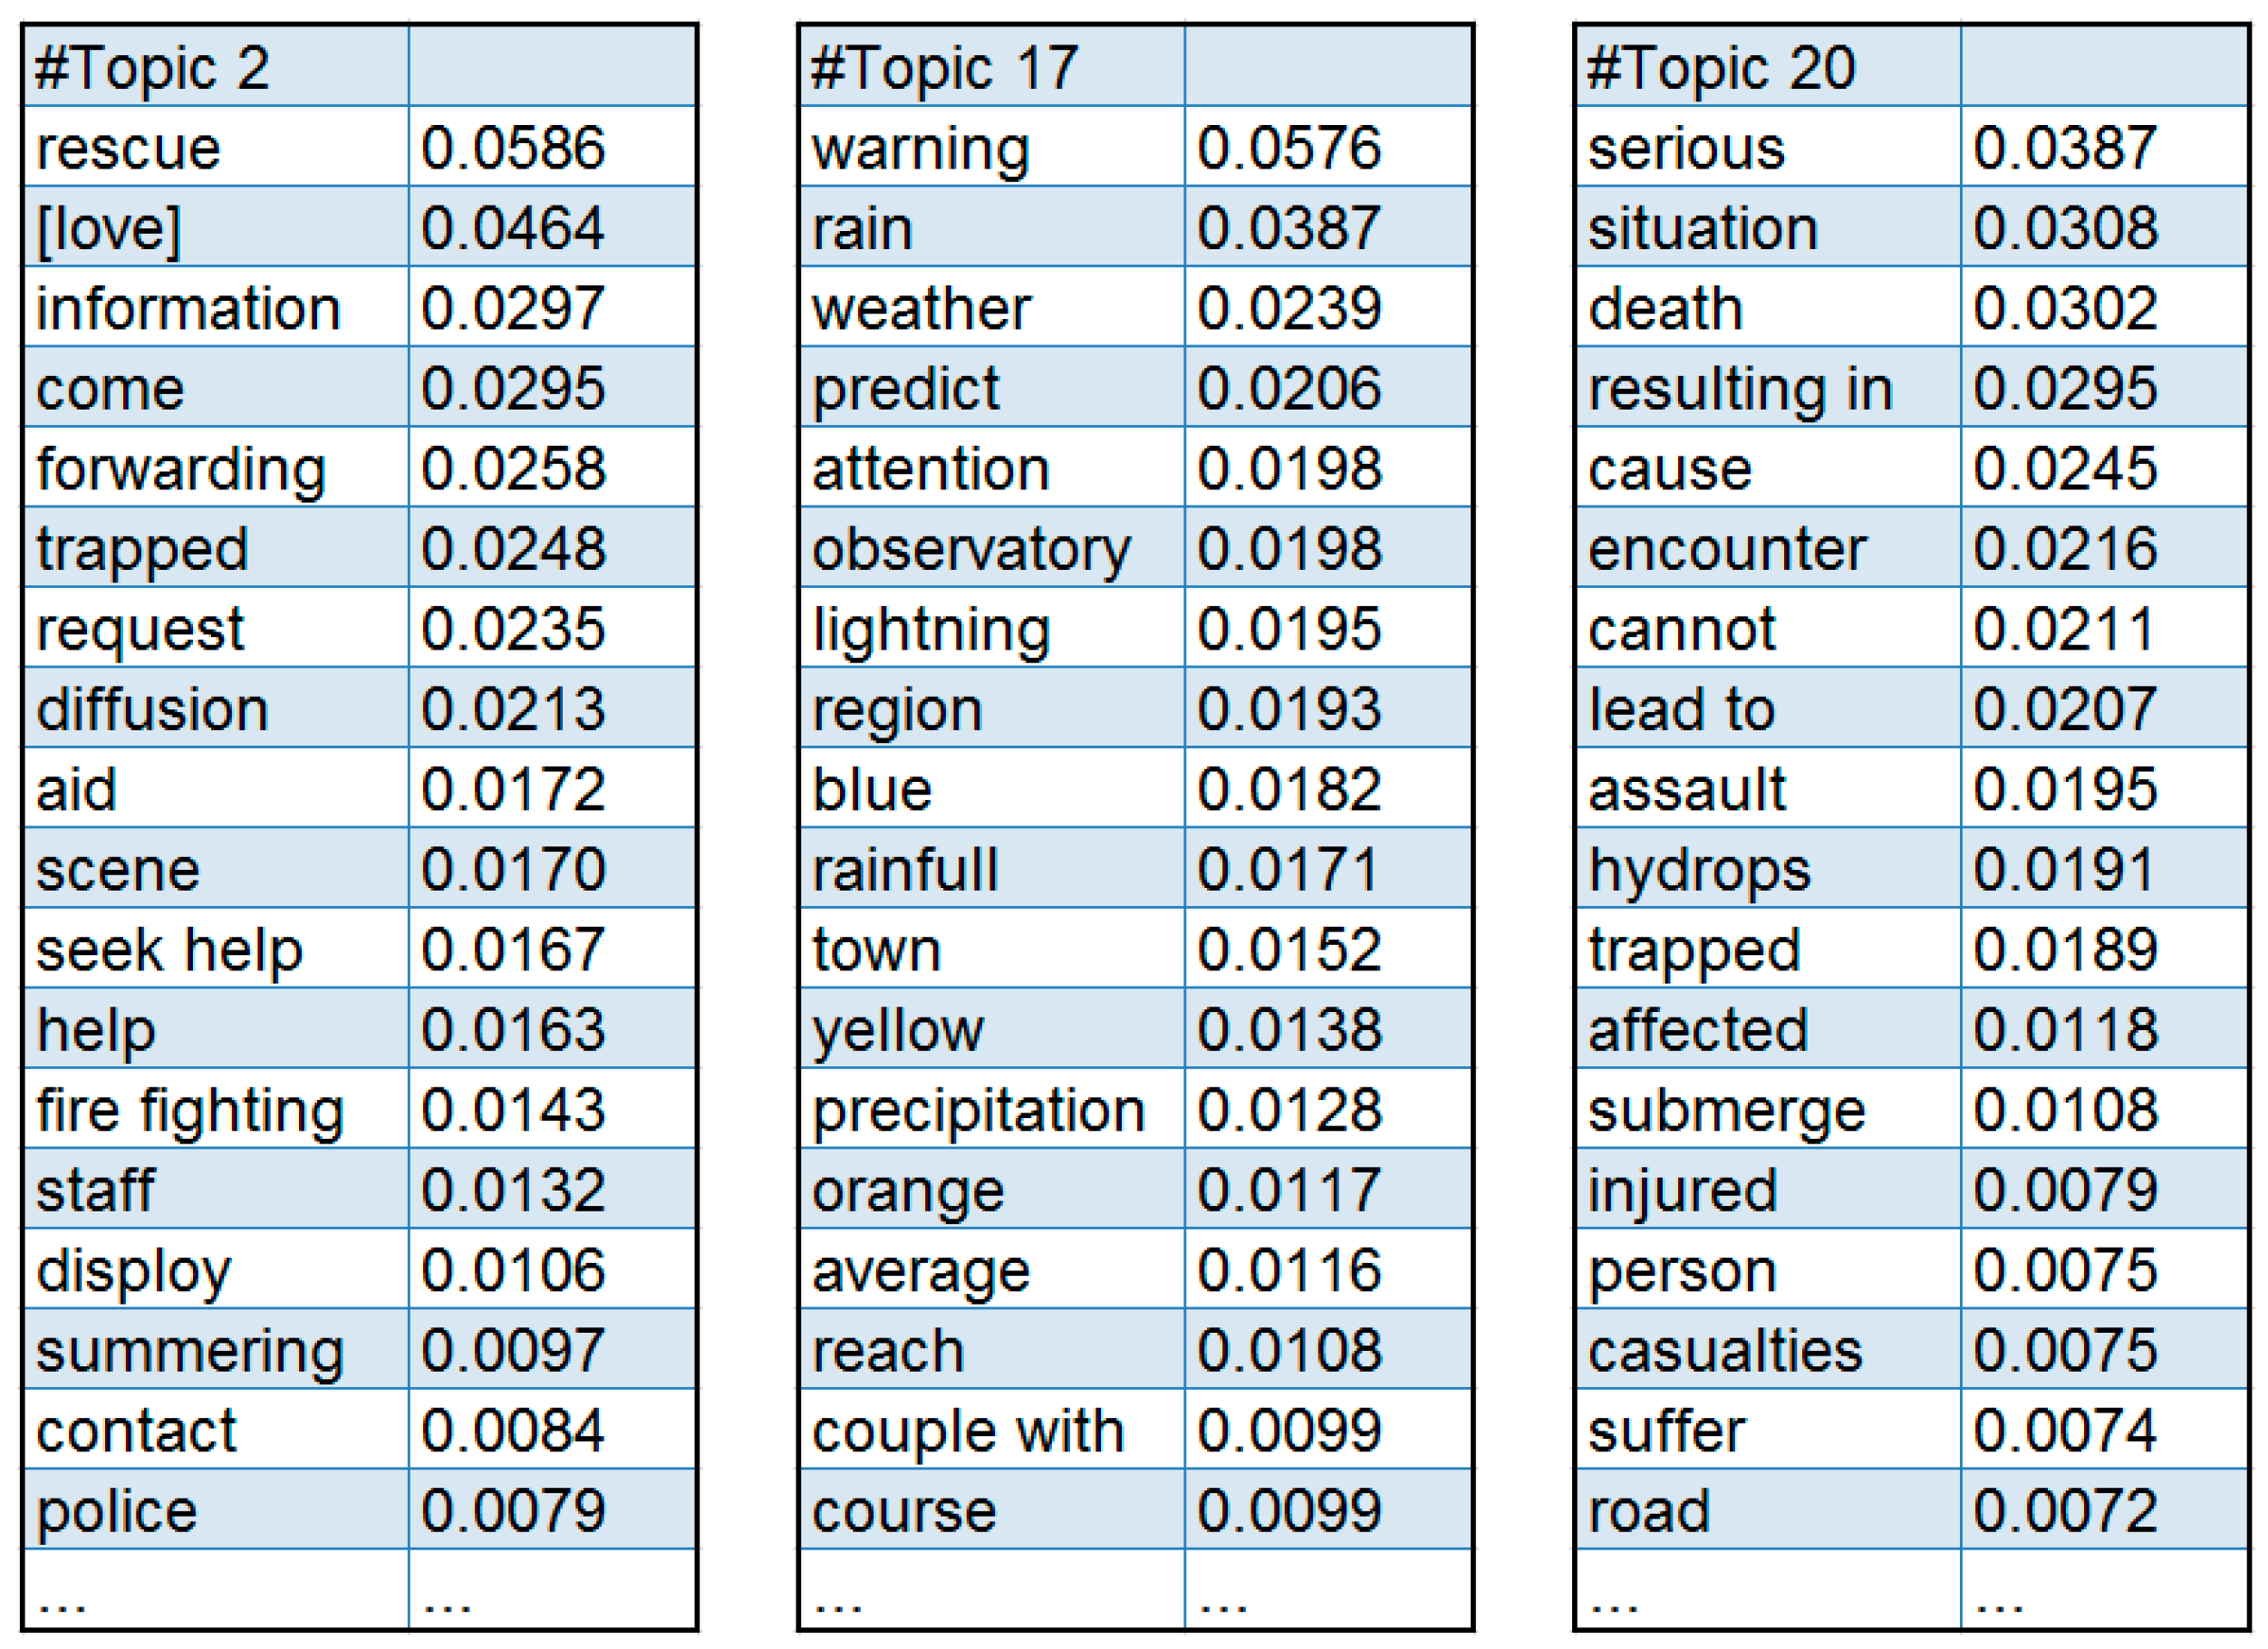
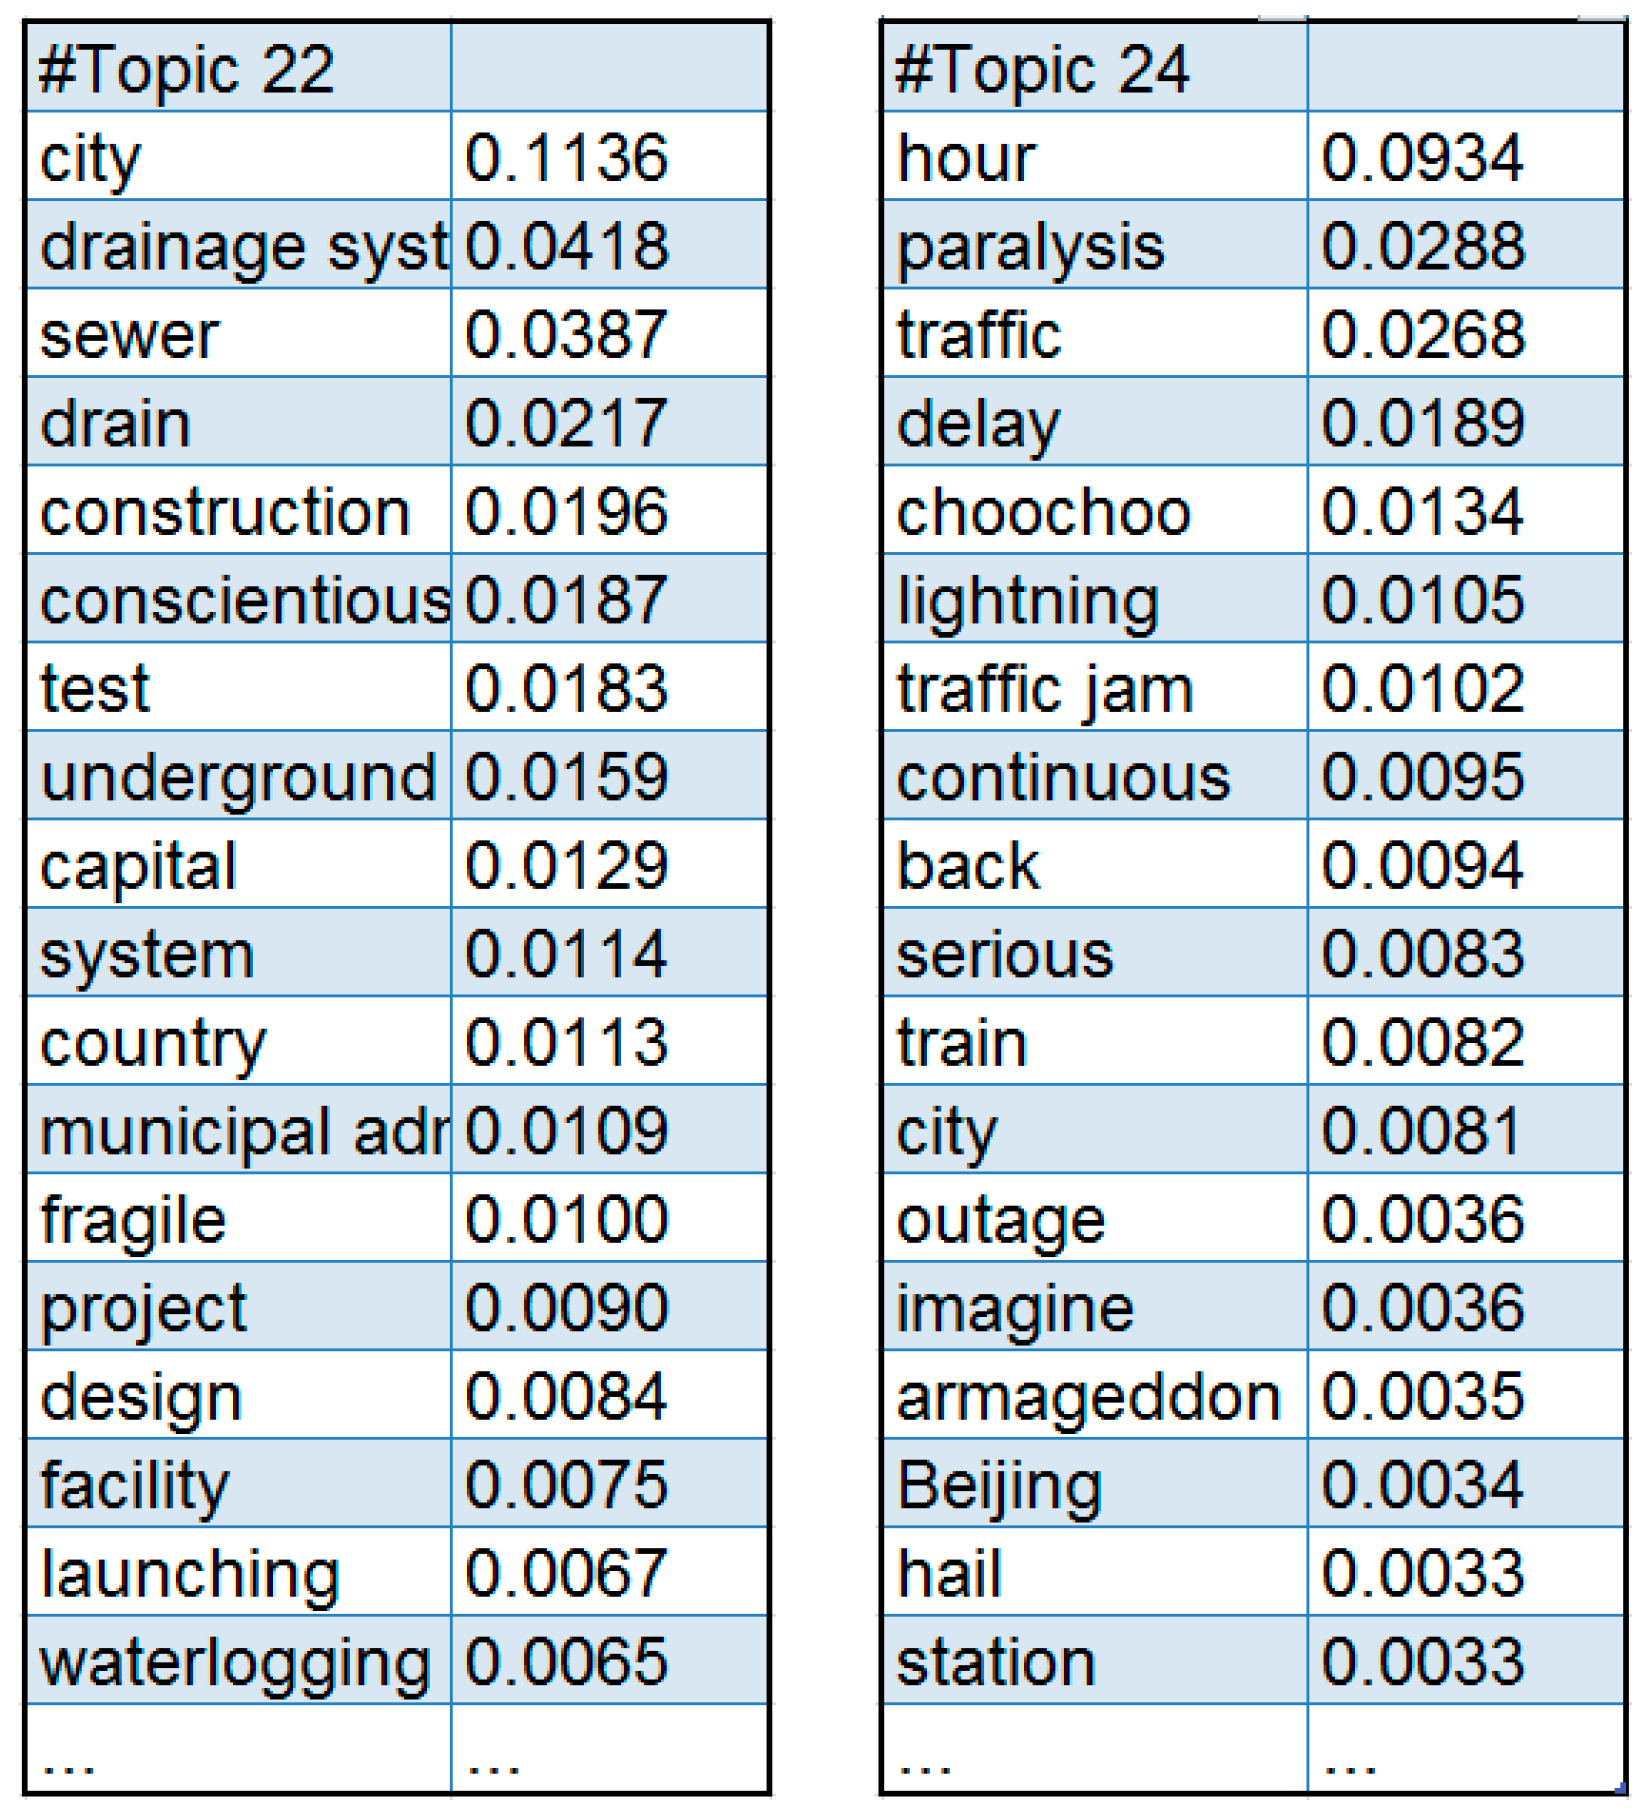
Using LDA topic model for the Sina-Weibo text after data pre-processing, we obtained two lists. One is Topic-Terminology lists, and the other is Document-Topic lists, and the Document-Topic lists obtained from LDA was regarded as training samples for SVM.
(3)
When a new Sina-Weibo text was acquired, we identified the category to which it belonged by applying the SVM algorithm.
(4)
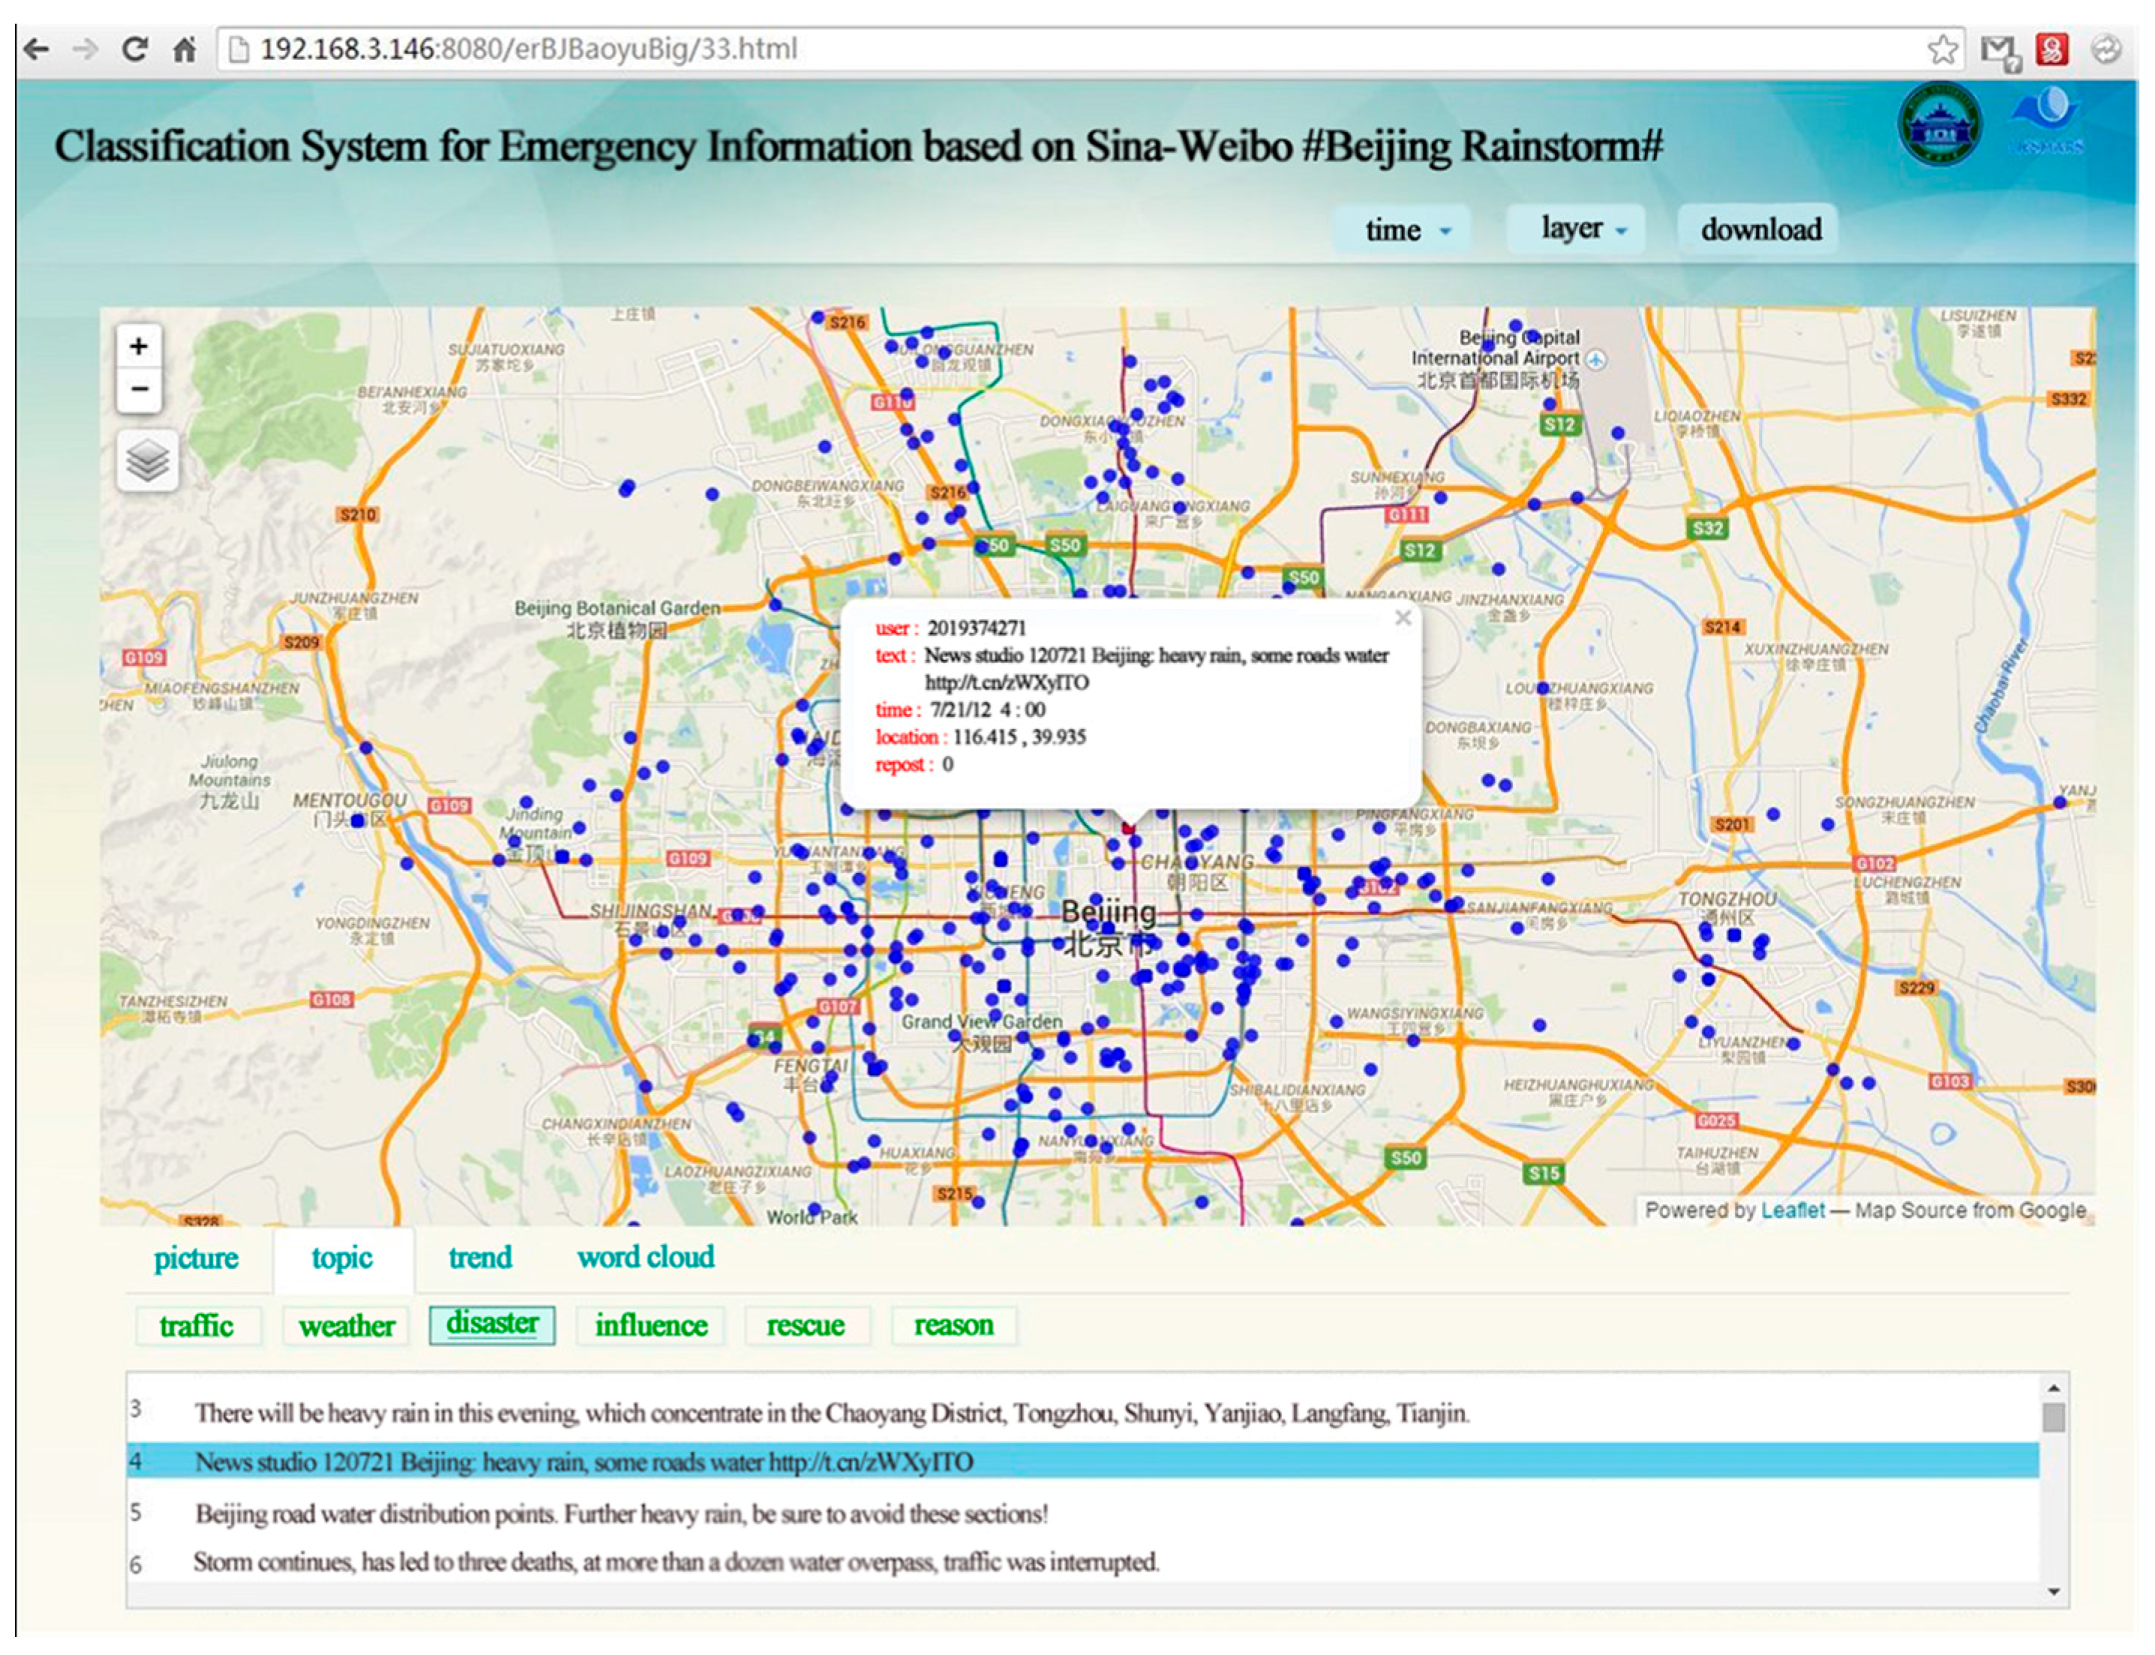
In order to display Sina-Weibo texts by topics, we geotaged the Sina-Weibo that contain GPS information.
(5)
In regular time intervals, re-do the step (1) and the step (2), so that the emergency information classification model was adapted to new Sina-Weibo texts.
Figure 1. The word frequency distribution of different topics.
Sustainability 08 00025 g001aSustainability 08 00025 g001b
In our case study, on 21–22 July 2012, Beijing suffered the strongest rainstorm and urban flooding in over 60 years. According to data released by the Beijing City Government, about 1.6 million people’s normal daily lives were disrupted, some 10.6 thousand houses were destroyed and the economic loss was estimated to be around 11.64 billion yuan. Using web crawlers and Sina-Weibo API, we collected 706,835 Sina-Weibo with “Beijing rainstorm” as the keyword with time stamps between 00:00 a.m. on 20 July and 00:00 a.m. on 11 August. Among collected, there were 26,050 Sina-Weibo texts which contained GPS information, and 10,988 of them were located in Beijing.
Initially, we used 79,723 Sina-Weibo texts that were captured between 00:00 a.m. on 20 July and 00:00 a.m. on 22 July as original data for constructing a list of message topics. Each Sina-Weibo text was pre-processed by a word segmentation procedure, which allowed individual words in the document be analyzed separately [38]. Gibbs Sampling algorithm was used to implement the LDA model. In order to identify the number of topics for LDA model, we conducted repeated experiments to look for an optimal number of topics that would overlap the least among them. Based on experimental results we found that when the number of topics was 40, identified topics had clearer, unique characteristics than there would be with more topics or fewer topics. Consequently, the number of topics in the LDA model was set to be 40. Using the LDA model, we obtained the Topic-Terminology lists and the Document-Topic lists.
The Topic-Terminology lists showed the vocabularies of each topic included and the frequency of these vocabularies occurred. From the Topic-Terminology lists, some of the Topic-Terminology lists are shown in Figure 1, and we can see that some of the 40 topics seemed to be very interesting and relevant with rainstorm, and some of the 40 topics seem pointless. Hence, for subsequent analysis, some of the topics from the emergency information were selected and similar topics were merged. At the same time, some of the pointless topics were discarded. Finally, in the event of “Beijing rainstorm”, we generalized some of the 40 topics into five topics (“traffic”, “weather”, “disaster information”, “loss and influence”, “rescue information”).
The Document-Topic lists show the topics of each Sina-Weibo texts might belong and the probability of these topics. In this paper, for a Sina-Weibo text, if the greatest probability of belonging to a topic is greater than the three times of the average value, the Sina-Weibo text was considered to be belonging to this topic. Otherwise, the Sina-Weibo text would be considered to be belonging to none of these topics.
The Sina-Weibo texts and the topic of each Sina-Weibo text belonged to as obtained from LDA would serve as a training sample for the SVM algorithm. SVM algorithm was applied to classify Sina-Weibo texts obtained in real-time. In order to verify the accuracy of the classification when using SVM algorithm, the original Sina-Weibo texts, which were classified by using LDA model, were divided into five groups randomly. Among the five groups, four groups were the training sample sets and one was a test set for SVM. Using cross-validation for the test set, as shown in the Table 1, the accuracy of classification was found to be 87.5%, which seemed to indicate a valid classification for emergency information by the defined topics.
Table 1. The results of cross-validation.
12345Total
accuracy89.8%83.7%91.4%87.1%85.5%87.5%
Using this model, we implemented a prototype system that classified Sina-Weibo texts in real-time and displayed the Sina-Weibo texts with GPS information on the map, by topics, as shown in the Figure 2.
Figure 2. A prototype system for topic classification of Beijing Rainstorm.
Sustainability 08 00025 g002

4.2. Trend Analysis

Analyzing the trends of social media text streams can reveal changes in people's concerns during different phases of emergency events. When an emergency event occured, the number of Sina-Weibo text streams related to the emergency event tended to fluctuate over time. Analyzing this fluctuation, the overall trend of emergency event could be assessed. It could help us to better prepare for emergencies. In addition, topics discussed by Sina-Weibo texts would change as the emergency event evolved. Analyzing changes in the number of Sina-Weibo text streams for different topics, the development process of emergency events could be revealed. It could help us understand what people were concerned at what stage of the emergency events.

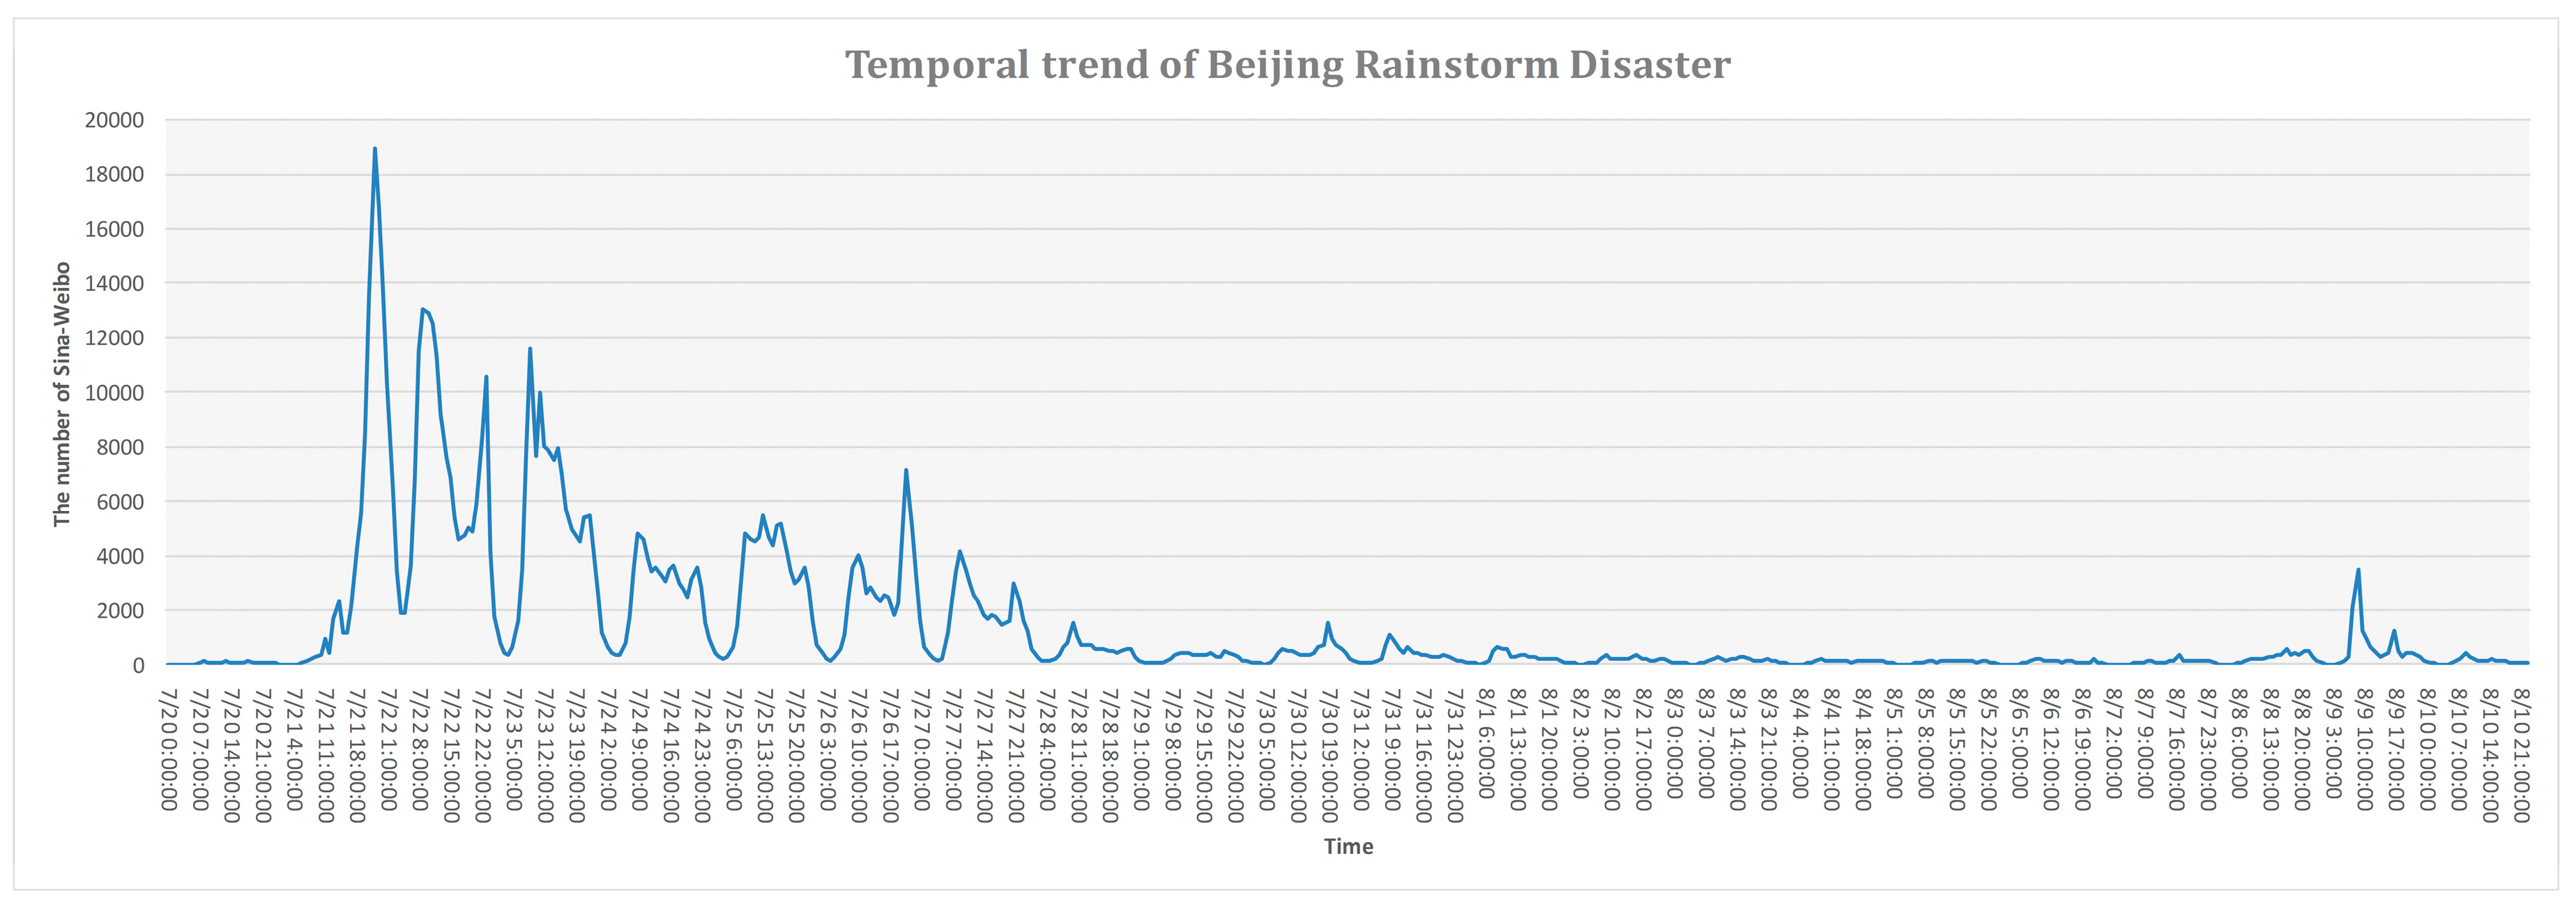
4.2.1. Overall Trend

Achrekar et al. [34] and Nagel et al. [32] suggested that changes in the number of social media streams can be used to identify how events evolved, and even to make predictions. In this study, we found that there was a significant correlation between the trend of emergency events and the changes in the numbers of Sina-Weibo text streams on the topic. In this study, we counted the number of Sina-Weibo texts related to the “Beijing rainstorm” at different times. The trend of the number of Sina-Weibo texts related to the “Beijing rainstorm” is shown in Figure 3. From Figure 3, we can see that the Sina-Weibo texts related to the “Beijing rainstorm” were concentrated within a week after the rainstorm. Then, they began to slowly subside, and finally faded out of being a social media hot topic. The lowest point of the curve in the figure each day was about 4:00 a.m. This was very consistent with the people’s habits. From the 4:00 a.m., the curve begins to rise sharply. After reached a peak, the curve began to fluctuate, and finally fell to around 4:00 a.m. for another day. Taking into account the cyclic changes of the curve, we hypothesized that this time series contained multi-phase fluctuation cycle by day, and we used seasonal decomposition [39] to explore this trend.
Figure 3. Temporal trend of Beijing Rainstorm Disaster.
Sustainability 08 00025 g003
In this paper, an approach to understand the time series by decomposition was adopted. As expressed in Equation (1), the time series can be considered as the sum of three components: a trend component, a seasonal component, and a remainder: Here, x t is the original time series of interest, T t is the trend component, S t is the seasonal component, and R t is the residual component.
x t = T t + S t + R t
Figure 4 shows the result of the extracted seasonal trend from the trend as shown by the number of Sina-Weibo texts related to the “Beijing rainstorm”. Figure 4a shows the trend component. It reflects overall trends of the number of Sina-Weibo texts related to the “Beijing rainstorm”. Figure 4b shows the seasonal component. It reflects the part of cyclical changes in the number of Sina-Weibo texts related to the “Beijing rainstorm”. As can be seen from Figure 4b, the lowest point of the number of Sina-Weibo texts occurred at about 4:00 every day, and there were two daily peaks around 9:00 and 22:00, which reflected well in the cyclical trends of microblogging activity. Figure 4c shows the residual component. It reflected some fluctuations of the number of Sina-Weibo texts resulting from the causal factors.
Figure 4. A seasonal-trend decomposition of temporal trend of rainstorm. (a) trend component; (b) seasonal component; (c) residual component; (d) seasonally adjusted time series.
Sustainability 08 00025 g004
In order to observe the impact of the storm event itself on the number of Sina-Weibo texts, we did a seasonal adjustment to separate seasonal factors from the time series. Figure 4d is seasonally adjusted time series, it shows that the trend of the number of Sina-Weibo texts related to the “Beijing rainstorm” presented regular cyclical fluctuations before and after the Beijing rainstorm. After heavy rain occurred, the number of Sina-Weibo texts showed great fluctuations. Large-magnitude fluctuations appeared from 21 July to 23 July. The fluctuation reacheed a peak at 22:00 on the 21 July (Point A in Figure 4d) and persisted for some time. By 24–25 July “Beijing Rainstorm” was still a hot topic in social media. However, on 26 July (Point B in Figure 4d), Sina-Weibo data showed an abnormal proliferation of data in a short time, which was different from the usual pattern. This was because the Beijing Meteorological Administration issued a storm warning on the 26 July, which caused renewed concerns for rainstorm. However, it turned out that it was just a light rain on the 26 July in Beijing, not a great rainstorm. Thus, this storm event slowly leveled off, and did not cause any persistent buzz on social networks.
Out analysis showed that the development trend of Beijing Rainstorm events and trends of the number of Sina-Weibo texts are highly correlated. We can apply seasonal decomposition of the number of Sina-Weibo texts to explore the overall trends or cyclic components. The identification of such components helps to reveal the developmental process of events, which could be used as a reference by the emergency manager. Especially when there is a sharp rise in the overall trend, which shows the events have become more serious, decision makers should take stronger measures to deal with them.

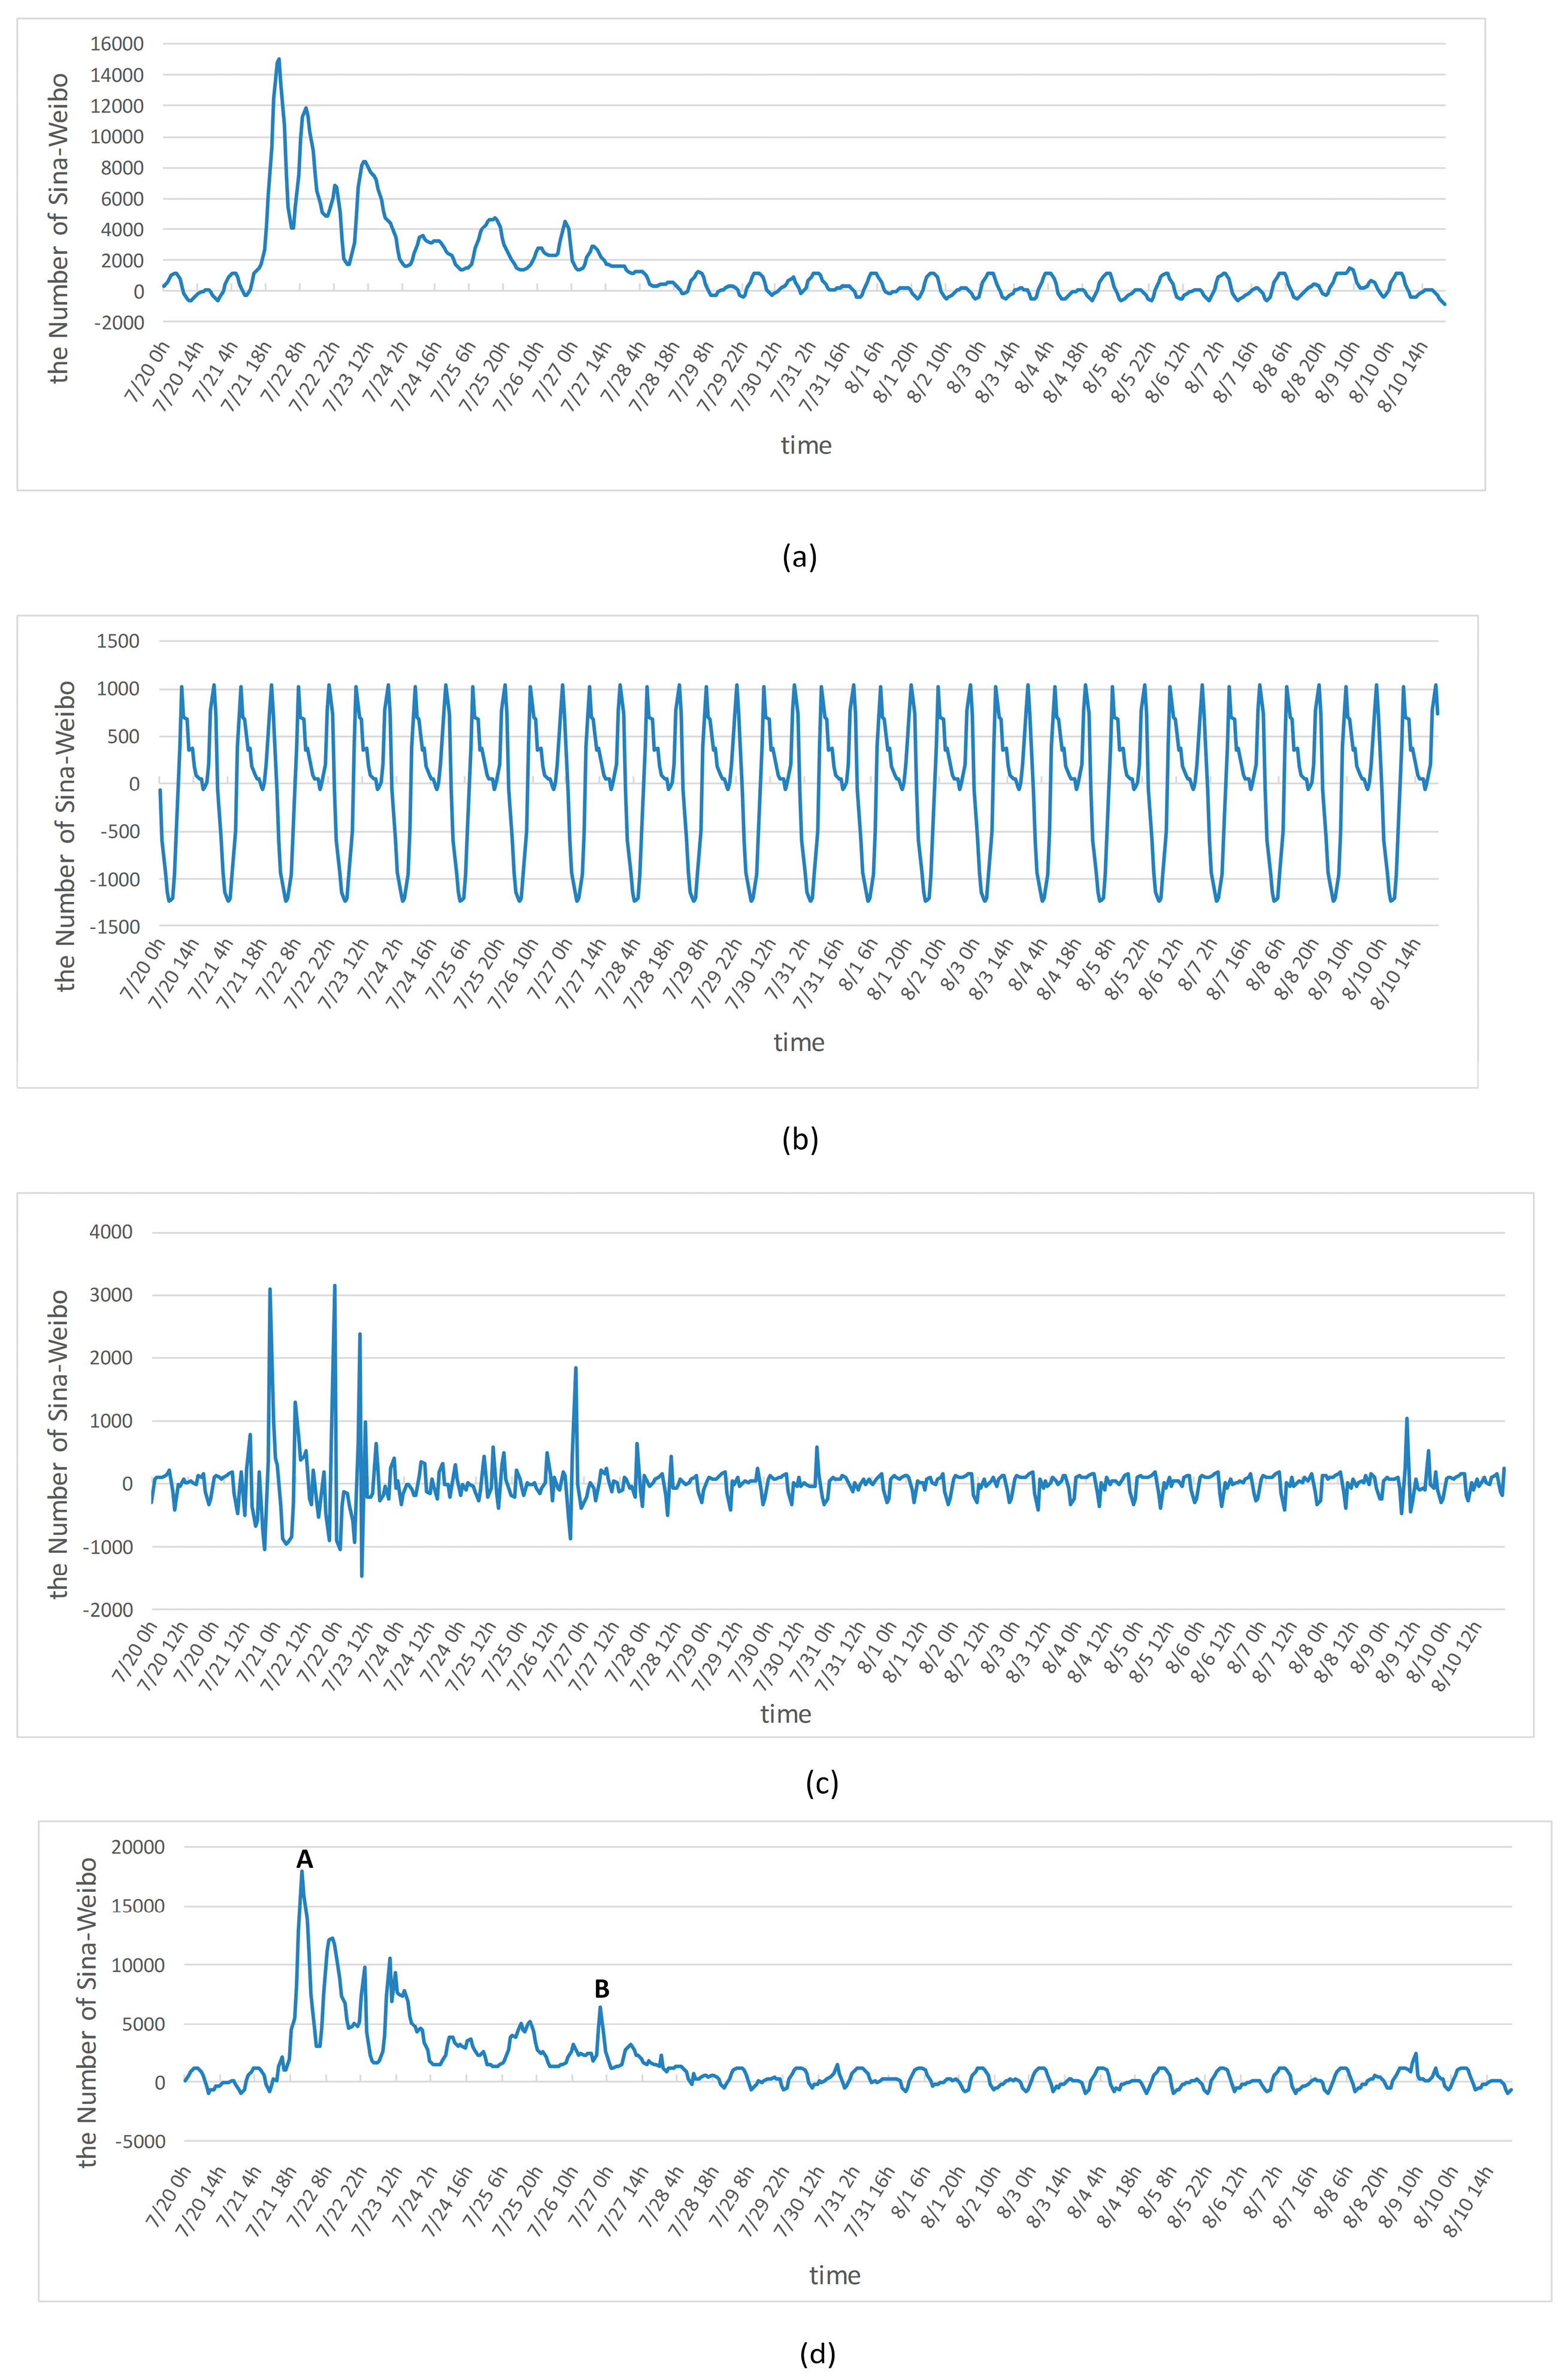
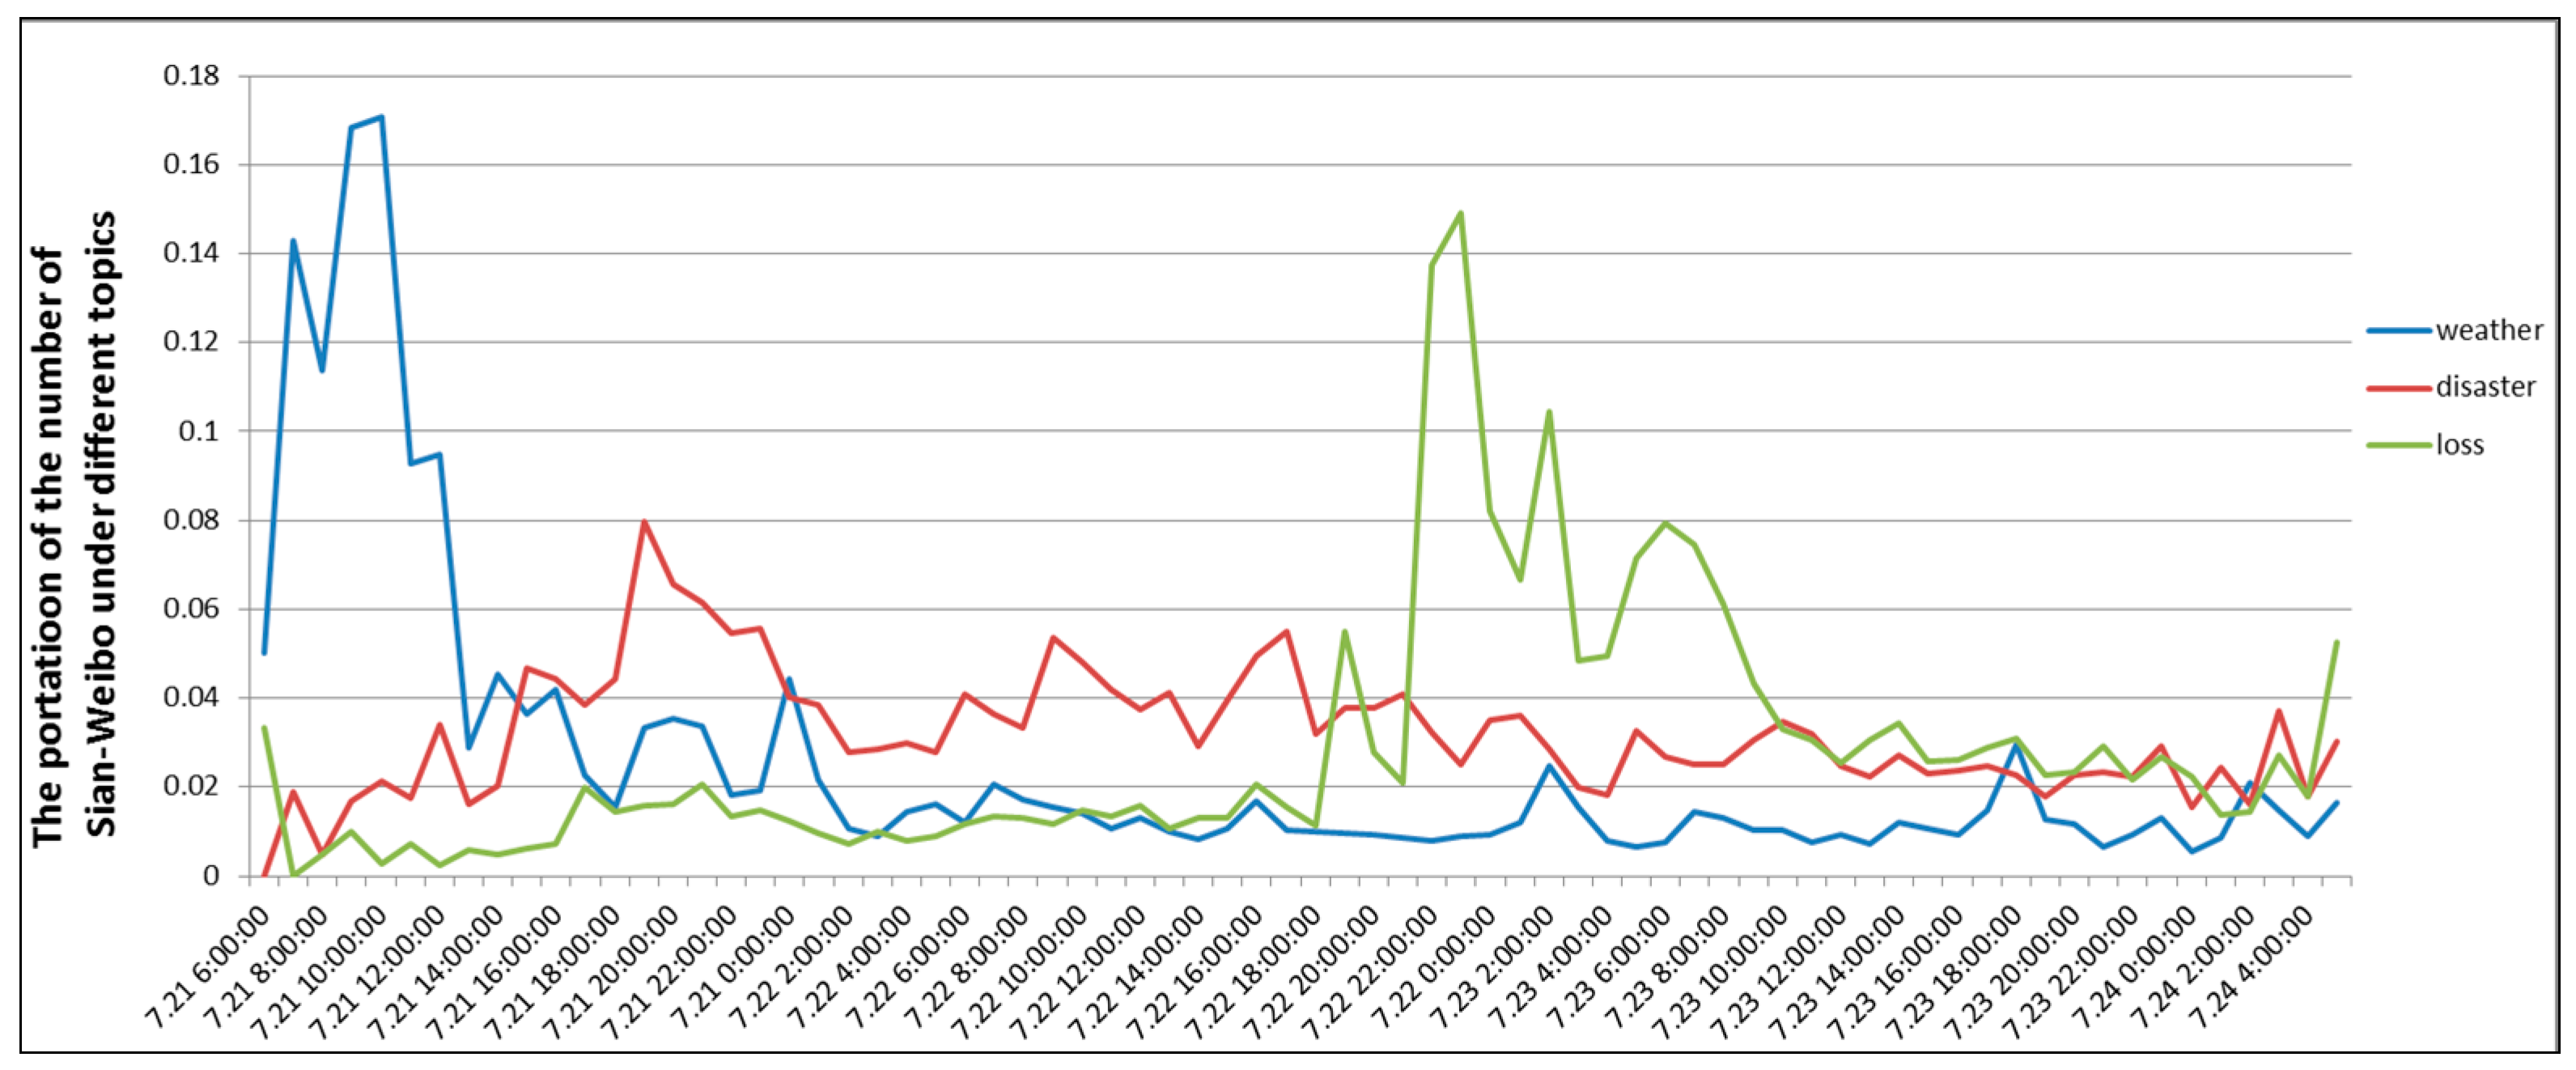
4.2.2. Trend of Topics under Discussion

People’s concerns for an emergency event will change with the development of the events. The topics being discussed on social media are often an expression of the concerns of the public. Therefore, exploring the distribution of the message topics being discussed can help to understand the development of an emergency and how the public perceive the event and react to the event.
In order to accurately display temporal changes in the number of social media text streams using different topics, we calculated the proportion of the number of Sina-Weibo texts by different topics within each hour to the total number of Sina-Weibo within the same hour. Among the topics of concern, we selected “weather”, “disaster information”, and “loss and influence”, as the most relevant topics to a natural disasters such as the Beijing rainstorm. Their trends are shown in Figure 5. As can be seen in Figure 5, the proportion of the Sina-Weibo under the “weather” topic reached a peak around 07:00 a.m. on 21 July, and it reached a new peak around 09:00 a.m. There were only a few Sina-Weibo texts on “disaster information” and “loss and influence”. Between the 14:00 p.m. on 21 July to the 18:00 p.m., the proportion of the Sina-Weibo texts about “disaster information” was much higher than the proportion of the Sina-Weibo for the other two topics. The proportion of the Sina-Weibo on “loss and influence” was small until 19:00 p.m. on 22 July; however it reached a peak at 23:00 p.m. on 22 July, and remained at a very high value continuing to 08:00 a.m. on 23 July.
Figure 5. The trend of Sina-Weibo under different topics over time.
Sustainability 08 00025 g005
Combined with the entire development process of the “Beijing rainstorm”, these three topics correspond, exactly, to the three stages: “before the rainstorm”, “rainstorm”, and “after the rainstorm”. Therefore, changes in the proportion of Sina-Weibo texts under different topics reflected the development process of emergency events. The trends extracted from Sina-Weibo text streams, given their close correspondence with how the events proceeded, can be used to help to predict the development of events. Additionally, it could help decision-makers make rational decisions, so that limited resources can play a greater role.

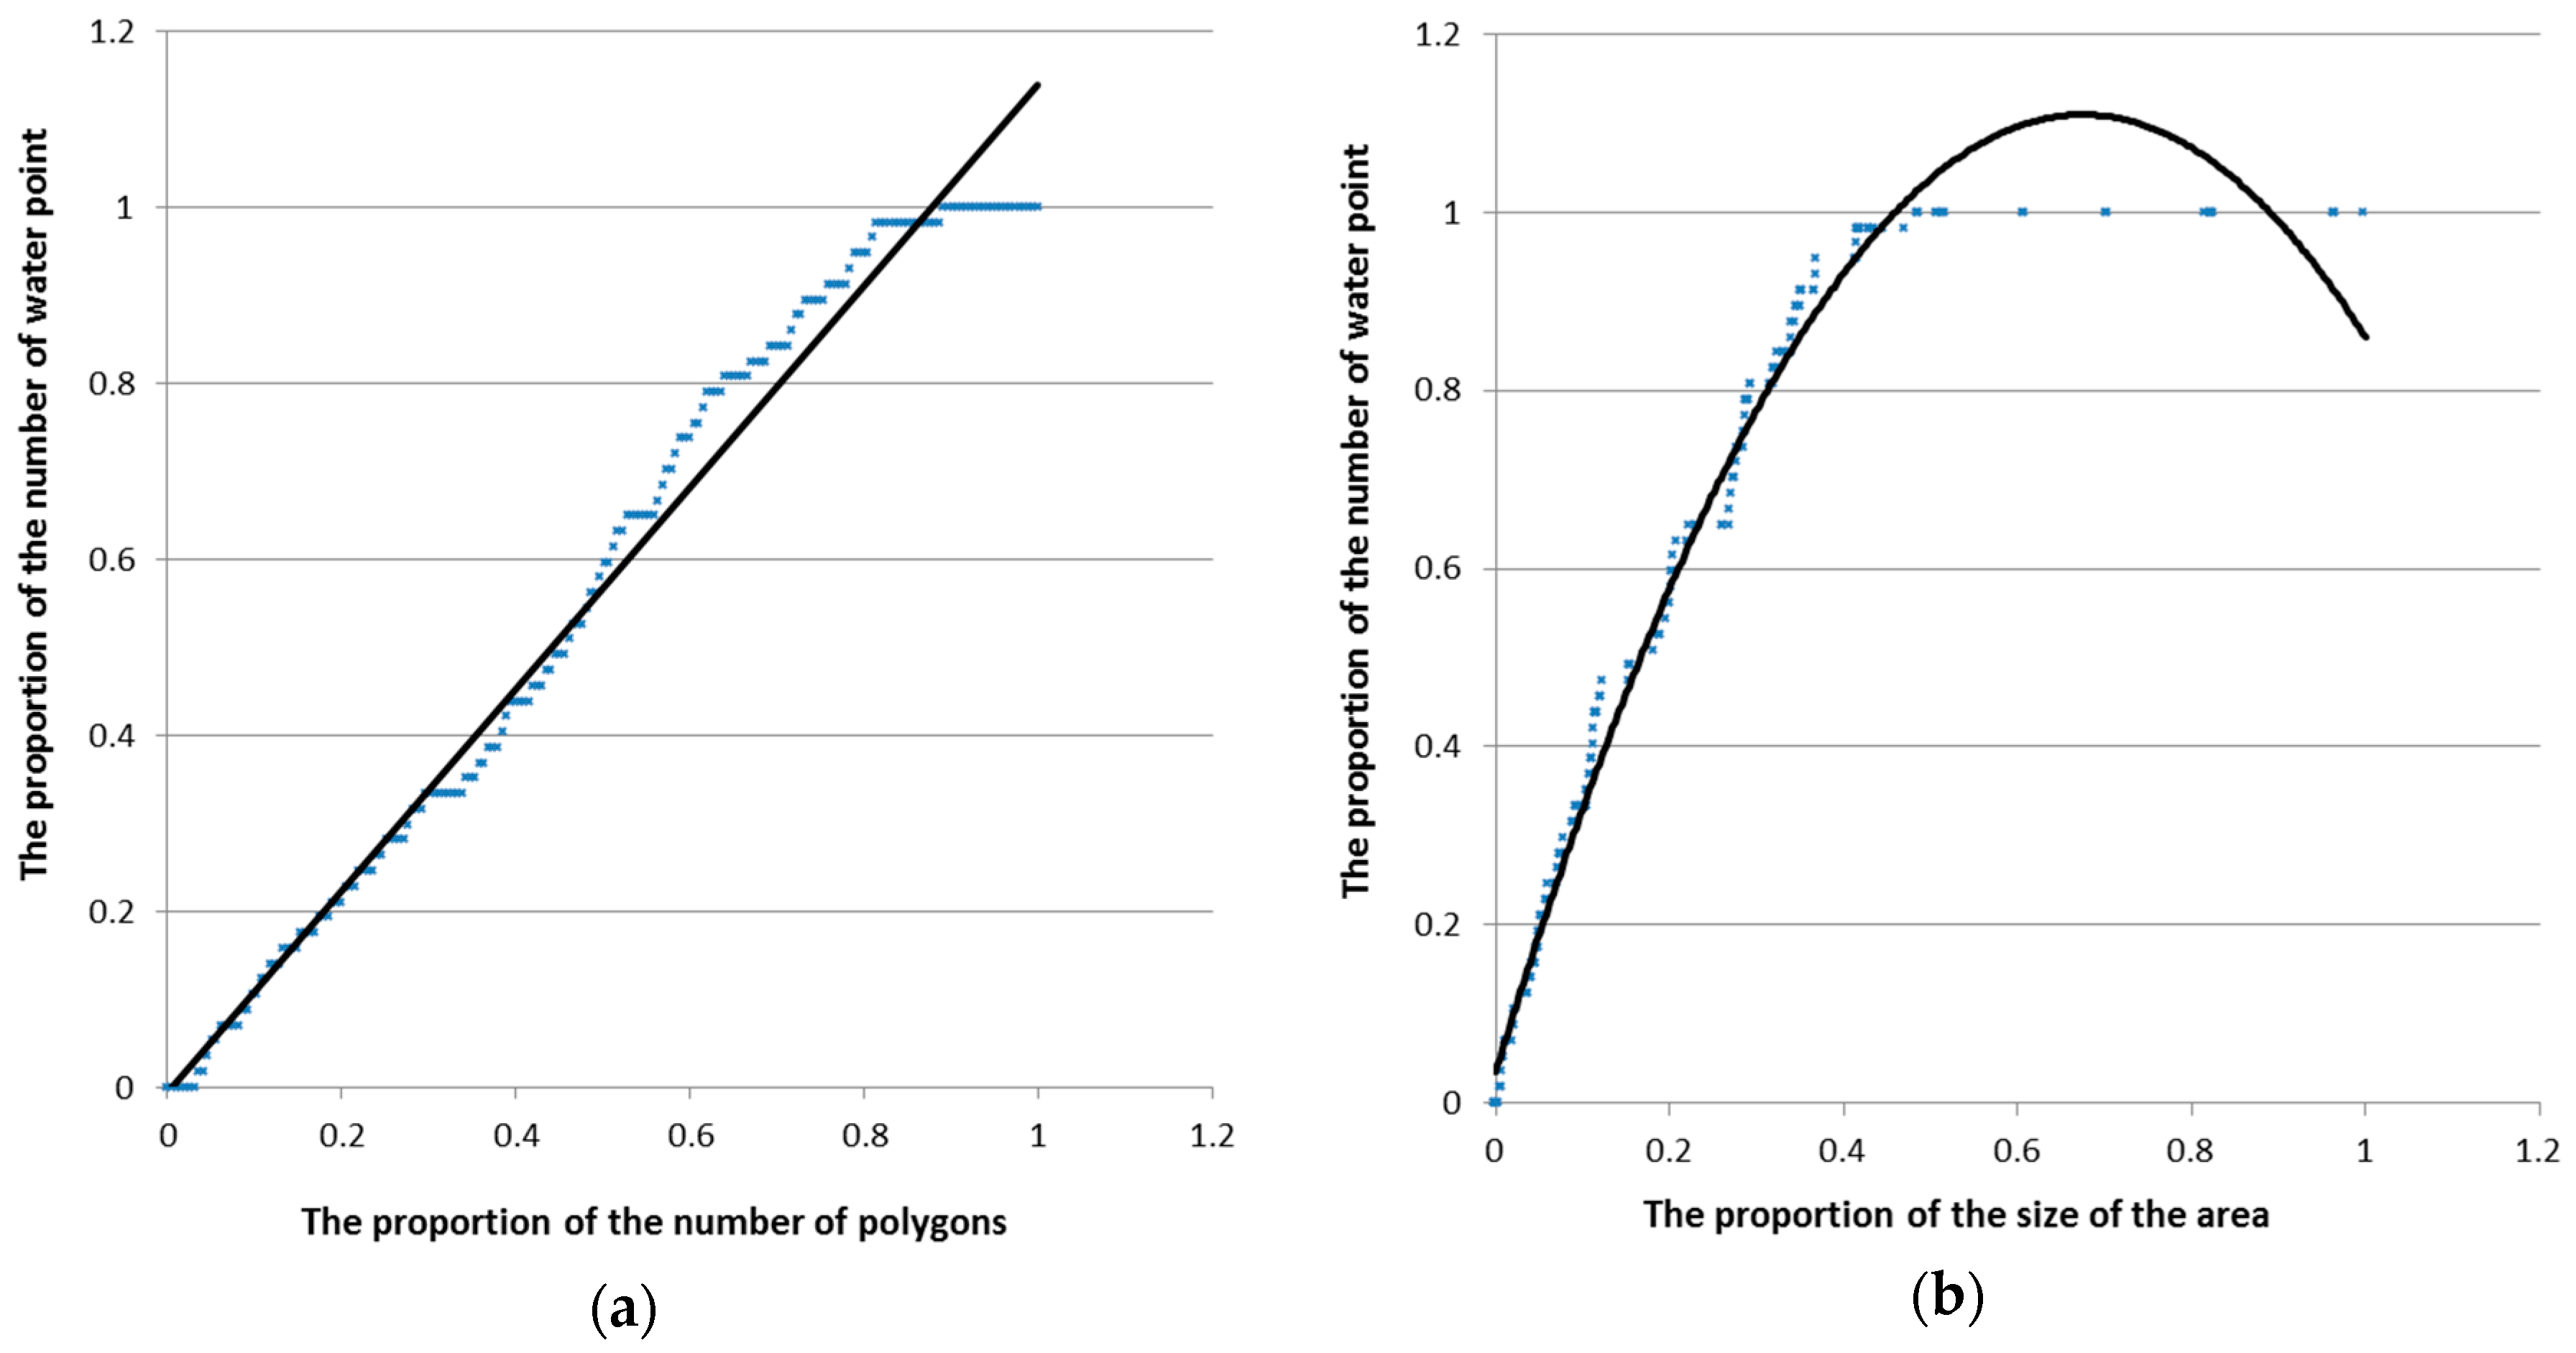
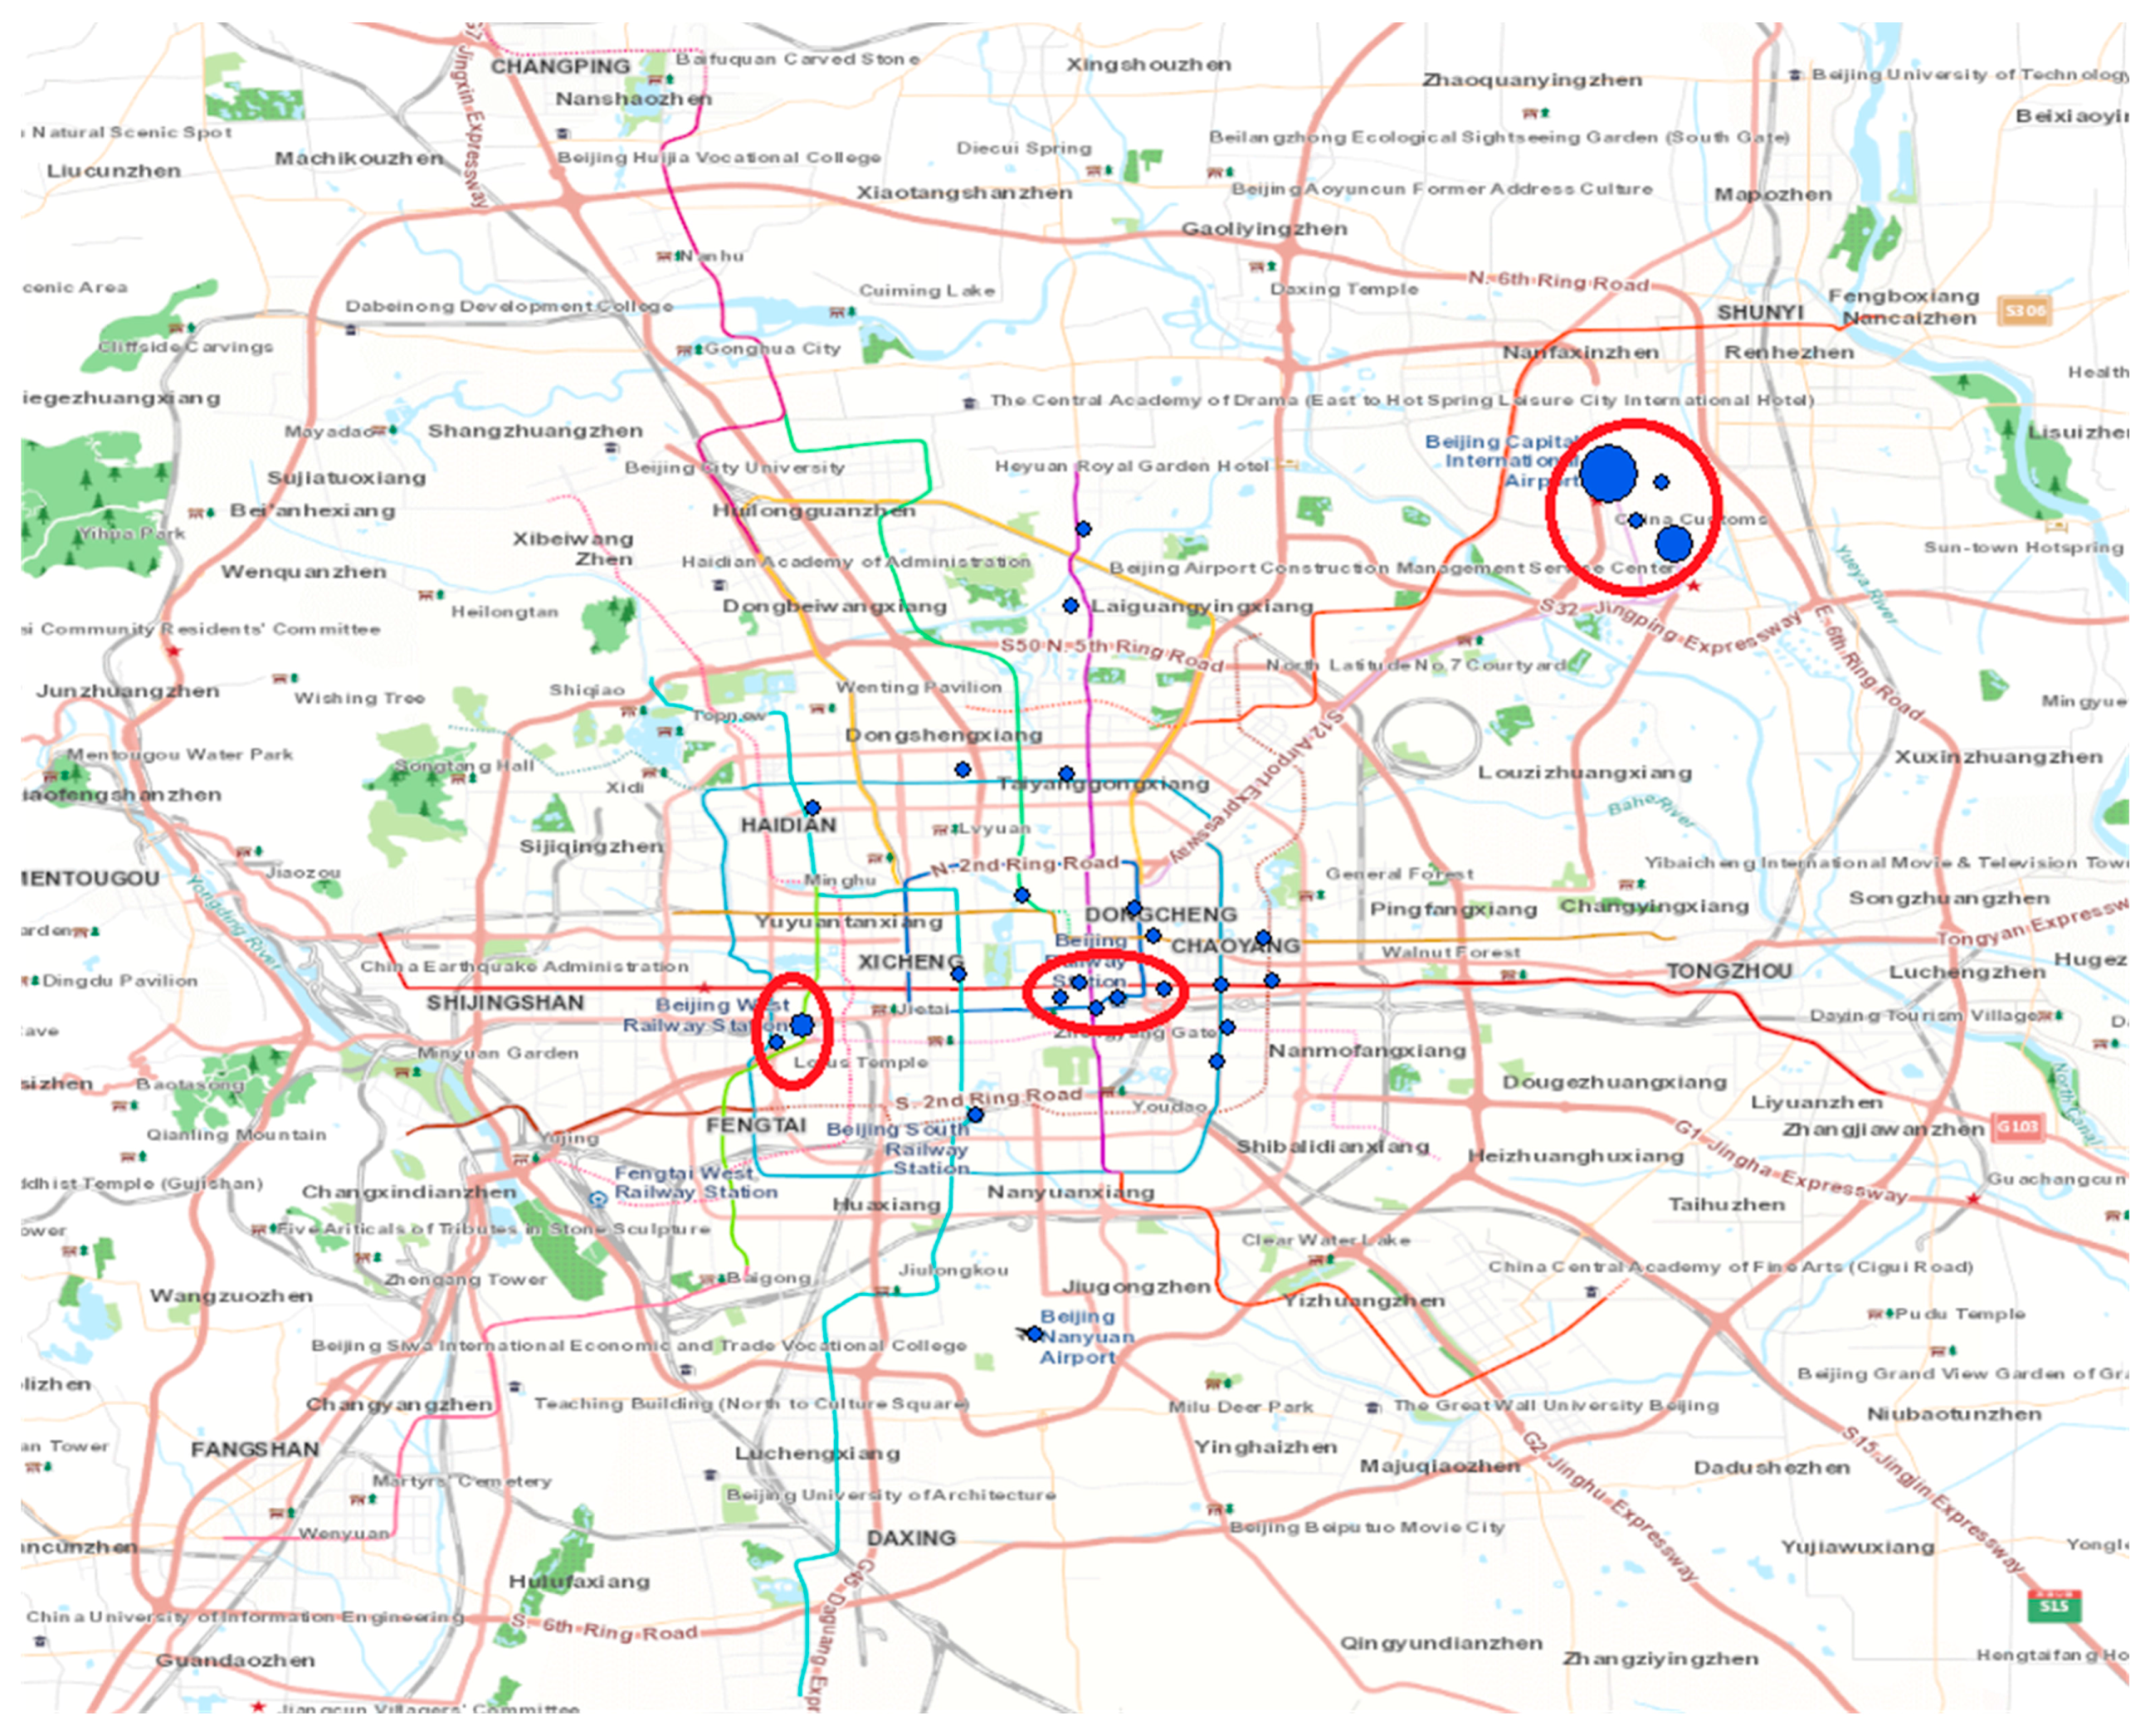
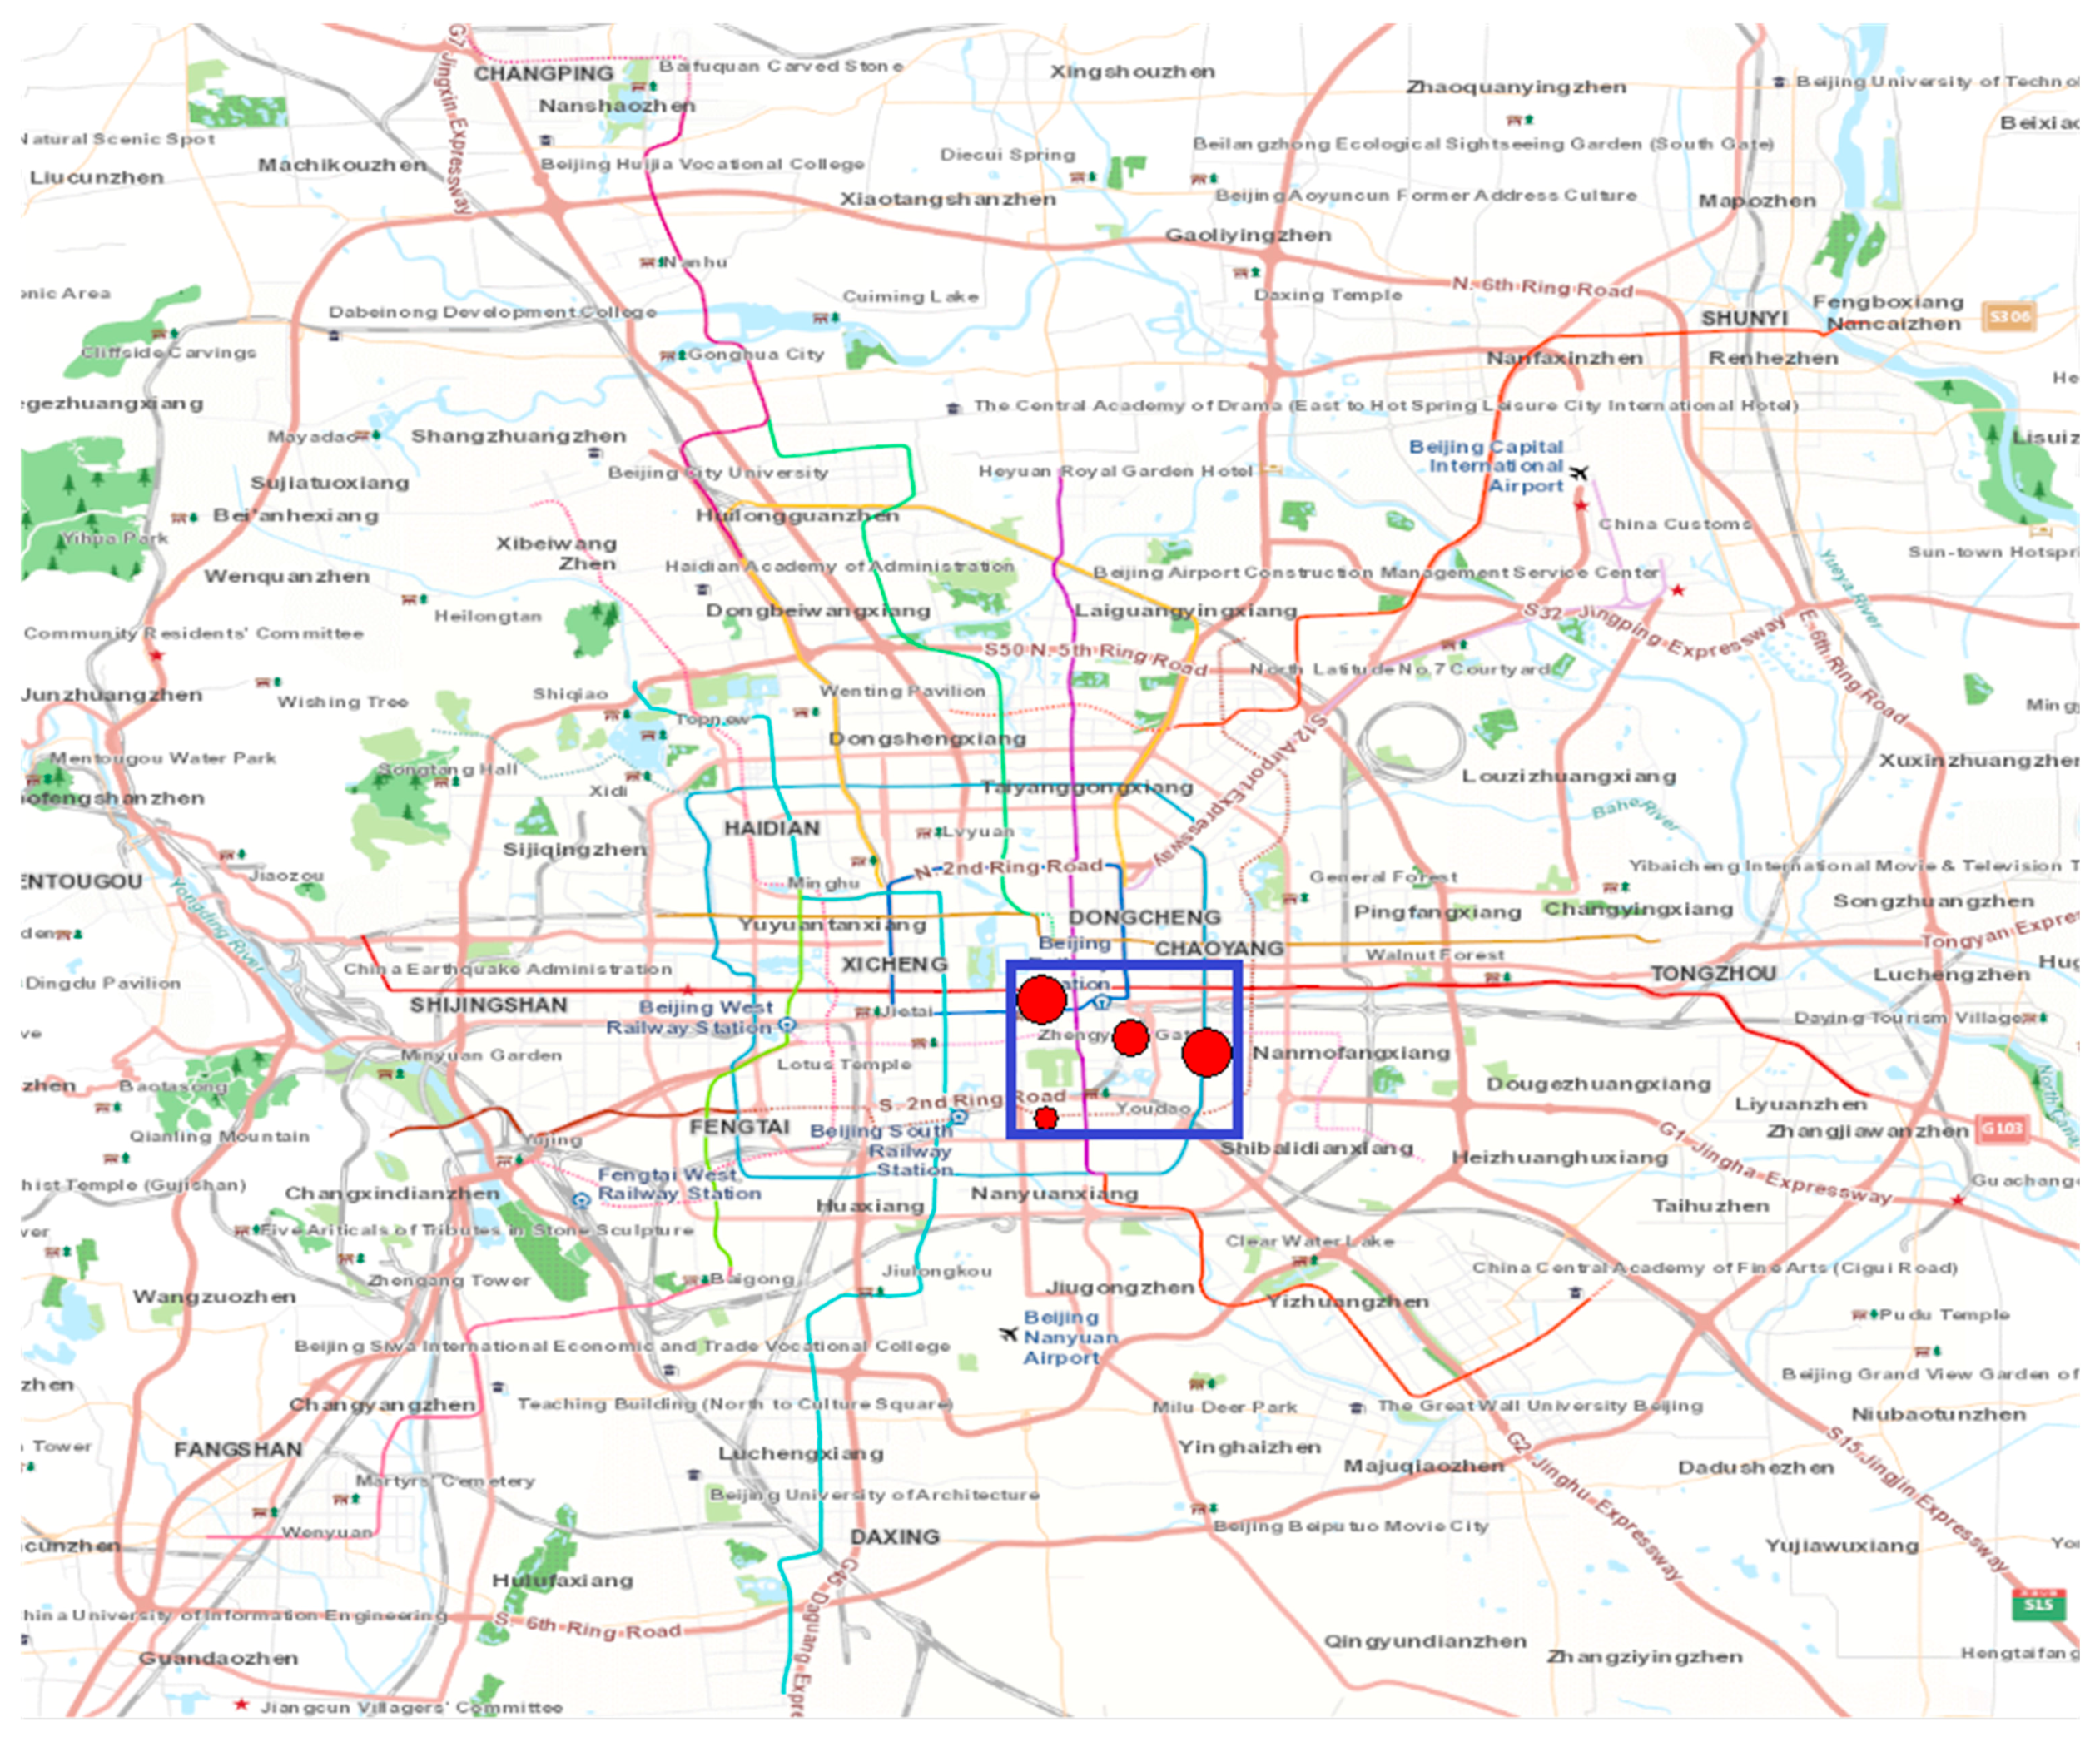
4.3. Spatial Analysis

Sina-Weibo not only has a certain temporal regularity, but also has clear spatial distribution patterns. The spatial analysis of social media streams can help us understand the spatial distribution of emergency events. This would be condusive for the decision makers if responses to emergency events can be made in a timely fashion and with a full awareness of public concern.
Each Sina-Weibo text stream with location information can be regarded as a geographical entity. Clusters of Sina-Weibo texts regarding the emergency events in space can be revealed by using spatial statistical analysis.

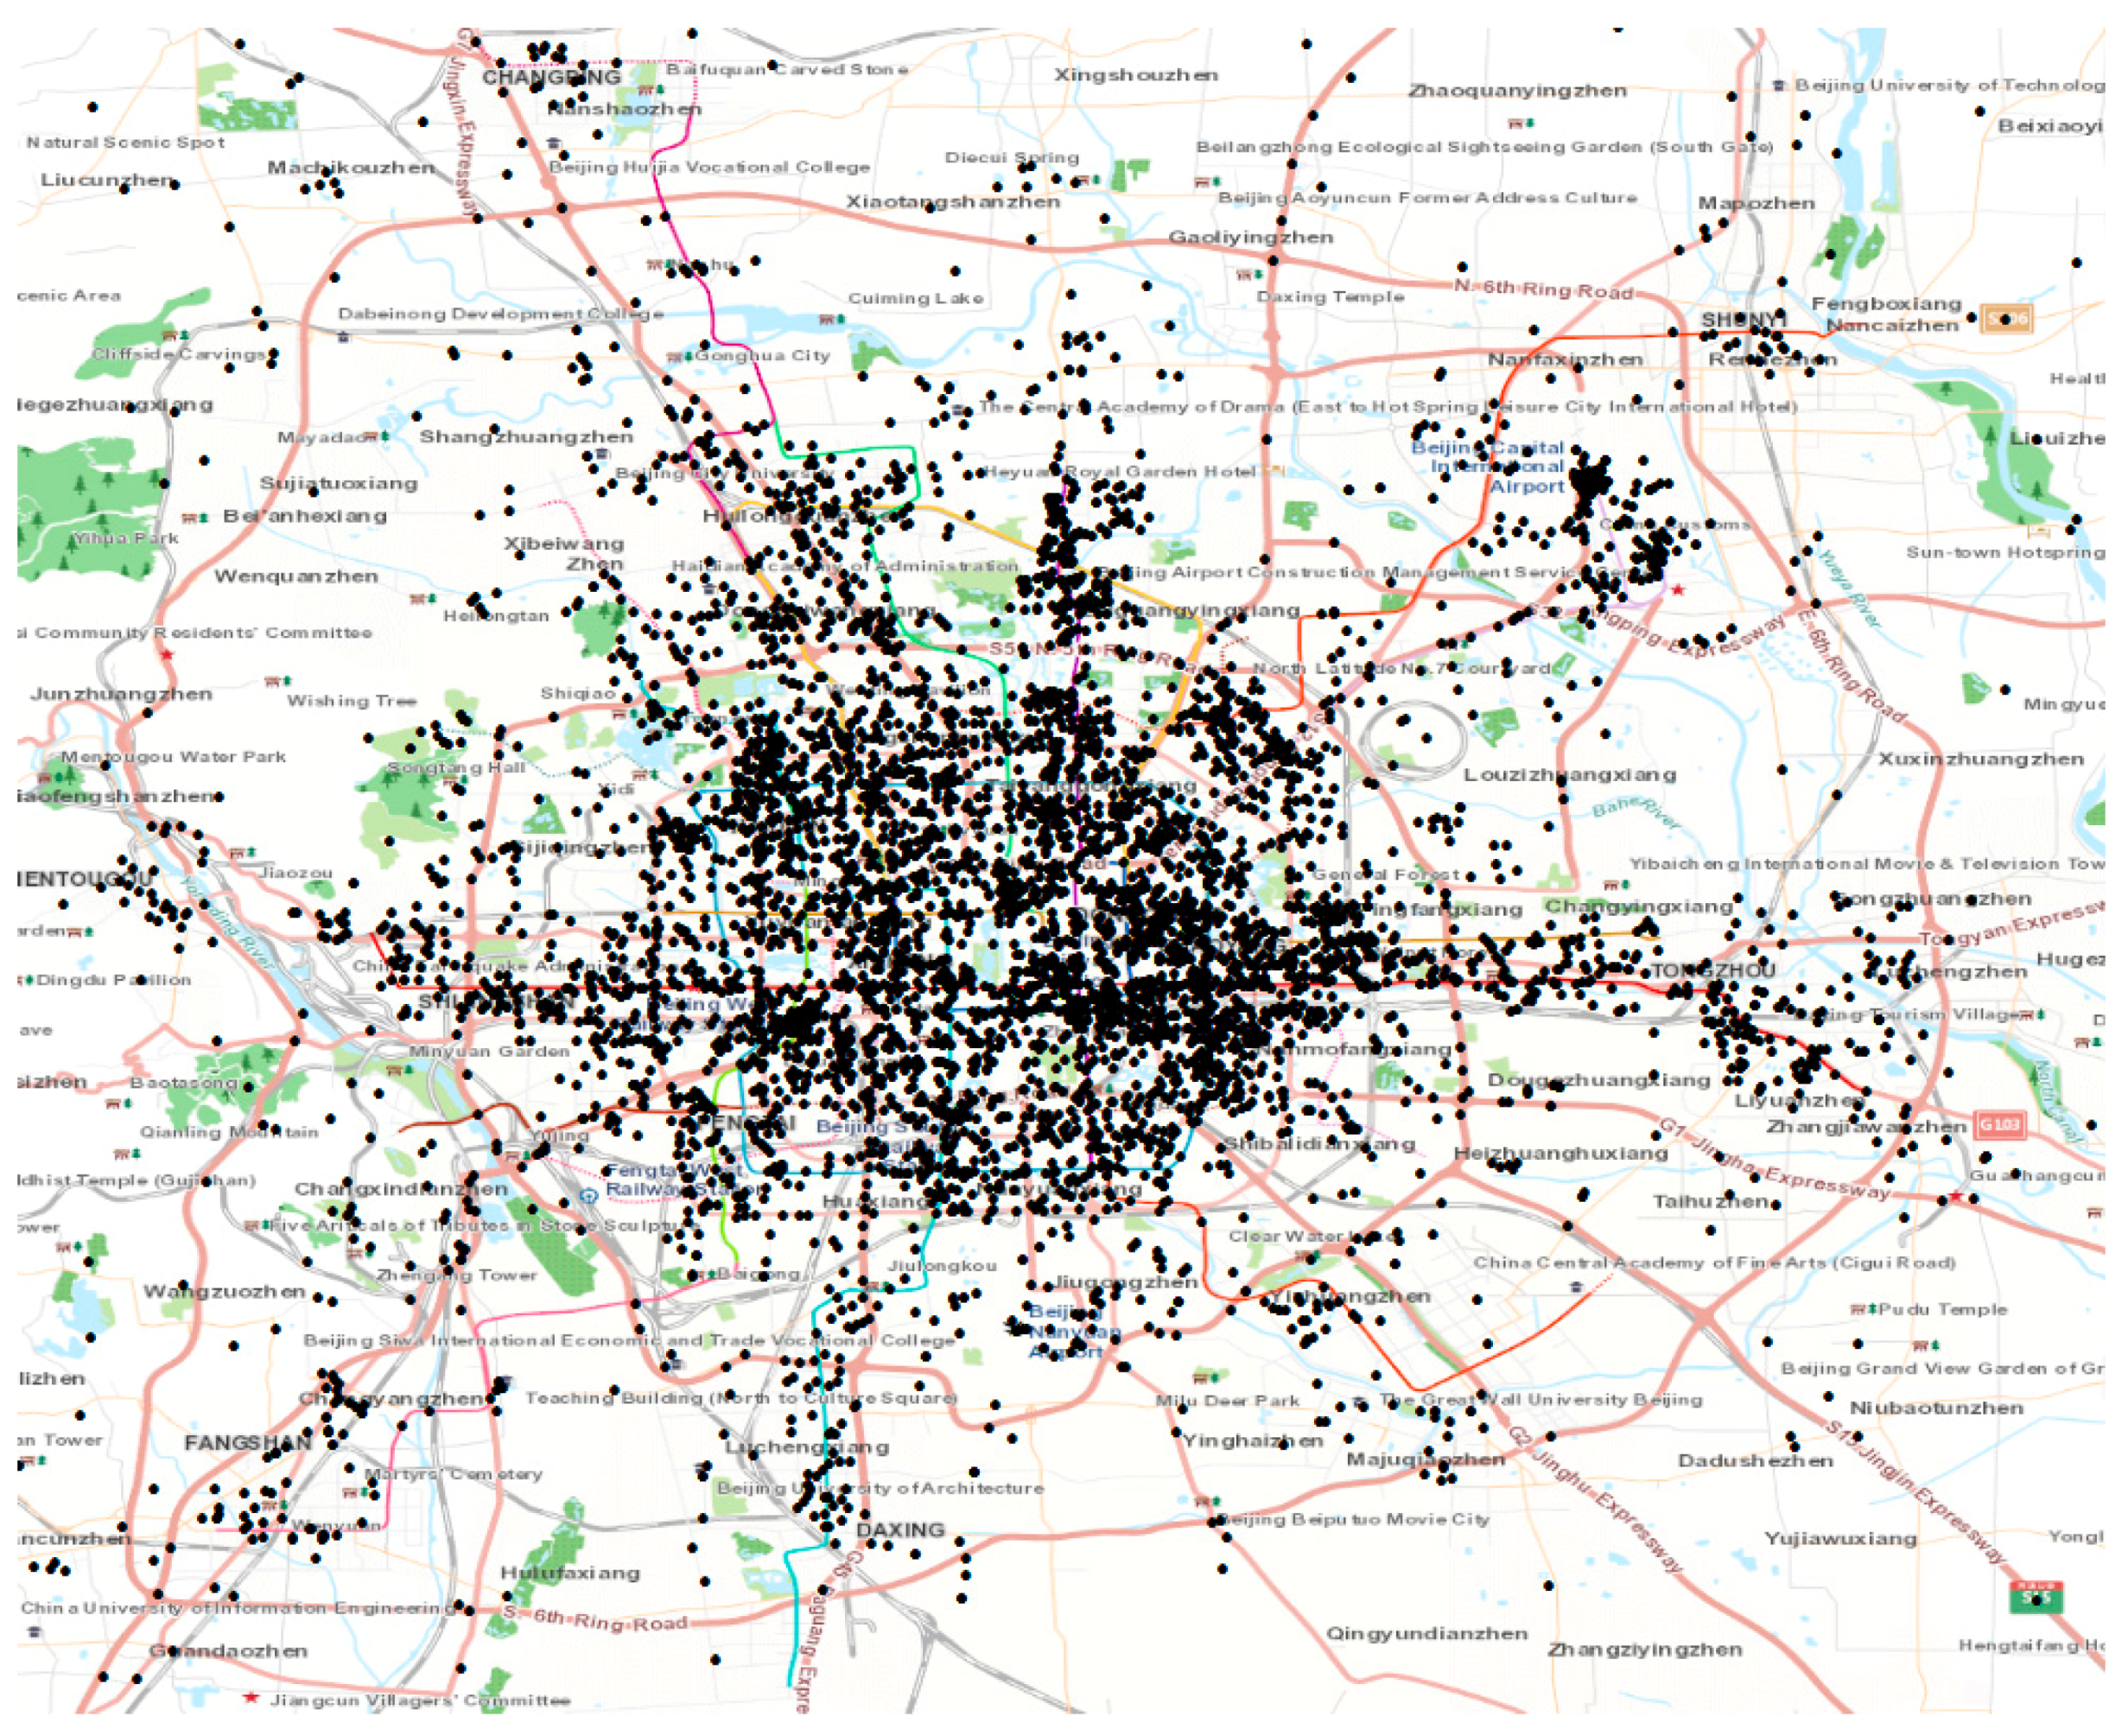
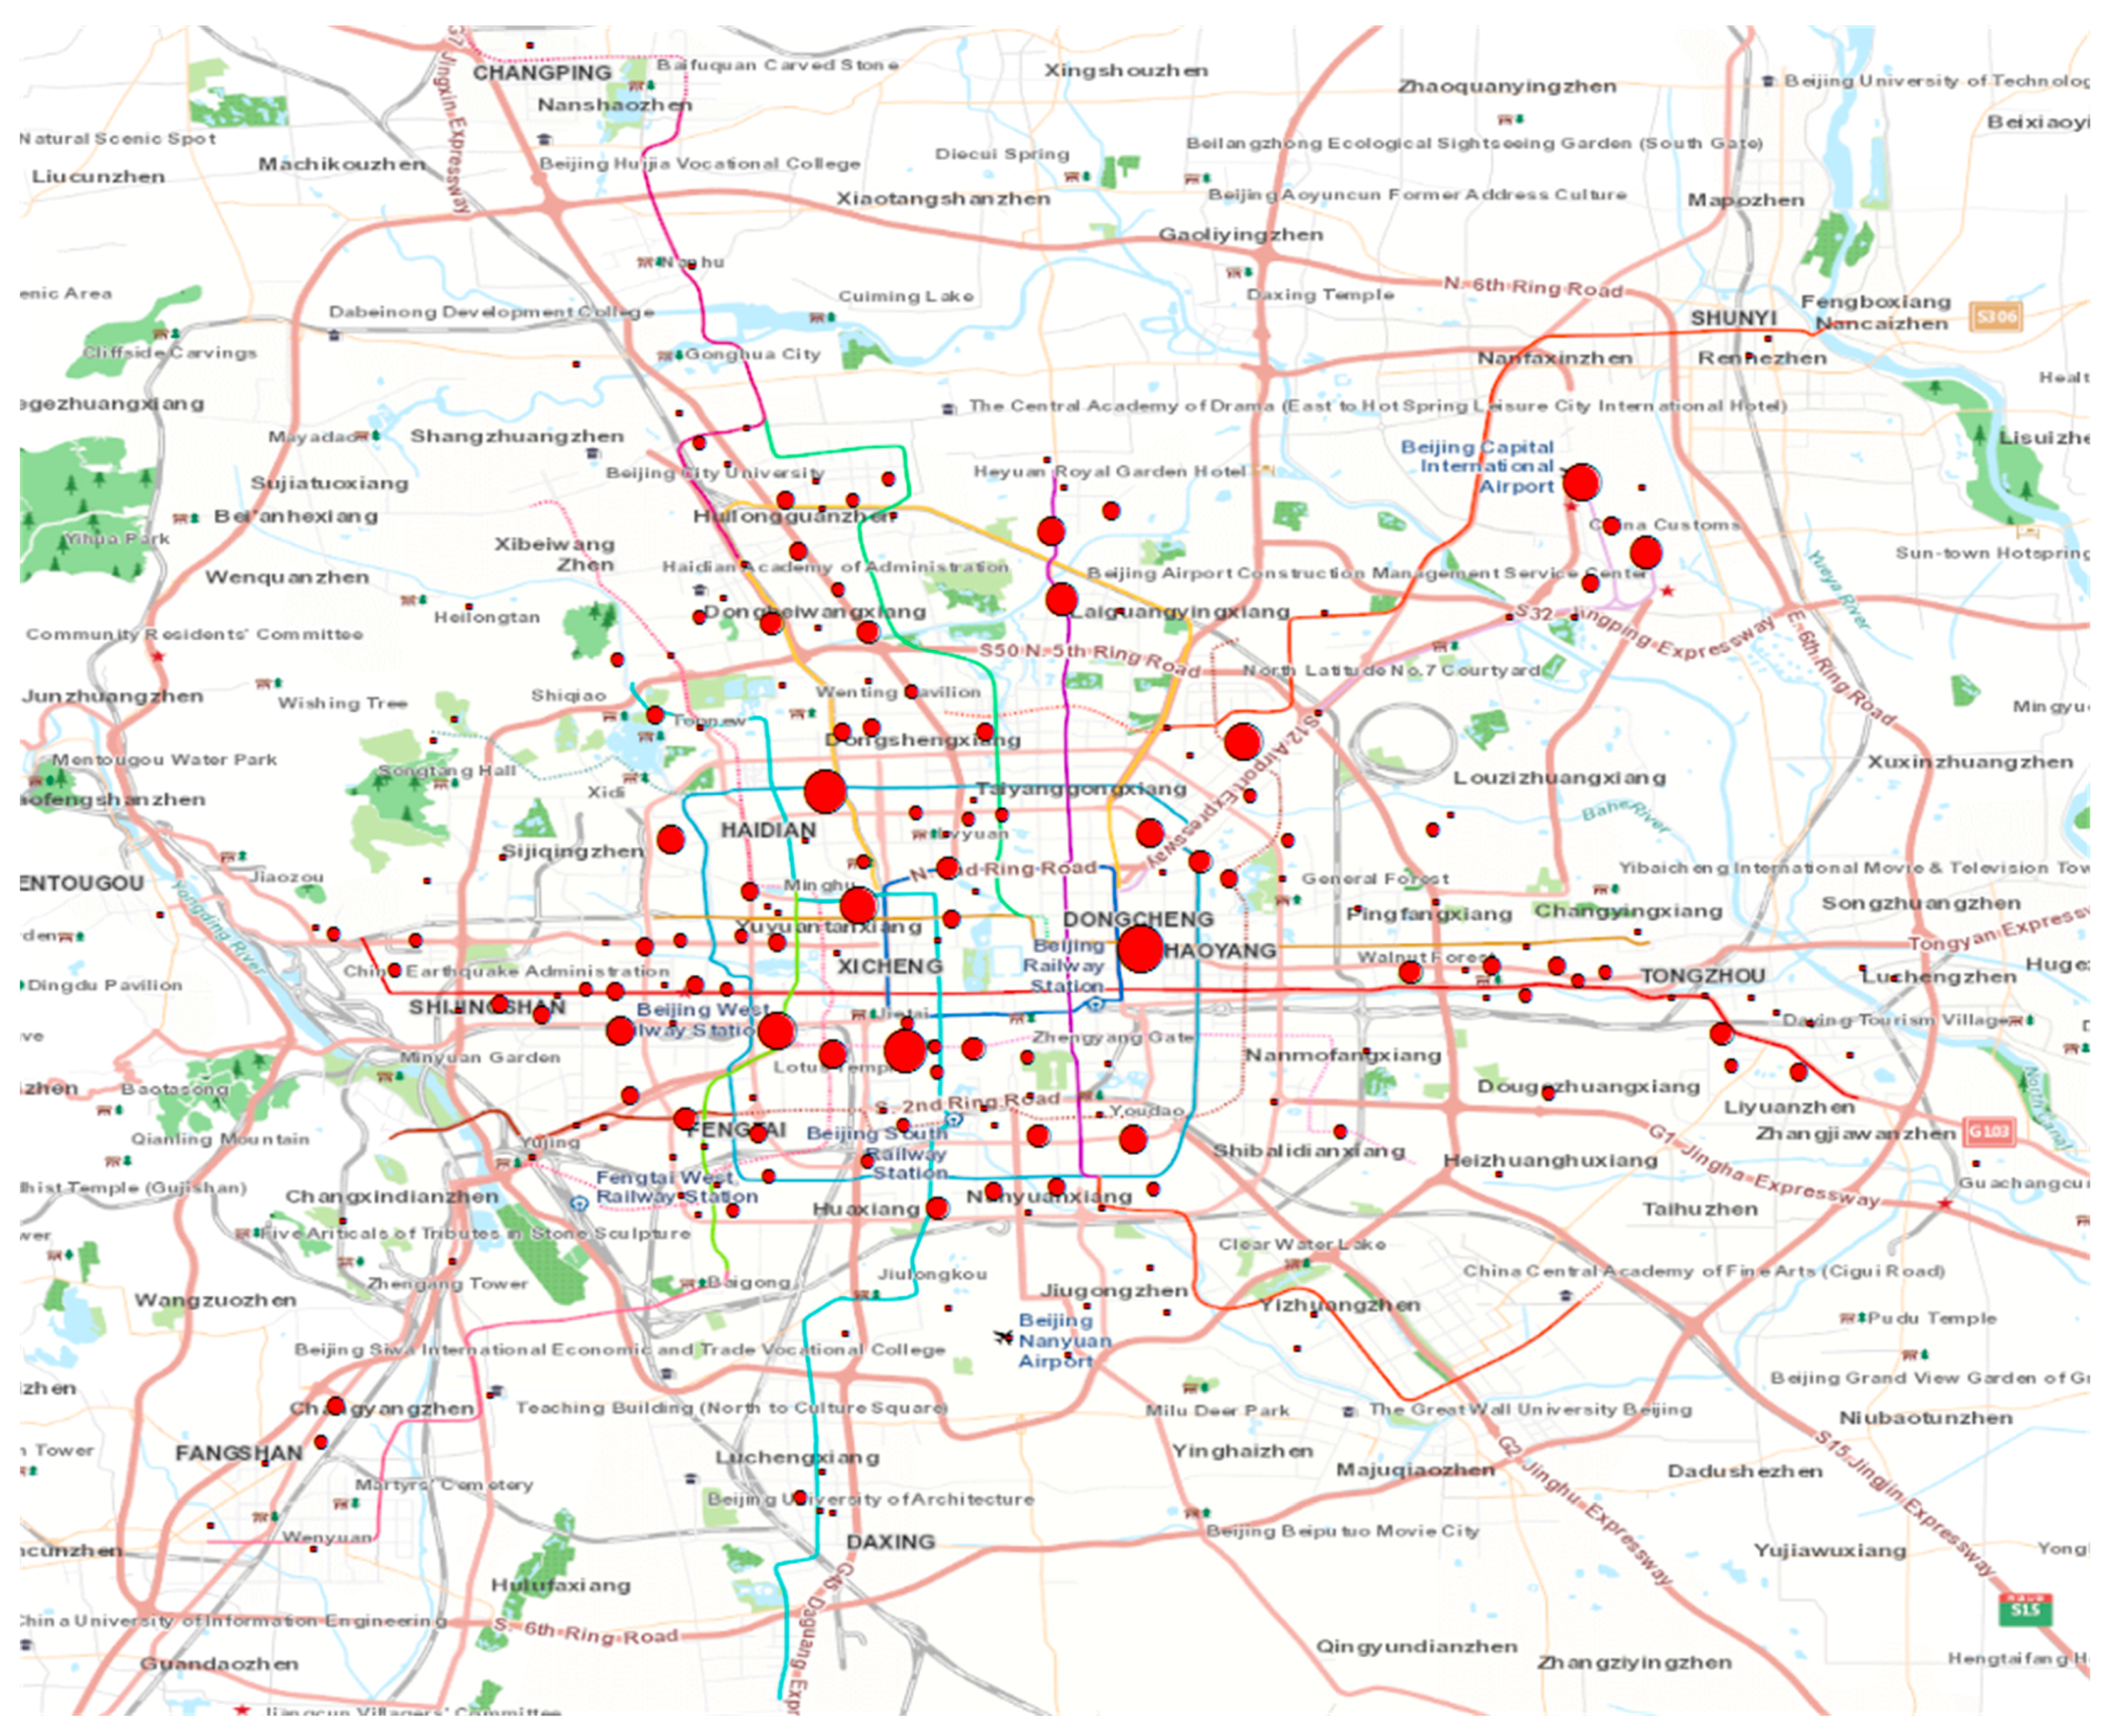
4.3.1. Explore of Rainstorm-Related Sina-Weibo

Beijing rainstorm occurred in 21 July, lasted until 22 July, and the Sina-Weibo published in this two-days were more relevant to the real situation of heavy rain spatially. We chose only the Sina-Weibo with GPS and related to Beijing rainstorm that were published between 21 July and 22 July as the research data. This final query retrieved 6382 messages for the entire territory of Beijing. A map in Figure 6 shows the spatial distribution of these Sina-Weibo texts represented by purple dots. Concentrations of Sina-Weibo texts can indeed be observed within the areas of Beijing five rings of express ways.
Figure 6. The spatial distribution of the original Sina-Weibo.
Sustainability 08 00025 g006
To further explore the spatial distribution of the Sina-Weibo texts with GPS on 21 July and 22 July, we applied density-based clustering [40] to the Sina-Weibo texts. We chose 400 m as the spatial distance threshold, and 4 as the minimum neighborhood size threshold. We obtained 195 clusters, including 4924 points (77.15% of total), and 1458 points (22.85%) that were classified as noise. The spatial distribution of the clusters is shown in Figure 7, the center of the circle in the figure is the center of the clusters. The size of the circle represents the number of the point in the corresponding clusters. The sizes of the circular symbols reflect the number of points in each circle.
Figure 8 shows the spatial distribution of the water zones, which were produced by Sogou Map (http://map.sogou.com/spatial/jishui/?IPLOC=CN1100) according to the actual situation of the Beijing rainstorm. Each point in the figure represents the water zones that appeared during the rainstorm.
Figure 7. The spatial distribution of the clusters.
Sustainability 08 00025 g007
Figure 8. The spatial distribution of the water zones provided by Sogou Map.
Sustainability 08 00025 g008
However, each water zone that appeared during the rainstorm affected the travel of the people in the region around the zone. To explore the relationship between the water zone and the region around the zone, Voronoi tessellation [41] was applied over the location of the clusters in order to compute the land segments that each cluster represents (Figure 9a). Next, the number of the Sina-Weibo texts in each Thiessen polygon was counted. In addition, the number of the all the Sina-Weibo texts with GPS information published in Beijing within a month, in each Thiessen polygon was also counted to normalize the statistical results. Specifically, the Sina-Weibo texts with GPS information published in Beijing within May 2014 were chosen for this analysis. These Sina-Weibo texts contained a total of 1,553,724 messages. In this manner, the normalized values were regarded as an attribute of corresponding polygon. The result is shown in Figure 9b. We obtained 195 polygons with different attribute values that were represented by different shades of red. Polygons shaded with darker red represent regions where the reactions in the Sina-Weibo texts in regions caused by the rainstorm were more intense. It might suggest that these regions have been greatly affected by the rainstorm.
Figure 9. The spatial analysis about Sina-Weibo and water zones. (a) voronoi tessellation; (b) calculate the attribute values of polygons; (c) the relationship between polygon and the water zones.
Sustainability 08 00025 g009
In order to further explore the relationship between the attribute values of polygons and the water zones, the polygons were sorted by attribute values. Then, the area of the top polygons and the number of water zones within these polygons were calculated. For example, we calculated the area of the top polygon and the number of water zones within the polygon. The area of the top two polygons, and the number of water zones within the two polygons were then calculated. This process was repeated until the area of all the polygons and the number of water zones within all the polygons were calculated. This process generated two sets of data regarding polygons and water zones. One is the number of polygons and the number of water zones in these polygons (Figure 10a), and the other is the area of polygons and the number of water zones in these polygons (Figure 10b).
From Figure 10a, we can see that the number of polygons and the number of water zones in these polygons formed a linear distribution. From Figure 10b, we can see that the polygons, which were 20% of the total area, contained nearly half of the water zones. This demonstrates that this evaluation mechanism can help us use the Sina-Weibo texts with GPS information to find those regions that were widely affected by the rainstorm.
Figure 10. The relationship between the attribute values of polygons and the water zones. (a) the number of polygons and the number of water zones; (b) the area of polygons and the number of water zones.
Sustainability 08 00025 g010

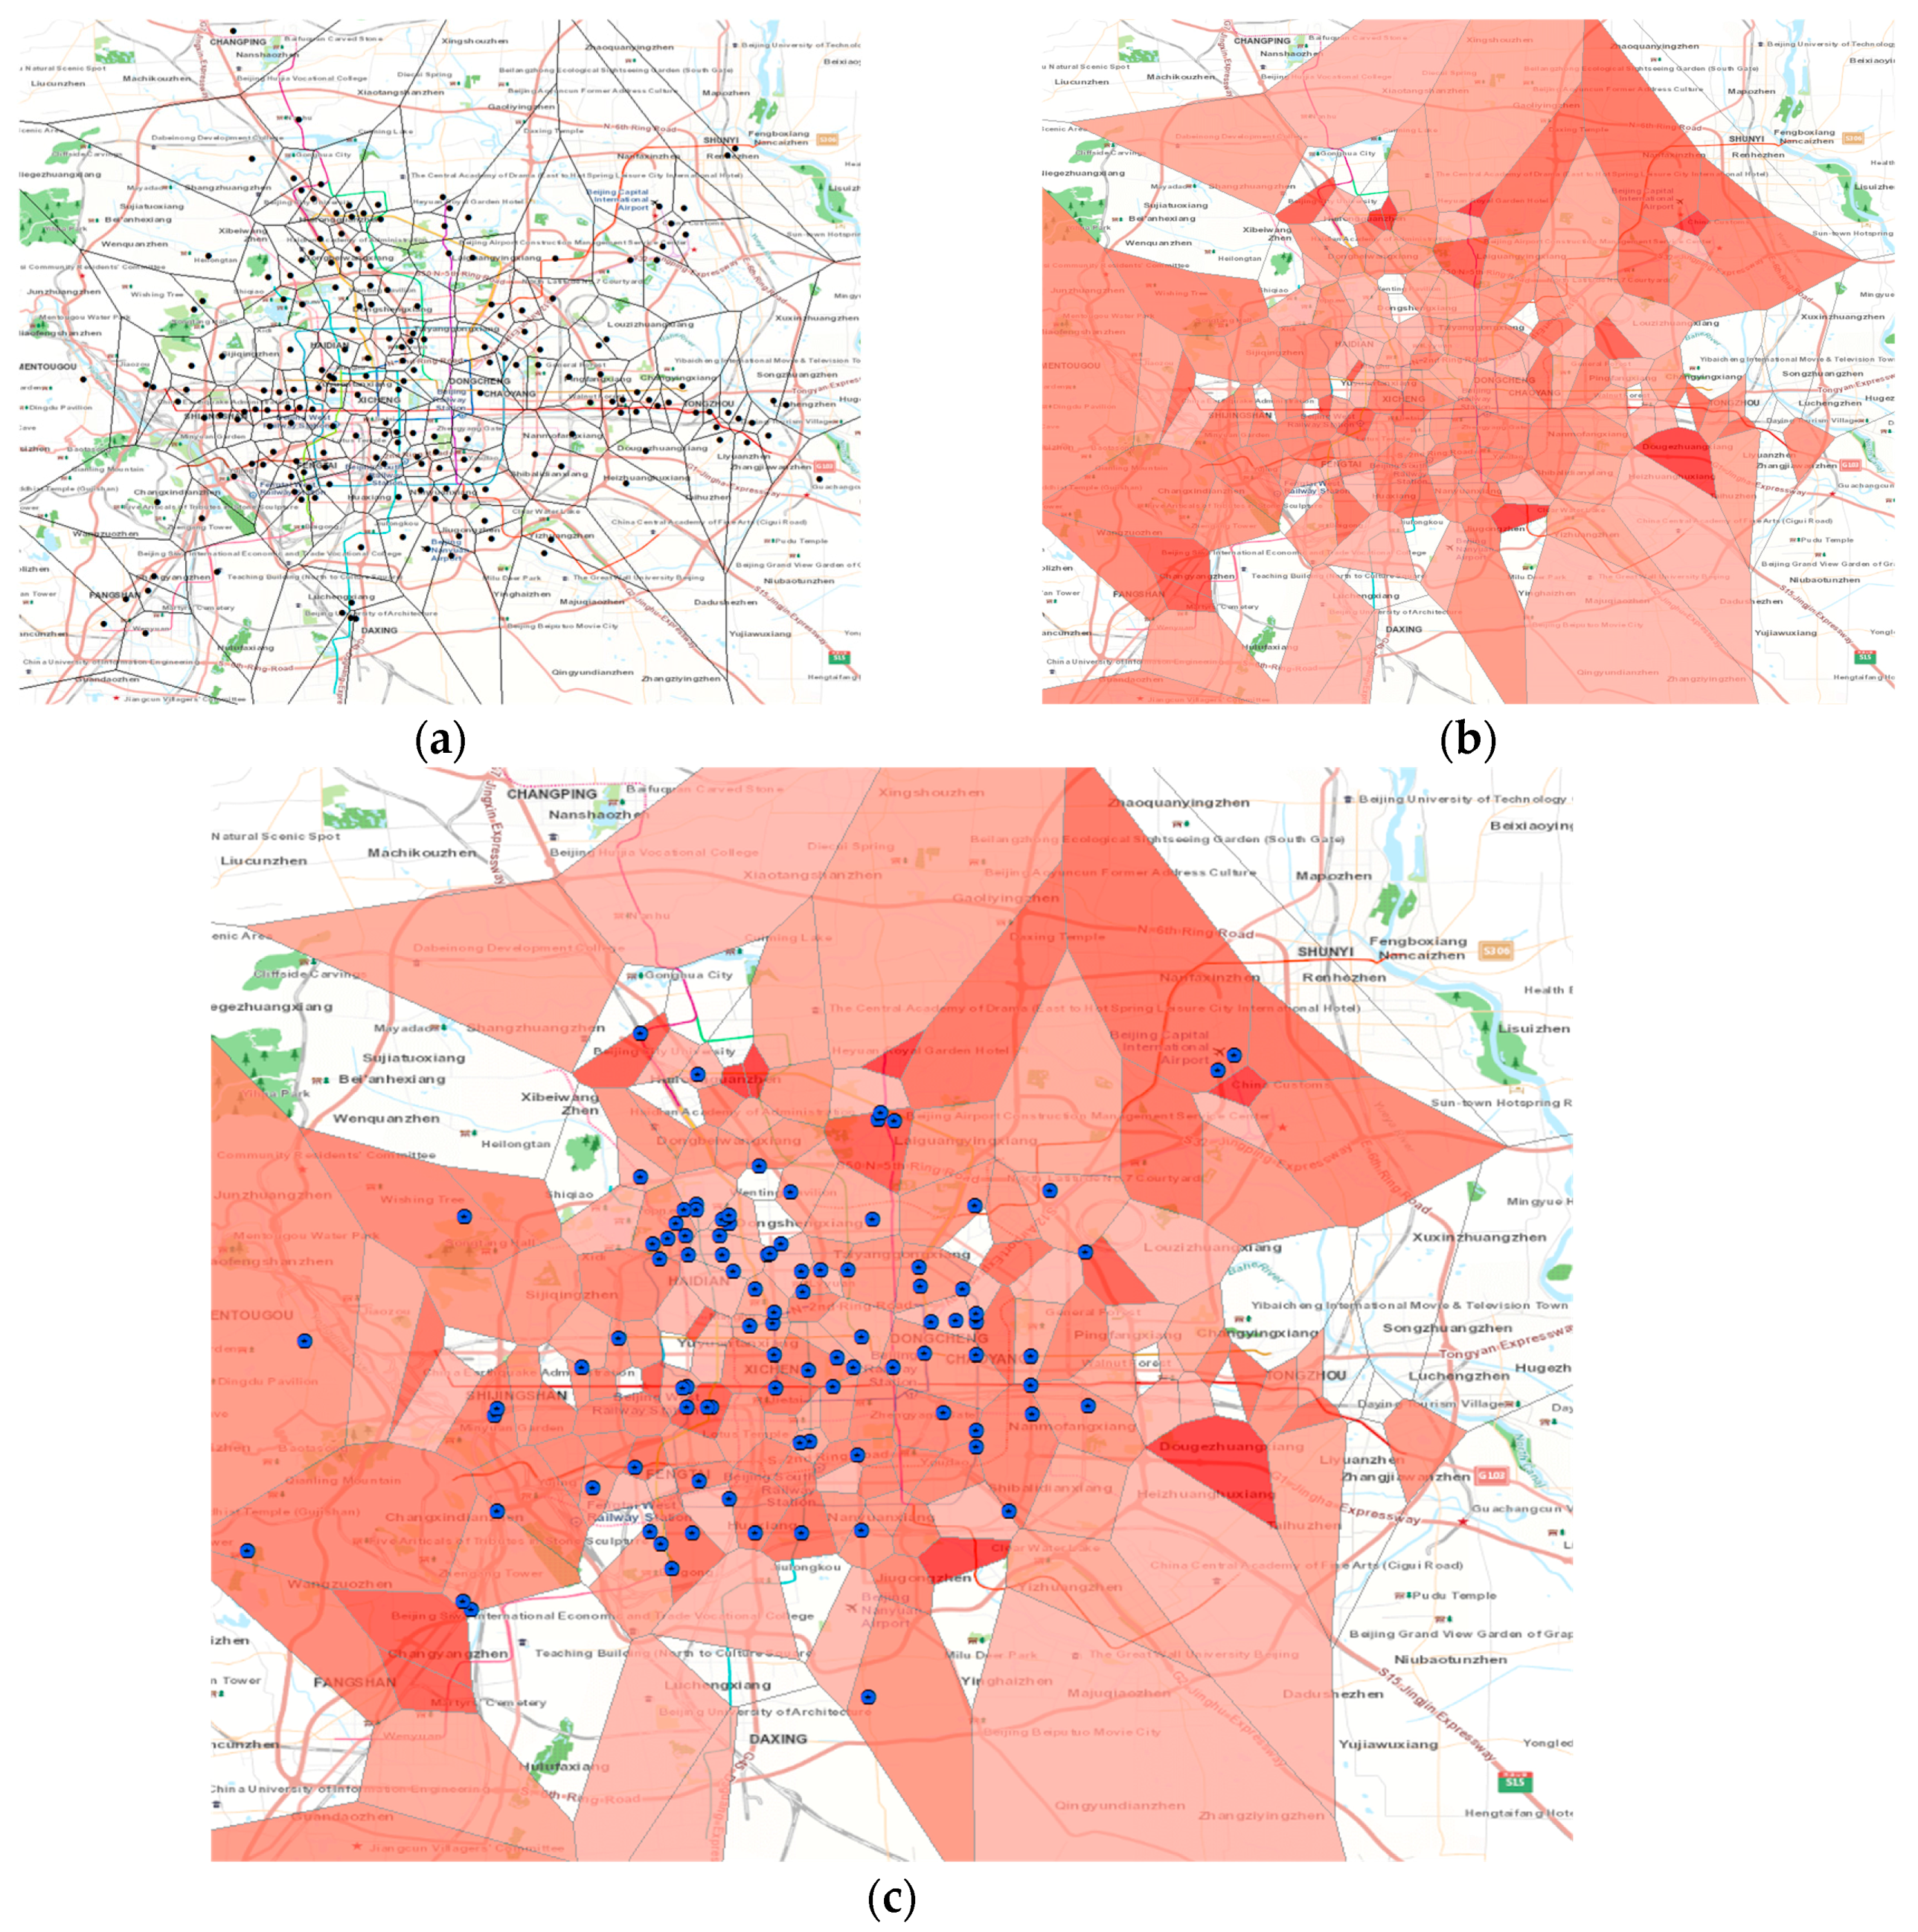
4.3.2. Distribution of the Sina-Weibo under Different Topics in Space

In the second part of the spatial analysis, Sina-Weibo texts were analyzed by different topics. As an example, we extracted Sina-Weibo texts with GPS information for the “traffic” topic and the “disaster information” topic. The Sina-Weibo texts with GPS information for the “traffic” topic contains 1056 messages, and the Sina-Weibo with GPS information for the “disaster information” topic contains 470 messages. The same density-based method as in the previous section was applied to the Sina-Weibo for different topics. We chose the same parameters, 400 m, as the spatial distance threshold and 4 as minimum neighbourhood size threshold.
For “traffic” topic, we obtained 27 clusters. As shown in the Figure 11, the sizes of the circles represent the numbers of the point in the corresponding clusters. From the figure, we can find that the largest cluster appeared in the Beijing Capital International Airport. Overall, these clusters were mainly distributed in Beijing Capital International Airport, Beijing West Railway Station and Beijing Railway Station. This was likely due to the fact that Beijing West Railway Station and Beijing Capital International Airport are the major transportation hubs in the city. Affected by the rainstorm, nearly 20 trains were delayed in Beijing West Railway Station during those two days. At the same time, many flights were delayed at Beijing Capital International Airport, trapping nearly 80,000 passengers at the airport during the storm.
Figure 11. The clustering of the Sina-Weibo under the “traffic” topic.
Sustainability 08 00025 g011
For “disaster information” topic, we obtained four clusters. As shown in the Figure 12, all of the clusters were in the vicinity of Guangqumen. This showed that, in that area, there had been a major disaster. According to official information provided by Beijing after the Beijing Rainstorm, there were 66 victims who died in the rainstorm. Among them was a victim that died in the core of the city and the rest were concentrated in the outer suburbs and towns, especially in mountainous areas. The core of the city is the rectangular area in Figure 12.
Figure 12. The clustering of the Sina-Weibo under the “disaster information” topic.
Sustainability 08 00025 g012

5. Conclusions

Social media has great potential in assisting the formulation of better emergency responses because of the large number of public participants and because of the real time dissemination of text messages. When an emergency occurs, social media text streams often contain a large amount of timely information regarding the emergency. These text messages, if used properly, can help decision-makers make the right decisions. To do that, timely access to such emergency information, using social media, would be an important factor for emergency response.
At present, there remain issues with regard to using social media data. Social media data and demographic characteristics of geographical distribution are highly correlated. Additionally, social media data contain a large amount of spam, which will affect the credibility of the data. However, due to the huge amount of data, as well as the participation of the public, social media data should still be an important data source.
In this paper, we showed that timely emergency information from social media can be used to facilitate better responses during emergency events. With the 2012 Beijing Rainstorms as a case study, we showed the way to carry out a topic-based classification of social media text streams. Using this classification model, we found from our trend analysis of the text streams that changes in the proportion of Sina-Weibo texts for different topics over time corresponded well to different development stages of the emergency event. Decomposition of seasonal components from the time series data was applied to explore the trend in the number of Sina-Weibo texts related to the “Beijing rainstorm”. Density-based clustering analysis suggested clusters of Sina-Weibo texts for different topics, which, in turn, indicated a possible spatial structure for distributing resources in response to emergencies.
More research also need to be carried out to improve on our approach and analysis results. Some of the analysis results need to further explore the deeper meaning behind the phenomenon of how to use these laws for disaster management. For example, the relationship between the trend of topics under discussion and the stage of emergency events should be further explored.
In addition, more data sources concerning different aspects of the emergency events should be taken into account in our model. Social media is only one of many information sources so data from other outlets or sources may also be very important to emergency responses, such as real-time weather data and terrain data in flood events. At the same time, more emergency events could be analyzed using our method to ensure that the model is able to be used to help better prepare for different types of emergency events.

Acknowledgments

This work has been supported by the National Science Foundation (1416509), the National Natural Science Foundation of China (No. 41271399), China Special Fund for Surveying, Mapping and Geoinformation Research in the Public Interest(No. 201512015), and the Specialized Research Fund for the Doctoral Program of Higher Education (No. 20120141110036).

Author Contributions

Yandong Wang designed research and wrote the paper, Teng Wang performed research, analyzed the data and wrote the paper, Xinyue Ye co-designed research and extensively updated the paper, Jianqi Zhu developed some earlier prototypes, Jay Lee edited the paper. All authors read and approved the final manuscript.

Conflicts of Interest

The authors declare no conflict of interest.

References

  1. Wang, Z.; Tchernev, J.M.; Solloway, T. A dynamic longitudinal examination of social media use, needs, and gratifications among college students. Comput. Hum. Behav. 2012, 28, 1829–1839. [Google Scholar] [CrossRef]
  2. Usher, K.; Woods, C.; Casella, E.; Glass, N.; Wilson, R.; Mayner, L.; Jackson, D.; Brown, J.; Duffy, E.; Mather, C.; et al. Australian health professions student use of social media. Collegian 2014, 21, 95–101. [Google Scholar] [CrossRef] [PubMed]
  3. Fischer, E.; Reuber, A.R. Social interaction via new social media: (How) can interactions on Twitter affect effectual thinking and behavior? J. Bus. Ventur. 2011, 26, 1–18. [Google Scholar] [CrossRef]
  4. Boley, B.B.; Magnini, V.P.; Tuten, T.L. Social media picture posting and souvenir purchasing behavior: Some initial findings. Tour. Manag. 2013, 37, 27–30. [Google Scholar] [CrossRef]
  5. Lee, H. Social media and student learning behavior: Plugging into mainstream music offers dynamic ways to learn English. Comput. Hum. Behav. 2014, 36, 496–501. [Google Scholar] [CrossRef]
  6. Freberg, K.; Graham, K.; McGaughey, K.; Freberg, L.A. Who are the social media influencers? A study of public perceptions of personality. Public Relat. Rev. 2011, 37, 90–92. [Google Scholar] [CrossRef]
  7. Hong, H. Government websites and social media’s influence on government-public relationships. Public Relat. Rev. 2013, 39, 346–356. [Google Scholar] [CrossRef]
  8. Hanna, R.; Rohm, A.; Crittenden, V.L. We’re all connected: The power of the social media ecosystem. Bus. Horiz. 2011, 54, 265–273. [Google Scholar] [CrossRef]
  9. Rawat, S.; Divekar, R. Developing a Social Media Presence Strategy for an E-commerce Business. Procedia Econ. Financ. 2014, 11, 626–634. [Google Scholar] [CrossRef]
  10. Mangold, W.G.; Faulds, D.J. Social media: The new hybrid element of the promotion mix. Bus. Horiz. 2009, 52, 357–365. [Google Scholar] [CrossRef]
  11. Li, Q.; Wang, J.; Chen, Y.P.; Lin, Z. User comments for news recommendation in forum-based social media. Inf. Sci. 2010, 180, 4929–4939. [Google Scholar] [CrossRef]
  12. Chen, X.; Yang, X. Does food environment influence food choices? A geographical analysis through “tweets”. Appl. Geogr. 2014, 51, 82–89. [Google Scholar] [CrossRef]
  13. Li, L.; Goodchild, M.F.; Xu, B. Spatial, temporal, and socioeconomic patterns in the use of Twitter and Flickr. Cartogr. Geogr. Inf. Sci. 2013, 40, 61–77. [Google Scholar] [CrossRef]
  14. Lee, R.; Wakamiya, S.; Sumiya, K. Discovery of unusual regional social activities using geo-tagged microblogs. World Wide Web 2011, 14, 321–349. [Google Scholar] [CrossRef]
  15. Cheng, T.; Wicks, T. Event Detection using Twitter: A Spatio-Temporal Approach. PLoS ONE 2014, 9. [Google Scholar] [CrossRef] [PubMed]
  16. Tsou, M.-H.; Yang, J.-A.; Lusher, D.; Han, S.; Spitzberg, B.; Gawron, J.M.; Gupta, D.; An, L. Mapping social activities and concepts with social media (Twitter) and web search engines (Yahoo and Bing): A case study in 2012 US Presidential Election. Cartogr. Geogr. Inf. Sci. 2013, 40, 337–348. [Google Scholar] [CrossRef]
  17. Cho, E.; Myers, S.A.; Leskovec, J. Friendship and mobility: User movement in location-based social networks. In Proceedings of the 17th ACM SIGKDD International Conference on Knowledge Discovery and Data Mining, San Diego, CA, USA, 21–24 August 2011; pp. 1082–1090.
  18. Ferrari, L.; Rosi, A.; Mamei, M.; Zambonelli, F. Extracting urban patterns from location-based social networks. In Proceedings of the 3rd ACM SIGSPATIAL International Workshop on Location-Based Social Networks, Chicago, IL, USA, 1–4 November 2011; pp. 9–16.
  19. Zheng, Y.; Xie, X.; Ma, W.-Y. GeoLife: A Collaborative Social Networking Service among User, Location and Trajectory. IEEE Data Eng. Bull. 2010, 33, 32–39. [Google Scholar]
  20. Zook, M.; Graham, M.; Shelton, T.; Gorman, S. Volunteered geographic information and crowdsourcing disaster relief: A case study of the Haitian earthquake. World Med. Heal. Policy 2010, 2, 7–33. [Google Scholar] [CrossRef]
  21. Starbird, K.; Palen, L.; Hughes, A.L.; Vieweg, S. Chatter on the red: What hazards threat reveals about the social life of microblogged information. In Proceedings of the ACM Conference on Computer Supported Cooperative Work, Savannah, GA, USA, 6–10 February 2010; pp. 241–250.
  22. Qu, Y.; Huang, C.; Zhang, P.; Zhang, J. Microblogging after a major disaster in China: A case study of the 2010 Yushu earthquake. In Proceedings of the ACM Conference on Computer Supported Cooperative Work, Seattle, WA, USA, 11–15 February 2011; pp. 25–34.
  23. Guan, X.; Chen, C. Using social media data to understand and assess disasters. Nat. Hazards 2014, 74, 837–850. [Google Scholar] [CrossRef]
  24. De Longueville, B.; Smith, R.S.; Luraschi, G. OMG, from here, I can see the flames!: A use case of mining location based social networks to acquire spatio-temporal data on forest fires. In Proceedings of the International Workshop on Location Based Social Networks, Seattle, WA, USA, 3–6 November 2009; pp. 73–80.
  25. Slavkovikj, V.; Verstockt, S.; van Hoecke, S.; van de Walle, R. Review of wildfire detection using social media. Fire Saf. J. 2014, 68, 109–118. [Google Scholar] [CrossRef]
  26. Sakaki, T.; Okazaki, M.; Matsuo, Y. Tweet analysis for real-time event detection and earthquake reporting system development. IEEE Trans. Knowl. Data Eng. 2013, 25, 919–931. [Google Scholar] [CrossRef]
  27. Chae, J.; Thom, D.; Jang, Y.; Kim, S.; Ertl, T.; Ebert, D.S. Public behavior response analysis in disaster events utilizing visual analytics of microblog data. Comput. Graph. 2014, 38, 51–60. [Google Scholar] [CrossRef]
  28. Yin, J.; Lampert, A.; Cameron, M.; Robinson, B.; Power, R. Using social media to enhance emergency situation awareness. IEEE Intell. Syst. 2012, 27, 52–59. [Google Scholar] [CrossRef]
  29. Yates, D.; Paquette, S. Emergency knowledge management and social media technologies: A case study of the 2010 Haitian earthquake. Int. J. Inf. Manag. 2011, 31, 6–13. [Google Scholar] [CrossRef]
  30. Vieweg, S.; Hughes, A.L.; Starbird, K.; Palen, L. Microblogging during two natural hazards events: What twitter may contribute to situational awareness. In Proceedings of the SIGCHI Conference on Human Factors in Computing Systems, Atlanta, GA, USA, 10–15 April 2010; pp. 1079–1088.
  31. Imran, M.; Elbassuoni, S.M.; Castillo, C.; Diaz, F.; Meier, P. Extracting information nuggets from disaster-related messages in social media. In Proceedings of the 10th International Conference on Information Systems for Crisis Response and Management (ISCRAM), Baden-Baden, Germany, 12–15 May 2013.
  32. Nagel, A.C.; Tsou, M.-H.; Spitzberg, B.H.; An, L.; Gawron, J.M.; Gupta, D.K.; Yang, J.-A.; Han, S.; Peddecord, K.M.; Lindsay, S.; et al. The complex relationship of realspace events and messages in cyberspace: Case study of influenza and pertussis using tweets. J. Med. Internet Res. 2013, 15. [Google Scholar] [CrossRef] [PubMed]
  33. Chunara, R.; Andrews, J.R.; Brownstein, J.S. Social and news media enable estimation of epidemiological patterns early in the 2010 Haitian cholera outbreak. Am. J. Trop. Med. Hyg. 2012, 86, 39–45. [Google Scholar] [CrossRef] [PubMed]
  34. Achrekar, H.; Gandhe, A.; Lazarus, R.; Yu, S.-H.; Liu, B. Predicting flu trends using twitter data. In Proceedings of the IEEE Conference on Computer Communications Workshops (INFOCOM WKSHPS), Shanghai, China, 10–15 April 2011; pp. 702–707.
  35. Tsou, M.-H.; Kim, I.-H.; Wandersee, S.; Lusher, D.; An, L.; Spitzberg, B.; Gupta, D.; Gawron, J.M.; Smith, J.; Yang, J.-A.; et al. Mapping ideas from cyberspace to realspace: Visualizing the spatial context of keywords from web page search results. Int. J. Digit. Earth 2014, 7, 316–335. [Google Scholar] [CrossRef]
  36. Blei, D.M.; Ng, A.Y.; Jordan, M.I. Latent dirichlet allocation. J. Mach. Learn. Res. 2003, 3, 993–1022. [Google Scholar]
  37. Suykens, J.A.K.; Vandewalle, J. Least squares support vector machine classifiers. Neural Process. Lett. 1999, 9, 293–300. [Google Scholar] [CrossRef]
  38. Liu, J.S. The Collapsed Gibbs Sampler in Bayesian Computations with Applications to a Gene Regulation Problem. J. Am. Stat. Assoc. 1994, 89, 958–966. [Google Scholar] [CrossRef]
  39. Cleveland, R.B.; Cleveland, W.S.; McRae, J.E.; Terpenning, I. STL: A seasonal-trend decomposition procedure based on loess. J. Off. Stat. 1990, 6, 3–73. [Google Scholar]
  40. Ankerst, M.; Breunig, M.M.; Kriegel, H.-P.; Sander, J. OPTICS: Ordering points to identify the clustering structure. In Proceedings of the 17th ACM Symposium on Operating System Principles (SO SP’99), Kiawah Island, SC, USA, 12–15 December 1999; pp. 49–60.
  41. Aurenhammer, F. Voronoi Diagrams—A Survey of a Fundamental Geometric Data Structure. ACM Comput. Surv. 1991, 23, 345–405. [Google Scholar] [CrossRef]

