1. Introduction
Air pollution has serious adverse impacts on human health, the environment, and the economy. The damages of air pollution create real losses for economies, productivity of labour forces, and natural systems [
1]. The effects of poor air quality are felt the most strongly in two areas—urban areas and ecosystems. Since more than the half of the world population is currently residing in urban areas [
2], improving air quality is a significant aspect of promoting sustainable human settlements. According to the World Health Organization, clean air is a basic requirement for human health and well-being [
3].
Air pollution control policies require systematically monitoring and evaluating air quality. Therefore, developing a suitable tool is of utmost importance for understanding air quality over an area. Such a tool must be able to contribute to raising citizens’ awareness about the levels of pollution in an adequate and understandable way. Additionally it can be used by the relevant authorities to take a series of predetermined measures to protect the health of the population.
One of the most useful ways for characterizing atmospheric pollution is using air pollution indices. Indeed, air pollution indices are commonly used to indicate the level of severity of air pollution to the public. The evaluation of air quality may be short-term (occasional) or long-term. Occasional evaluation is useful in the context of information and alert systems for the population, working normally in real or almost-real time [
4]. While the short-term air pollutant indices are mainly used for informing or warning the public, the long-term air pollutant indices are aimed at better taking into account long-term exposure to air pollution. Therefore, long-term indices are more suitable for policy monitoring. There are several studies in literature relating to short-term [
5,
6,
7] and long-term [
8,
9,
10,
11,
12] air pollution indices based on data collected from air quality monitoring stations.
This study aims to build a long-term multi-pollutant air quality index for Turkey in view of the European Union (EU) annual norms. Since an increasing percentage of the Turkey’s population lives in urban areas, improving air quality is a significant aspect of promoting sustainable cities. Despite progress in providing statistics and indicators related to air quality, the need for integrated studies on air quality both national and sub-national levels is urgent. This necessity is actually the main motivation of this study.
2. Air Quality in Turkey
Urban air pollution is a significant environmental problem for Turkey, as is common in developing countries. Economic growth and rapid urbanization has brought with it serious air pollution problems. Average annual growth rate of urban population was 2.30% in the period of 1990–2013 and at the end of 2008, 72.37% of total population lived in urban areas [
13]. Three largest metropolitans, namely İstanbul, Ankara, and İzmir provinces, are resided by 30.42% of the country’s total population [
14].
Starting with the second half of 1970s, especially in the winter months, urban air pollution has become a significant problem. In the 1990s, there has been a decrease in concentrations of sulphur dioxide (SO
2) and particulate matter (PM) in urban areas. Most of this improvement can be attributed to fuel substitution (from high sulphur content domestic coal to natural gas) in residential heating and power generation. However, in some urban and industrial centres ambient air pollution still poses a threat to public health since SO
2 and particulates exceeding national air quality standards [
15]. While pollution concentrations are highest in major urban areas (İstanbul, Ankara) and cities where industry has continued to expand, in rural areas air quality is typically good.
Turkey’s environmental policy has been shaped by international regulatory frameworks. Of particular importance here is the EU. As a candidate state to the EU, Turkey has been harmonizing the national environmental legislation with the EU environmental acquis. An important impetus to strengthen air management policy in Turkey came when Turkey adopted its EU Integrated Environmental Strategy which called for the full harmonization of the Turkish legal frame work with the EU Air Quality Framework Directive. Comparison of the Turkish air quality standards with those of the EU shows that for nearly all pollutants the standards are higher than the EU limit values. The only exception is annual mean of SO
2 and NO
x since the standards for those pollutants are the same from 2014 on [
16].
The Ministry of Environment and Urbanization is working on improving the air quality management scheme in Turkey. Since 2012, air quality data have been available in a new format. They come from 195 stable air quality measurement stations and four mobile air quality measurement stations in the context of National Air Quality Observation Network program. The data are made available in real time to the public through the Ministry of Environment and Urbanization website [
17]. However, both the number of parameters measured and the availability of retrospective data are still limited.
3. Data and Methodology
3.1. Data Sources
A variety of air quality parameters are used in the development of air quality index. Sulphur dioxide (SO
2), nitrogen dioxide (NO
2), particulate matter (PM
10), carbon monoxide (CO), and ozone (O
3) are the common ones. In this study, pollutants were selected based on the availability and continuity of data at the air quality monitoring stations. According to this constraint, SO
2, NO
2, and PM
10 were the parameters of concern. The data were collected from Republic of Turkey Ministry of Environment and Urbanization, “Air Quality Monitoring Stations” website [
17].
Despite there are 199 air quality measurement stations overall Turkey, the number of stations which supply the yearly average concentrations of SO2, NO2, and PM10 are only 20. Listed following are the stations that were included in this study: Adana-Valilik (S1), Ankara-Bahçelievler (S2), Ankara-Cebeci (S3), Ankara-Demetevler (S4), Ankara-Dikmen (S5), Ankara-Sıhhıye (S6), Ankara-Sincan (S7), İstanbul-Aksaray (S8), İstanbul-Alibeyköy (S9), İstanbul-Beşiktaş (S10), İstanbul-Esenler (S11), İstanbul-Kadıköy (S12), İstanbul-Ümraniye (S13), İzmir-Bornova (S14), İzmir-Güzelyalı (S15), Karabük-Kardemir1 (S16), Karabük-Kardemir2 (S17), Kocaeli-Dilovası (S18), Manisa-Soma (S19), Zonguldak-Karadeniz Ereğli (S20). It should be noted that all selected stations are located near the urban and industrial sites of eight cities.
As can be seen from
Figure 1, which illustrates annual mean ambient air concentrations for SO
2, the EU long-term standard (20 μg/m
3) [
18,
19] was exceeded at four stations. The violation of the European standard can also be observed for NO
2 concentrations. At S2, S3, S4, S5, S6, S8, S9, S10, S11, S12, and S13 stations limit value (40 μg/m
3) [
18,
19] was exceeded (see
Figure 2). In respect of PM
10 concentrations, the situation is much worse. According to
Figure 3, the annual standard of (40 μg/m
3) [
18,
19] was exceeded at 18 stations out of 20.
Figure 1.
Annual mean ambient air concentration of SO2.
Figure 1.
Annual mean ambient air concentration of SO2.
Figure 2.
Annual mean ambient air concentration of NO2.
Figure 2.
Annual mean ambient air concentration of NO2.
Figure 3.
Annual mean ambient air concentration of PM10.
Figure 3.
Annual mean ambient air concentration of PM10.
3.2. Methodology
Although there are various methods available for constructing air quality indices [
20,
21,
22], there is no unified strategy for constructing an air quality index. The objective of this study is to construct a multi-pollutant index considering the combined level of the three pollutants (SO
2, NO
2, PM
10) in view of the EU long-term annual limit values. Therefore, as a first step, normalization should be carried out in order to render the variables comparable [
23,
24].
A number of normalization methods exist in the literature [
24]. In this study, “Distance to Reference Value Normalization” method [
24] is applied since this approach is widely used in environmental applications [
25,
26,
27]. In this method, distance to a reference measures the relative position of a given indicator
vis-à-vis a reference. This could be a target to be reached in a given time frame.
Turkey’s “Air Quality Assessment and Management Regulation” sets limits for air quality parameters in order to comply with the EU limit values. However, the application of ambient air quality standards shall become effective gradually and the harmonisation process will be completed by 1 January 2022. Since Turkey stated that it was aiming at complying with the EU limit values, in our study these EU long-term limit values were accepted as reference values [
16].
The general equation to calculate the normalized value of individual indicator
i (
) is given as follows:
where
(μg/m
3) is the raw value of individual indicator
i and
(μg/m
3) is the EU long-term limit value for the indicator
i.The calculated normalised values of the air pollutant concentrations for 20 air quality monitoring stations are presented in
Table 1.
Table 1.
Normalized values of the ambient air pollutant concentrations.
Table 1.
Normalized values of the ambient air pollutant concentrations.
| Station Code | SO2 | NO2 | PM10 |
|---|
| S1 | 0.200 | 0.575 | 1.625 |
| S2 | 0.500 | 1.500 | 1.350 |
| S3 | 0.500 | 1.550 | 1.900 |
| S4 | 0.700 | 1.175 | 1.500 |
| S5 | 0.400 | 1.575 | 1.275 |
| S6 | 0.500 | 1.400 | 1.875 |
| S7 | 0.450 | 0.875 | 1.425 |
| S8 | 0.400 | 1.850 | 1.425 |
| S9 | 0.200 | 1.375 | 1.525 |
| S10 | 0.200 | 2.100 | 1.175 |
| S11 | 0.200 | 1.525 | 1.325 |
| S12 | 0.250 | 1.350 | 1.325 |
| S13 | 2.850 | 1.325 | 0.150 |
| S14 | 0.400 | 0.525 | 1.000 |
| S15 | 0.300 | 0.525 | 1.450 |
| S16 | 1.200 | 0.775 | 2.100 |
| S17 | 2.000 | 0.625 | 2.475 |
| S18 | 0.800 | 0.925 | 2.050 |
| S19 | 3.250 | 0.725 | 2.000 |
| S20 | 0.400 | 0.925 | 1.175 |
Once the normalization process is completed, the weights of the environmental indicators (SO
2, NO
2, and PM
10) must be specified before the aggregation in order to build a single index. The weights can be derived by integrating the expert surveys with some multi-attribute evaluation models such as the Analytical Hierarchy Process [
28,
29,
30,
31]. If there is no exact expert information or objective mechanism to determine the relative importance of different environmental indicators, the choice of equal weights may be more justifiable and widely acceptable [
19,
25,
32]. In this present study, equal weights were assigned to all normalized values. Since the normalization process took into account the EU long-term limit values for each indicator,
values reflect implicitly the magnitude of the health impact of each pollutant. Therefore, the adoption of equal weights is consistent with the aim of the study.
The annual average air quality index for a specific station was calculated from the following formula:
where
represents the aggregated index for the station
s, N is the number of indicators to be aggregated,
is the normalized values of the indicators for specific station s for indicator
i and
is the weight of indicator
i.
were assigned to 1/3 weight, since equal weights were adopted for the three environmental indicators.
4. Results and Discussions
The proposed index represents the city’s general air quality conditions throughout the year. It is based on annual mean ambient air concentrations of the pollutants compared to annual limit values. It is presented as a distance to target values. The index provides a relative measure of the annual average air quality in relation to the European limit values, since the target was selected as the EU directives (annual air quality standards and objectives) [
19].
In respect of interpretation of the index value, an index value higher than one indicates that for one or more pollutants the limit values are exceeded. Similarly, if the index value is below one it means that on average the limit values are met (see
Table 2).
Table 2.
Interpretation of the index values.
Table 2.
Interpretation of the index values.
| Index Value | Air Quality |
|---|
| >1 | The EU standards are exceeded by one pollutant or more |
| 1 | The EU standards are fulfilled on average |
| <1 | The situation is better than the norms on average |
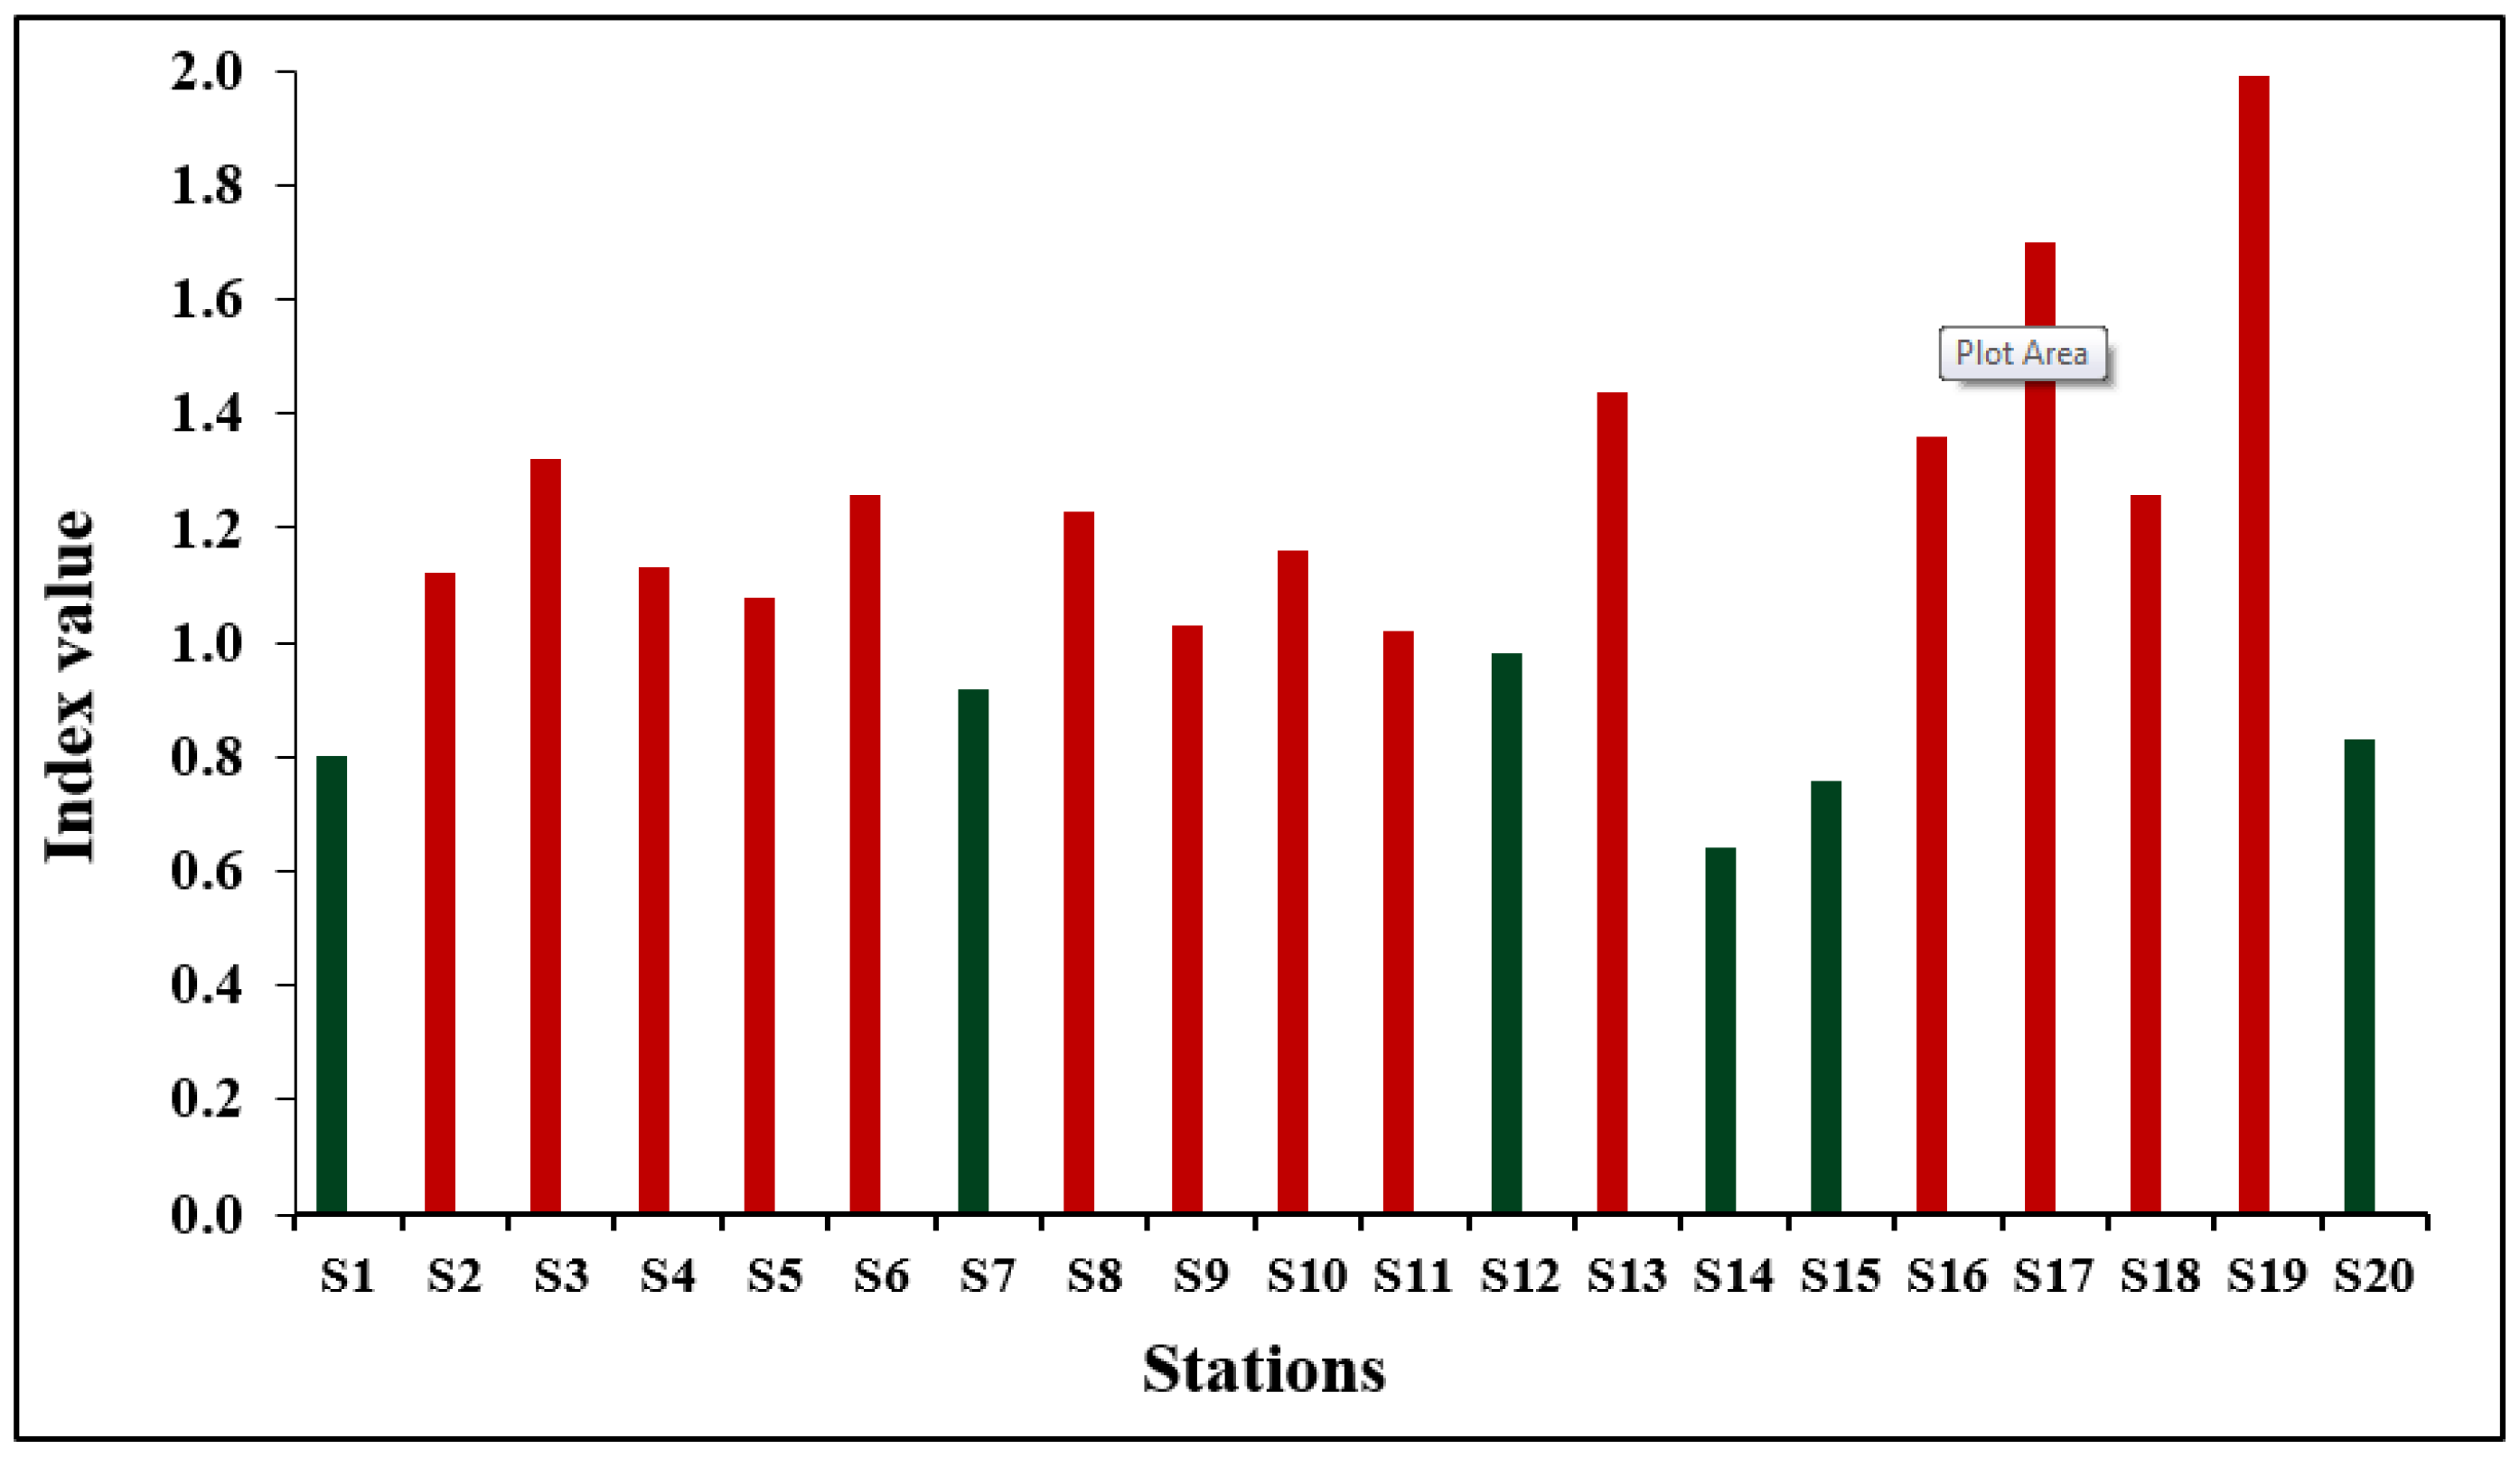
Calculated index values for 20 locations in Turkey by using 2014 data are presented in
Figure 4. As can be seen from
Figure 4, the EU annual norms were exceeded at S2, S3, S4, S5, S6, S8, S9, S10, S11, S13, S16, S17, S18, and S19 air quality monitoring stations. At the six stations (S1, S7, S12, S14, S15, and S20) the situation is better than the norms on average (see
Table 2).
Figure 4.
Air quality index for 20 air quality monitoring stations in Turkey.
Figure 4.
Air quality index for 20 air quality monitoring stations in Turkey.
According to the index values, in general, the air quality monitoring stations located at the big cities of Turkey could not fulfil the EU standards. The area with the worst air quality was Manisa-Soma (S19) while best air quality was observed in İzmir-Bornova (S14) (see
Figure 4). This is an expected result since there are six coal-fired thermal power plants operating close to S19 air quality monitoring station, while there is no energy system nearby S14.
The index results provide a general overview of the air quality situation in a given location all the year through and compare to European norms. The regulations taken into account are some of the annual standards and objectives defined by the European directives. This index is aimed at better taking into account long-term public exposure to air pollution and it can be used as a way of setting air quality goals.
For locations with the index value > 1, priority should be given to reducing emissions in the near term, since those areas are suffering the most from air pollution.
For locations with the index value = 1, air quality should be improved in order to keep ambient concentrations below an index value of 1. It is particularly important for those areas where health impacts are most likely occurring.
For locations with the index value < 1, efforts should be led to maintain the relatively clean air by curtailing new emission sources that could impact health.
After setting the goals, comprehensive clean air action plans should be developed and ensure that they are implemented effectively and efficiently.
5. Conclusions
Environment has had a relatively low priority in Turkey and environmental concerns have been too often superseded by economic growth interest in policy-making. Despite attempts to reduce emissions of air pollutants, air pollution in Turkey is still considered a serious problem and large parts population are currently exposed to concentrations of air pollutants far above the EU limit values.
To meet the basic requirements for an efficient air quality control, it is essential to provide measurements and data sufficiently accurate and representative on both time and space, adopting evaluation and monitoring strategies capable. In this context, the National Air Quality Index of Turkey launched in 2007. This real-time index has been developed by modification of EPA Air Quality Index according to national regulations and limit values.
This study presents a new approach to evaluate and compare the pollution concentrations in different cities to assess their air quality. In this paper, we have developed a long-term multi-pollutant air quality index for Turkey in view of the EU annual norms. Focusing the annual mean ambient air concentration of SO2, NO2, and PM10, the proposed index evaluate and compares air quality of 20 locations in eight cities.
The index provides a relative measure of the annual average air quality in relation to the European limit values, since the target was selected as the EU annual air quality standards. It is aimed at better taking into account long-term exposure to air pollution based on distance to the target set by the EU annual norms. Since those norms being linked most of the time to recommendations and health protection set up by World Health Organization, the proposed index provides a viable option for identifying the overall air quality is poorest and potentially presents the greatest health risk.
The index could be also useful as other long-term indices to attract funding from organizations such as the World Bank and the EU to fund the introduction of specific mitigation strategies, which could have benefit of reducing air pollution from cities to other regions.
While the lack of air quality data for several cities and pollutants constraint the current effort, the proposed index can also take account other pollutants when data become available. Then the index will facilitate the evaluation and ranking of city emissions and air quality. Although the proposed evaluation framework was applied to only limited number of Turkish cities, this framework is applicable to other countries. We hope that this study will encourage other researchers to apply the evaluation framework to different countries and motivate required improvements to increase air quality of the overall world.


