Article

Evaluating the Impacts of Bus Fare on Social Equity Based on IC Card Data in China

1
Department of Traffic Information & Control Engineering, School of Transportation Science and Engineering, Harbin Institute of Technology, No. 73 Huang He Rd., Harbin 150090, China
2
Department of Traffic Engineering, School of Transportation Science and Engineering, Harbin Institute of Technology, No. 73 Huang He Rd., Harbin 150090, China
*
Author to whom correspondence should be addressed.
Sustainability 2016, 8(10), 1032; https://doi.org/10.3390/su8101032
Submission received: 29 July 2016 / Revised: 27 September 2016 / Accepted: 8 October 2016 / Published: 17 October 2016

Abstract

:
Bus fare equity has attracted significant attention in China in the past few years. Compared with developed countries, China’s intelligent transportation systems are in their infancy, with immature bus fare policies being used in many public transit systems. The methods used for evaluating public transit fare equity in developed countries compare different fare policies based on rich data and cannot be directly applied in developing countries like China. In this paper, we present a method that uses IC card data, bus-mounted GPS data, and relevant statistical yearbook data to evaluate the equity of flat bus fare. The method ranks the factors that influence the impacts of bus fare on social equity for different passenger groups and indicates that trip distance and passenger boarding time are the two primary factors for bus fare equity from a resource allocation perspective. Finally, we present a case study that evaluates the flat fare policy for route 204 in Suzhou using the proposed method. The results show that the proposed method is feasible.

1. Introduction

Transit equity concerns the allocation of transportation resources among different socioeconomic groups and has attracted significant attention in transportation planning in the past few decades [1]. Socially equitable transportation investigates the fairness in the distribution of transport resources among different socio-economic groups and relevant policies [2,3]. Transit equity with regard to investments covers transport infrastructures [4,5] and financial subsidies [6]. Transit equity in terms of costs deals with environmental justice [7], tolls and congestion pricing [8], and transit prices as well as fare structures [9]. The factors concerning the equity of public transit benefits include travel opportunities [10], accessibility [11], and level of service (LOS) [12].
Due to special historical, political, and cultural reasons, scholars in developed countries have conducted the earliest and very comprehensive studies on equity issues in transport systems. Existing research mainly focuses on equity in road pricing, fare revenue and structure [13], road network design [14], allocation of investments on transport infrastructure [15], accessibility to jobs [16], sustainable transportation [17], fare policies [18], etc. However, transport equity studies in China primarily concentrate on resource allocation among different transport modes [19].
Transportation equity has many facets, and the first step in investigating public transit equity is to delineate the scope. In general, there exist three major types of transportation equity: horizontal equity, vertical equity, and vertical equity based on mobility need and ability [20]. Horizontal equity examines the fairness between the individuals and groups that have comparable wealth and ability [20]. “Vertical equity requires that disadvantaged people be identified and given special consideration in planning, to insure that they are not made worse off, and that their needs are accommodated” [20]. Many researchers have further examined equity issues based on the above three types of equity, and these studies primarily focus on the two types of vertical equity. For example, Jing [21] investigated the theoretical nature and representation of transportation equity among different transportation modes, socio-economic groups, regions and age groups from the perspective of sustainable development and put forward relevant metrics to quantitatively evaluate the four aspects of equity. Taylor [22] examined transportation pricing and finance equity from a variety of perspectives.
Due to the availability of rich, open data, researchers in developed countries can make full use of these high-quality and detailed data to examine the impacts of fare policies on transportation equity. For instance, Cervero [23] assessed the impacts of fare structures on transportation efficiency and equity by performing a contrastive analysis on the revenue and cost data from three transit agencies in California during 1977–1979. A more recent study by Nuworsoo et al. [18] used on-board survey data to evaluate the impacts of alternative proposed fare policies concerning base fare reduction, fare hikes, cancellation of free transfers, and discontinuation of periodic passes from the Alameda–Contra Costa (AC) Transit District to facilitate decision-making. Moreover, Taylor and Jones [24] argue that a good fare policy should not only benefit transit-dependent riders but also maintain the revenues of the transit agencies.
Although scholars have put forward relevant methods for evaluating public transit fare equity, it is difficult to apply these methods directly to investigate fare equity in China. The reasons are as follows. First, compared with developed countries, the open data initiative for public transit studies in China is still in its infancy. Specifically, the data that can be used to investigate fare equity are scarce. On the contrary, these data (e.g., detailed data on passengers, fare polices, vehicles, geographic and socio-economic factors) are readily available in most developed countries to the researchers, which enables them to perform relevant analysis to investigate fare equity problems very conveniently [25]. However, nearly 80% of the socio-economic data in China are managed by federal and local governments, and most of these data are not open for scientific research. It is difficult for the researchers to obtain relevant geographic, demographic, and socio-economic data required for fare equity studies in China, and data scarcity poses challenges for research in this field.
Second, due to certain socio-economic and administrative reasons and the immaturity of public transport systems, it is difficult to implement differentiated fare policy in China, and the flat fare dominates most public transit systems. Without corresponding intelligent ticketing systems, additional conductors need to be employed to implement differentiated fare policies, which will significantly increase the operating costs. As a result, most transit systems in China continue to use the flat fare policy, with a few discount programs for some special rider groups (e.g., the elder and students). Only some long-distance routes in large cities like Beijing employ differentiated fare policies.
Because of the above-mentioned reasons, the contrastive methods used by scholars to evaluate the impacts of different fare policies on transit equity cannot be directly applied in China. In this paper, we put forward a method for quantitatively evaluating the impacts of a specific fare policy on transit equity based on IC card data, bus-mounted GPS data, and the statistical yearbook data only, taking into account the lack of detailed data for fare equity studies in China. In 
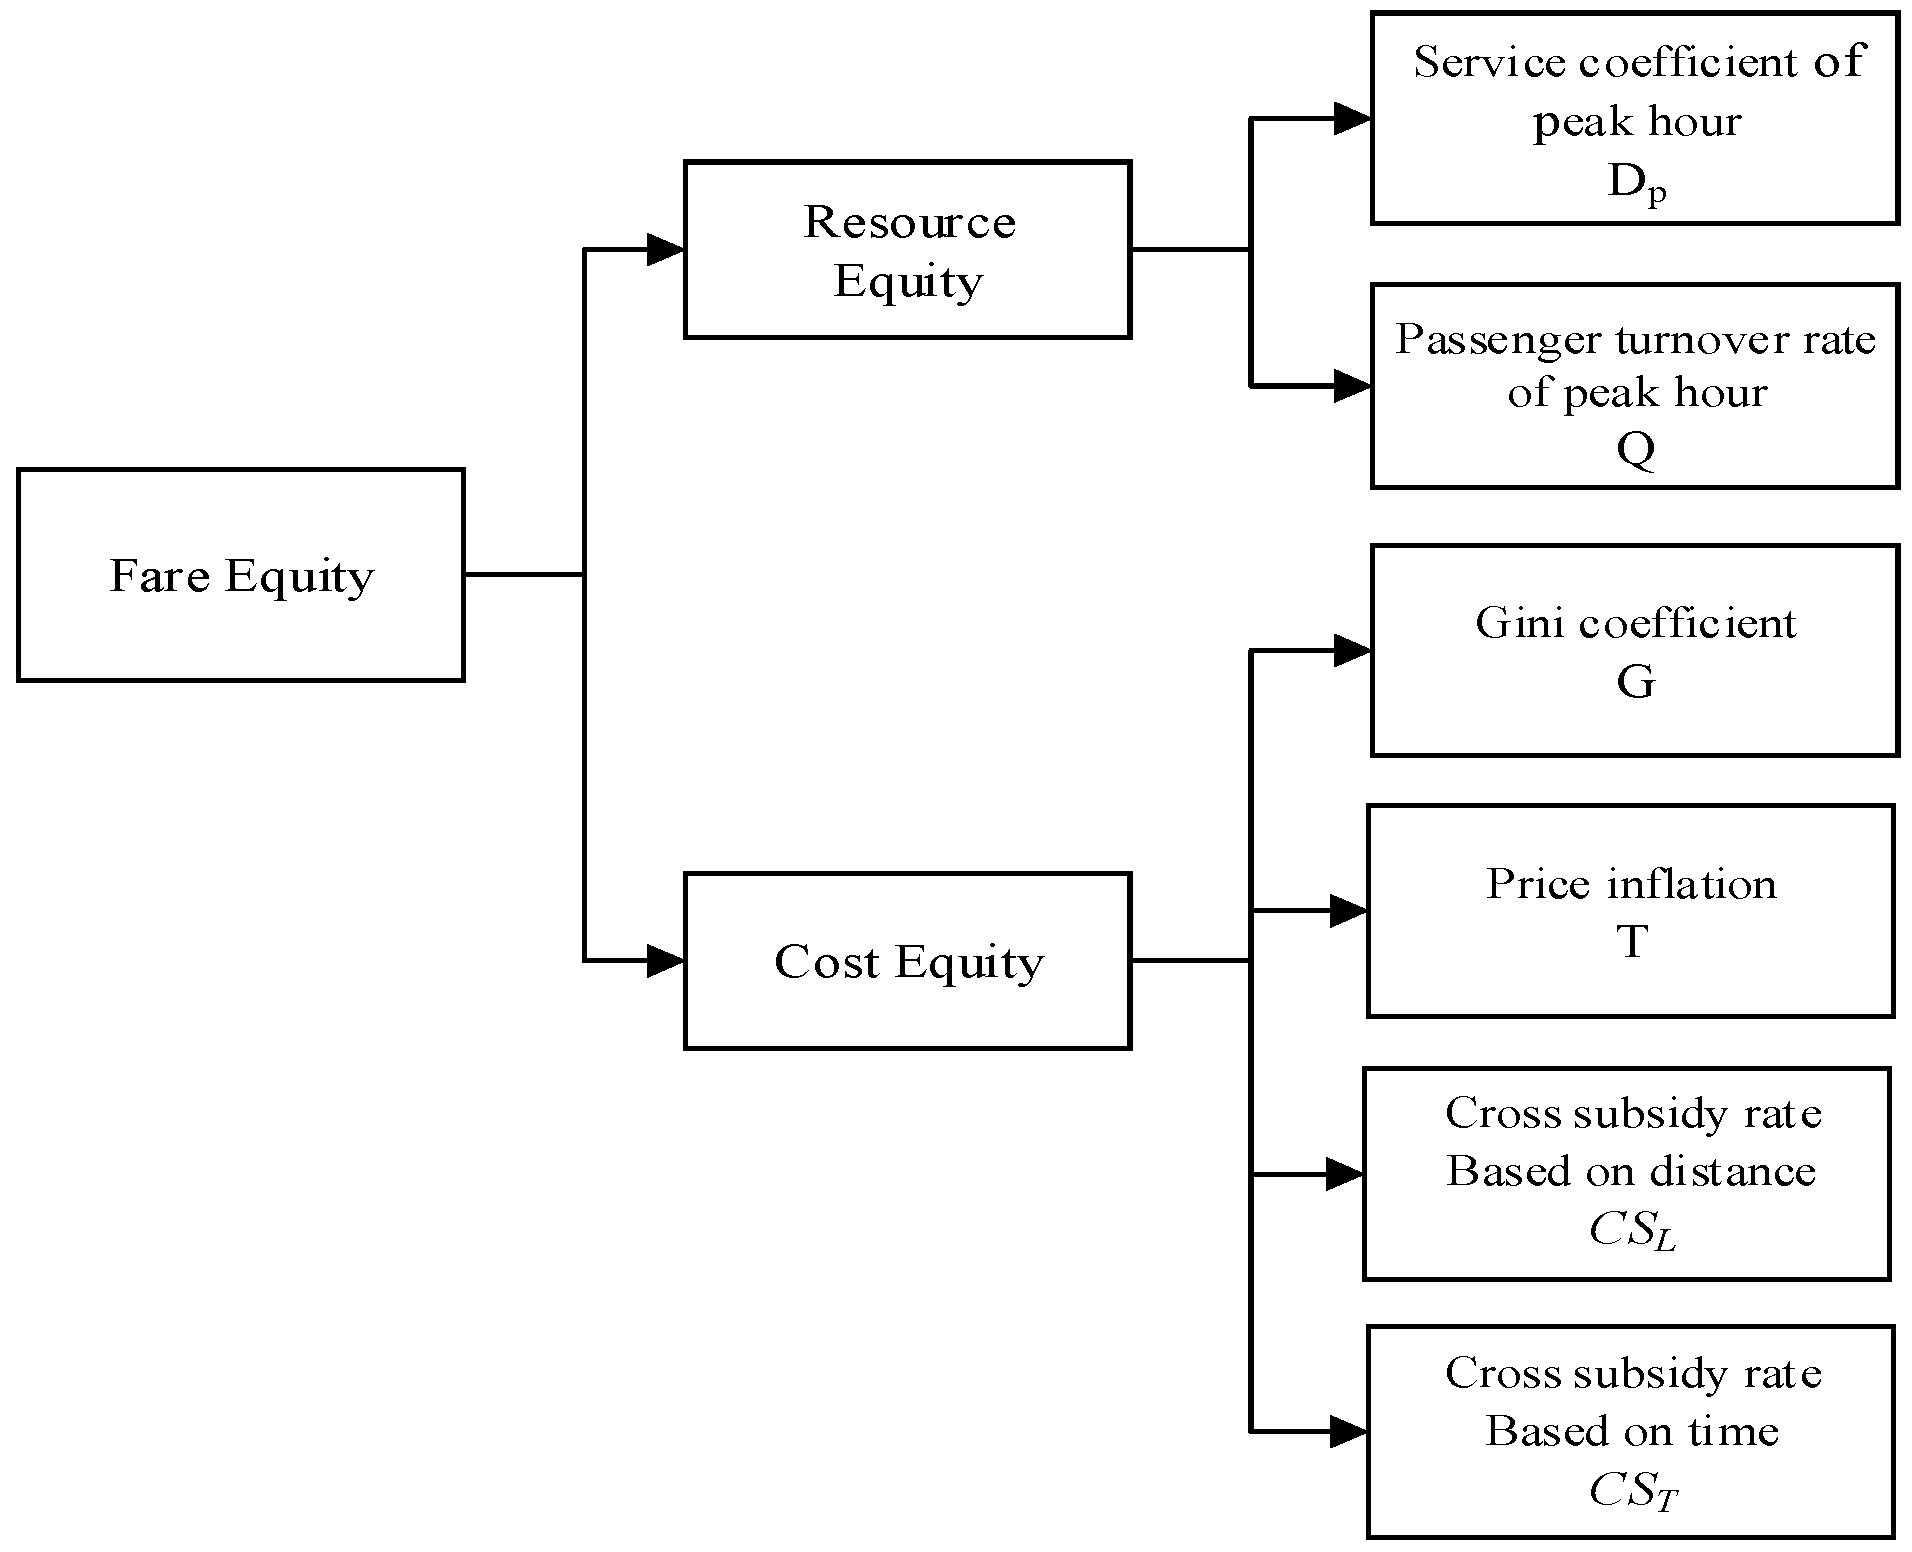
Section 2, we first put forward an analysis method based on cross subsidy rates and rank the factors that influence transit equity. The analysis method is based on the overall cost recovery rate and the cost recovery rate of individual rider group. Since rider group based cost recovery rates change monotonically with respect to rider groups, the ranges of the values of the impacts of individual factor on equity can be ranked. Then we propose metrics for evaluating the impacts of the factors on transit equity from the perspective of cost equity and resource equity. Note that in this context cost equity includes both the riders’ travel cost and the travel agencies’ operating costs while resource equity refers to bus scheduling. We present a case study that investigates the flat fare policy of the bus route 204 in Suzhou using the proposed metrics. The results prove the effectiveness of the proposed metrics and evaluation method. We conclude the paper with discussions of the advantages and weaknesses of the developed method as well as future research directions in this field.

2. Methodology

In this section, we analyze the factors related to fare equity and select the most relevant ones using an analytical method based on cost recovery rate. Then, we put forward the evaluation metrics with regard to resource and cost equity based on the analysis. The data used to analyze the factors related to fare equity are one day’s operating data of the bus route 204 in Suzhou on 23 November 2013 (Saturday). The dataset used may not reflect bus riders’ travel behaviors on weekdays. However, use of this dataset does not affect the generalizability of the proposed methodology.

2.1. Analyzing Factors Related to Bus Fare Equity

2.1.1. Travel Distance and Boarding Time

Travel distance and boarding time have direct impacts on fare equity. The impacts of travel distance can be reflected in two aspects. First, most regular bus routes in China utilize flat fare. This practice could benefit bus riders who travel a long distance but will result in inequity in fare per unit distance (FPUD) for passengers with different travel distances. Figure 1 shows the FPUD for varying travel distances. With the increase of travel distance, the FPUD that passengers need to pay decreases hyperbolically. In Figure 1, the station distance refers to the distance from the beginning of a bus line to a station of that line.
Second, the resources (space and time) occupied by trips with different distances will impact bus riders’ travel opportunities. More short-distance trips will lead to a higher turnover rate, and more passengers will have the opportunity to travel by bus. In contrast, more long-distance trips will cause a lower turnover rate, which will deprive some bus riders of their travel opportunities.
Figure 2 gives the distribution of passengers with regard to travel distance within a day for the route 204 bus in Suzhou. This figure indicates that the proportion of passengers with short travel distances is much larger than that of long-distance passengers.
Boarding time can influence fare equity in the following three ways. First, waiting time, travel opportunities, and comfort for passengers vary significantly in different time periods within a day. Passengers need to endure the crowded environment during rush hours, and some passengers are even unable to get on the bus and thus have to wait for another bus or use other transport modes. In contrary, during off-peak time periods, passengers could enjoy a more comfortable environment, shorter waiting times (the longest waiting time will not exceed the time interval between two consecutive buses) and more travel opportunities. Figure 3 shows the distribution of passengers in different time periods. Note that the number of passengers during morning and evening peak hours is significantly larger than that during off-peak hours.
Second, travel distances vary significantly in different time periods during a day. Since it is difficult to attain travel opportunities due to inability to get a seat and even board a bus during peak hours, most bus riders will avoid making many transfers and choose the most comfortable routes during off-peak hours. As a result, the FPUD during peak hours will be higher that than that during off-peak hours if a flat fare is adopted. Figure 4 shows the FPUD for passengers in different time periods in one day, and note that the peak-hour FPUD is slightly higher than that during off-peak hours.
Third, the travel demand for bus resources also varies with time of day. Because of the huge inbound passenger flow during peak hours, extra vehicles are needed to meet the demand. However, the added vehicles will become unnecessary during off-peak hours, and the low utilization rate of those vehicles will cause additional fixed and repair costs, which will increase the operating costs of public transit agencies.

2.1.2. Bus Riders’ Characteristics

Passengers’ income level, age, gender, and profession indirectly influence fare equity through different choices of travel distance and boarding time. Passengers with different income levels vary in travel distance and boarding time. Low-income bus riders often do not have their own cars and thus rely heavily on public transit. These passengers are called transit dependents and represent the majority of public transit riders in China. Low-income riders usually live far away from downtown and their commute is characterized by long-distance trips. However, car ownership is high in middle and high income groups, and these passengers are usually called the “choice” riders. Moreover, middle and high income riders live close to downtown and their trips are shorter in terms of distance.
Because of inability to drive or poor body conditions, teenagers (<18) and elder people (>55) also depend heavily on public transit, and most of them are transit dependents as well. The number of male passengers is almost equal to that of female passengers. However, female passengers tend to take more long-distance trips. The patterns of the boarding times of both male and female passengers align with those of the whole passenger population. As for education, the number of passengers has a negative relationship with the level of education. Only a small proportion of passengers have received higher education. Furthermore, there is no difference among the passengers with different levels of education in travel distance and boarding time. Moreover, since profession to some degree determines income, the majority of bus riders are company employees who represent low-income groups. They usually ride the bus for short-distance trips during morning and evening peak hours.

2.1.3. Operations of Public Transit (Allocation of Public Transit Resources)

Since the public transport systems in China are still in their infancy, there exists evident inequity in the allocation of public transit resources (e.g., bus route and station planning, vehicle allocation) and LOS of public transit in urban and suburban areas.

2.1.4. Public Transit Policies

Public transit policies are the intrinsic determinants for fare equity. Most public transit companies in China are state-owned, and their administrative policies are characterized by low fare and governmental subsidies that aim to improve the LOS of the public transit systems. However, financial subsidies from the government make these public transit companies less competitive in the market, which leads to low LOS. Moreover, low price and flat fare result in a larger number of bus riders, which reduces travel opportunities for the minority (characterized by long-distance trips, low income, low vehicle ownership, and residences located in remote areas). Governmental subsidies and low flat fare policy emphasize public welfare but fail to take into account the differences among the passengers in income, boarding time and travel distance, which leads to fare inequity.

2.2. Analysis of the Impacts of Various Factors on Fare Equity Based on Cost Recovery Rate

Cost recovery rate is the ratio of the sum of all passengers’ fare to the total operating cost of public transit systems, which is used to explain the percentage of cost that can be covered by fare. Specifically, the cost recovery rate can be calculated using the following equation:
N = f c
where N is the total cost recovery rate, Σf is the sum of fare paid by all passengers, while Σc represents the one-way operating cost paid by bus companies, which only takes into account the fuel cost and drivers’ salary and excludes the cost of the vehicle and the costs caused by repair or depreciation. The equation for the cost recovery rate for a specific passenger group is as follows:
N i = 1 n f j 1 n c j
where Ni is the cost recovery rate of group i, n is the number of riders in group i, fj is the fare paid by passenger j, i is the passengers group that is defined basing on passengers’ features (e.g., travel distance, boarding time, and age), and cj is the operating cost passenger j should bear. The equation for calculating cj is as follows:
c j = l j × c i 1 n l j
where lj is the travel distance of passenger j. i 1 n l j is the travel distance of all passengers, and c i 1 n l j represents the operating cost incurred by a bus company per km. The equation is used to calculate the number of cj.
In this paper, we employ the value of the total cost recovery rate (N) as a reference, calculate the cost recovery rates (Ni) of different passenger groups for specific factors (i), and compare them with N. If Ni for group i is larger than N, we call the passengers in this group the subsidizers. Otherwise if Ni is smaller than N, we call the passengers the subsidizees. The part Ni − N from the subsidizers is used to aid the subsidizees to make their cost recovery rate reach N. We use the absolute value of the difference between the maximum and minimum value of Ni for each factor to determine the importance of the factor, which is denoted by |Ni|. If the value of |Ni| for a passenger group characterized by a specific factor is large, it indicates that this factor plays a significant role; otherwise it will have very little influence on fare equity, and the specific factor can be negligible when we establish evaluation metrics. The |Ni| values calculated for different factors using the Suzhou bus route 204 dataset are shown in Table 1.
According to Table 1, the influence of the factors on fare fairness decreases steeply in such an order—distance, time, age, sex, income, education and occupation. The most important determinant is distance, which is 26 times the importance of the least important factor—profession and 3 times the importance of the time factor. Since the |Ni| values of distance and time are much larger than other |Ni| values, we will only use distance and time factors to construct evaluation metrics.

2.3. Establishing Evaluation Metrics for Fare Equity

2.3.1. Metrics Based on Resource Equity

(1) Vehicle service coefficient during peak hours

Vehicle service coefficient during peak hours (Dp) is the ratio of the number of stations served by public transit vehicles per hour during peak periods to that during off-peak hours. This index can be used to explain the distribution of public transportation service during peak and off-peak hours. It can be expressed as:
D p = V ¯ p V ¯ op
where V ¯ p is the number of bus stations served per hour during peak hours, and V ¯ op the number of stations served per hour during off-peak hours. When Dp is larger than 1, the bus service efficiency during peak hours is better than that during off-peak hours. In this case, travelers get some opportunities to use public transit during peak hours. When Dp is no larger than 1, the bus service efficiency during peak periods will be no better than that during off-peak periods.

(2) Peak-hour passenger turnover rate

Passenger turnover rate during peak hours (Q) is the ratio of the average trip distance during peak hours to that during off-peak hours. It can be used to measure the passengers’ travel opportunities using public transit. Its equation is defined as follows:
Q = Q ¯ op Q ¯ p
where Q ¯ p is the peak-hour average trip distance, and Q ¯ op is the average trip distance during off-peak hours. When Q is larger than 1, transit riders will have a better chance of using public transit during rush hours with the increase of Q, while when Q is smaller than or equal to 1, the difficulty for passengers to ride the bus will increase with the decrease of Q.

2.3.2. Metrics Based on Cost Equity

(1) Gini Coefficient

Gini coefficient can reflect the equity of the FPUD for travelers with different travel distances.
The horizontal axis in Figure 5 shows the cumulative percentage of passengers with different trip distances. All the trip distances for one bus route are ranked in an ascending order and are equally divided into five groups, with each group containing twenty percent of all the trips. The vertical axis represents the ratio of the FPUD of each group (the mean FPUD of all the passengers in each group) to that of all the trips. The curve between O and D is the Lorenz Curve, which reflects the equity regarding the FPUD for passengers with different trip distances. A straight line represents absolute fairness, with all passengers paying the same FPUD. The ratio of the area of A and the area of (A + B) is the Gini coefficient (G) of average FPUD.
By performing an integral computation to calculate the area surrounded by Lorenz curve based on the definition of definite integral, we get the formula of Gini coefficient [26]:
G = 1 1 n ( 2 i = 1 n 1 w i + 1 )
where wi is the cumulative percentage of FPUD of group i, which is the sum of all FPUDs from group 1 to group i (passengers are grouped based on their travel distances).
The value of G can range from 0 to 1. A smaller G value indicates a more equitable distribution of FPUD. When G is close to 1, it denotes that the distribution of FPUD is very concentrated, which means significant inequity. Combined with international evaluation standards for the Gini coefficient and the status of fare equity, fare equity can be divided into five categories based on the value of the Gini coefficient: [0–0.2) means highly equitable; [0.2–0.3) is relatively equitable; [0.3–0.4) is equitable; [0.4–0.5) is relatively inequitable; and [0.5–1.0) means highly inequitable.

(2) Price Inflation

CPI (consumer price index) is an index used to reflect the changes in the price level of some specific goods and services purchased by households. This index has been widely used to measure inflation by the government. Specifically, CPI can be calculated using the following formula:
CPI = ( updated cost base period cost ) × 100
where updated cost refers to current cost of a specific kind of good or service, while base period cost refers to the cost during a certain year in the past. For example, if we need to get the CPI of 2015 based on the cost in 2014, the value of 2015 is the numerator and the 2014 value is the denominator. The CPI of China always uses the cost value of last year as the “base period” value.
The definition of public transit consumer price index (PTCPI) is similar to CPI, and it reflects how much more money is paid today than in the past when passengers take a bus. This index can reflect the changes in price level of bus services. The calculation equation is as follows:
PTCPI = ( updated basic fare based period basic fare ) × 100
where updated basic fare refers to the current fare under the flat fare policy, and base period basic fare refers to the historic fare. Note that the fare in this equation is the base fare, and when a differentiated fare policy (e.g., fare based on distance or time) is adopted, passengers will all pay the base fare plus an additional amount that depends on distance.
Theoretically, PTCPI should be consistent with CPI in terms of trend. However, as the bus fare policies in China do not follow the free market rules, the trend of PTCPI differs significantly from that of CPI.
The ratio (T) of CPI to PTCPI is used to describe the impacts of fare changes on public transport enterprises, and the equation is as follows:
T   =   ( CPI 100 ) ( PTCPI 100 )
When T is larger than 1, public transit companies will suffer more losses with the increase of T; when T is equal to 1, the trend of PTCPI is consistent with the CPI, and passengers and public transit companies will not be impacted; when T is smaller than 1, the losses will decrease with the decrease of T.

(3) Cross Subsidization Rate Based on Distance

When n is even,
C S L = i = 1 n / 2 | N L i N L ( n + 1 i ) | n / 2
When n is odd,
C S L = i = 1 ( n 1 ) / 2 | N L i N L ( n + 1 i ) | ( n 1 ) / 2
where CSL is the cross subsidization rate based on distance, and n is the number of classes based on passengers’ travel distances. In this work, we use 1 km as the interval to divide the passengers into different groups based on their trip distances, and N L i denotes the average cost recovery rate of group i, with the average cost recovery rates of all groups arranged in an ascending order.
The cross subsidization rate based on distance reflects the cross-subsidization interactions among different passengers grouped by different travel distances. The cross-subsidization phenomenon will become more significant with the increase of CSL. On the contrary, fairness will increase as the distribution of cost recovery rates of passengers with different travel distances becomes more even.

(4) Cross Subsidization Rate Based on Time

When n is an even number,
C S T = i = 1 n / 2 | N T i N T ( n + 1 i ) | n / 2
When n is odd,
C S T = i = 1 ( n 1 ) / 2 | N T i N T ( n + 1 i ) | ( n 1 ) / 2
where CST is the cross-subsidization rate based on time, and n is the total number of classes based on passengers’ boarding times. 1 hour is used as the time interval to divide the passengers into different groups, and NTi is the average cost recovery rate of group i, with the average cost recovery rates of all groups in an ascending order.
Cross-subsidization rate based on time can reflect the cross-subsidization levels among passengers with different boarding times. The inequity with regard to cross-subsidization will become more evident with the increase of CST, and the system will become fairer when the distribution of cost recovery rates for passengers with different boarding times becomes more even. Finally, the evaluation system based on the above-mentioned metrics is shown in Figure 6.

3. Case Study

Suzhou bus route 204, which uses a flat fare, is used in the case study to validate the proposed evaluation system as well as the metrics.

3.1. Data Source and Extracted Information

3.1.1. Data Source

The data used include the passengers’ IC card data and the GPS data of route 204 on 4 November 2013. Moreover, the 2013 yearbook data of Suzhou, the website of the Suzhou public transit agency, and Google Map were also used. The record of a passenger’s trip is composed of the following six fields: record ID, card ID, card type, date and time, vehicle ID, and route ID, as shown in Table 2.
The IC card data are a series of records that include the following fields: route name, vehicle ID, arrival time (for each stop), departure time, stop name, and stop ID, as shown in Table 3.

3.1.2. Extracted Information

Based on the proposed evaluation method, the information needed for the case study includes: Passenger flow volume, passengers’ origin-destination (OD), trip departure time, route information (route length, number of stops, distance between adjacent stops, and hours), operating costs (fuel prices and drivers’ salaries in 2013), bus fare and the CPI of Suzhou in 2013. The extracted information is shown in Table 4, Table 5 and Table 6.
Specifically, the passenger flow volume was extracted from the IC card data using statistical analysis. The 2013 CPI in Suzhou was from the 2013 Suzhou statistical yearbook. Route length, number of stops, hours, and bus fare were from the website of the Suzhou public transit agency. The distances between adjacent stops were measured using Google Map, and the drivers’ salaries and fuel prices were from the Suzhou City Limited Company.
The passenger OD information was extracted as follows. First, the arrival time data of the vehicles for the stops were used to match a passenger’s IC card data to get the starting stop of the trip. Similarly, the next IC card record can be used to obtain the destination stop of the trip [27]. Then the travel distance and FPUD were derived based on the extracted trips. Table 6 shows some example trips extracted using this method.

3.2. The Evaluation of Flat Fare Equity

The proposed metrics shown in Table 7 were calculated using the information in Table 4, Table 5 and Table 6 and the Equations (3)–(12).
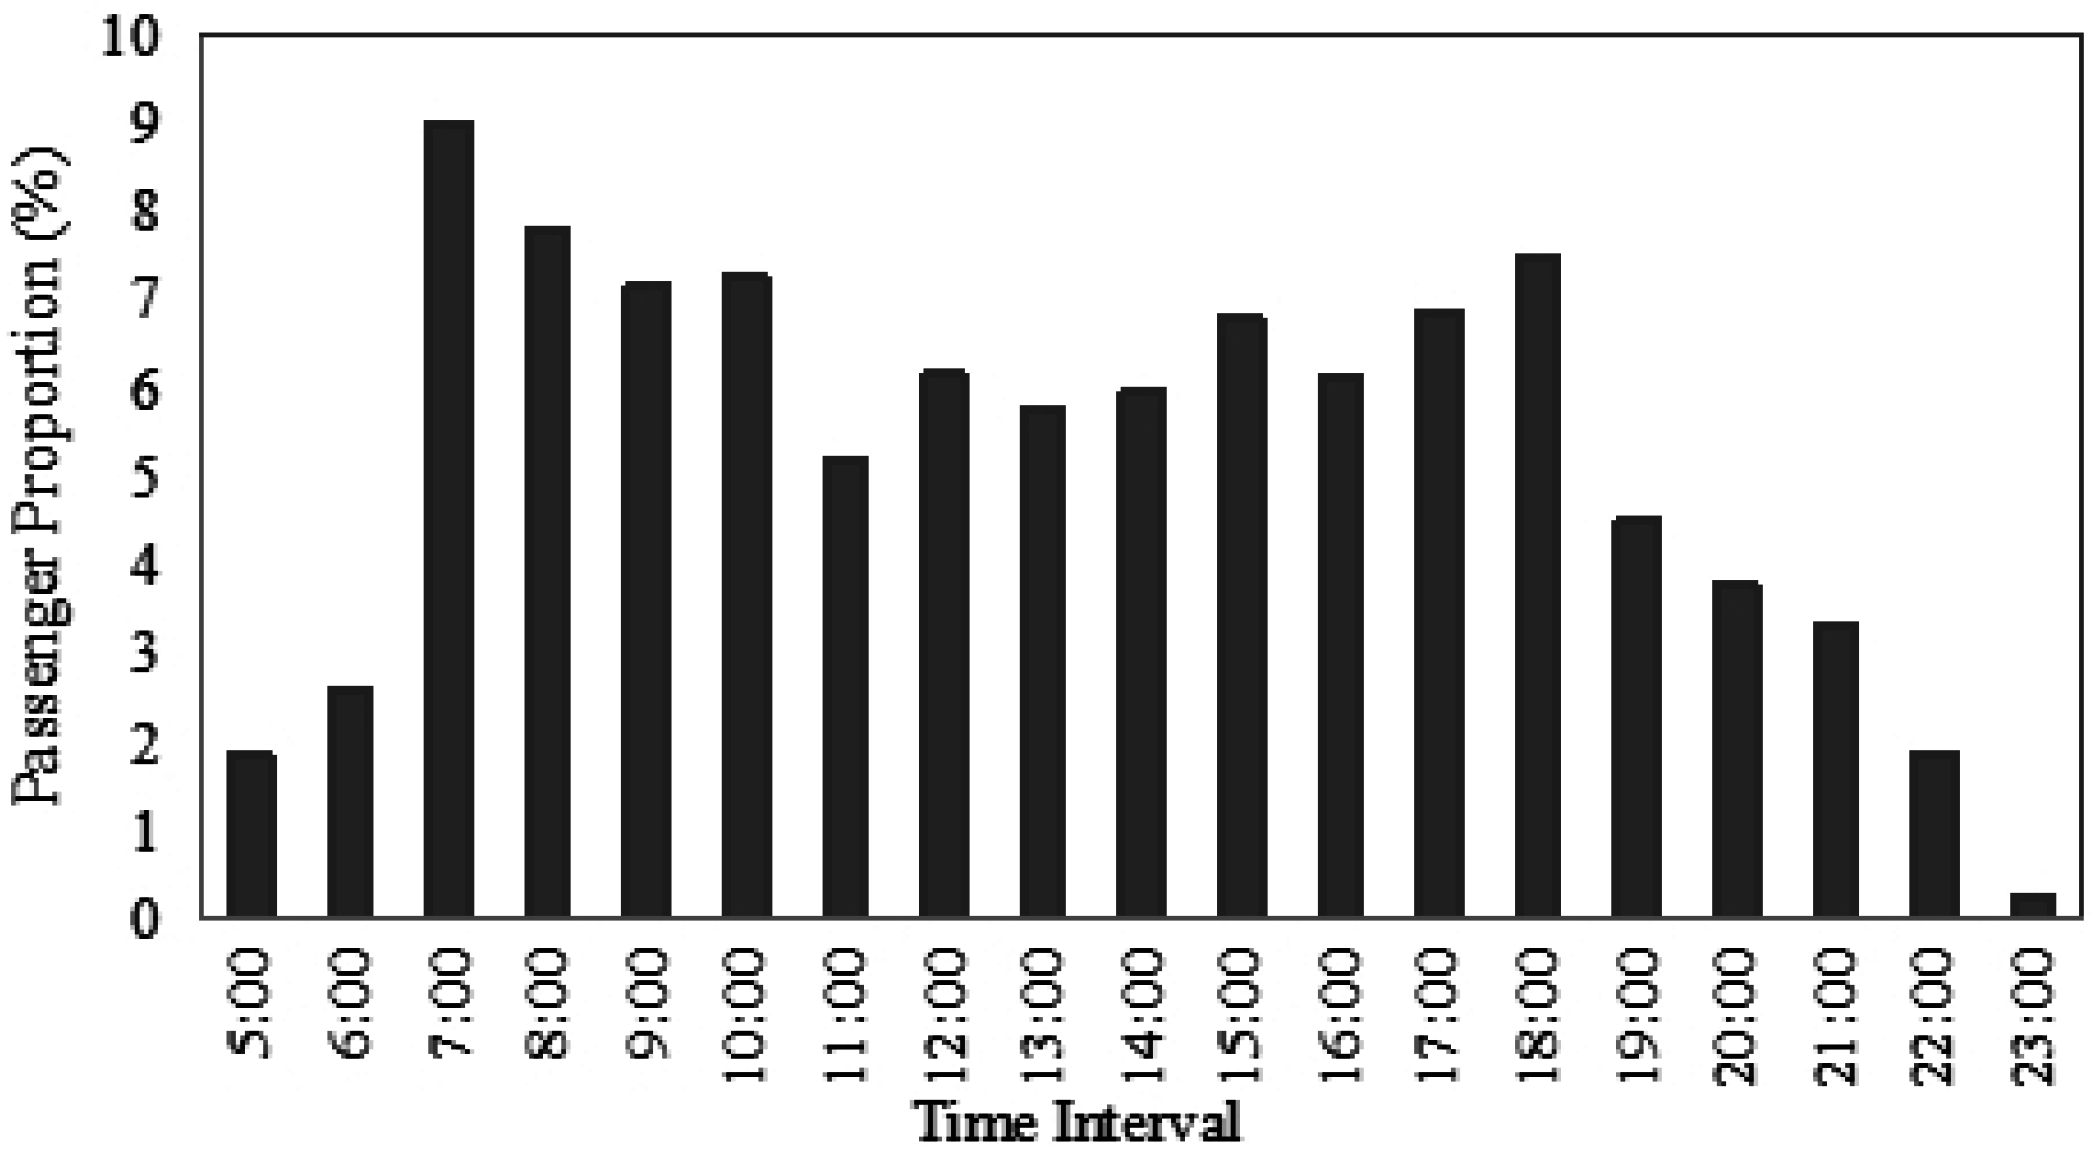
The number of passengers per hour is 485 during rush hours, and it decreases to 256 in off-peak hours. In addition, the difference will be much greater when the number of passengers that are forced to change to other traffic modes is taken into account. Note that the value of Dp is 1.15, which means the peak-time service efficiency is only 15% more than that during off-peak time periods. The result shows that the service is far from meeting the travel demand during peak hours.
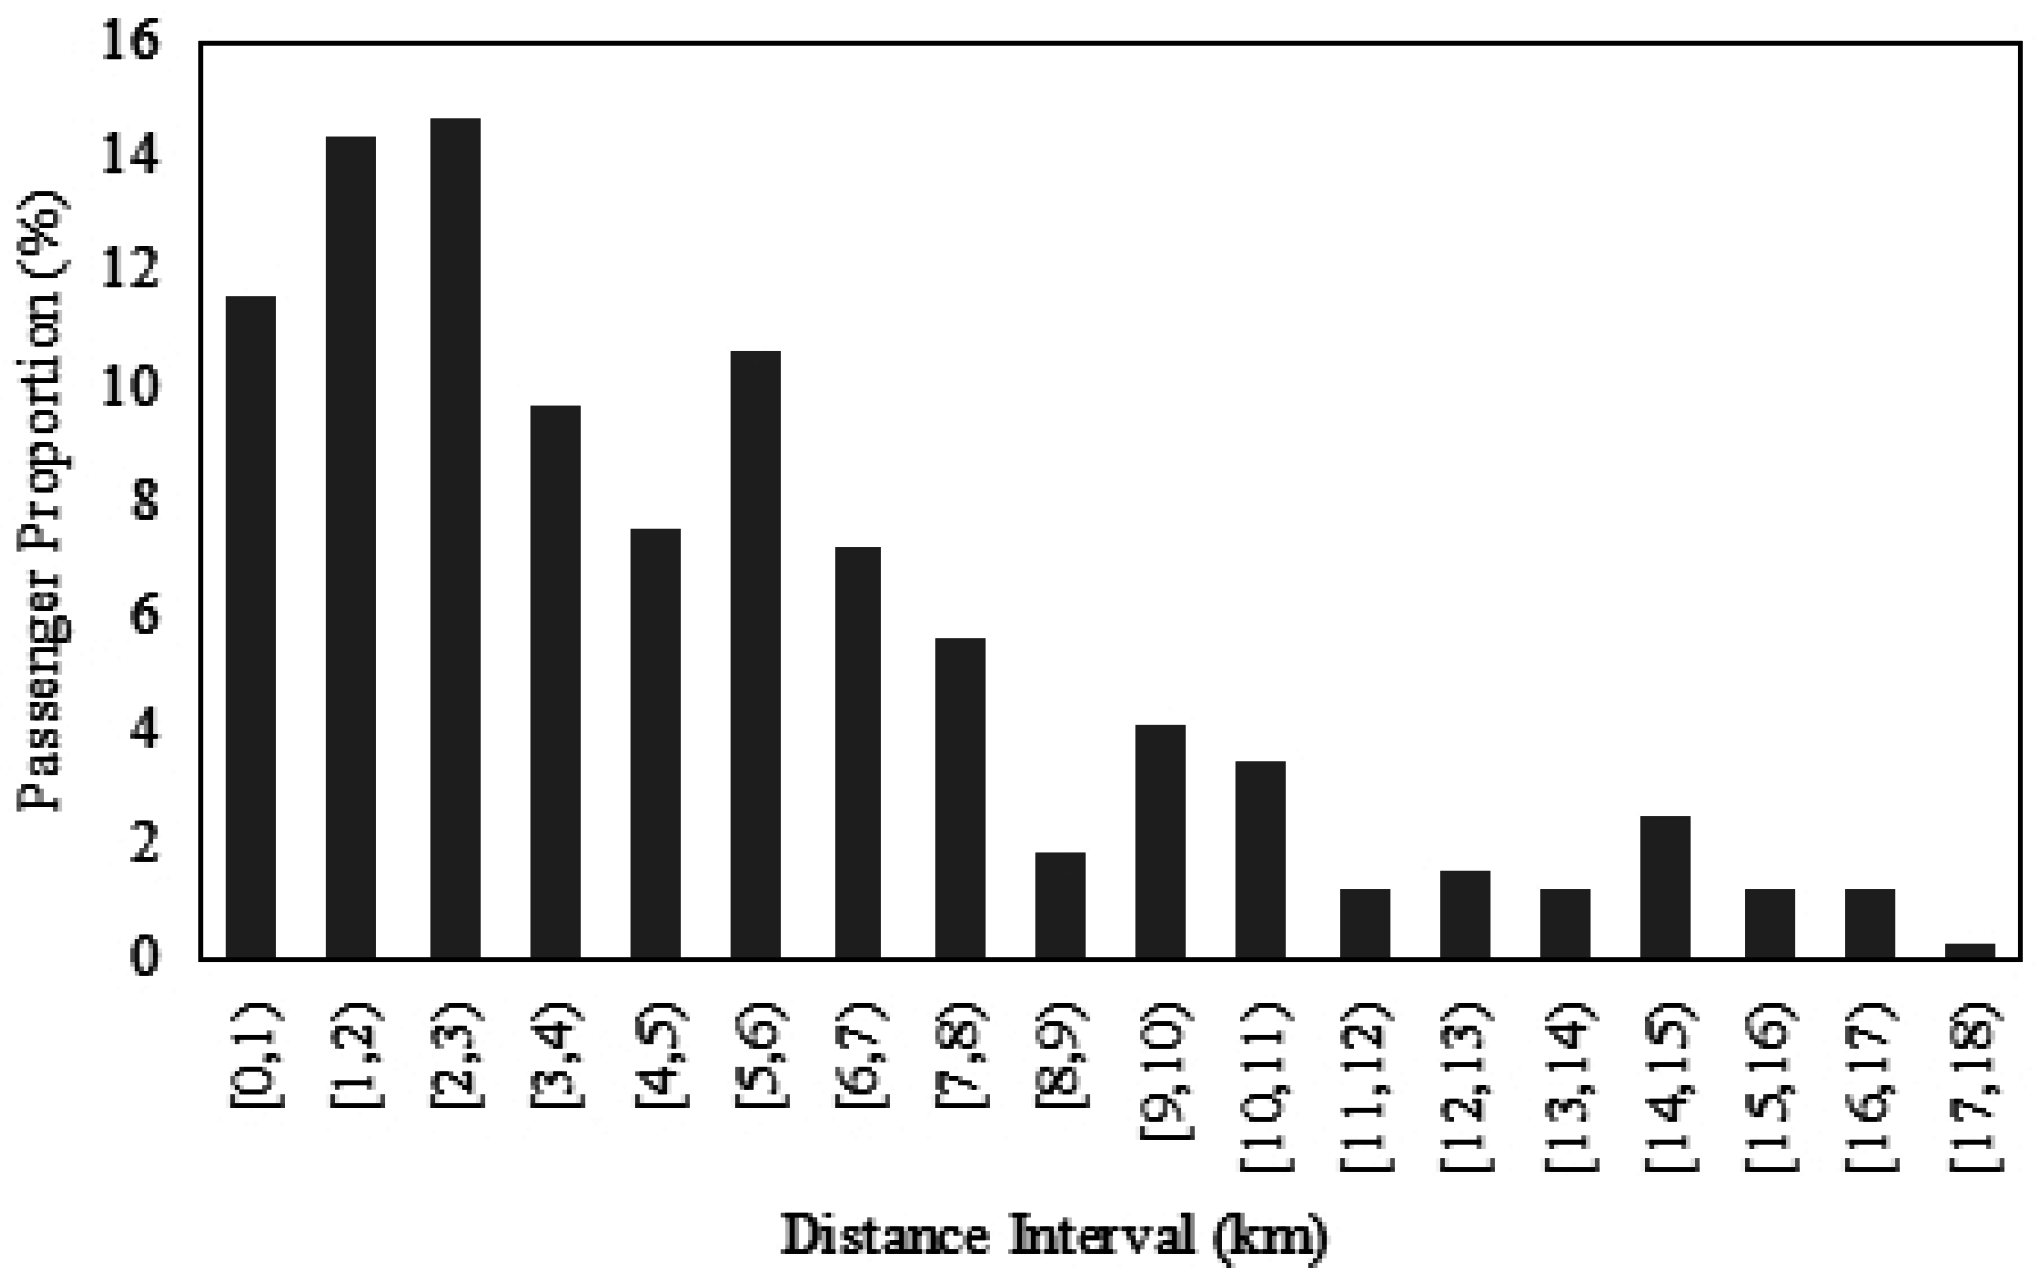
The number of passengers served by the route during peak hours is 605, while the number during off-peak hours is 280. From the perspective of resource equity, the number of passengers served during peak hours is double that during off-peak hours, which indicates that the peak-hour travel demand is more than two times that during off-peak hours. Since Q is 1.33, the passenger turnover rate in off-peak hours is 1.33 times that during peak hours. However, the peak-hour passenger flow is 2.17 times that during off-peak hours. Larger passenger flow and lower passenger turnover rate during peak hours indicate that the number of long-distance bus riders during peak hours is significantly larger than during off-peak hours, which will impact passengers’ travel opportunities and experience during peak hours.
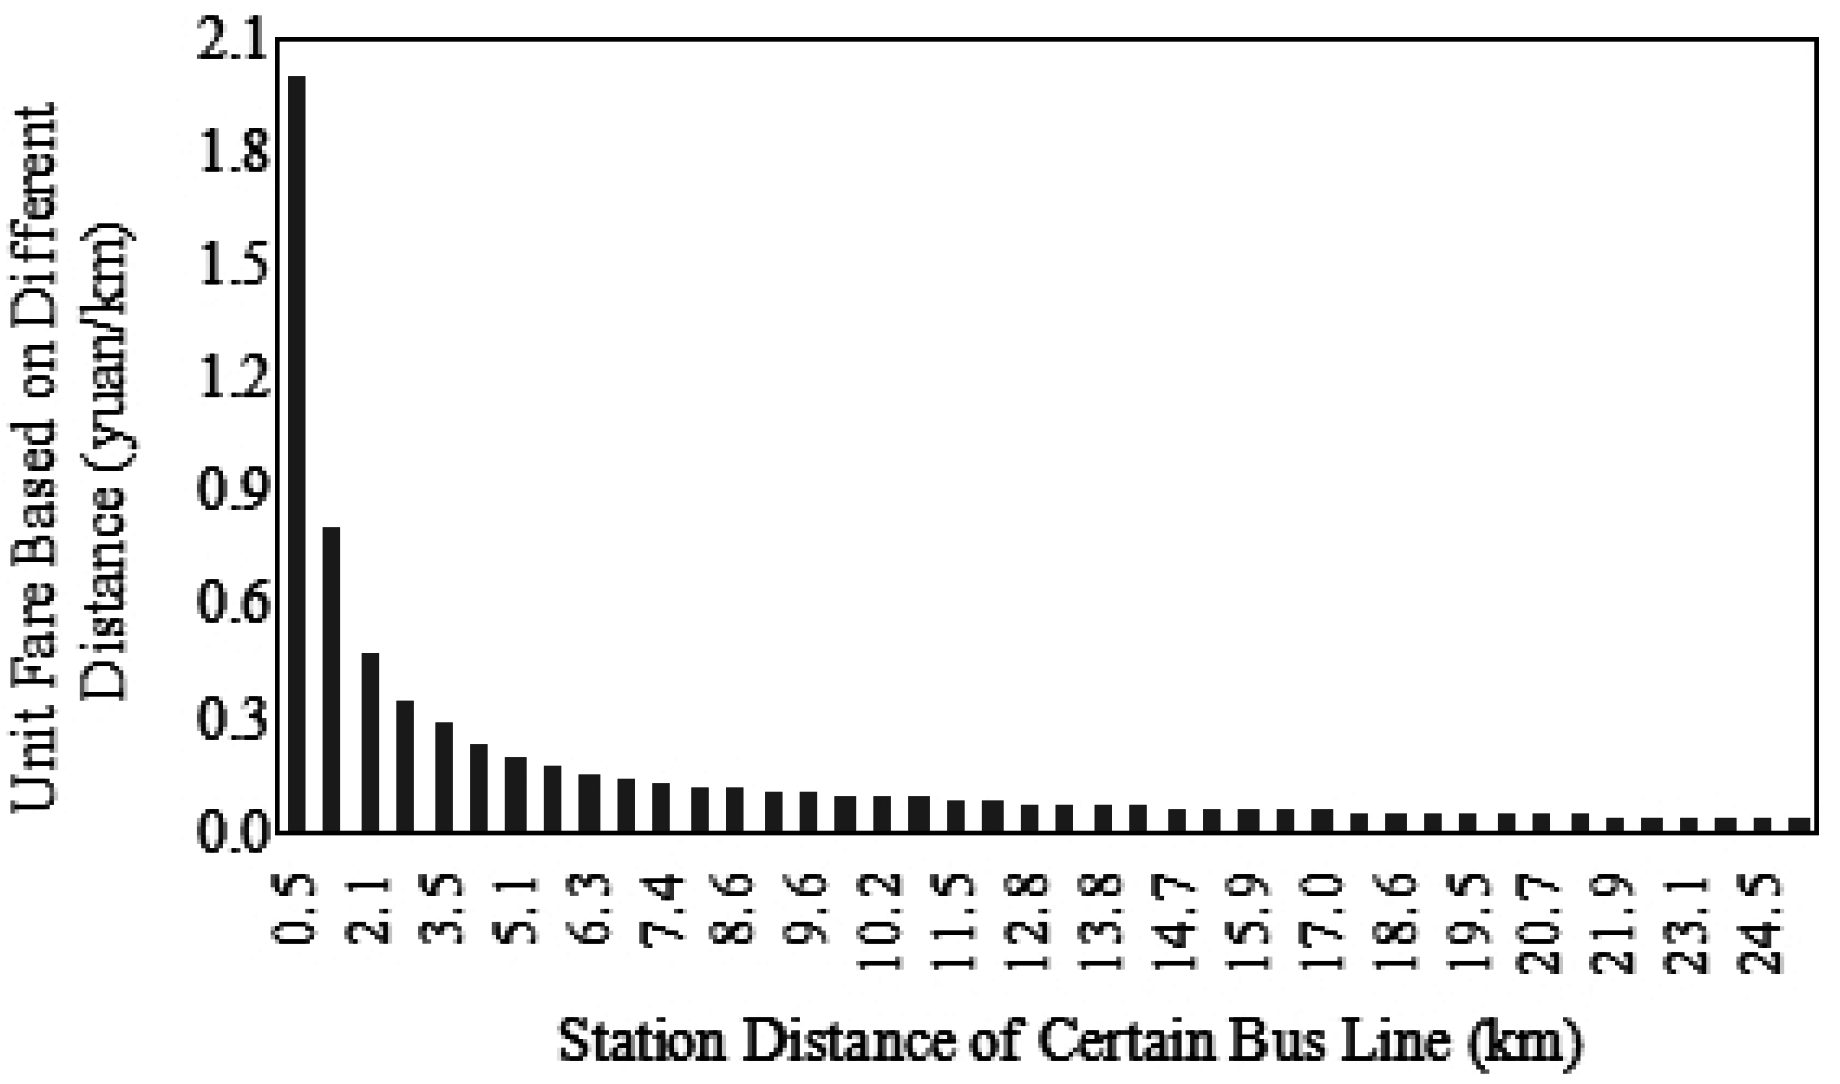
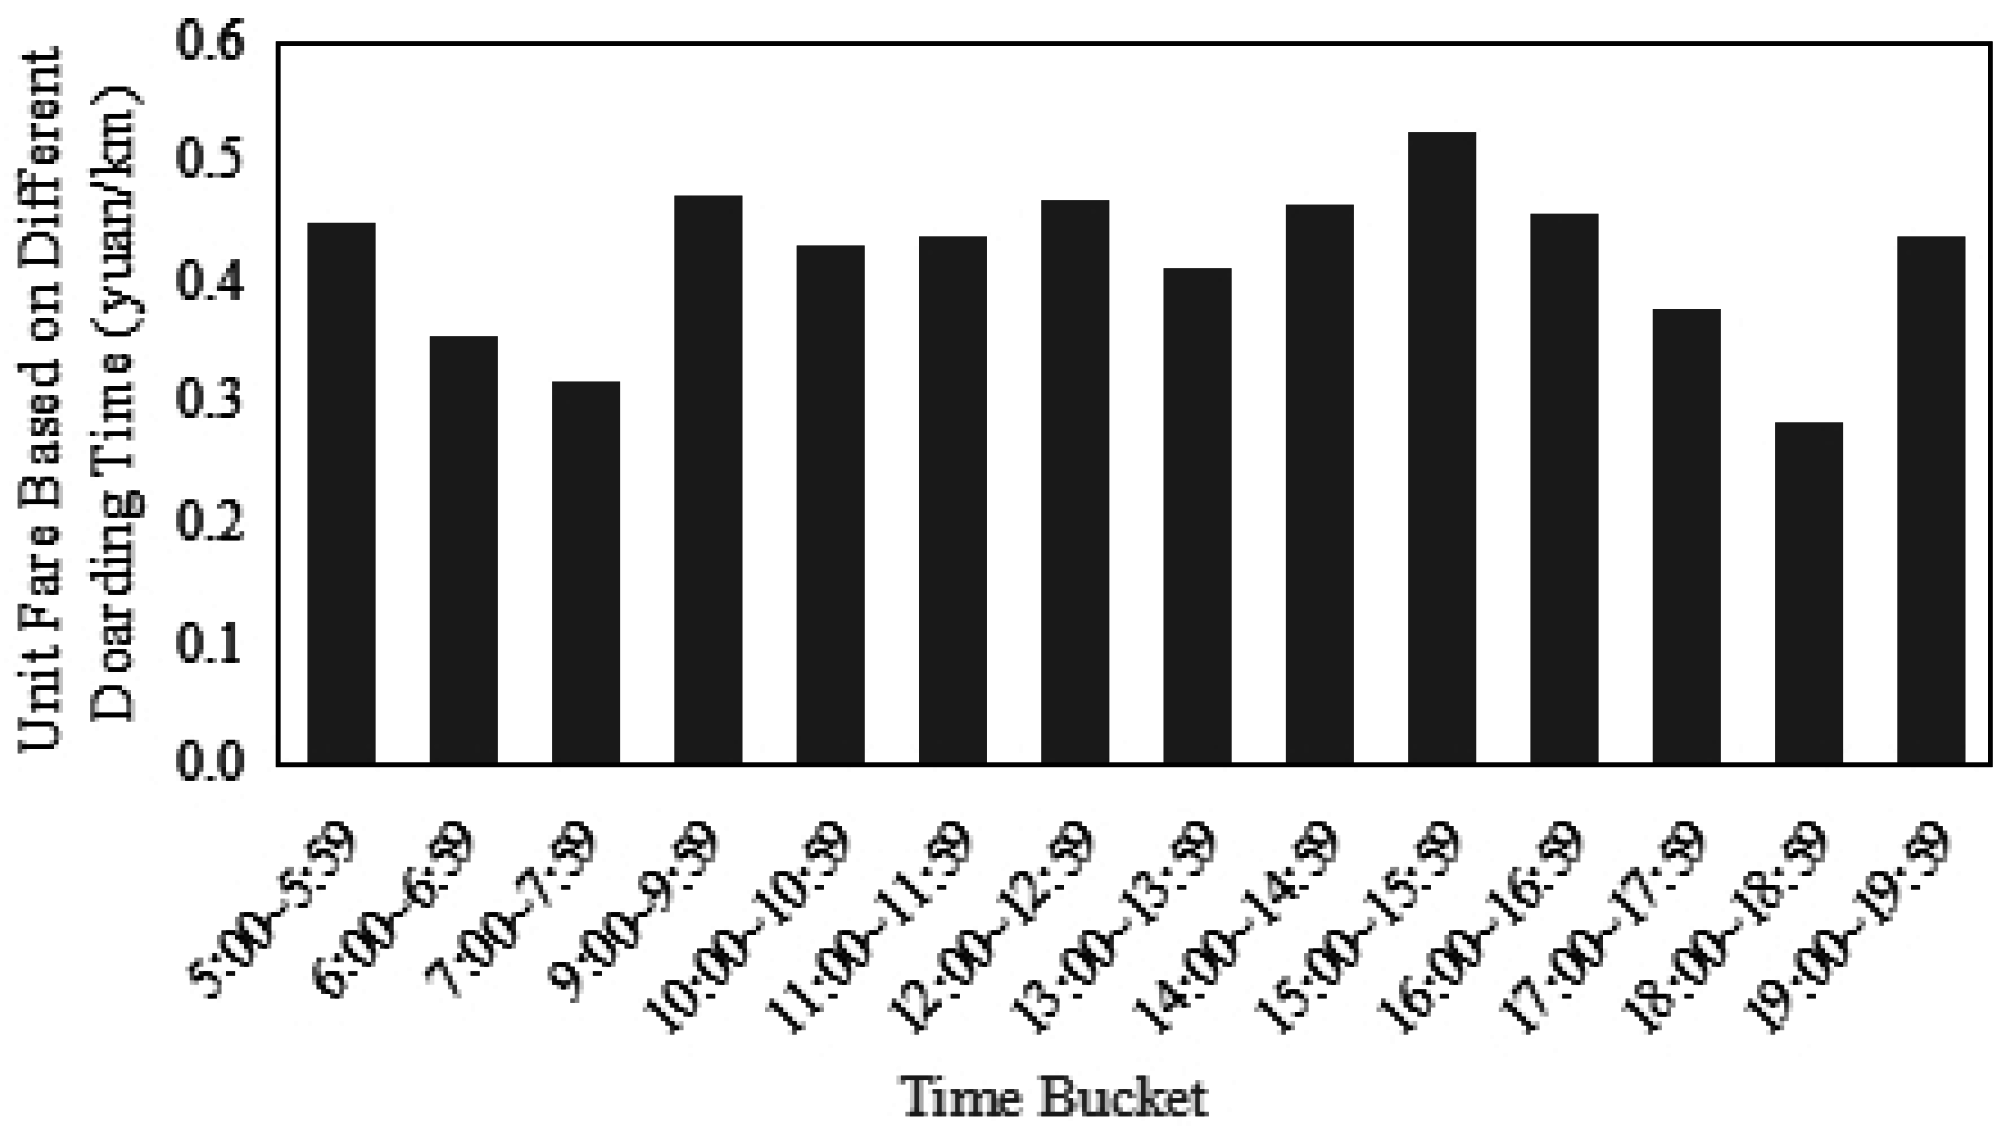
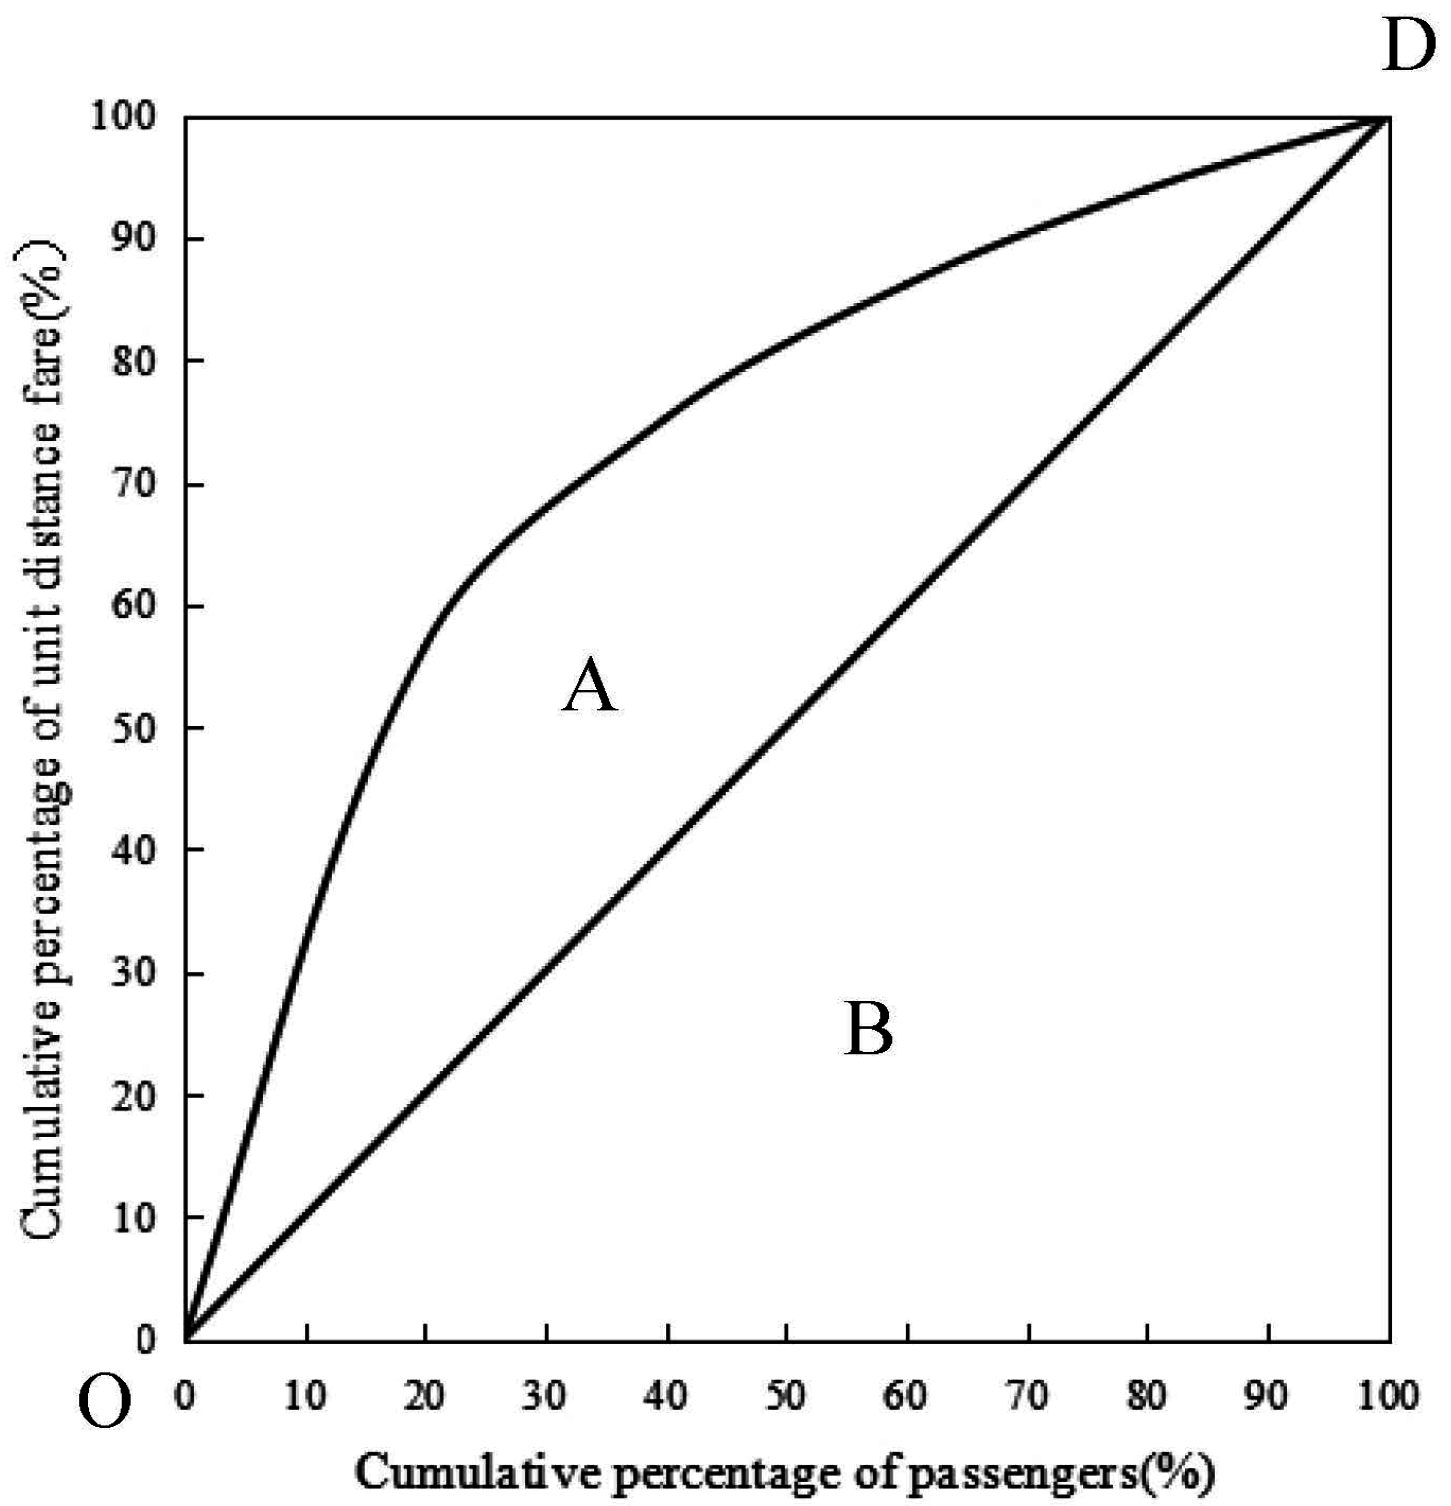
From the perspective of cost equity, the Gini coefficient is 0.4 and falls into the relatively unfair group, which indicates that the flat fare is unfair to passengers with different travel distances. The price inflation index indicates that the CPI is 2.1 times as large as the PTCPI, which means that the fare is far lower than the operating costs a passenger should bear and it is difficult for the public transit companies to cover the operating costs via fare, not to mention creating benefits. The distance-based cross subsidization rate indicates that cross subsidization among passengers with different travel distances is evident and the fare policy is significantly unfair to these passengers. The time-based cross subsidization rate means that the cross subsidization among passengers with different boarding times is not significant and the fare is equitable for passengers traveling during both peak and off-peak hours.

4. Conclusions

This work proposes an evaluation method suitable for the public transit systems in China. The results generated using the proposed metrics in the case study show that the proposed metrics could be used to evaluate bus fare equity objectively and quantitatively. The contributions of this paper are summarized as follows
(1)
A new quantitative method, based on the total average cost recovery rate and the average cost recovery rate of different groups, is presented to determine the influence of different factors. The method can be used to choose the most relevant factors for public transit fare equity.
(2)
The peak-hour vehicle service coefficient objectively reflects the difference in vehicle distribution during peak and off-peak hours.
(3)
Peak-hour passenger turnover rate reflects the variability in travel opportunities during peak and off-peak hours.
(4)
The Gini coefficient can objectively reflect the difference in FPUD among passengers with different travel distances.
(5)
The price inflation rates based on CPI and TCPI can reflect the difference between the revenue of public transit companies and socio-economic development levels.
(6)
Distance-based and time-based cross subsidization rates reflect the differences in cross subsidization among passengers with different travel distances and boarding times.
This study is a preliminary attempt to establish methods for evaluating bus fare equity in China. The work will make a contribution to establishing evaluation systems for bus fare equity in China and other similar developing countries. The proposed evaluation metrics can be extended by taking passengers’ age, income level, occupation, resident place and car ownership into account during the construction of the evaluation metrics. In addition, passenger subjective satisfaction may also be added to the evaluation metrics.
One limitation of the case study is that only one day’s data were used to demonstrate the feasibility of the proposed method. Future studies could incorporate more data (e.g., data on both weekdays and weekends) and apply the proposed method to further examine the temporal dimension of public transit equity. Moreover, with the popularity of the use of IC card in China’s public transit systems, further research could also be conducted to examine whether we could employ bus IC card data to estimate crowdedness, which is more computationally intensive but may serve as a more direct metric for the degree of crowding aboard buses than passenger turnover rates.

Acknowledgments

The authors thank the Department of Transportation of Suzhou, China for providing the required data for this research.

Author Contributions

Shaowu Cheng and Qian Gao conceived and designed the experiments; Qian Gao performed the experiments; Shaowu Cheng and Qian Gao analyzed the data; Yaping Zhang contributed some idea for this research; Shaowu Cheng and Qian Gao wrote the paper.

Conflicts of Interest

The authors declare no conflict of interest.

References

  1. Garrett, M.; Taylor, B. Reconsidering Social Equity in Public Transit. Berkeley Plan. J. 1999, 1, 6–27. [Google Scholar]
  2. Martens, K. Justice in Transport as Justice to Access, Applying Walzer’s “Spheres of Justice” to the Transport Sector. Transportation 2012, 6, 1035–1053. [Google Scholar] [CrossRef]
  3. Fang, C.; Xiaofeng, J.; Hongda, Z. Progress and Prospect of Transportation Equity in Urbanization Process. Hum. Geogr. 2014, 6, 10–17. (In Chinese) [Google Scholar]
  4. Thomopoulos, N.; Grant-Muller, S.; Tight, M.R. Incorporating Equity Considerations in Transport Infrastructure Evaluation: Current Practice and a Proposed Methodology. Eval. Program Plan. 2009, 4, 351–359. [Google Scholar] [CrossRef] [PubMed]
  5. Zhang, G.-Q.; Jian, L.U.; Xiang, Q.J. Network Design Problem Based on Equity and Priority. J. Transp. Syst. Eng. Inf. Technol. 2008, 5, 77–82. [Google Scholar]
  6. Glaister, S. Public Transport: The Allocation of Urban Public Transport Su bsidy. In Cost-Benefit Analysis, 2nd ed.; Layard, R., Glaister, S., Eds.; Cambridge University Press: Cambridge, UK, 1994; pp. 418–427. [Google Scholar]
  7. Litman, T.; Brenman, M. A New Social Equity Agenda for Sustainable Transportation. Available online: http://www.vtpi.org/equityagenda.pdf (accessed on 8 March 2012).
  8. Zhenggang, L.; Lili, W.; Wanxin, H.; Yulu, L. Study on Equity Impact of Congestion Charges Considering Transfer and Parking Conditions. J. Transp. Eng. Inf. 2014, 2, 108–113. (In Chinese) [Google Scholar]
  9. Langmyhr, T. Managing Equity: The Case of Road Pricing. Transp. Policy 1997, 1, 25–39. [Google Scholar] [CrossRef]
  10. Sanchez, T.W.; Brenman, M. Disability, Aging, and Transportation Equity. In The Right to Transportation: Moving to Equity; Sanchez, T.W., Brenman, M., Ma, J.S., Stolz, R., Eds.; APA Planners Press: Chicago, IL, USA, 2007; pp. 113–130. [Google Scholar]
  11. Hossein, H.; Vaziri, M. Urban Sustainable Transportation Indicators for Global Comparison. Ecol. Indic. 2012, 1, 115–121. [Google Scholar]
  12. Lai, W.T.; Chen, C.F. Behavioral Intentions of Public Transit Passengers—The Roles of Service Quality, Perceived Value, Satisfaction and Involvement. Transp. Policy 2011, 2, 318–325. [Google Scholar] [CrossRef]
  13. Luhrsen, K.F.; Taylor, B.D. The High Cost of Flat Fares: An Examination of Ridership Demographics and Fare Policy at the Los Angeles MTA; University of California Transportation Center: Berkeley, CA, USA, 1997; Available online: http://escholarship.org/uc/item/2rw9015m (accessed on 1 August 1997).
  14. Chen, A.; Yang, C. Stochastic Transportation Network Design Problem with Spatial Equity Constraint. Transportation Research Record. J. Transp. Res. Board 2004, 1, 97–104. [Google Scholar] [CrossRef]
  15. Bröcker, J.; Korzhenevych, A.; Schürmann, C. Assessing Spatial Equity and Efficiency Impacts of Transport Infrastructure Projects. Transp. Res. Part B Methodol. 2010, 7, 795–811. [Google Scholar] [CrossRef]
  16. Tilahun, N.; Fan, Y. Transit and Job Accessibility, an Empirical Study of Access to Competitive Clusters and Regional Growth Strategies for Enhancing Transit Accessibility. Transp. Policy 2014, 33, 17–25. [Google Scholar] [CrossRef]
  17. Litman, T. Developing Indicators for Comprehensive and Sustainable Transport Planning; Victoria Transport Policy Institute: Victoria, BC, Canada, 2011; Available online: http://www.vtpi.org/sus_tran_ind.pdf (accessed on 4 February 2011).
  18. Nuworsoo, C.; Golub, A.; Deakin, E. Analyzing Equity Impacts of Transit Fare Changes: Case Study of Alameda–Contra Costa Transit, California. Eval. Program Plan. 2009, 4, 360–368. [Google Scholar] [CrossRef] [PubMed]
  19. Maolin, W.; Kai, C. Quantitative Evaluation Method of Traffic Fairness Based on Gini Coefficient. J. Technol. Econ. Areas Commun. 2011, 1, 86–89. (In Chinese) [Google Scholar]
  20. Litman, T. Evaluating Transportation Equity: Guidance for Incorporating Distributional Impacts in Transportation Planning; Victoria Transport Policy Institute: Victoria, BC, Canada, 2016; Available online: http://www.vtpi.org/equity.pdf (accessed on 12 September 2016).
  21. Jing, S.; Lang, Y.; Qian, H. Evaluate and Model the Transportation Equity from Different Aspects. J. Railw. Eng. Soc. 2009, 1, 97–101. (In Chinese) [Google Scholar]
  22. Taylor, B.D.; Norton, A.T. Paying for Transportation: What’s A Fair Price? J. Plan. Lit. 2009, 1, 22–36. [Google Scholar] [CrossRef]
  23. Cervero, R. Flat Versus Differentiated Transit Pricing: What’s a Fair Fare? Transportation 1981, 3, 211–232. [Google Scholar] [CrossRef]
  24. Taylor, K.C.; Jones, E.C. Fair Fare Policies: Pricing Policies That Benefit Transit-Dependent Riders. In Community-Based Operations Research; Johnson, M.P., Ed.; Springer: New York, NY, USA, 2012; pp. 251–272. [Google Scholar]
  25. De Vasconcellos, E.A. Transport Metabolism, Social Diversity and Equity: The Case of São Paulo, Brazil. J. Transp. Geogr. 2005, 4, 329–339. [Google Scholar] [CrossRef]
  26. Jianhua, Z. An convenient method to calculate Gini coefficient. J. Shanxi Agric. Univ. (Soc. Sci. Ed.) 2007, 3, 275–283. (In Chinese) [Google Scholar]
  27. Wang, W.; Attanucci, J.P.; Wilson, N.H.M. Bus Passenger Origin-Destination Estimation and Related Analyses Using Automated Data Collection Systems. J. Public Transp. 2011, 4, 131–150. [Google Scholar] [CrossRef]
Figure 1. Unit fare for different travel distances.
Sustainability 08 01032 g001
Figure 2. Distribution of passengers for varying travel distances.
Sustainability 08 01032 g002
Figure 3. Distribution of passengers in different time periods.
Sustainability 08 01032 g003
Figure 4. The fare per unit distance (FPUD) in different time periods.
Sustainability 08 01032 g004
Figure 5. Lorenz curve of public transit fare.
Sustainability 08 01032 g005
Figure 6. The evaluation system for bus fare equity.
Sustainability 08 01032 g006
Table 1. |Ni| for different passenger groups.
NdistanceNtimeNageNsexNincomeNEB *NjobN
Nmax0.900.590.510.470.490.480.47——
Nmin0.130.310.420.390.430.440.45——
|Ni|0.770.280.090.080.060.040.030.454
* NEB refers to education background.
Table 2. Record structure of passengers’ trip data.
IDCard IDCard TypeDate and TimeVehicle IDRoute ID
121500001410029 E420131104090208 104021204
221500002625973 D420131104090658 104021204
321500002149306 E420131104090700 104021204
421500002639329 E620131104092149 104021204
662521500002695471 B420131104092204 104021204
662621500001174226 EA20131104092216 104021204
Table 3. Record structure of the GPS data.
Record IDRouteVehicle IDArrival TimeDeparture TimeStop NameStop ID
120410100120131104064534 20131104064632 Fengmen South18
220410100120131104092338 20131104092456 Fengmen South18
320410200420131104070728 20131104070809 Children’s Hospital28
420410200420131104100129 20131104100228 Children’s Hospital 28
248620410201720131104062951 20131104063011 Qunxing Road8
248720410201720131104090739 20131104090845 Qunxing Road8
Table 4. Summary of the information needed for bus fare equity evaluation.
Information
Passengers’ ODSee Table 6
Passenger flow (persons)6626peak hour (persons/h)605
off-peak hour (persons/h)280
CPI of Suzhou102.1
Route distance17.8 km
Number of stops31
Service time05:00~23:00
Peak hoursmorning 6:30~9:30; afternoon 16:00~19:00
Off-peak hoursAll other time periods
Bus fareRegular passenger: 1 yuan; air-conditioned bus: 2 RMB; with bus card: 40% discount
Distance between stopsSee Table 5
Drivers’ salary4000 RMB/month; 4 round trips/day, 34 RMB/round trip
Fuel pricesDiesel: 7.3 RMB/L; about 6.7 L diesel for 17.8 km
Table 5. Distance between two adjacent stops.
IDStop——StopDistance between Stops (m)IDStop——StopDistance between Stops (m)
1Dongfangdadaonanhuan Market-Dushucun22016Xiayuanxincun-Suzhou University East Campus520
2Dushucun-Tangnancun70017Suzhou University East Campus-Fengmeng South520
3Tangnancun-Tongda Road33018Fengmeng South-Fengmen500
4Tongda Road-Qunxingsan Road70019Fengmen-Suzhou Restaurant 640
5Qunxingsan Road-Qunxinger Road50020Suzhou Restaurant-Wangshiyuan North500
6Qunxinger Road-Qunxingyi Road40021Wangshiyuan North-Diyirenminyiyuan West660
7Qunxingyi Road-Qunxing Road50022Diyirenminyiyuan West-Shuangta530
8Qunxing Road-Qunli Road35023Shuangta-Cufangqiaoguanqianjie East620
9Qunli Road-Loufeng Street70024Cufangqiaoguanqianjie East-Shiliyiyuan East760
10Loufeng Street-Dushuyuan65025Shiliyiyuan East-Jiejiaqiao West860
11Dushuyuan-Baiyu Road66026Jiejiaqiao West-Songxianzhou Street600
12Baiyu Road-Sutong Road West62027Songxianzhou Street-Ertongyiyuan800
13Sutong Road West-Oulaiya63028Ertongyiyuan-Aiheqiao850
14Oulaiya-Oushang Supermarket28029Aiheqiao-Guangjiqiao630
15Oushang Supermarket-Xiayuanxincun34030Guangjiqiao-Shangtang Street600
Table 6. Relevant parameters for evaluation metrics.
No.OD *Distance (km)TimeUnit Price (Yuan/km)Unit Cost (Yuan/km)Cost Recovery RatioCPIOperating Cost per Kilometer Yuan/kmThe Mean Number of Vehicle Service Station
14~145.7111:220.11 0.82 0.13 102.14.66 peak hour (vehicle/h)
212~278.5818:100.07 0.54 0.13
35~208.5814:020.07 0.54 0.13
47~80.7613:030.79 6.13 0.13
513~287.8715:120.08 0.59 0.13 152
64~197.8720:230.08 0.59 0.13
712~235.7411:490.10 0.81 0.13 off-peak hour (vehicle/h)
66251~116.9110:160.09 0.67 0.13 132
662621~306.4216:560.09 0.73 0.13
* “4~14” means public station number.
Table 7. The values of the calculated evaluation metrics.
IndexDpQGTCSLCST
Value1.151.330.402.100.770.09

