Article

Forecasting Helianthus annuus Seed Quality Based on Soil Chemical Properties Using Radial Basis Function Neural Networks

College of Earth Sciences, Jilin University, Changchun 130061, China
*
Author to whom correspondence should be addressed.
Sustainability 2016, 8(10), 1055; https://doi.org/10.3390/su8101055
Submission received: 26 May 2016 / Revised: 21 September 2016 / Accepted: 26 September 2016 / Published: 20 October 2016
(This article belongs to the Special Issue Soil Science in Conservation Agricultural Systems)

Abstract

:
Forecasting crop chemical characteristics based on soil properties is not only a possible way to spare supplementary sampling and testing, but also a potential method of instructing cultivation planning based on regional soil surveys. In this paper, taking the data of regional agricultural geological survey on Helianthus annuus sources in the western part of the Jilin province as an attempt, radial basis function neural networks were used to forecast the quality indexes of Helianthus annuus seeds based on the non-linear relationship between soil and crop. The results indicate the following: (1) The mean relative errors of vitamin E, protein, fat, and TAA concentration forecasting neural networks are 2.63%, 2.19%, 2.19%, and 2.80%, respectively. The root mean square errors are 1.7 mg/100 g, 0.59%, 1.09%, and 0.77%. The forecasting radial basis function neural networks are of high prediction accuracy, which introduces an empirical case of forecasting the quality of crop based on a systematical soil environmental quality investigation along with a sampling survey of the crops. To set a proper model, interrelation between the selected indexes of input layer and output layer needs to be confirmed first, and a low setting of spread can improve the accuracy; (2) Soil in the studied area is under severe salinization, and concentrations of soil chemical properties mostly show an evident regional difference between the three experimental fields. However, the vitamin E, protein, and TAA concentrations of Helianthus annuus seeds all stabilize in a certain range despite the different soil environments. The mean fat concentration of Helianthus annuus seeds collected from Nongan and Daan exceeds those from Tongyu by approximately 5%, which shows a relatively evident regional difference.

1. Introduction

During the procedures of most regional agricultural geological surveys, usually, part of the soil or crop samples will be randomly tested to represent the chemical characteristics of the entire region—in particular for that crop. However, due to spatial heterogeneity [1], some local properties will be concealed, and this representation can be inaccurate. In addition, the follow-up research mostly requires a complete set of tested field data to be accomplished. Nevertheless, the supplementary sampling usually cannot coincide with the conditions of the original [2,3,4]. Thus, how to accurately forecast the untested crop data of a field survey based on the current available data has become an important issue.
The soil–plant system is a sophisticated combination of complex non-linear relationships between chemical characteristics of soil and plants [5]. Artificial neural networks are effective tools for stimulating such relationships [6]. A radial basis function neural network (RBFNN) is an artificial neural network with a simple structure and a fast learning speed, and it can approximate any continuous functions at any degree of accuracy [7,8]. On the other hand, soil chemical properties and the bio-available transformation of soil elements are the main indexes for representing soil fertility [9,10,11], and they have great impacts on crop yield and quality. This makes it possible to forecast crop quality based on soil chemical properties using RBFNN. Currently, a member of the research team has used a RBFNN to forecast the carbon, nitrogen, and phosphorus concentration of Leymus chinensis based on soil chemical properties [12].
The western part of the Jilin province is one of the main soil salinization regions in China with obvious grassland degradation and poor crop-planting conditions [13]. However, the strong hardiness to the severe environments of Helianthus annuus has enabled it to become a major cash crop in the region [14]. With the purpose of introducing an empirical case of forecasting the crop quality based on soil properties on the micro level, this paper takes the data of a regional agricultural geological survey on Helianthus annuus sources in the western part of Jilin as an attempt. The trained RBFNNs are applied to forecast the concentrations of vitamin E, protein, fat, and total amino acid (TAA) of the untested Helianthus annuus seeds. This suggests an empirical method of forecasting crop quality based on soil chemical properties using a RBFNN. Moreover, this attempt provides a potential mode for cultivation planning to reduce the waste of cultivated land resources and realize the sustainable use of cultivated land.

2. Materials and Methods
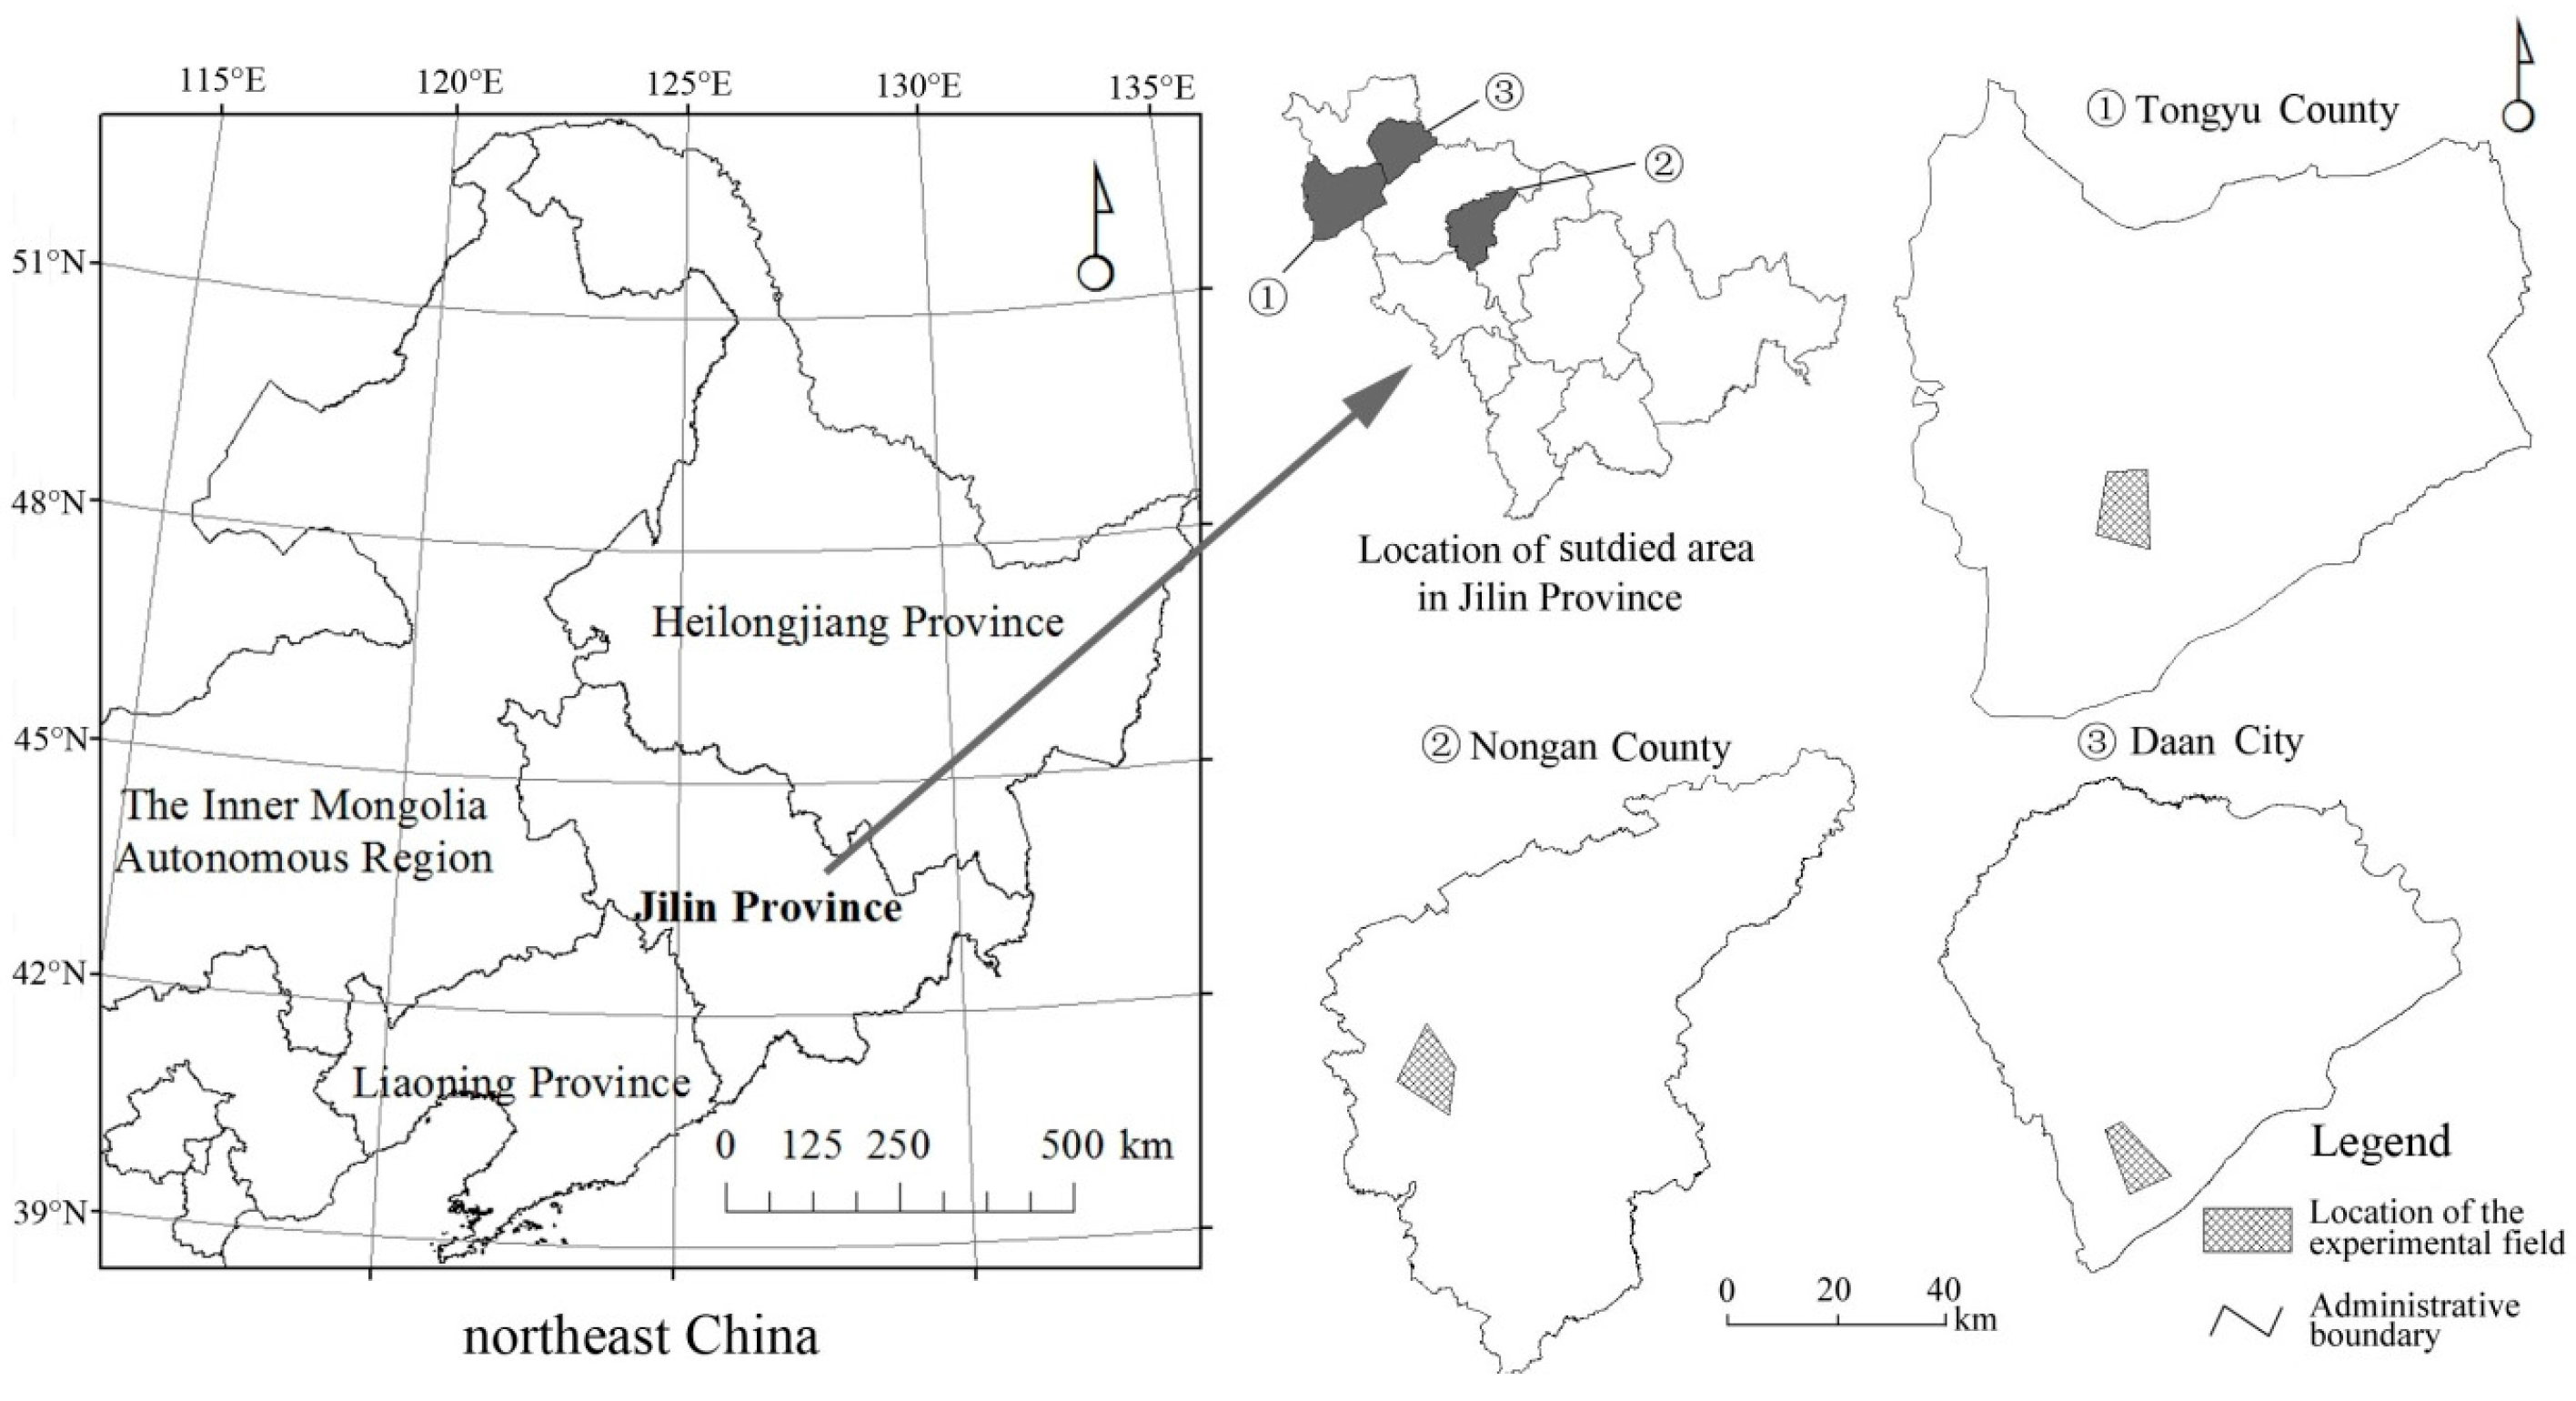
2.1. Study Area

Three experimental fields are located in Bajilei Town of Nongan County, Longzhao Town of Daan City and Zhanyu Town of Tongyu City in the western part of Jilin Province, respectively. This region is part of the Songliao Plain which is flat and under a typical middle temperate continental semi-arid monsoon climate. The annual average temperature is 4.4–4.7 degrees Celsius. The annual precipitation is 400–500 mm. The air relative humidity is 56%–64% in general. The study area is of high sunshine hours and sufficient heat which leads to the strong evaporation and concentration and high soil salinity. Soil type mainly consists of chernozem, light chernozem, salinized meadow soil, saline-alkali soil and aeolian sandy soil. Off-white calcareous sediments can be found under surface soil. Soil pH appears to be alkaline.

2.2. Sampling and Testing

According to the actual root length of Helianthus annuus, the sampling depth of soil is set to 60 cm. A total of 120 soil samples were collected from three experimental fields (Figure 1), 40 soil samples each. Soil samples were air-dried, ground, and passed through a 2-mm sieve prior to analysis. Helianthus annuus seeds sampling sites were in accordance with the soil sampling, seeds of 5–10 normal plants around the site were collected as one sample. The varieties of Helianthus annuus in three experimental fields are the same. A total of 120 Helianthus annuus seeds samples were collected from three experimental fields, 40 Helianthus annuus seeds samples each. All the soil and seeds samples were collected in October 2006.
In consideration of the availability of research data and indicator selection of an earlier study [12], soil pH, soil organic matter, soil hydrolytic nitrogen, soil Olsen-K and total concentration of soil Fe2O3, CaO, MgO, Na2O, Se, Mo, B were selected as the input indexes of the neural networks. Soil pH was tested via the glass electrode method. Total concentration of Fe, Ca, Mg, and Na were tested via X-ray fluorescence spectrometric method. Total concentration of Mo was tested via inductively coupled plasma mass spectrometric method. Total concentration of Se was tested via atomic fluorescence spectrometric method. Total concentration of B was tested via emission spectrometric method. Soil hydrolytic nitrogen concentration was tested via alkaline hydrolysis diffusion method. Soil Olsen-K concentration was tested via flame photometry. Vitamin E, total amino acid (TAA), protein and fat of Helianthus annuus seeds were selected as the output indexes of neural networks to represent the crop quality. Concentration of vitamin E and TAA were tested via liquid chromatography. Concentration of protein was tested via semi-micro Macro Kjeldahl method. Concentration of fat was tested via Soxhlet extraction.

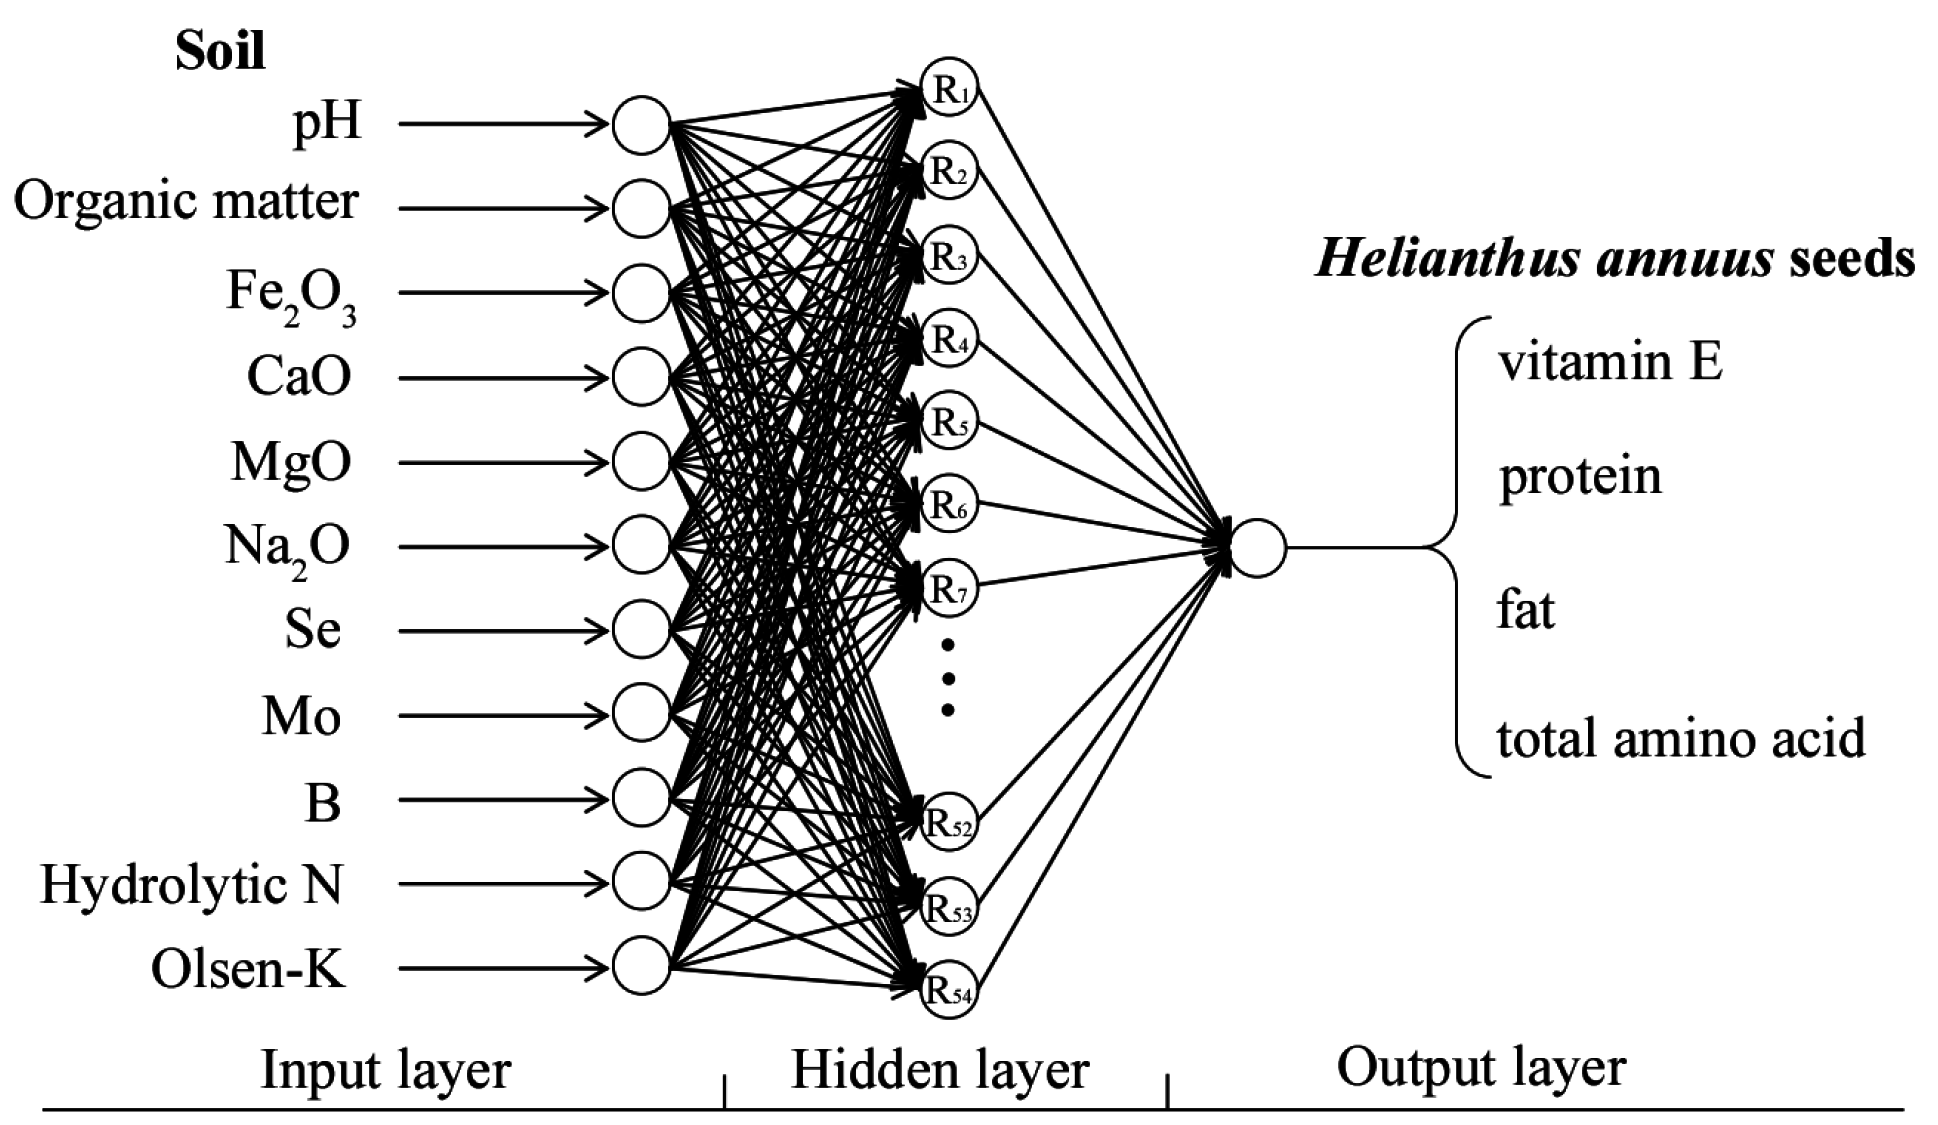
2.3. Radial Basis Function Neural Networks

Artificial neural networks are the crucial branch of artificial intellegence with wide application in many disciplinary fields. Radial basis function neural network (RBFNN) is a type of ANN which uses radial basis function as the activation function, it is used in prediction estimation, system control, etc. [15]. The actual topological structure of RBFNN is displayed in Figure 2.
RBFNN is the kind of feed-forward artificial neural network with three layers (Figure 2): the input layer, the hidden layer and the output layer [7,8,12]. The input layer is composed of signal source nodes and the input vector can be mapped into hidden space directly in a nonlinear form. In this paper, the input layer is composed of soil pH, soil organic matter, soil hydrolytic nitrogen, soil Olsen-K and total concentration of Fe2O3, CaO, MgO, Na2O, Se, Mo, B. The hidden layer is composed of hidden radial basis function units. The number of hidden units depends on the requirement of depicted issue, and the hidden layer converts the linearly inseparable issues in low-dimensional space to be linearly separable in high dimensional space by modeling the space of hidden layer with radial basis function units. The transfer function of hidden units is normally set to Gaussian function. Mapping from hidden layer to output layer is linear and thus it responses to the impact of input pattern, namely the linear weighted combination [16]. The output layer is composed of vitamin E, total amino acid (TAA), protein and fat of Helianthus annuus seeds. The mapping formula is:
y = f ( x ) = i = 1 m w i R i ( x ) = i = 1 m w i e x p ( x C i 2 / 2 σ 2 )
where x C i is Euclidean norm which denotes the actual distance from input vector (x) to the center of Gaussian function ( C i ); σ 2 is the variance of Gaussian Function; w i is the link weight between hidden layer and output layer; m is the number of hidden layer nodes; y is the actual output.

3. Results and Analysis

3.1. Training of Neural Networks

Concentrations of vitamin E, total amino acid (TAA), protein, and fat of Helianthus annuus seeds were forecasted based on 11 soil chemical indexes using a RBFNN. To avoid the impact of abnormal values and to accelerate the rate of convergence, mapminmax function was invoked to normalize the input value and reverse the normalization after the output. The newrb function in the Matlab neural network toolbox was invoked to build the RBFNN. When the simulation of the non-linear relationship begins, the number of neurons in the hidden layer increases automatically until the mean square error drops below the target value. The format of the newrb invocation is:
net = newrb(P, T, goal, spread, mn, df),
where P is the input vector; T is the output vector; and goal is the target mean square error, which is set to 10−8. spread is the expansion constant which represents the smoothness of the fitted curve. As the training of ANNs is mostly empirical [12,15], repeated modification of spread should be conducted during the training process for better simulation; mn is the upper limit number of neurons, which is set to 100; df is the displaying frequency of training process, which represents the number of neurons added between the two iterations, and it is set to 1. There are 60 groups of matched tested soil and Helianthus annuus seed data, and 20 groups in each experimental field. Fifty-five groups were selected randomly to train the neural networks, and the other 5 groups were used to validate the accuracy of the trained neural networks. The four parameter settings for forecasting RBFNNs of Helianthus annuus seed quality are as follows:
(1)
Parameters of vitamin E forecasting RBFNN:
goal is set to 10−8, spread is set to 0.0397, mn is set to 100, and df is set to 1. NA-1, DA-6, DA-27, TY-12, and TY-34 samples were selected as the validation groups, and the other 55 as the training groups.
(2)
Parameters of protein forecasting RBFNN:
goal is set to 10−8, spread is set to 0.0594, mn is set to 100, and df is set to 1. NA-15, NA-21, DA-27, TY-34, and TY-40 samples were selected as the validation groups, and the other 55 as the training groups.
(3)
Parameters of fat forecasting RBFNN:
goal is set to 10−8, spread is set to 0.0478, mn is set to 100, and df is set to 1. NA-11, DA-19, DA-30, TY-3, and TY-5 samples were selected as the validation groups, and the other 55 as the training groups.
(4)
Parameters of TAA forecasting RBFNN:
goal is set to 10−8, spread is set to 0.0593, mn is set to 100, and df is set to 1. NA-6, DA-23, DA-36, TY-22, and TY-24 samples were selected as the validation groups, and the other 55 as the training groups.
Root mean square error (RMSE) and mean relative error (MRE) were used to validate the accuracy of all forecasting RBFNNs [15,17,18] (Table 1).
R M S E = 1 n i = 1 n ( x i , f x i , m ) 2   M R E = 1 n i = 1 n | x i , f x i , m | x i , m × 100 % ,
where x i , f is the forecasted value; x i , m is the measured value; and n is the number of validation groups.

3.2. Forecasted Outcomes of Helianthus annuus Seed Quality Indexes

Validation results indicate a high accuracy of simulation and a reasonable setting of neural network parameters. Thus, the trained RBFNNs can be applied to forecast the remaining 60 groups, the values of Helianthus annuus seed quality indexes of which are untested. Due to the partial data loss of the DA-39 and TY-31 samples, the trained RBFNNs were used to forecast the Helianthus annuus seed quality of 58 other groups (Table 2).
The Helianthus annuus seeds in the western part of Jilin are of relatively high quality. Statistical data of the four quality indexes is shown in Table 3. The mean values of vitamin E, protein, and TAA concentration of the three experimental fields show little difference. However, the mean value of fat in the seeds collected from Nongan and Daan (45.39% and 46.41%) is about 5% higher than those from Tongyu (40.70%). The forecasted values by the RBFNN are in line with the tested data of 60 value-known groups. All quality index values of every experimental field have small fluctuations with a variable coefficient below 20%, which indicates lower variability.

4. Discussion

4.1. Training of the RBFNN

The RBFNN is an effective tool for simulating a non-linear relationship. It avoids the disadvantages of back propagation neural networks (BPNNs), which is of low convergence speed and liable to fall into the locally optimal solution [12,15]. The setting-up of neural networks is based on the non-linear relationship between the input vector and the output vector. The author failed to forecast the moisture concentration of Helianthus annuus seeds in the same way for the possible reason that soil water concentration is not included in the input index system, which is one of the main factors affecting the moisture concentration of crops [19]. This indicates that the interrelation between selected indexes of input layers and output layers needs to be confirmed first to set a proper model. The goal values of the four RBFNNs in this paper are all set to 10−8, which means the iterative computation would stop when the mean square error dropped below 10−8. Among all the parameters of the RBFNNs, spread has the largest impact on the forecasted outcome. The parameter adjustment of RBFNNs mainly depends on the modification of spread to approach the relationship curve. The higher spread is, the smoother the fitted curve would be [20]. In this paper, the spread of the vitamin E forecasting RBFNN is set to 0.0397, the spread of the protein forecasting RBFNN is set to 0.0594, the spread of the fat forecasting RBFNN is set to 0.0478, and the spread of the TAA concentration forecasting RBFNN is set to 0.0593. To ensure the accuracy, all settings of spread in the four RBFNNs are low. The mean relative errors of the four RBFNNs are 2.63%, 2.19%, 2.19%, and 2.80% and the root mean square errors are 1.7 mg/100 g, 0.59%, 1.09%, and 0.77% (Table 1), respectively, which shows a high accuracy of forecasting. The forecasted values of the RBFNNs are in line with the tested data of the 60 treated groups, and there are no abnormal values forecasted. This suggests an empirical method of forecasting and supplementing the missing part of vegetation data based on the interrelationship between soil properties and crop quality using RBFNNs. Meanwhile, high-accuracy forecasting of crop quality based on soil properties using a proper mathematical model has the potential to guide agricultural planning and realize the intensive use of cultivated land.

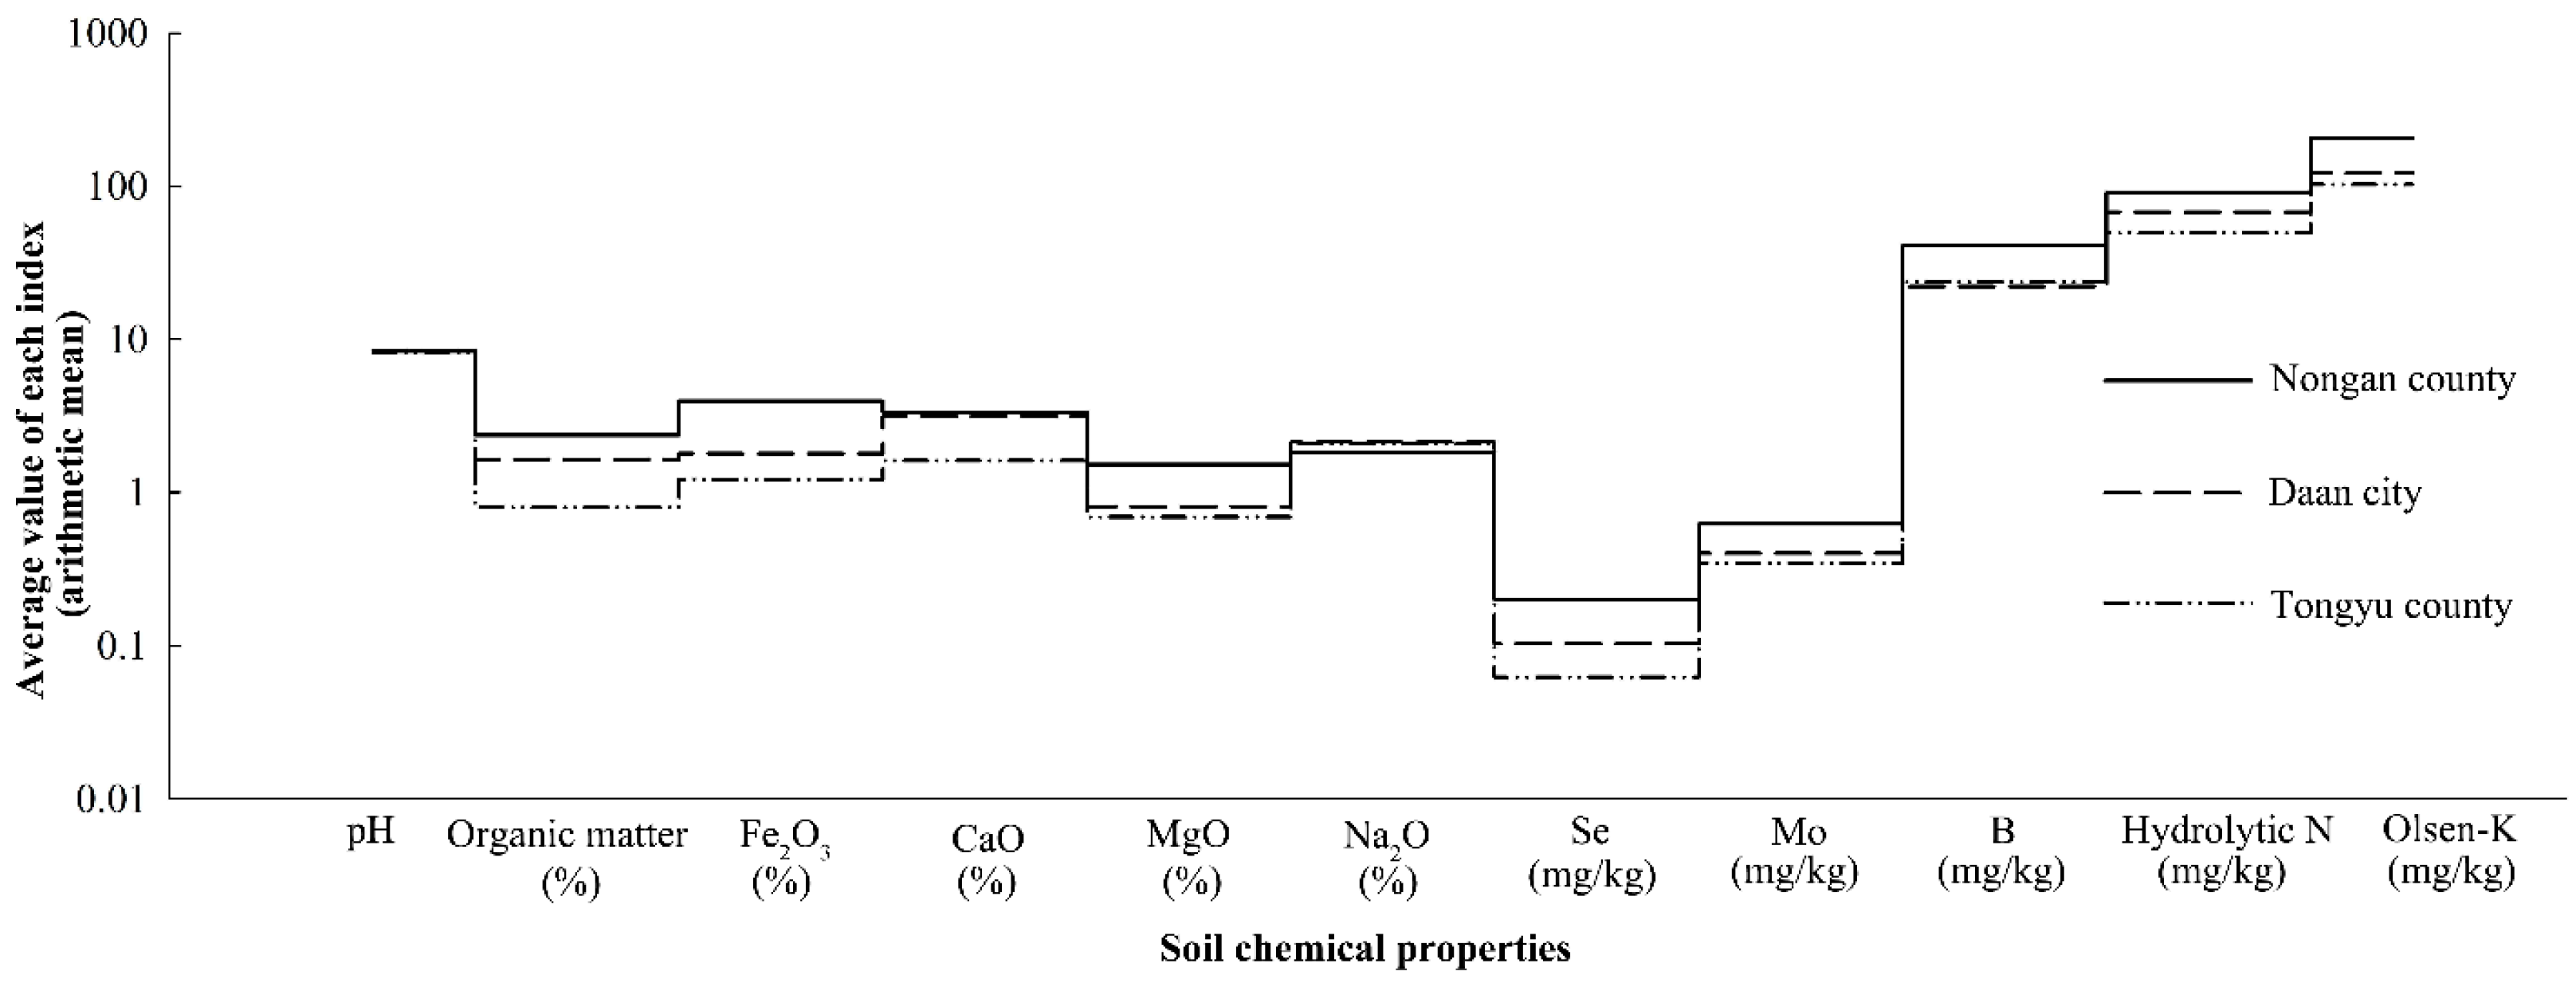
4.2. Analysis of Soil Chemical Properties and Helianthus annuus Seed Quality in the Western Part of Jilin

The western part of Jilin is of severe soil salinization and significant soil degradation [21,22]. The statistical data of soil chemical properties shows that the averages of soil pH of soil samples of the three experimental fields range from 8.0 to 8.5, and the concentrations of Na2O are concentrated around 2%, which indicates obvious soil salinization [23]. In addition, nine other indexes selected show high regional differences (Figure 3), especially the concentration of soil organic matter, soil total Se, soil total Fe2O3, and soil hydrolytic nitrogen. However, statistical data of Helianthus annuus seed quality indexes show little regional difference between the three experimental fields except that the mean value of the fat in seeds collected from Nongan and Daan is about 5% higher than those from Tongyu. According to the homeostasis theory and the ecological stoichiometry [24,25,26,27], plants have a self-protection mechanism to adapt to the sufferable change of the growing environment, which enables the exact element concentration to maintain in a certain range. Helianthus annuus has strong resistance characteristics to severe environments, which enables its survival in the poor planting environments of Western Jilin [14]. This also helps to explain the stabilization of vitamin E, protein, and TAA concentrations of Helianthus annuus seeds despite the evident regional variation in soil chemical properties.

5. Conclusions

(1) The mean relative errors of vitamin E, protein, fat, and TAA concentration forecasting neural networks are 2.63%, 2.19%, 2.19%, and 2.80%, respectively. The root mean square errors are 1.7 mg/100 g, 0.59%, 1.09%, and 0.77%. The neural networks are of high prediction accuracy, which introduces an empirical case for the forecasting quality of crops based on soil properties by using RBFNN. The interrelation between selected indexes of input layer and output layer needs to be confirmed first, and a low setting of the spread of RBFNN can help improve the accuracy.
(2) Soil in the studied area is under severe salinization, and soil chemical properties of the three experimental fields show high regional differences. However, the vitamin E, protein, and TAA concentration of Helianthus annuus seeds all stabilize in a certain range despite the different soil environments. The mean value of fat in the seeds collected from Nongan and Daan (45.39% and 46.41%) is about 5% higher than those from Tongyu (40.70%).

Author Contributions

Wenbo Li, Dongyan Wang and Yuefen Li designed the research and conceived the framework of the manuscript. Wenbo Li and Shuhan Liu wrote the program for RBFNN. Danyu collected and processed the data. Shuhan Liu plotted all the figures.

Conflicts of Interest

The authors declare no conflict of interest.

References

  1. Olmo, M.; Lozano, A.M.; Barrón, V.; Villar, R. Spatial heterogeneity of soil biochar content affects soil quality and wheat growth and yield. Sci. Total Environ. 2016, 562, 690–700. [Google Scholar] [CrossRef] [PubMed]
  2. Zhang, S.; Zhu, A.; Liu, J.; Yang, L. An Integrative Sampling Scheme for Digital Soil Mapping. Prog. Geogr. 2012, 31, 1318–1325. (In Chinese) [Google Scholar]
  3. Theocharopoulos, S.P.; Wagner, G.; Sprengart, J.; Mohr, M.E.; Desaules, A.; Muntau, H.; Christou, M.; Quevauviller, P. European soil sampling guidelines for soil pollution studies. Sci. Total Environ. 2001, 264, 51–62. [Google Scholar] [CrossRef]
  4. Lin, Y.P.; Yeh, M.S.; Deng, D.P.; Wang, Y.C. Geostatistical approaches and optimal additional sampling schemes for spatial patterns and future sampling of bird diversity. Glob. Ecol. Biogeogr. 2008, 17, 175–188. [Google Scholar] [CrossRef]
  5. Tuovinen, T.S.; Roivainen, P.; Makkonen, S.; Kolehmainen, M.; Holopainen, T.; Juutilainen, J. Soil-to-plant transfer of elements is not linear: Results for five elements relevant to radioactive waste in five boreal forest species. Sci. Total Environ. 2011, 410–411, 191–197. [Google Scholar] [CrossRef] [PubMed]
  6. Petković, D.; Žarko, Ć.; Nikolić, V. Adaptive neuro-fuzzy approach for wind turbine power coefficient estimation. Renew. Sustain. Energy Rev. 2014, 28, 191–195. [Google Scholar] [CrossRef]
  7. Mohammadi, R.; Ghomi, S.M.T.F.; Zeinali, F. A new hybrid evolutionary based RBF networks method for forecasting time series: A case study of forecasting emergency supply demand time series. Eng. Appl. Artif. Intell. 2014, 36, 204–214. [Google Scholar] [CrossRef]
  8. Horng, M.H. Performance evaluation of multiple classification of the ultrasonic supraspinatus images by using ML, RBFNN and SVM classifiers. Expert Syst. Appl. 2010, 37, 4146–4155. [Google Scholar] [CrossRef]
  9. Debarati, B.; Purakayastha, T.J. Long-term tillage, water and nutrient management in rice-wheat cropping system: Assessment and response of soil quality. Soil Tillage Res. 2014, 144, 83–95. [Google Scholar]
  10. Gong, L.; Ran, Q.; He, G.; Tiyip, T. A soil quality assessment under different land use types in Keriya river basin, Southern Xinjiang, China. Soil Tillage Res. 2015, 146, 223–229. [Google Scholar] [CrossRef]
  11. Dewaelheyns, V.; Elsen, A.; Vandendriessche, H.; Gulinck, H. Garden management and soil fertility in Flemish domestic gardens. Landsc. Urban Plan. 2013, 116, 25–35. [Google Scholar] [CrossRef]
  12. Li, Y.; Wang, D.; Viengsouk, L.; Yang, X.; Li, W.; Zhao, Y.; Sun, C. Prediction of carbon, nitrogen and phosphorus contents of Leymus Chinensis based on soil chemical properties using artificial neural networks. Trans. Chin. Soc. Agric. Eng. 2014, 30, 104–111. (In Chinese) [Google Scholar]
  13. Li, F.; Zhang, S.; Yang, J.; Bu, K.; Wang, Q.; Tang, J.; Chang, L. The effects of population density changes on ecosystem services value: A case study in Western Jilin, China. Ecol. Indic. 2016, 61, 328–337. [Google Scholar]
  14. Li, S.J.; Dou, S.; Wang, L.M.; Liu, Z.S. Application of DEA on evaluating soil element and sunflower quality. J. Soil Water Conserv. 2011, 25, 144–148. (In Chinese) [Google Scholar]
  15. Zhang, W.; Bao, Z.; Jiang, S.; He, J. An Artificial Neural Network-Based Algorithm for Evaluation of Fatigue Crack Propagation Considering Nonlinear Damage Accumulation. Materials 2016, 9, 483. [Google Scholar] [CrossRef]
  16. Fardis, N.; Mehdi, I. Application and comparison of RNN, RBFNN and MNLR approaches on prediction of flotation column performance. Int. J. Min. Sci. Technol. 2015, 25, 983–990. [Google Scholar]
  17. Shamshirband, S.; Petković, D.; Anuar, N.B.; Gani, A. Adaptive neuro-fuzzy generalization of wind turbine wake added turbulence models. Renew. Sustain. Energy Rev. 2014, 36, 270–276. [Google Scholar] [CrossRef]
  18. Nikolić, V.; Shamshirband, S.; Petković, D.; Mohammadi, K.; Ćojbašić, Ž.; Altameem, T.A.; Gani, A. Wind wake influence estimation on energy production of wind farm by adaptive neuro-fuzzy methodology. Energy 2014, 80, 361–372. [Google Scholar] [CrossRef]
  19. Li, H.; Guan, D.; Yuan, F.; Wang, A.; Jin, C.; Wu, J.; Li, Z.; Jing, Y. Water use efficiency and its influential factor over Horqin Meadow. Acta Ecol. Sin. 2015, 35, 1–21. (In Chinese) [Google Scholar]
  20. Sun, D.H.; Wang, F.Z.; Liu, Q.; Zhang, G.Z.; Yuan, S.C. Comparative study on fault diagnosis of rolling bearings based on BP and RBF neural network. Bearing 2010, 2, 53–56. (In Chinese) [Google Scholar]
  21. Shi, X.; Chen, Y.; Yue, J.; Li, J.; Peng, C. Simulating and forecasting soil-salinisation evolution: A case study on Changling County, Jilin province, China. N. Z. J. Agric. Res. 2007, 50, 975–981. [Google Scholar]
  22. Zhou, Y.; Fu, Z.; Liu, D.; Wang, L.; Wang, L. A study on the progress of grassland degradation, land salinization and soil desertification in the west of Jilin province. J. Jilin Univ. (Earth Sci. Ed.) 2003, 33, 348–354. (In Chinese) [Google Scholar]
  23. Huang, C. Soil Science; China Agriculture Press: Beijing, China, 2000; pp. 171–189. [Google Scholar]
  24. Yu, Q.; Elser, J.J.; He, N.; Wu, H.; Chen, Q.; Zhang, G.; Han, X. Stoichiometric homeostasis of vascular plants in the Inner Mongolia grassland. Oecologia 2011, 166, 1–10. [Google Scholar] [CrossRef] [PubMed]
  25. Okamoto, S.; Tabata, R.; Matsubayashi, Y. Long-distance peptide signaling essential for nutrient homeostasis in plants. Curr. Opin. Plant Biol. 2016, 34, 35–40. [Google Scholar] [CrossRef] [PubMed]
  26. Blouin, M.; Mathieu, J.; Leadley, P.W. Plant homeostasis, growth and development in natural and artificial soils. Ecol. Complex. 2012, 9, 10–15. [Google Scholar] [CrossRef]
  27. Jiang, L.; He, S.; Wu, L.; Yan, Y.; Weng, S.; Liu, J.; Wang, W.; Zeng, C. Characteristics of stoichiometric homeostasis of three plant species in wetlands in Minjiang estuary. Wetl. Sci. 2014, 12, 293–298. (In Chinese) [Google Scholar]
Figure 1. Distribution of the experimental fields.
Sustainability 08 01055 g001
Figure 2. Topological structure of radial basis function neural networks (RBFNNs).
Sustainability 08 01055 g002
Figure 3. Comparison of soil chemical properties between the three experimental fields.
Sustainability 08 01055 g003
Table 1. Validation results of all radial basis function neural networks.
Vitamin E/(mg/100 g)Protein/(%)Fat/(%)TAA/(%)
Validate SampleMeasured ValueForecasted ValueValidate SampleMeasured ValueForecasted ValueValidate SampleMeasured ValueForecasted ValueValidate SampleMeasured ValueForecasted Value
NA-145.9044.39NA-1519.4018.48NA-1137.1038.15NA-618.5018.39
DA-640.7040.63NA-2122.1022.90DA-1946.4044.86DA-2318.5018.54
DA-2741.1044.55DA-2723.7023.21DA-3048.5048.50DA-3618.2019.76
TY-1237.1037.05TY-3424.5024.43TY-339.2040.75TY-2218.0017.75
TY-3441.3041.78TY-4026.0025.94TY-538.1037.77TY-2420.6019.94
RMSE1.7 mg/100 gRMSE0.59%RMSE1.09%RMSE0.77%
MRE2.63%MRE2.19%MRE2.19%MRE2.80%
Table 2. Forecasted outcomes of untested Helianthus annuus seed quality.
Serial NumberVitamin E/(mg/100 g)Protein/(%)Fat/(%)TAA/(%)Serial NumberVitamin E/(mg/100 g)Protein/(%)Fat/(%)TAA/(%)
NA-245.0617.6852.3717.38DA-1645.7224.0240.4418.63
NA-335.6823.8838.1819.01DA-1839.9220.6443.7717.45
NA-435.1020.0844.6718.70DA-2039.1121.9750.2919.61
NA-545.0324.7651.1418.99DA-2237.7825.7347.9020.16
NA-743.9524.1344.4119.96DA-2640.5424.8544.1419.41
NA-841.5323.0748.9117.79DA-2835.9124.2937.7717.67
NA-1237.1923.4340.2617.85DA-3237.6921.3452.2819.99
NA-1738.4426.5947.8821.25DA-3436.7623.5338.0318.00
NA-1842.3321.3337.0017.03DA-3539.3522.2149.9021.00
NA-1943.4418.4842.7616.35DA-3739.6426.7341.3821.37
NA-2239.9023.4345.7618.92TY-237.1322.6837.7817.73
NA-2440.9522.8336.4318.62TY-435.9124.2937.7717.67
NA-3035.3423.2840.7320.17TY-635.9124.3237.7717.72
NA-3138.8023.8543.2618.54TY-836.0525.3737.6118.95
NA-3244.7019.0134.3115.19TY-1035.9623.4638.4417.59
NA-3442.2919.5249.8516.54TY-1338.2225.1841.3219.99
NA-3636.0923.9241.9419.28TY-1536.4022.5139.5717.27
NA-3841.7121.1750.4520.32TY-1836.9423.8139.3518.03
NA-3935.6523.8637.8718.94TY-2141.3623.1435.4217.59
NA-4045.6226.4748.3420.19TY-2341.2323.5837.1519.09
DA-136.5524.8238.0518.78TY-2538.3222.5245.8317.81
DA-341.1819.0950.2916.65TY-2641.5221.1149.7318.01
DA-435.4224.9640.0819.10TY-2735.9724.5837.2318.58
DA-841.5625.0541.4121.31TY-2837.5124.6241.2619.20
DA-935.1524.9038.0719.18TY-3036.2223.9838.4717.90
DA-1236.1023.3239.7818.71TY-3335.9124.2937.7717.67
DA-1335.9124.3237.7317.78TY-3546.3027.5749.3721.45
DA-1439.1227.4140.7621.69TY-3737.4523.4045.3018.74
DA-1544.6524.6650.2419.30TY-3836.5723.6037.6117.64
Table 3. Statistics of Helianthus annuus seed quality in the studied area.
Studied AreaQuality IndexMinMaxMeanVariable Coefficient/(%)
Nongan County (n = 40)vitamin E/(mg/100 g)34.6057.5042.3412.72
protein/(%)17.4026.5921.8510.77
fat/(%)34.3056.5045.3913.62
TAA/(%)14.7021.2518.009.45
Daan City (n = 39)vitamin E/(mg/100 g)35.1549.8040.9211.06
protein/(%)17.3027.9023.7110.87
fat/(%)37.7355.9046.4111.28
TAA/(%)14.7021.6919.308.52
Tongyu County (n = 39)vitamin E/(mg/100 g)35.9149.8039.9810.71
protein/(%)20.3028.0023.867.44
fat/(%)33.0055.3040.7012.24
TAA/(%)15.3021.8018.777.57

