1. Introduction
The increasing pace of human and socioeconomic dynamics around the world has been at the cost of environmental deterioration over the same time period. The pro-growth and resource intensive strategy across many countries has led to many global environmental degradation issues. Algal blooms refer to the explosive increase and high concentration of phytoplankton in local waters, posing an enormous threat to the marine ecosystem, fisheries, and human health at unprecedented rates in recent years. This has become a challenge facing human society today as the phenomenon of algal blooms is becoming more prevalent throughout the world [
1,
2,
3]. At the same time, there is growing public and scientific attention to international environmental change issues. The environmental factors that produce algal blooms are diverse and involve physical, chemical and biological factors, the relationships among which are uncertain and nonlinear [
4]. Although a considerable amount of research has been conducted during the last several years [
1,
2,
5], the mechanisms of algal blooms remain unclear. Identifying the density of phytoplankton cells in water samples, mainly conducted in the laboratory using microscopic observations, is labor-intensive and time-consuming with the significant space-time restriction. At the same time, the environmental sciences are undergoing a dramatic shift towards analyzing ever-increasing amounts of large-scale diverse data. Accurately predicting algal blooms remains a challenging scientific problem. Solving this problem would be helpful to environmental protection and management.
In recent years, many predictive approaches based on theoretical dynamic models have been developed to forecast the dynamic changes of phytoplankton by integrating physiochemical parameters into a water quality model [
6,
7,
8]. However, these approaches are limited to poor generalization performance in different seawater environments because of their poor flexibility and adjustability as well as the uncertainty of the models’ dynamic coefficients [
9,
10]. Recently, with the establishment of a marine monitoring network accumulating extensive monitoring data, a data-driven approach becomes possible to predict algal blooms. Data-driven models can manage nonlinear and complex phenomenon effectively, identifying certain mapping relationships between input parameters and outputs without specific knowledge by learning from training cases. A data-driven method is effective to predict algal blooms because the relationships between phytoplankton and environmental parameters are not fully understood due to the complexity. In recent years, several studies have revealed the successful application of data-driven techniques in the field of algal blooms prediction that mainly include artificial neural networks (ANN) and evolutionary algorithms [
9,
11,
12,
13]. These studies have proven that data-driven models are capable of predicting temporal changes of phytoplankton [
14,
15,
16,
17,
18].
Nevertheless, issues in dealing with complex phenomena, such as algal blooms prediction, remain, even with the aforementioned data-driven models. Most data-driven models such as the back-propagation neural network (BPNN) and support vector machine (SVM) possess limitations in representing highly nonlinear phenomena using a single hidden layer of computation architecture, which is shallow learning. Although such models are able to approximate an arbitrary nonlinear function as long as they have sufficient neural units [
19], an increased number of units would lead to an extremely slow learning speed and over-fitting problem, thus yielding poor generalization [
20,
21]. Deep learning architectures, as a deep neural network, have recently become a powerful tool to represent and predict highly dynamic and complex phenomena [
22]. Deep learning simulates the hierarchical structure of the human brain, reproducing more detailed features by learning data samples from lower to higher levels. This simulation produces a stronger representation and generalization ability [
23]. Since deep belief networks (DBN) were proposed by Hinton [
24], which are a classical implementation framework of deep learning, deep learning has been given increased attention and has achieved considerable success in the fields of image classification, motion recognition, complex phenomena prediction, and others [
25,
26,
27,
28]. Zhang utilized deep belief networks to forecast foreign exchange rates and found that these networks perform better than other classical approaches [
29]. Chen proposed a deep-belief-networks-based model to predict the drought index of the Huaihe River Basin in China [
3]. The results showed that a DBN-based model is superior to the traditional BP neural network in terms of accuracy and efficiency.
China has witnessed both dramatic spatial economic restructuring and continuous environmental degradation. The overall environmental quality is worsening in China, with environmental pollution equivalent, in monetary terms, to an estimated annual loss of 3%–8% of GDP [
30] (p. 767). In addition to serious health issues and economic loss caused by algal blooms, they might also put economic development and sustainability at risk. Such environmental deterioration has raised environmental and pro-sustainability awareness in the nation. According to the China Marine Environment Bulletin, coastal waters of East China are most affected by algal blooms, with a higher frequency of appearance than other waters in China. These algal blooms severely affect human health and marine ecosystems [
31]. Given East China’s large population scale and economic activity, whether and how algal blooms develop will have massive implications not only for China but also for other countries around the Pacific Rim and beyond. In addition, heightened public awareness of environmental crises has further promoted the discussion of these issues in coastal China, the richest part of the world’s largest developing country with nearly three decades of almost double-digit economic growth [
30]. Searching for the appropriate equilibrium between human activity and marine ecosystem protection in China’s fastest-growing and environmentally-vulnerable coastal region is an emerging and pressing issue in its unparalleled uneven socioeconomic transformation. However, computing power is urgently needed to deal with the massive amounts of related data sets. This study attempts to develop an algal blooms forecasting model based on deep learning with multi-layer DBN. The proposed model has been applied as a predictor for algal blooms in East China’s coastal waters.
The remainder of this study is organized as follows.
Section 2 describes the study area and the data analyzed, as well as the deep learning architecture. Based on these materials and methods, a deep-learning-based model is proposed. In
Section 3, a case study is presented and discussed. The last section provides the main conclusion to this study.
2. Materials and Methods
2.1. Available Data and Preprocessing
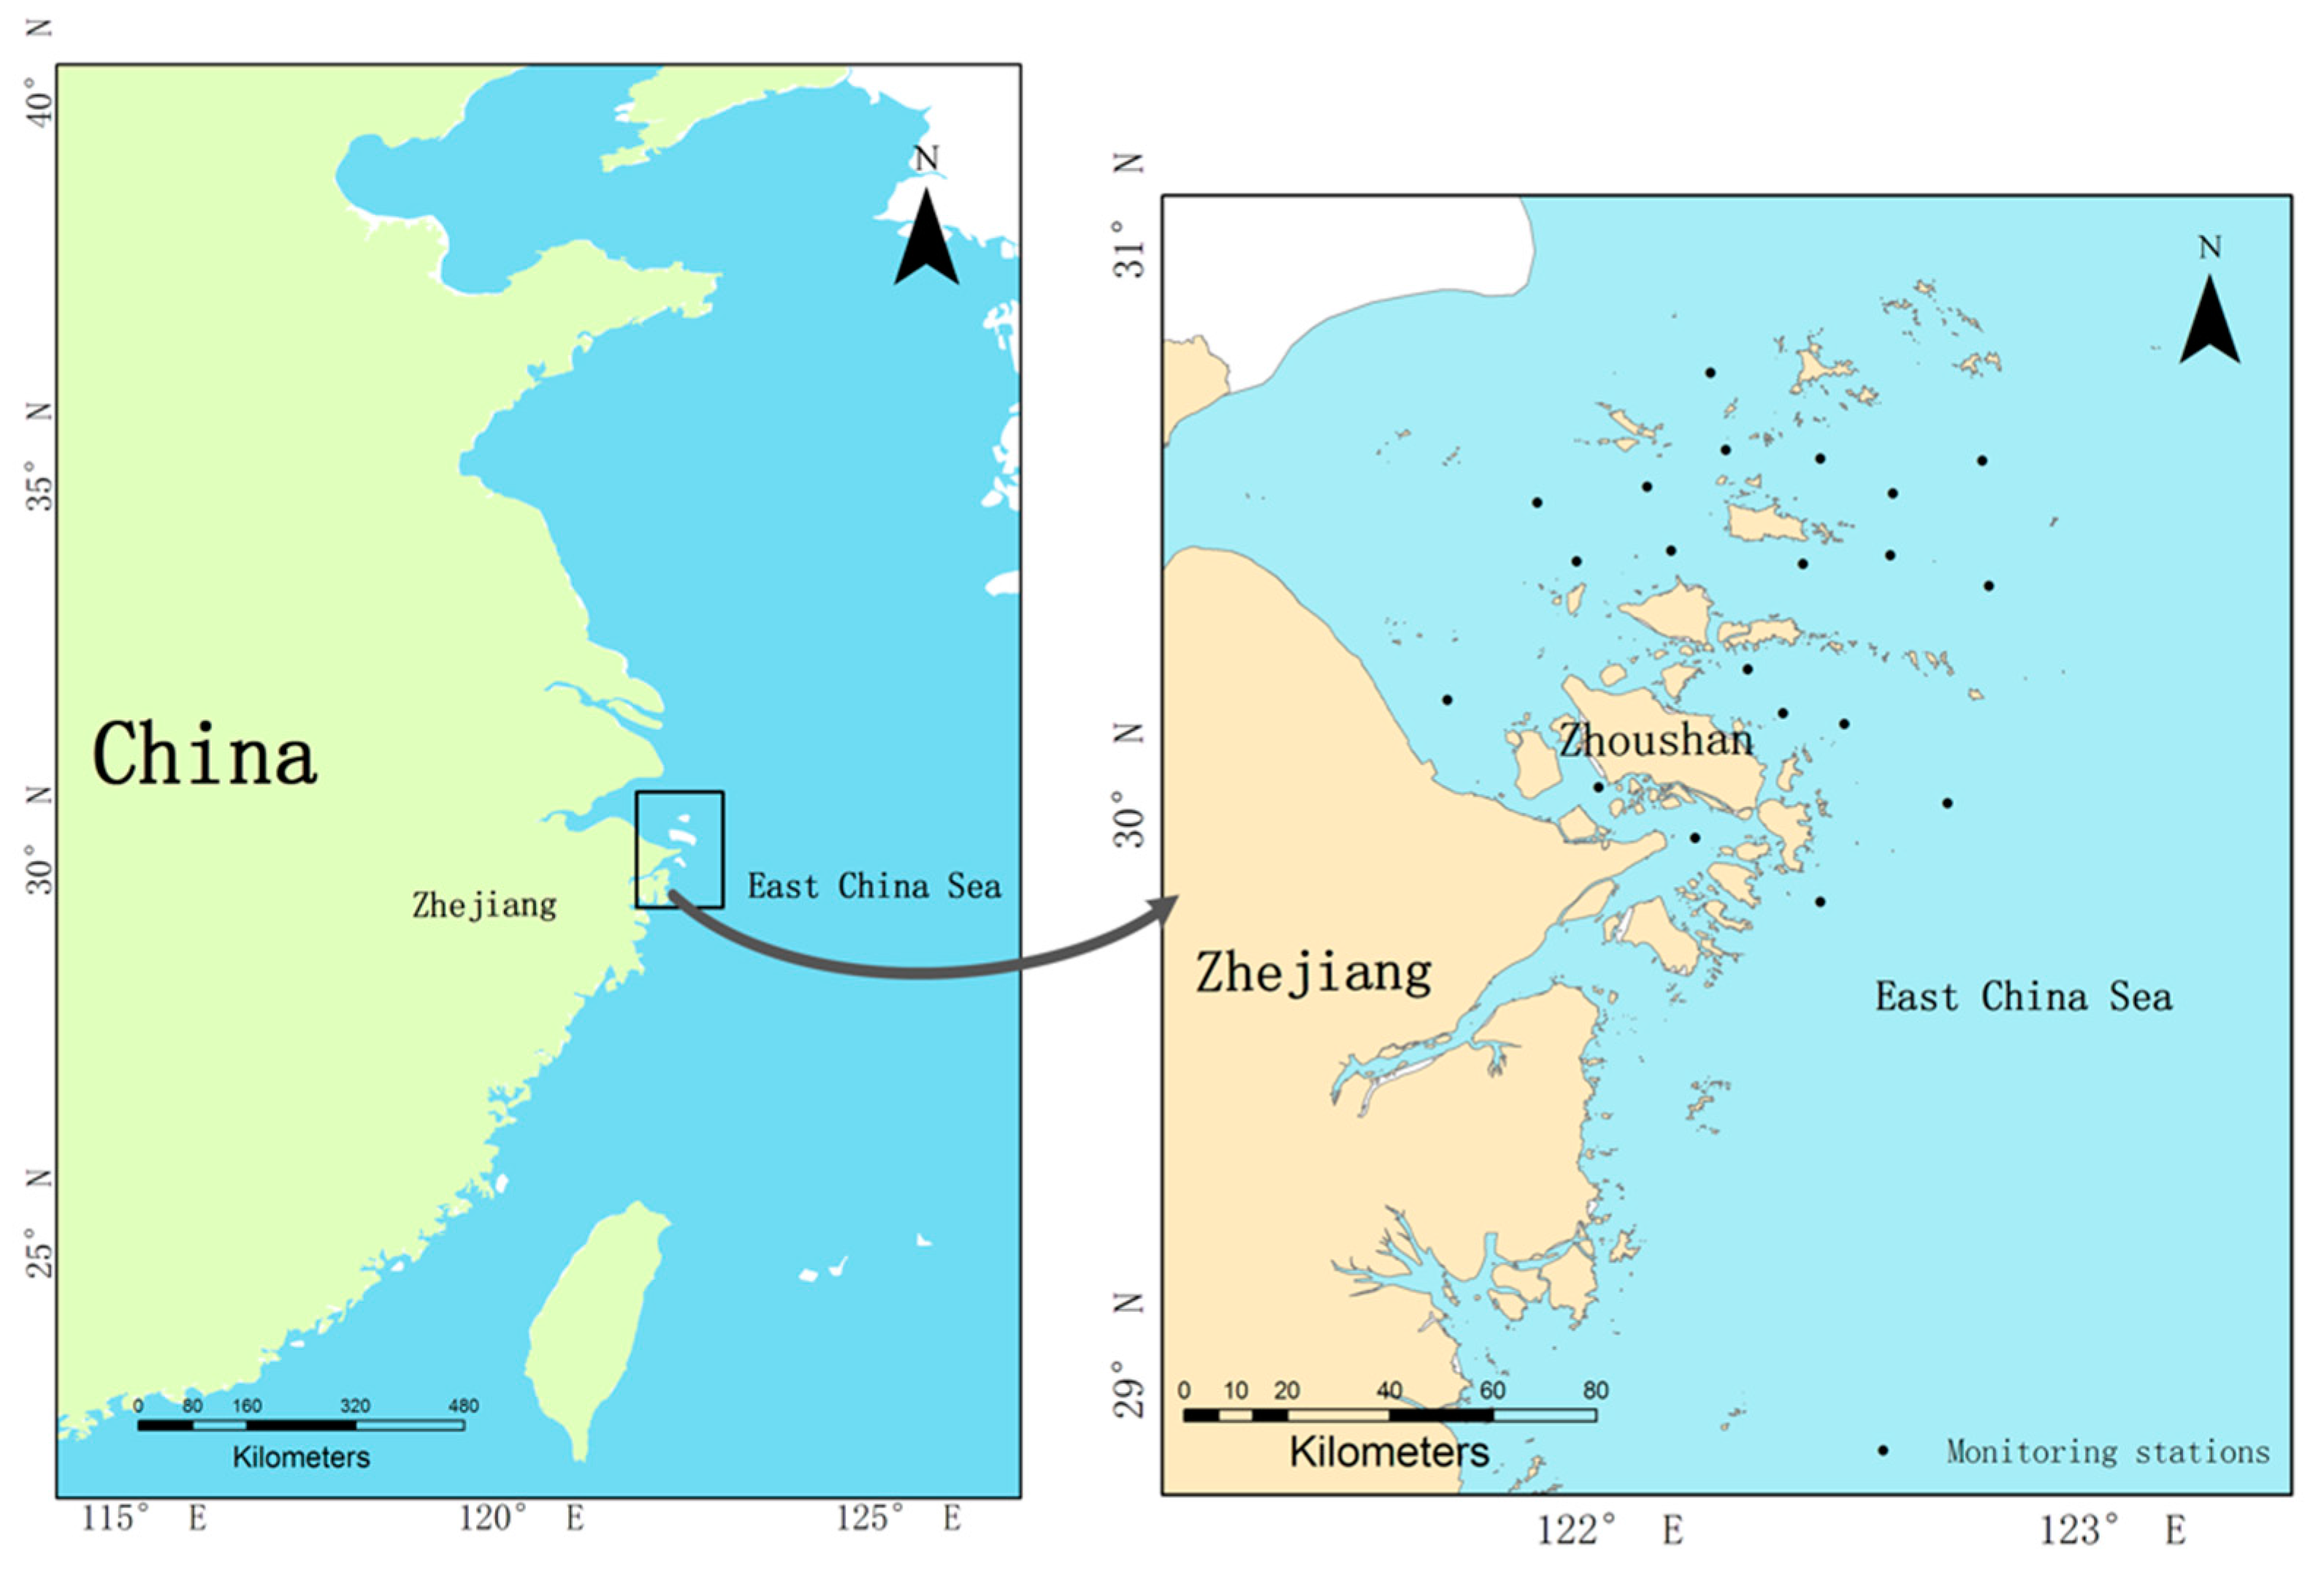
The study area is located in coastal areas of East China as shown in
Figure 1. It mainly covers northern waters of Zhejiang Province, including the Zhoushan area. In situ real-time monitoring systems have been deployed in study areas to measure various water quality parameters. However, these online monitoring data cannot contribute to early, and thus timely, algal bloom warnings. Therefore, the data samples used for modeling are obtained from 20 monitoring stations in the coastal waters of Zhoushan where algal blooms are routinely monitored and are located in the northern waters of Zhejiang Province (
Figure 1). The data were collected biweekly from 2008 to 2012 by the Marine Monitoring and Forecasting Centre of Zhejiang Province. Monitoring stations monitor the area at the beginning and end of each month from April to October. Parameters in the dataset include sea surface temperature, salinity, pH, chlorophyll-a, chemical oxygen demand, dissolved oxygen, phosphate (PO4_P), acid nitrate (NO2_N), nitrate (NO3_N), ammonia nitrogen (NH4_N), and silicate, which were simultaneously monitored and analyzed based on the specification for oceanographic survey in China.
The data samples are normalized to avoid structural error. The normalization of input parameters is calculated by (1) that follows, whereas the output of phytoplankton density is normalized by (2) according to its large variation in magnitude.
where
and
are the normalized data;
x and
y are the raw data;
,
, and
,
are the minimum and maximum values of input parameters and output layers, respectively. After normalization, the data samples are divided into two groups: 970 samples for training and 30 samples for testing.
2.2. Deep Learning Architecture
This study adopts DBN as the deep learning architecture which is one of the most widely used frameworks. A DBN is a typical generative model that is stacked by multiple restricted Boltzmann machines (RBM). In
Section 2.2.1, a brief introduction of the RBM is provided. The architecture and learning algorithm of the DBN are presented in
Section 2.2.2.
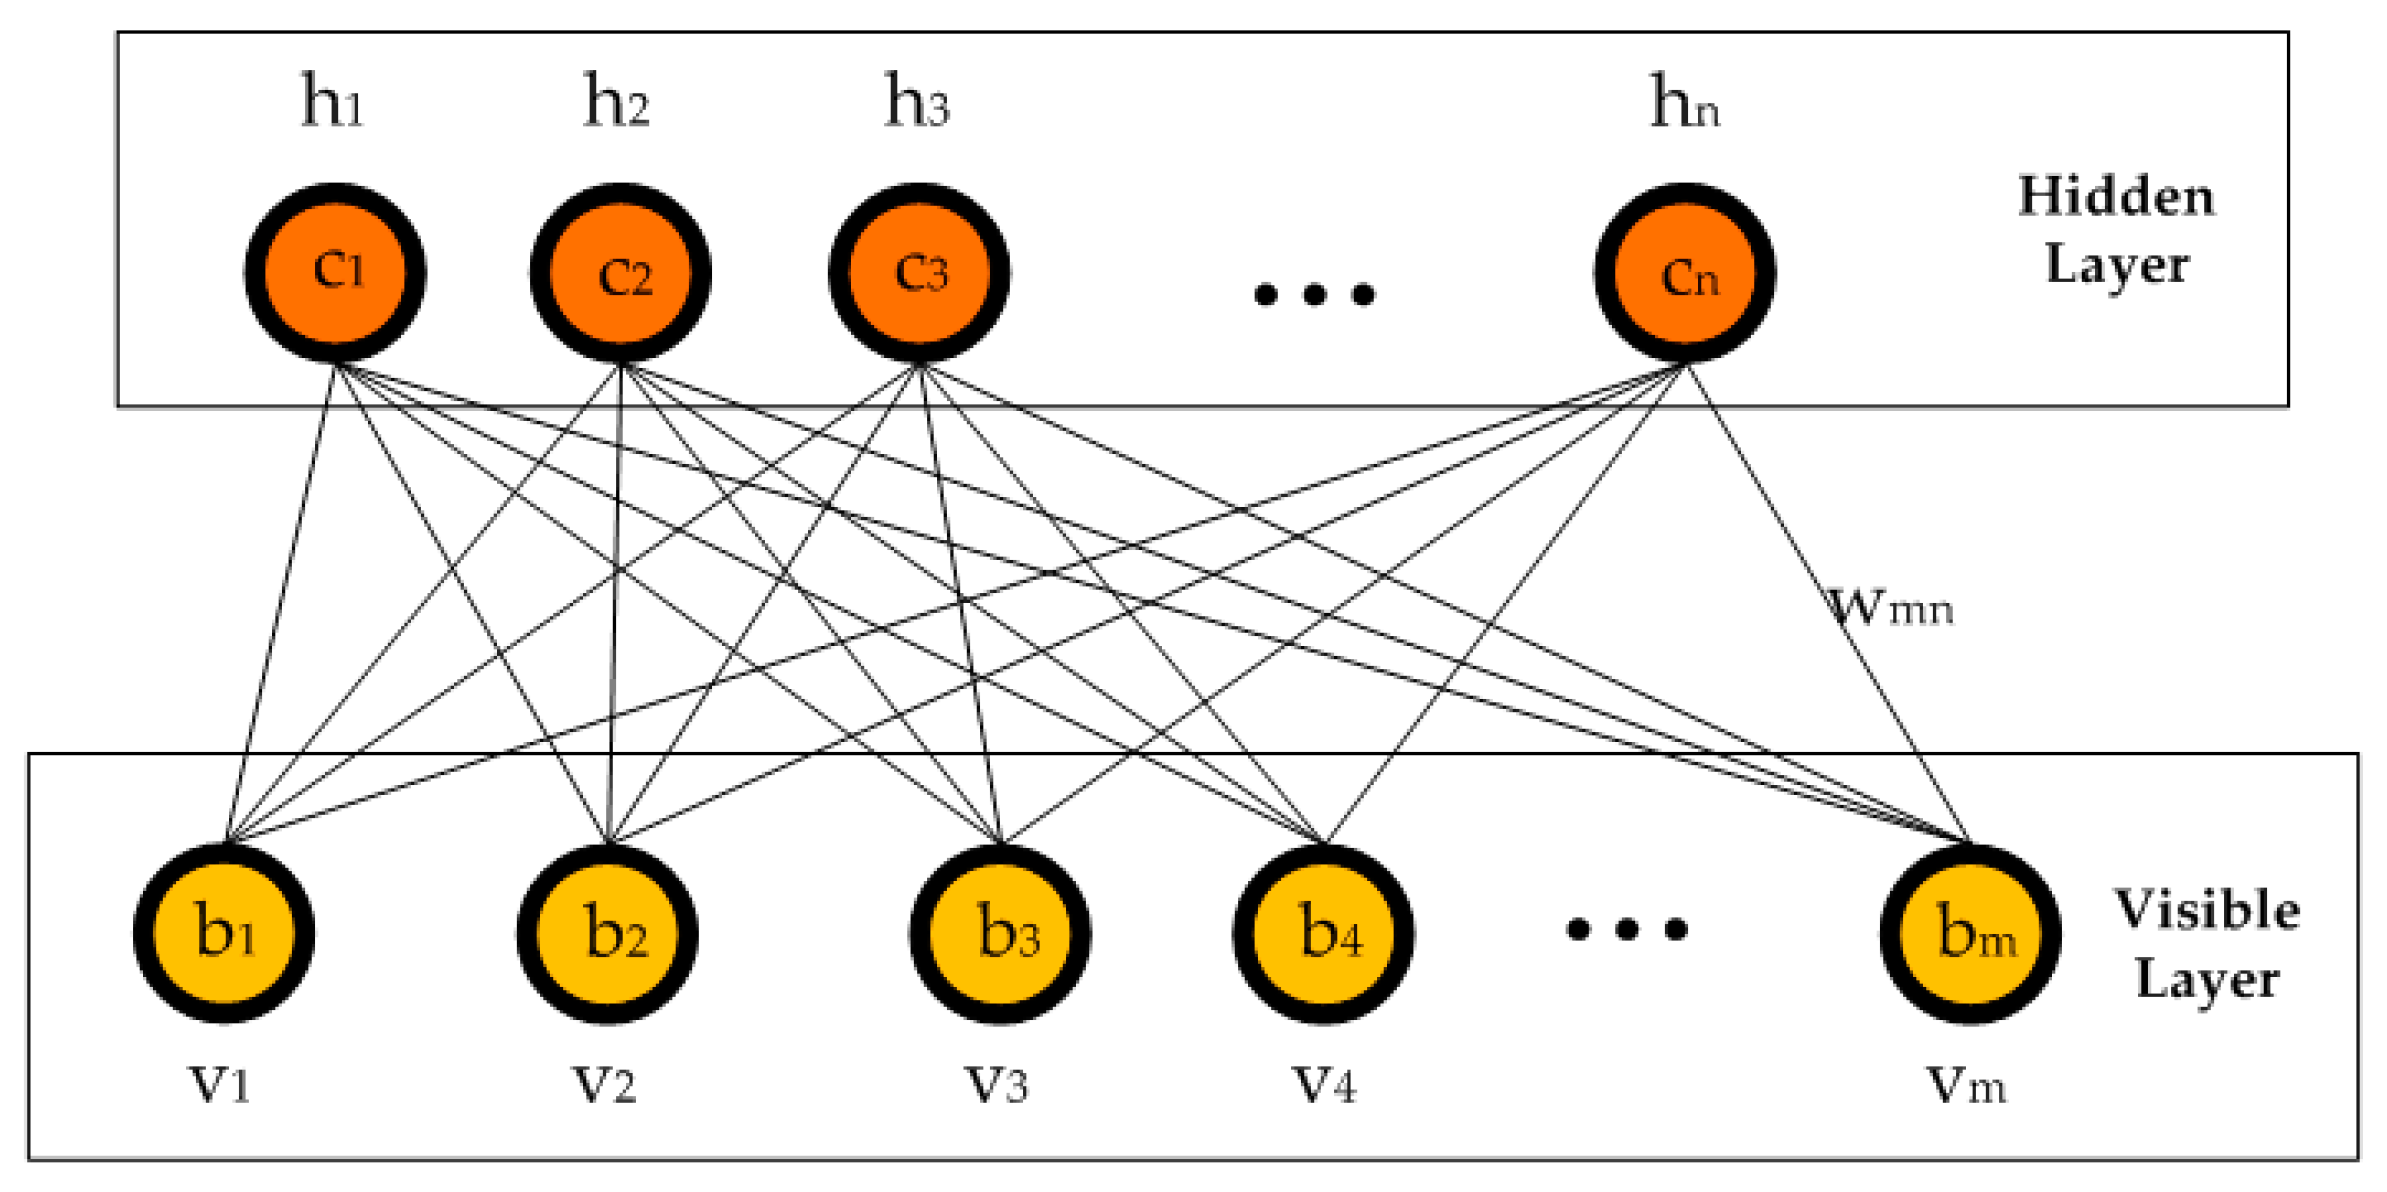
2.2.1. Restricted Boltzmann Machine
The RBM is a probabilistic energy-based neural network that consists of a visible and a hidden layer (
Figure 2). The visible layer is used to represent data from training samples, which is also known as the input layer. The hidden layer can be regarded as a feature classifier, extracting characteristic relationships between each dimension of the input data. Each unit, v, in the visible layer is connected to each unit, h, in the hidden layer in a symmetrical and bidirectional manner with weight, w, whereas units in the same layer have no connections. The aim of training the RBM is to minimize the total energy so that the probability distribution model can better match the observed data.
The energy function
of an RBM is defined as:
where
v and
h are vectors with binary values and {
b,
c,
W} are the model parameters. The joint distribution for each pair of visible and hidden units can then be defined as follows:
where,
Z is the partition function:
The conditional probabilities of hidden and visible units with binary values are calculated by:
where the conditional probabilities of a single binary hidden and visible unit are given by
where
is the logistic function
,
and
are the offsets,
and
are the states of units, and
denotes the connection weight between units
i and
j.
The purpose of training an RBM is to obtain optimal parameters {
b,
c,
W}, thereby capturing nonlinear relationships from the training data. In this study, an efficient learning method, known as contrastive divergence learning, is adopted to train the RBM. The update guidelines for model parameters are given by:
where
is a learning rate,
expresses the distribution of raw data input to the RBM, and
is the distribution of data after the model has been reconstructed.
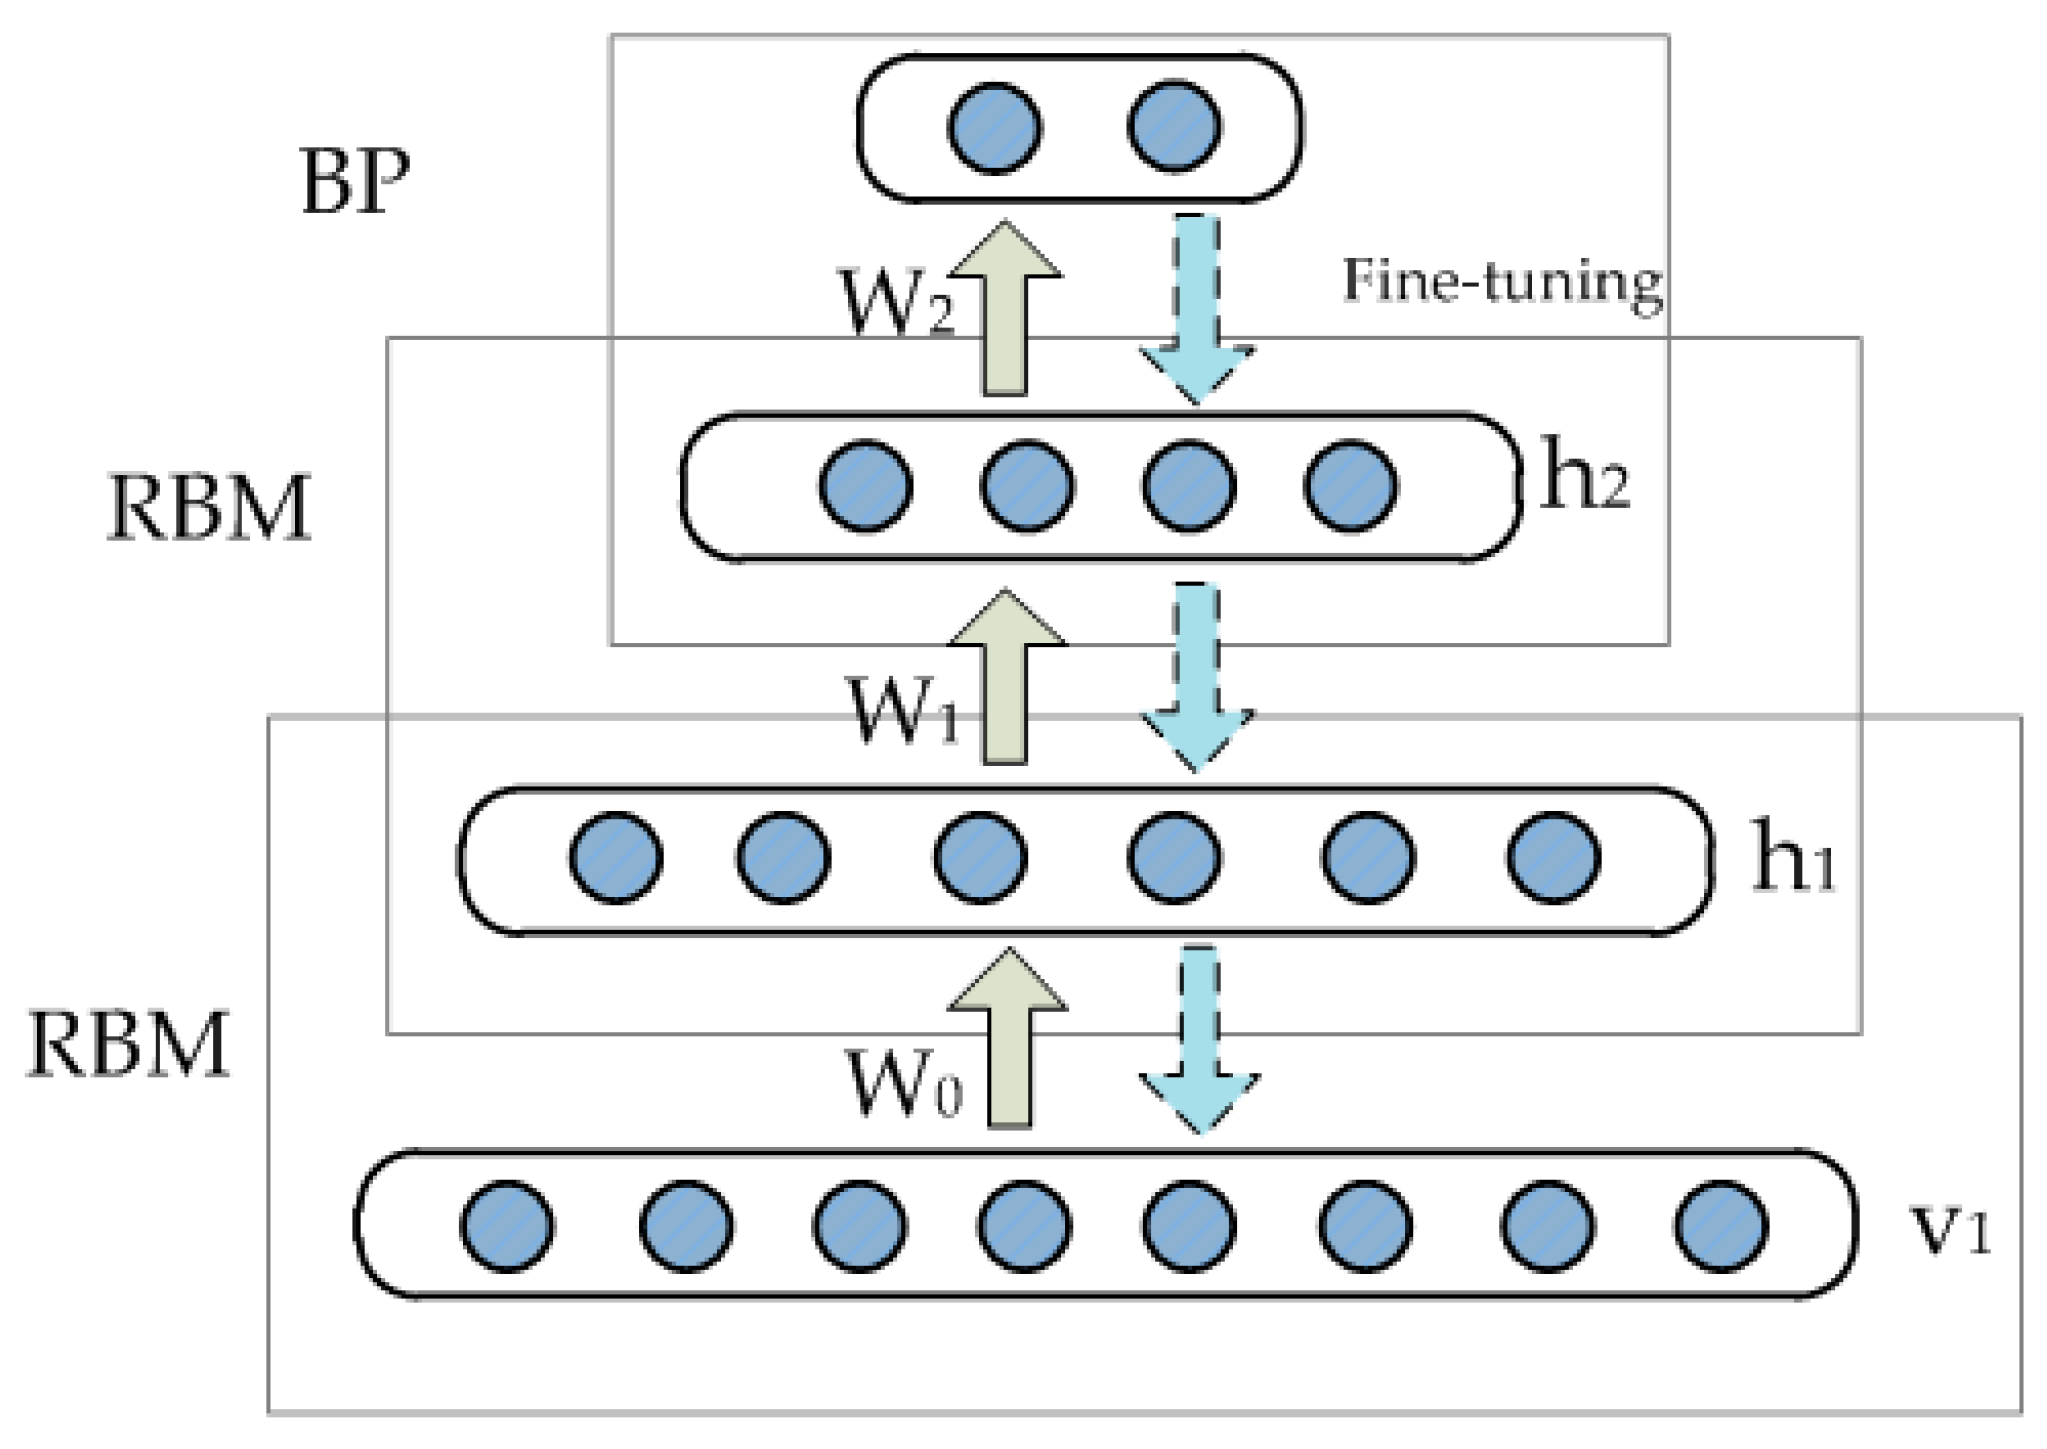
2.2.2. Deep Belief Networks
A typical DBN is composed of multiple stacked RBMs, forming a deep architecture as depicted in
Figure 3. Each RBM extracts potential relationships behind the input data and the output of low-level RBMs is taken as the input data of high-level RBMs. A major concern is to identify a method to train the DBN effectively. In this study, the greedy layer-wise learning algorithm proposed by Hinton is adopted [
24]. The entire training process can be divided into two parts: pretraining and finetuning. First, unsupervised pretraining is accomplished layer by layer from low-level to high-level RBMs to obtain reasonable parameter values of the network. The entire network is then trained in a supervised manner according to the target value. Finally, parameter values of the network are finetuned using the back-propagation algorithm.
Different from the traditional artificial neural networks that use only supervised learning for training, DBN optimizes initial weights by unsupervised pre-training, which can avoid being trapped in a poor local optimum. In addition, DBN improves training speed. Moreover, the deep architecture of DBN with adequate hidden layers has a more powerful representative ability to approximate highly complex phenomena more effectively than shallow learning. Predicting algal blooms using the deep learning method is obviously worthwhile.
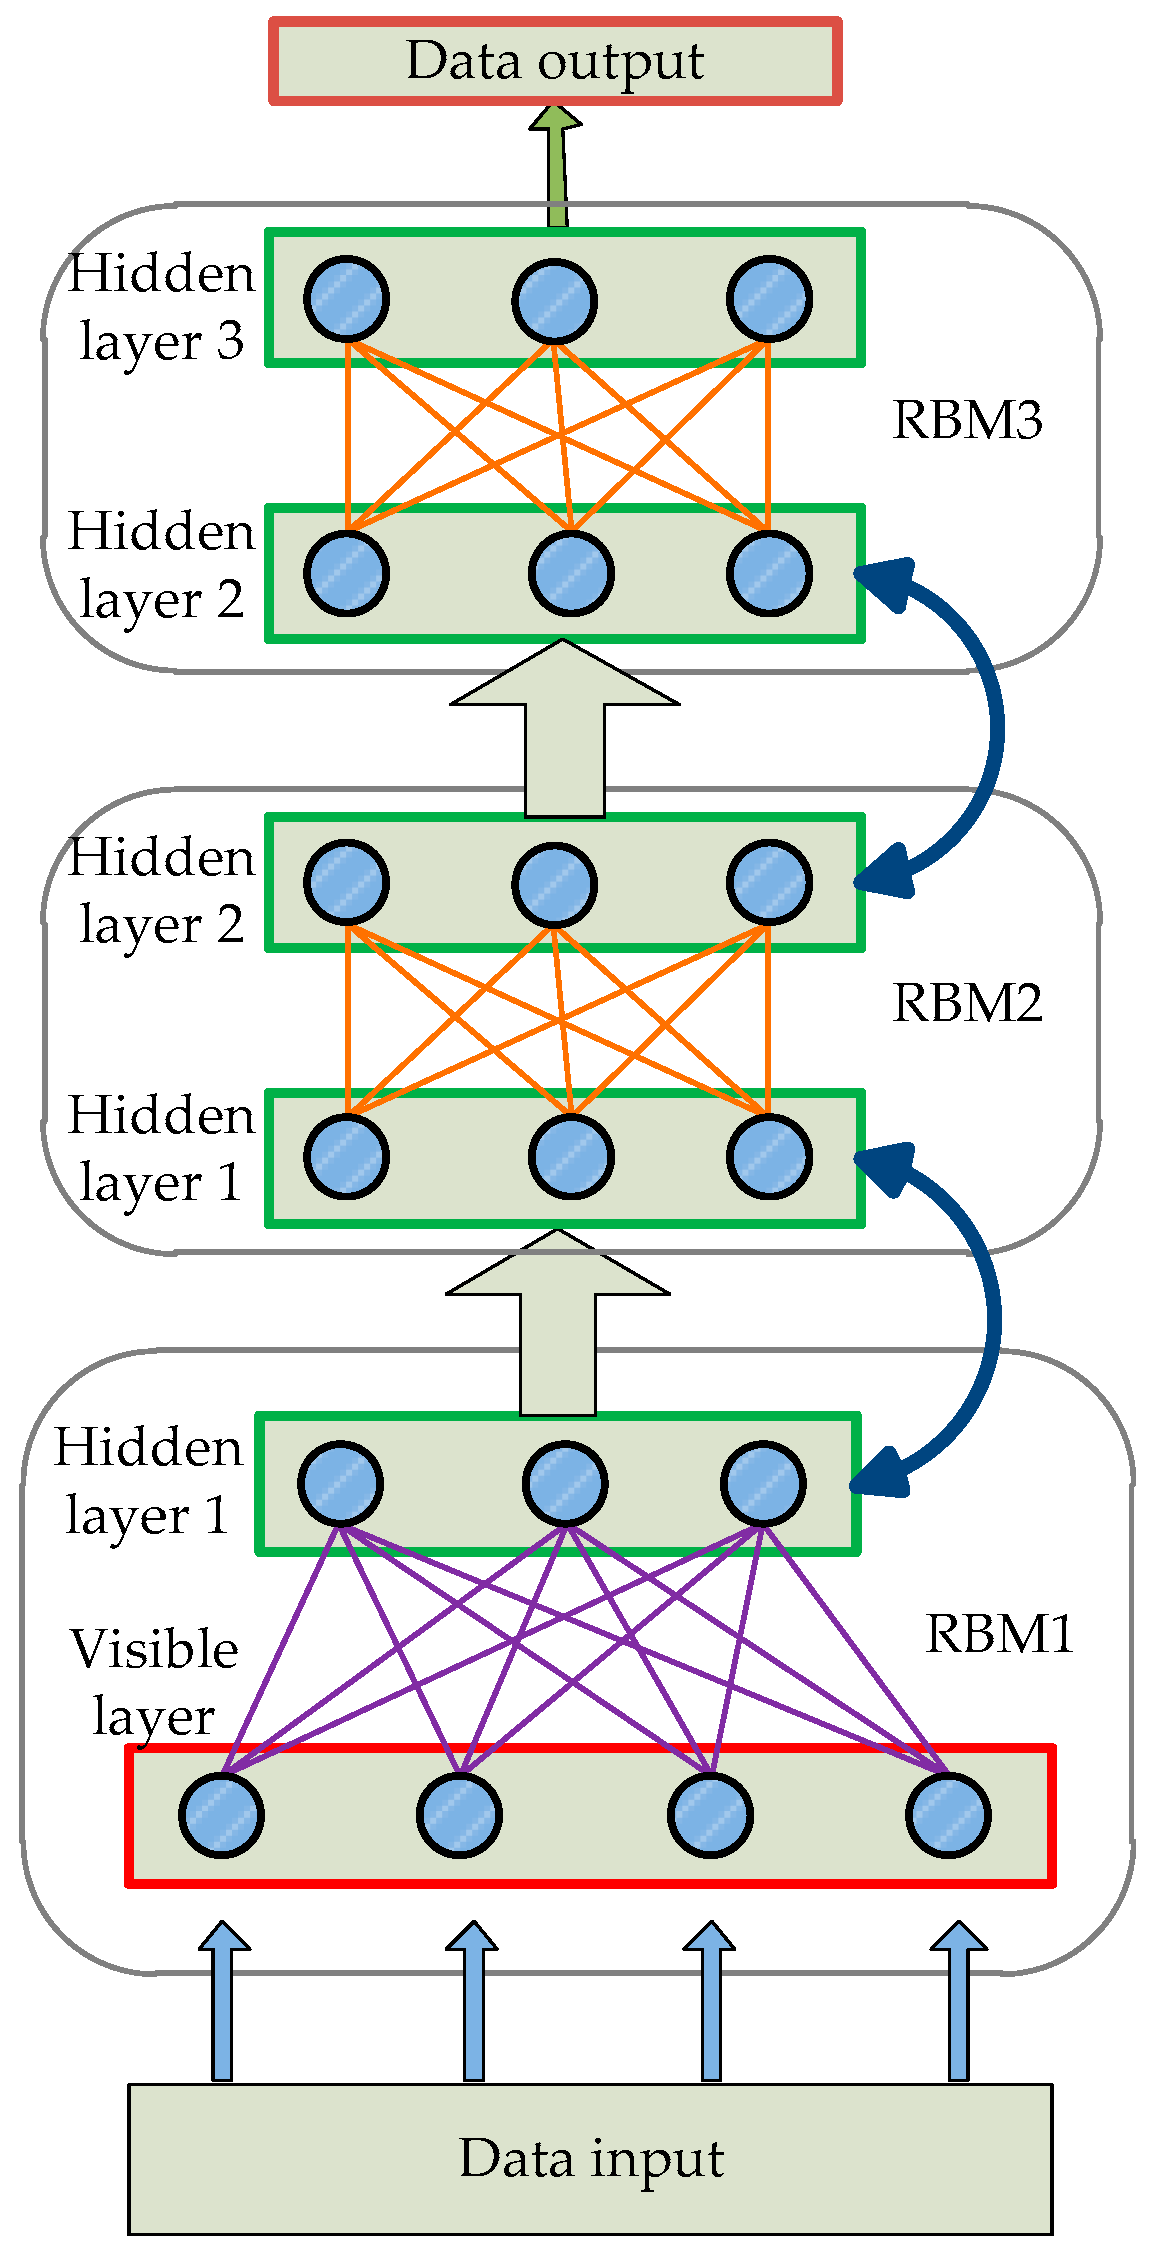
2.3. Prediction Model Based on Deep Learning
This section proposes a prediction model of algal blooms based on the deep learning method previously described. The entire prediction model is based on a five-layered architecture comprised of one visible layer, three hidden layers, and one output layer, as shown in
Figure 4. The visible layer is used for data input of algal blooms. It is formed into three RBMs in order to learn complex relations from the raw data together with the three hidden layers. The output layer is used to explore the phytoplankton density, which is the main characteristic of algal blooms.
The learning algorithm of the algal blooms prediction model includes the following steps:
Step 1. Take the monitored raw data as input of the prediction model based on prior knowledge.
Step 2. Preprocess the raw data from samples by excluding abnormal data and normalization. Then randomly split the samples into training data and testing data.
Step 3. Select the appropriate model structure and initialize the parameters of the DBN. Then take five-layered architecture as the prediction model.
Step 4. Input training data and pretrain the DBN through unsupervised learning. Each RBM is trained individually by contrastive divergence learning to obtain fitting parameters. The first RBM layer can get the network parameters by comparing the divergence of the fast learning algorithm, then extracting the primary features of the environmental parameters. Similarly, after training processes of the second and third RBM layers, the characteristics of the influenced factor can be extracted based on the primary results, and the weights of the different environmental parameters can be determined automatically. Then the deep learning network training is completed.
Step 5. Finetune the parameters of DBN using the back-propagation algorithm according to the difference between the labeled target and rough prediction value. Stop training if the mean squared error is smaller than the expectation.
Step 6. Test the trained model using testing data. If the prediction result is unsatisfactory, then return to Step 3 and retrain.
2.4. Model Performance Criterion
In this study, three popular criteria are used to evaluate the performance of the proposed model. These are the root mean square error (RMSE) and mean relative error (MRE). The selection of model parameters is related considerably to the performance of prediction, which includes the number of hidden nodes and the learning rate of the RBM. The number of hidden nodes is a critical parameter to the prediction model as too few hidden nodes may not possess sufficient ability to extract latent relationships between the density of phytoplankton cells and various environmental parameters, whereas too many hidden nodes will result in overfitting and poor prediction performance. However, no existing theory can calculate the aforementioned parameters. Therefore, selecting the optimal architecture of DBN remains to be a difficult task. In this study, the number of hidden nodes is selected based on trial and error in terms of RMSE, as well as the learning rate and iteration number. However, due to the limitation of time and energy, the number of input nodes is selected as 12, which is the same as the number of parameters used in the model.
3. Results and Discussion
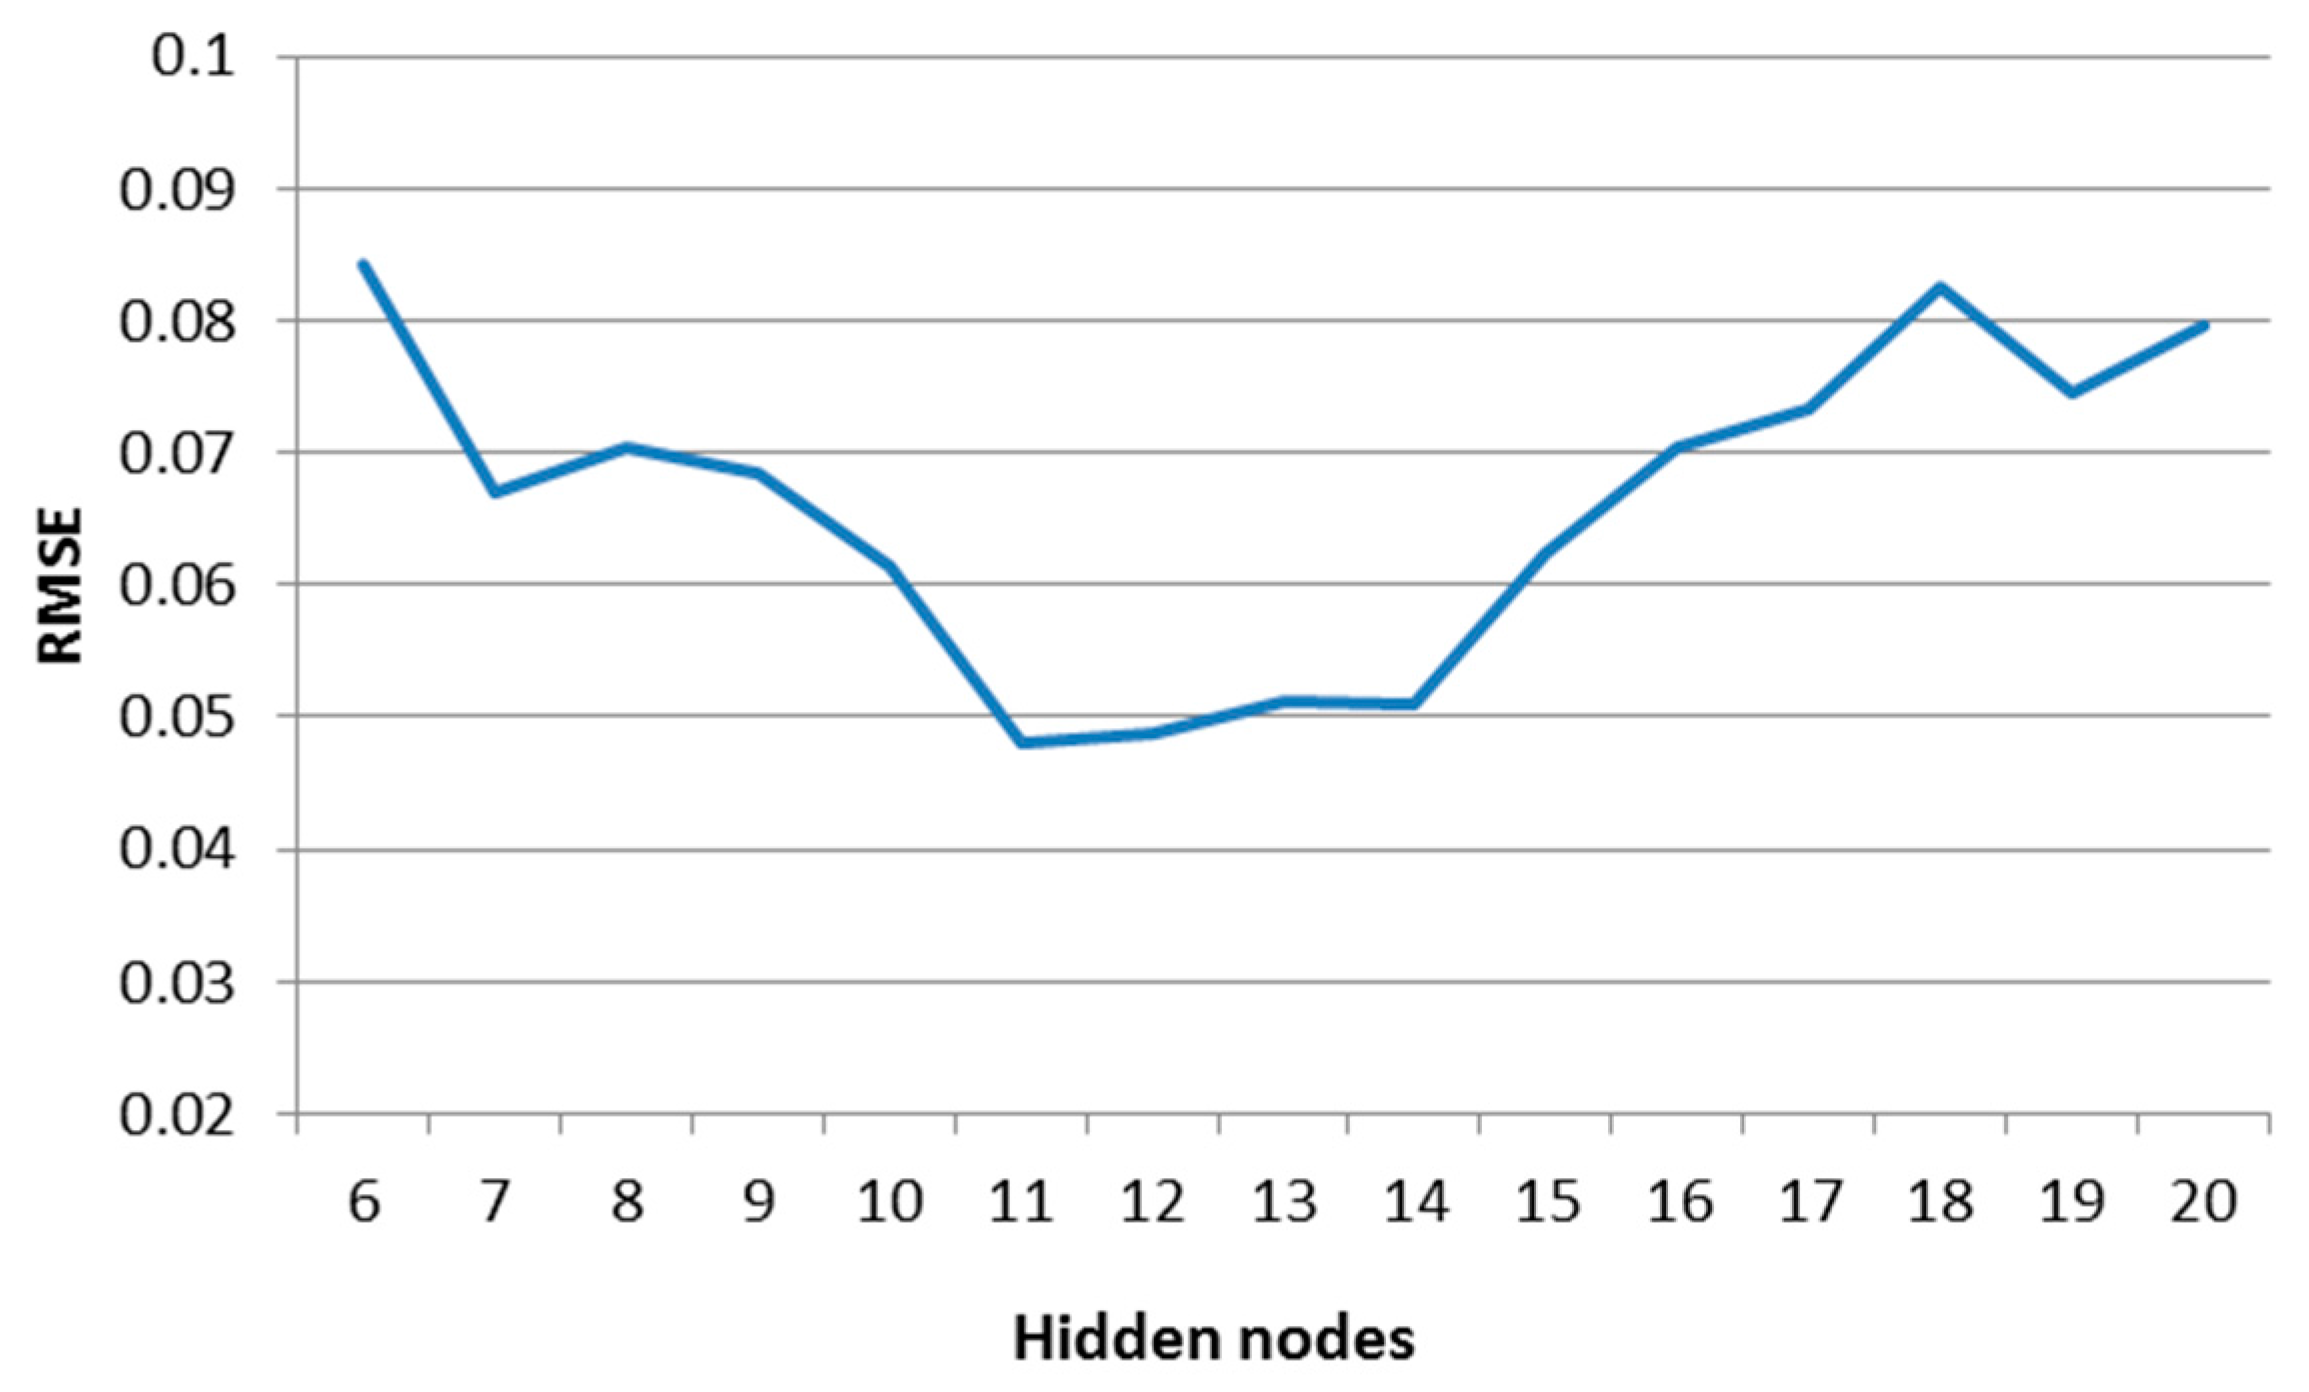
In the prediction model, the depth of the network, number of the input nodes, number of the hidden nodes and training parameters all have great influence on the prediction result. In this paper, different architectures of DBN were constructed and tested in order to determine the optimum number of nodes in the hidden layer. Fifteen levels of the number of hidden nodes ranging from 6 to 20 were used in the experimentation. We take 970 samples to train the fitting model. During the training period, the learning rate and iteration number were fixed as 0.01 and 1000, which are most common. The training performance of the DBN is shown in
Figure 5.
Figure 5 shows that the DBN model differed in number of nodes in the hidden layer, as it optimized with eleven nodes in the hidden layer. When the hidden nodes were fixed as 11 and the iteration number was fixed as 1000, the performance of DBN in different learning rates is presented in
Table 1. It can be observed that the DBN performs better when the learning rate is 0.001. Experimentations were done when the hidden nodes and learning rate were fixed as 11 and 0.001, while the iteration number increases gradually from 1000 to 10,000. We found that there was no significant improvement in the performance, but the training time was longer.
From the above analysis, an optimal architecture of a deep neural network of 12-11-11-11-1 was built, which means 12 nodes in a visible layer and 11 nodes in three hidden layers and one node in the output layer. The learning rate of the RBM is 0.001 and 1000 iterations of the model training were conducted.
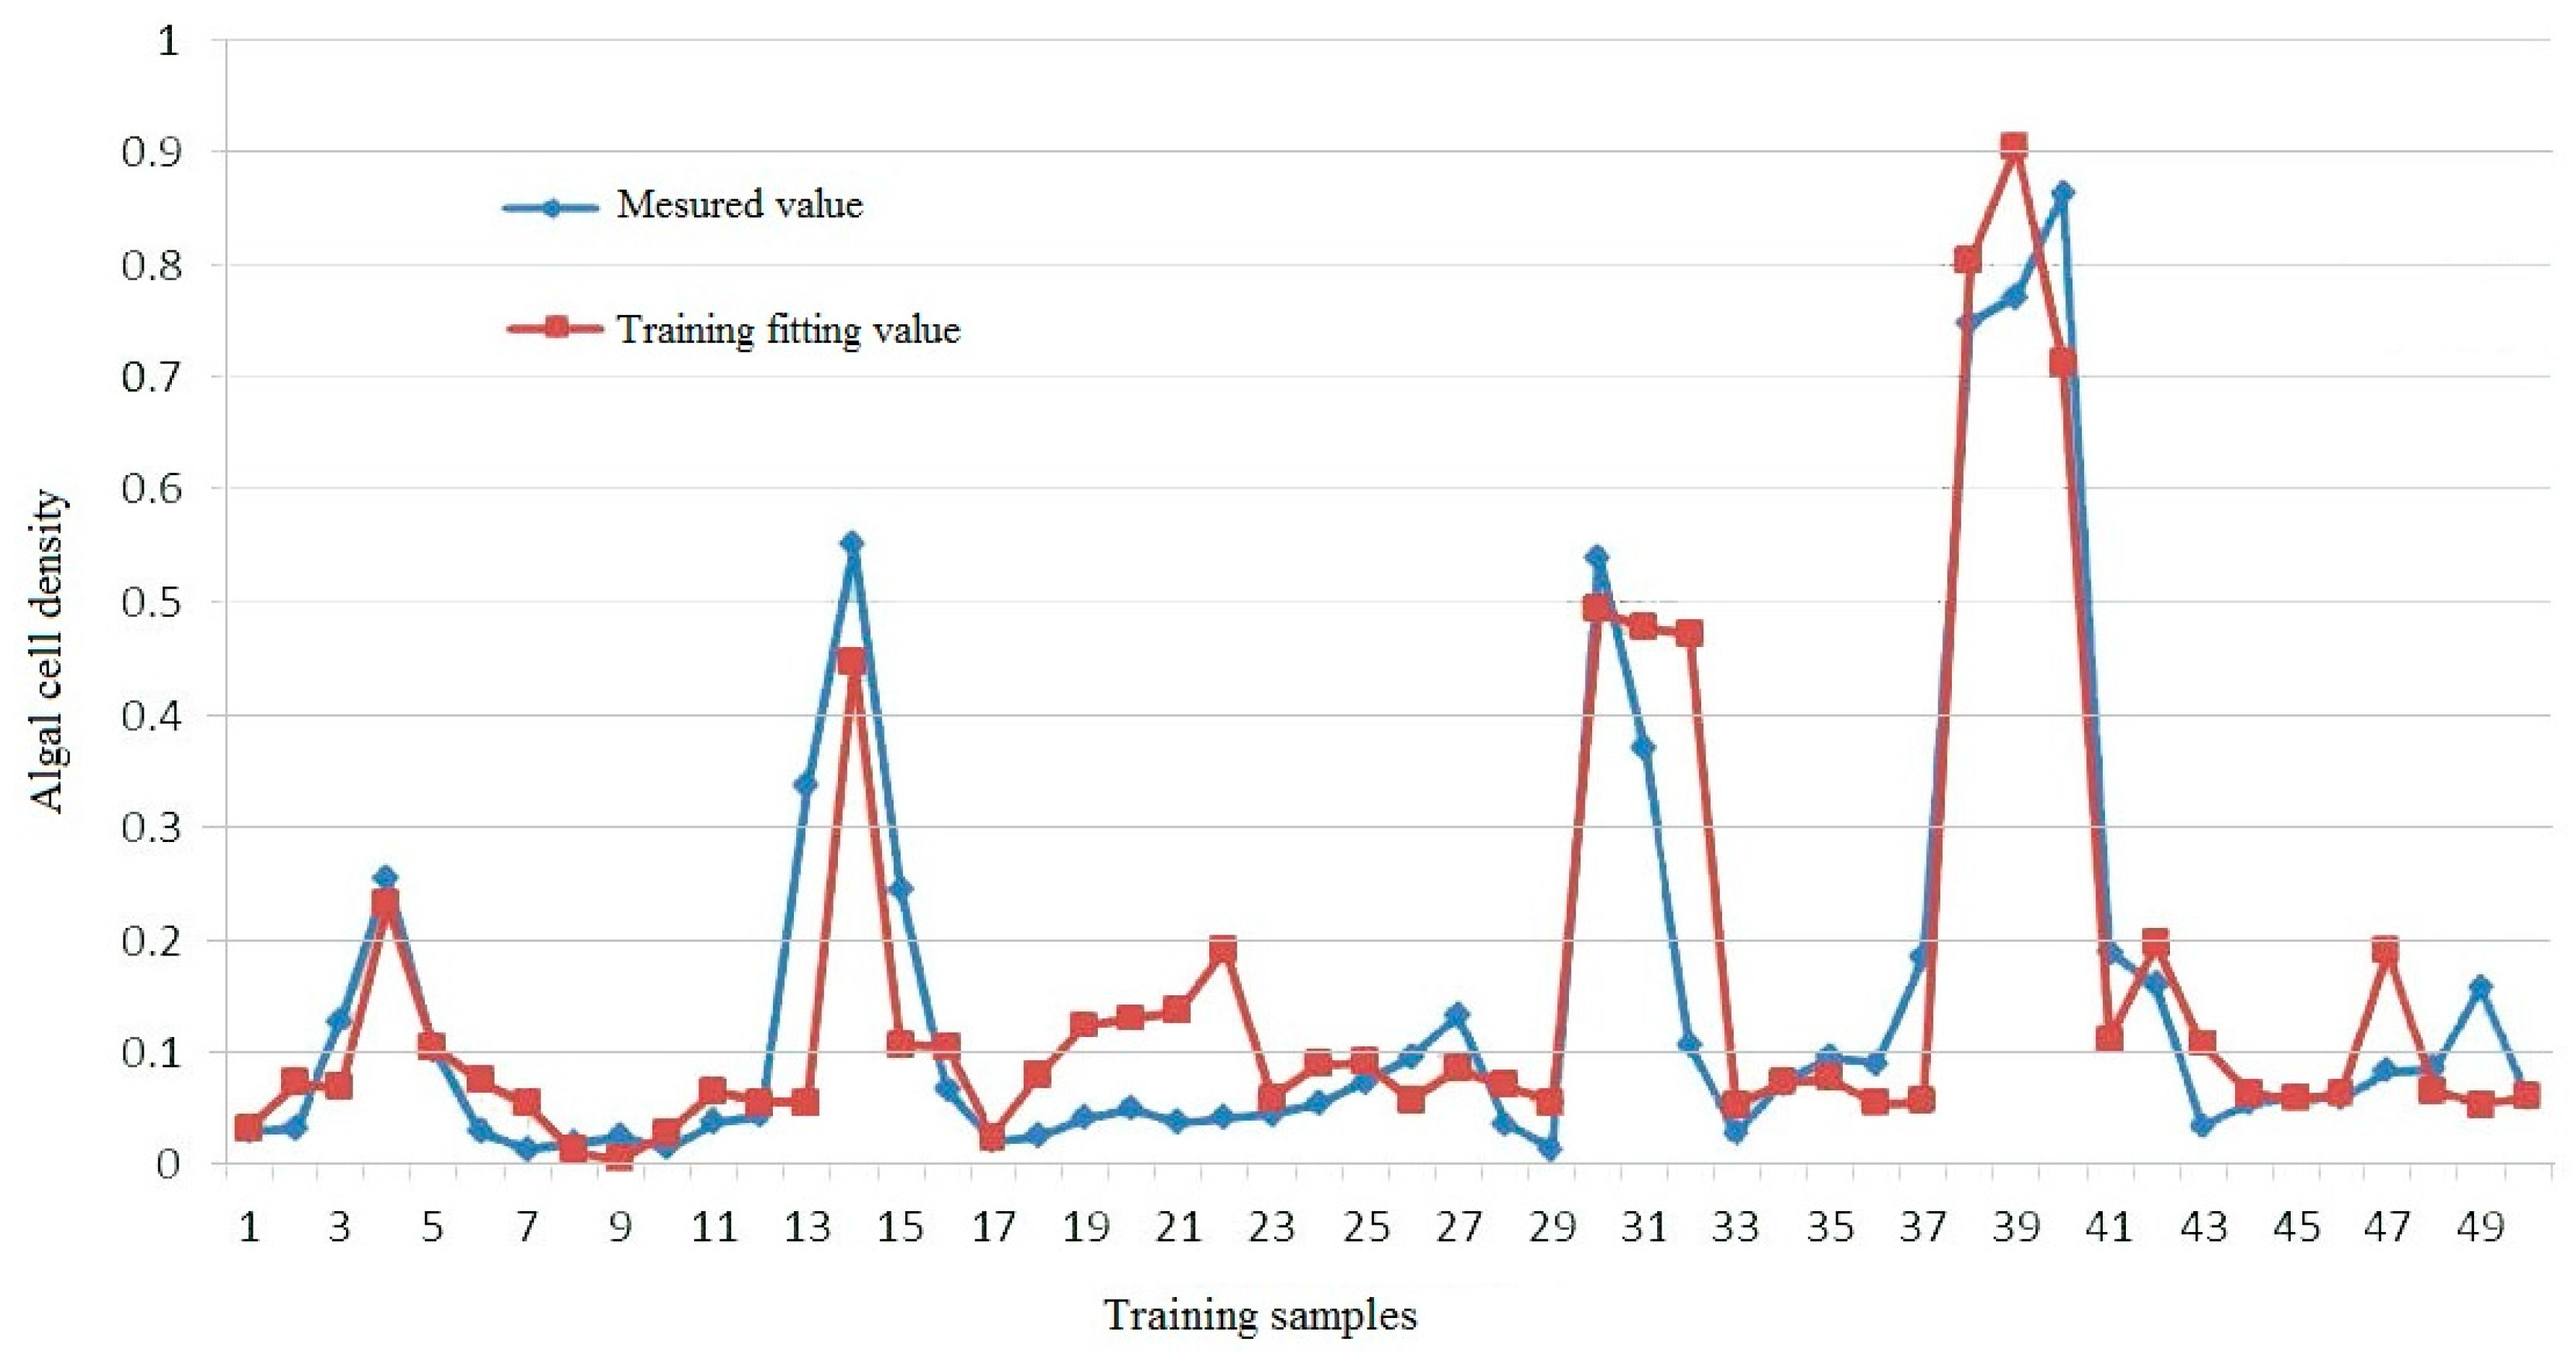
Part of the comparison of the measured value and training fitting value with the deep learning model is shown in
Figure 6. The RMSE of the training fitting error is 0.0438, the MRE is 17.14%, and the degree of fitting is 82.64%. It can be seen that the model fitted the measured values well, especially the crest value of the algal cell density, which is the high incidence of algal bloom.
A comparison study was conducted between the deep learning model and the traditional BP neural network [
32] when applied to the prediction of algal blooms in study areas. For the sake of experimental contrast, the BP neural network adopted the same structure as the deep learning model. We take 970 samples to train the fitting model and 30 samples to verify the model.
The performances of the comparison tests are listed in
Table 2. The prediction RMSE of the deep learning model is 0.0475, the MRE is 18.72%, and the degree of fitting is 84.78%. The prediction RMSE of the BP neural network is 0.1286, the MRE is 25.93% and the degree of fitting is 64.81%. The comparison reveals that the deep learning model performs more effectively than the BP neural network. The deep learning model considerably outperforms the BP neural network regarding the training error. The performance of the deep learning model on the test error remains nearly the same as that on the training error, whereas the BP neural network performs much more poorly on the test error than on the training error. Based on these comparisons, the deep learning model clearly has better generalization than the BP neural network, which will have a positive effect in practical applications.
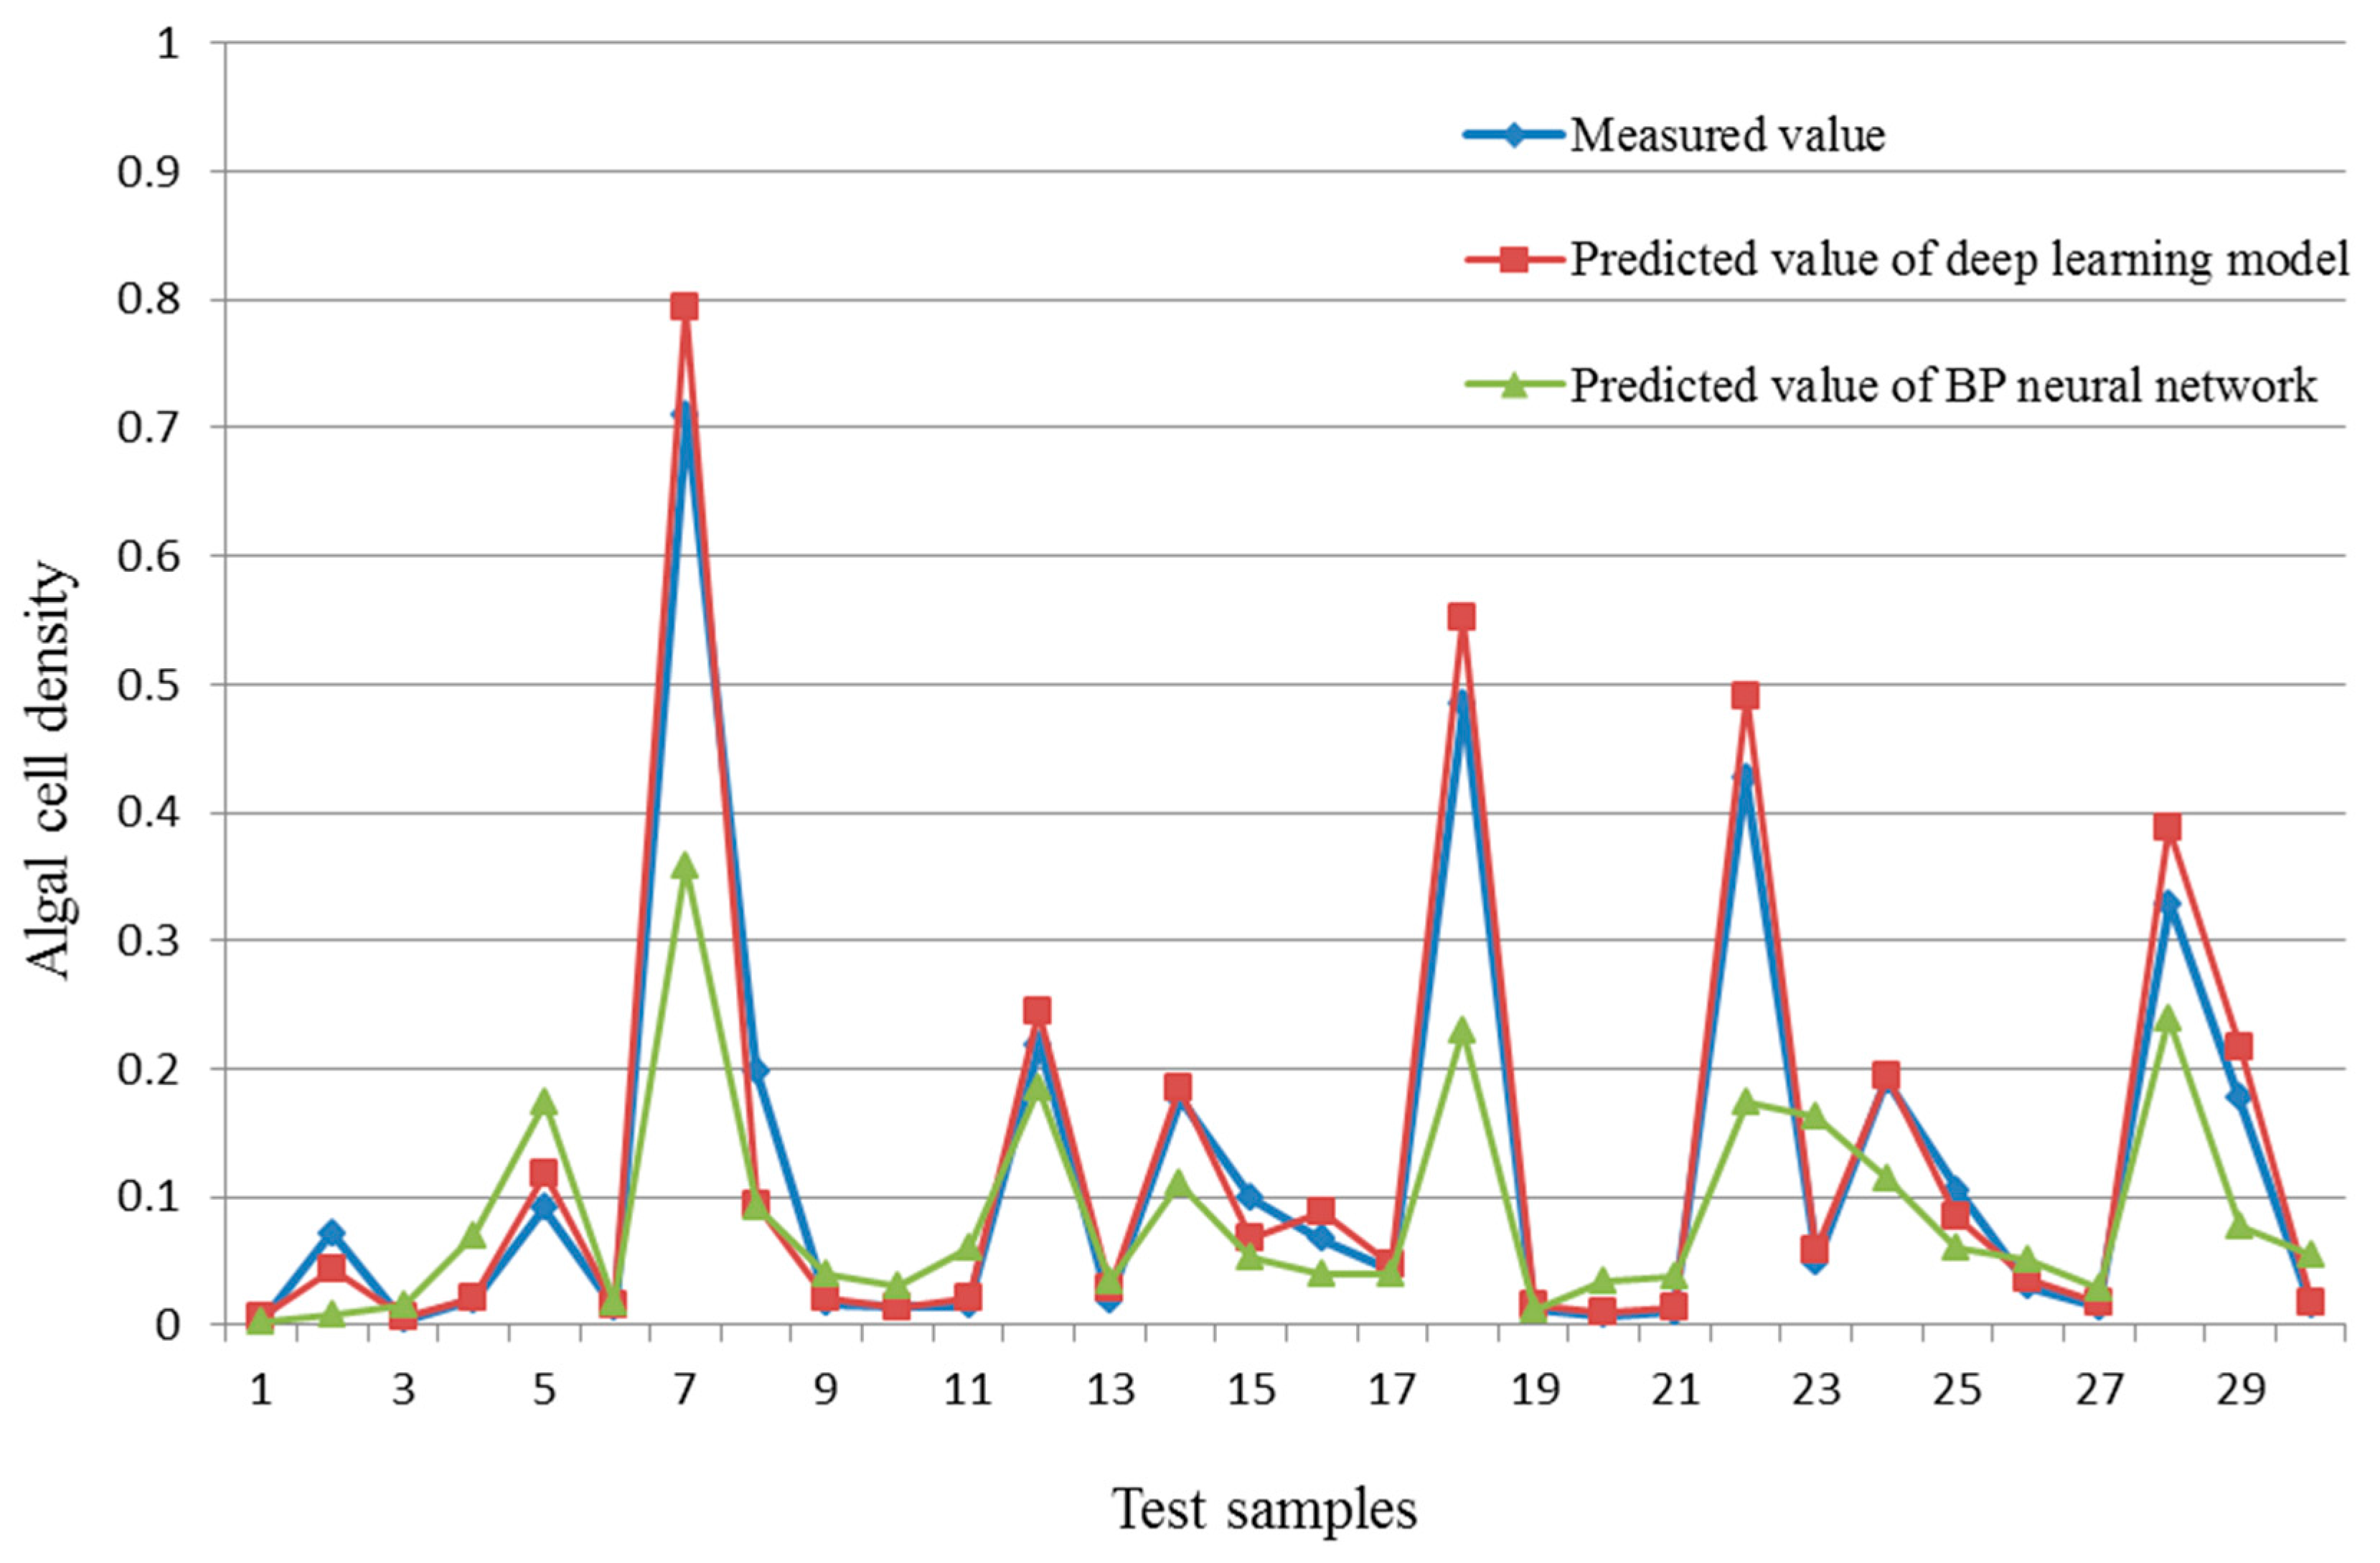
The test results are presented in
Figure 7. The predicted values of the deep learning model are clearly nearer to the measured values of phytoplankton density than those of the BP neural network. The predicted values of the deep learning model show high consistency with the real values, whereas the forecast results of the BP neural network are quite different to the actual values at some points. In particular, the crest value prediction accuracy of the deep learning model is considerably superior to that of the BP neural network. For example, at the seventh test sample, the predicted value of the deep learning model is 0.7941, which is closer to the measured value (0.7094) than the predicted value of the BP neural network (0.3586).
The comparison reveals that the BP neural network can catch the fluctuation trend, but the direction accuracy is poor, especially the crest value. The deep learning model predicted value fitted the measured value better, and it can predict the variation trend of the algal cell density well. The deep belief network can, unsupervised, pretrain all the stacked RBM layers, and make the minimum difference between the input and the output based on the rule of minimum DBN network structure energy, which enables it to have a better ability in obtaining a feature value. As such, DBN can work better than the BP neural network in the prediction of the random data.
Deep learning can abstract the phenomenon characteristics layer by layer using large amounts of training data, so it can find dominant factors from high-dimensional parameters through the powerful ability of integrating data and extracting features. Compared with the traditional shallow learning, deep learning has more advantages, which have been verified and applied in many areas. In this study, we attempted to predict the algal blooms using deep learning as a new way for marine disaster prediction.
4. Conclusions
The algal bloom, as a typical phenomenon of the marine ecological environment, has a complex relationship with many factors related to the meteorological, hydrological, marine biological and chemical conditions. Furthermore, different areas have their dominant factors with highly complicated nonlinear characteristics. Compared with the traditional shallow neural network, such as the BP neural network, the experimental results show that the deep learning based model performs better in terms of generalization and has higher accuracy in predicting algal blooms. The deep learning model has a high degree of learning and generalization ability, which can better meet the needs of the algal bloom prediction. Furthermore, the deep learning model can extract more detailed relationships between the density of phytoplankton cells and various environmental parameters by learning data samples from a lower to a higher level. By acquiring more training samples and selecting better model parameters, the deep learning based approach will possess even greater ability in predicting algal blooms. It should be noted that investigating complex human-environment dynamics needs a platform within which effective solutions can be possibly developed in an interdisciplinary, collaborative and timely manner with the introduction of new data, methods and computing power.


 ,
, 


