Article

Comparison of Cultivated Landscape Changes under Different Management Modes: A Case Study in Sanjiang Plain

1
Northeast Institute of Geography and Agroecology, Chinese Academy of Sciences, Changchun 130012, China
2
University of Chinese Academy of Sciences, Beijing 100049, China
3
International Center for Climate and Global Change Research, School of Forestry and Wildlife Sciences, Auburn University, Auburn, AL 36849, USA
4
Institute of Geographic Sciences and Natural Resources Research, Chinese Academy of Sciences, Beijing 100101, China
5
College of Resources and Environment, Northeast Agricultural University, Harbin 150030, China
6
College of Earth Science, Jilin University, Changchun 130061, China
7
College of Arts & Sciences, Beijing Union University, Beijing 100083, China
*
Author to whom correspondence should be addressed.
Sustainability 2016, 8(10), 1071; https://doi.org/10.3390/su8101071
Submission received: 2 July 2016 / Revised: 6 October 2016 / Accepted: 14 October 2016 / Published: 22 October 2016
(This article belongs to the Section Environmental Sustainability and Applications)

Abstract

:
Understanding the historical change of agricultural landscape patterns is the basis for promoting the sustainable development of cultivated land, as well as appropriate decision-making. In order to analyze spatio-temporal changes of cultivated land in Sanjiang Plain, from 1985–2015, Landsat Thematic Mapper (TM) and Operational Land Imager (OLI) were used to reconstruct satellite data of land use and land cover. Additionally, twelve landscape indices were selected to analyze landscape pattern changes and to compare the differences of cultivated landscape changes between the agricultural region and the reclamation region. Studies suggested that during the past 30 years, cultivated land in the study area grew rapidly, with a rapid growth of paddy fields and a slow reduction of dry farmland. This trend was more obvious in the reclamation region than it was in the agricultural region, where both dry farmland and paddy fields showed a growth trend in the past 30 years. Our study showed that paddies have become the dominant agricultural landscape and that fragmentation of paddy fields has decreased, while dry farmland has increased over the past 30 years, within the entire study area. Different management modes have caused major differences between the agricultural region and the reclamation region.

1. Introduction

As an important part and a major cause of global environmental change [1], land use and cover change (LUCC) has been an important research subject for world environmental change and sustainable development. LUCC can affect water cycling [2,3], regional climate [4,5], food production [6,7], and greenhouse gas emissions [8,9]. The Global Land Project (GLP), which was sponsored by the International Geosphere-Biosphere Programme (IGBP) and the International Human Dimensions Programme (IHDP), began in 2005, and emphasized the integration and simulation of the coupled human-environment system [10,11]. LUCC is driven by multi-scale driving forces [10,12], such as the global economy, international policies, climate change, and regional soil properties. Therefore, assessing land-system dynamics requires a focus on the interactions between different drivers and policy shifts that often lead to emergent properties and nonlinear outcomes [13]. The GLP also emphasized the impact of different management modes and policies on LUCC in studying its driving forces [11,14].
Agriculture plays a vital role in regulating climate change and ensuring food security [6]. As an important mode of land use, information on cultivated land distribution and change is of critical importance for assessing food security [7,15], as well as greenhouse gas emissions [8,16]. This is especially apparent in China, which is challenged to feed around 20% of the world’s population with less than 7% of the world’s cultivated land [17]. Agricultural landscapes are mosaics of physical and human-managed patches that vary in size, shape, and arrangement [18]. Agricultural landscape pattern is the spatial representation of agricultural ecosystems, which directly affect the stability, vulnerability, and production functions of agricultural ecosystems [6,8]. In return, changes in ecological processes may result in the variation of landscape spatial patterns [19]. Quantitatively assessing the historical change of land use and landscape patterns is necessary for understanding the evolution of cultivated land. In order to realize the sustainable development of agriculture in the future, the assessment of agricultural landscape changes can also provide scientific information for policy-makers.
Substantial evidence shows that Earth has warmed since the middle of the 19th century [20,21,22,23], and carbon dioxide (CO2) levels in the atmosphere have increased significantly [21]. Over the next few decades, some of the most profound and direct impacts of climate change will be on agricultural and food systems [22], and these impacts are more obvious at high and mid-latitudes [23]. One method to respond to global climate change is through the adjustment of planting patterns of cultivated land [24]. In Northeast China, which is located at mid-high latitudes, climate change has led to the northward expansion of cropping areas, especially paddy fields [25]. Understanding the cultivated landscape change in Northeast China is of great significance for regional food security and regional sustainable development [26,27].
In China, there is a special organization called the reclamation region which includes state-owned farm areas with detailed land planning. The reclamation region has developed into a social system with 1785 state-owned farms, a population of 13.22 million, 6.61 million hectares of arable land (about 5% of the national arable land), and many business enterprises. The property rights system of the reclamation region is quite different from the agricultural region, where the cultivated land is claimed by farmers freely [28,29,30]. In the agricultural region, the farmland is collectively owned and farmers control the land use, management, and benefit rights. All the cultivated land in the reclamation area is state-owned, but the farm governors own the land-use rights and can transfer land management rights to other farmers or farm workers. Farm workers manage the land under the government of farm governors. Due to different property rights systems, the two regions operate different management modes. The operation in the reclamation region is based on an enterprise mode, where farm governors decide the crop types and species, and farm workers obey these decisions to plant crops. By adjusting the planting structure, the reclamation area makes planned production decisions to meet the country’s food needs and achieve balance between food supply and demand in the market. In the agricultural region, a household responsibility system is operated where farmers decide the crop types and species freely based on changes in the market. Several studies have compared the differences between these two regions from different aspects, such as comprehensive benefits [28], farmers’ management behaviors [29], and settlement systems [30]. Few studies have paid attention to the comparison of LUCC and the evolution of cultivated land. Du et al. chose two time intervals (2000 and 2013) to compare the differences of cultivated landscape pattern change due to the rice paddy expansion between the agricultural region and the reclamation region [24]. In general, the comparison of LUCC and landscape change in the two different regions is still lacking, especially on a long time scale. The comparison of cultivated landscape changes in these two regions helps in establishing an understanding of the impact of different management regimes on landscape changes.
Sanjiang Plain, which is located in Northeast China, includes the largest freshwater marshy wetland in China and is an important commodity grain base of China. Large-scale reclamation has occurred in Sanjiang Plain since the 1950s, turning Sanjiang Plain from the “Northern Wilderness” to the “Northern Granary.” Many studies have looked at spatio-temporal changes of cultivated land in some portions of the Sanjiang Plain or over the whole region [24,25,26,27], but these studies did not separate dry farmland from paddy fields. To fully understand the evolution of cultivated land, a study of landscape changes across different farmlands is needed [22,23]. Fujin City is located in the hinterland of Sanjiang Plain, existing in both the agricultural region and the reclamation region [28,29,30]. Cultivated land increased gradually since the 1950s and paddy fields began to be planted after 1976, leading to an increased change in land use pattern. The land use pattern of Fujin is a microcosm of the entire Sanjiang Plain. The objectives of this study are: (1) to analyze the spatio-temporal changes of cultivated land in the study area; (2) to characterize the LUCC characteristics and compare the spatial pattern of the main LUCC progress between the agricultural region and the reclamation region; and (3) to compare the cultivated landscape changes under different management modes by landscape pattern indices from three aspects (space configuration characteristics, patch characteristics, and fragmentation characteristics). Our study aims to discover the impact of different management modes on the agricultural landscape, and provide a scientific basis for cultivated landscape planning as well as sustainable development of land resources in Sanjiang Plain.

2. Materials and Methods

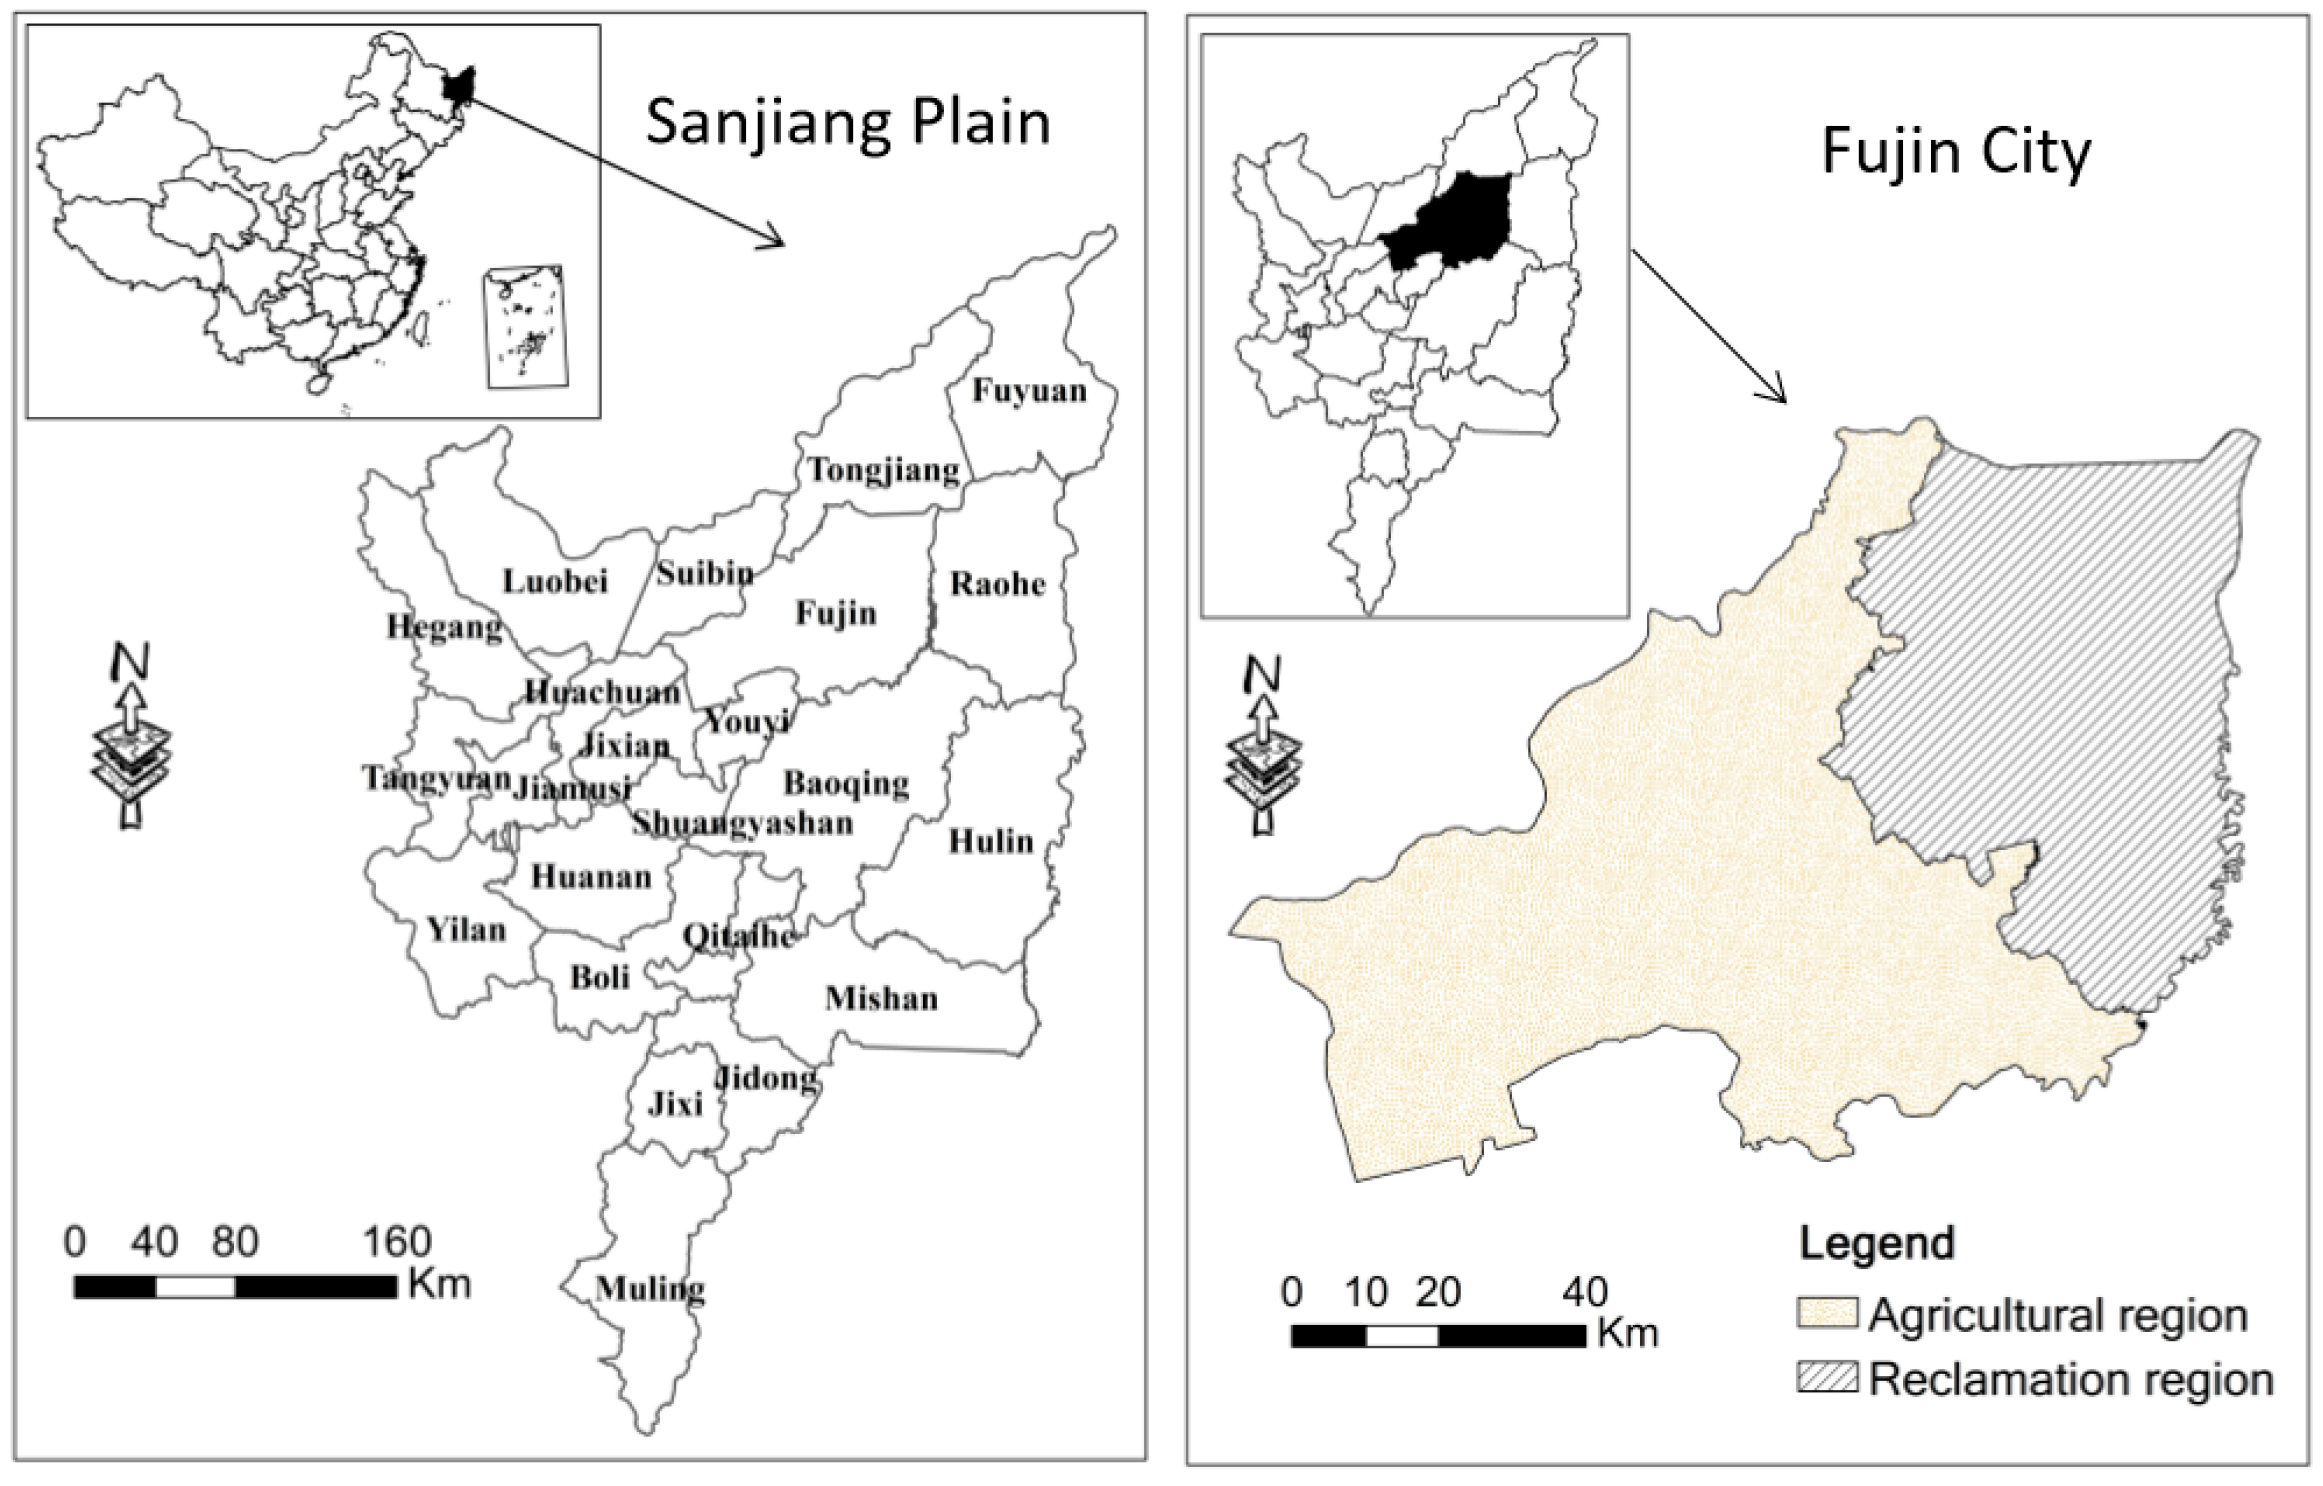
2.1. Geographical Setting

This work was conducted in the Sanjiang Plain, mainly in Fujin City (46°45′15″–47°37′25″ N, 131°25′33″–133°26′58″ E). Fujin is located in the north of Heilongjiang Province, covering an area of 8227 km2. The agricultural region (about 4907 km2) encompasses 11 towns and 266 villages while the reclamation region (about 3320 km2) includes three state farms and part of the Hongxinglong farm. Fujin (Figure 1) is located on an alluvial plain deposited by several major rivers (the Naoli River, the Qixing River, and the Songhua River). The average annual precipitation is about 547.8 mm. The average annual temperature is 21.2 °C and the warmest month is July, with a maximum average temperature of 27.6 °C, while the minimum average temperature is −19.3 °C in January. Fujin is rich in surface water as well as transportation networks. In recent years, Fujin accelerated the transformation of low-yielding fields and promoted contiguous high standard grain construction, leading to profound changes of land use patterns.

2.2. Data Source

Based on previous studies about LUCC, we developed the land use and land cover data in the study area at five time nodes: 1986, 1995, 2000, 2005, and 2010. Landsat Thematic Mapper (TM) images were used to produce the maps in 1986, 1995, 2000, 2005, and 2010. Landsat Operational Land Image (OLI) images were used to update the data to 2015. The entire interpretation accuracy was no less than 95%, through the verification and correction by field sampling and historical records, including aerial photos, as well as statistical yearbooks.

2.3. Classification System

In order to analyze the LUCC of cultivated land, the study area was classified into eight categories: paddy field, dry farmland, forest land, grassland, water bodies (including rivers, lakes, and ponds), settlement (urban and rural construction), wetland (marshland and bottomland), and other unused land (including sandy land, salina, bare soil, and bare rock).

2.4. Data Analyses

2.4.1. Spatio-Temporal Changes of Cultivated Land

A transition probabilities matrix for LUCC was used to analyze the dynamic change between different land use types in two periods. It was calculated by:
P i j t = ( S i j t / S i t ) × 100 % ,
where P i j t is the transition probability for land use from category i to j during the study period; i and j are the land use types; S i j t is the conversion area from category i to j during the time interval t and t + 1; S i t is the area of type i at time t. Equation (1) helps us to understand the transitions between land use types. However, it does not permit comparison of the land use intensities associated with different land use types, because different land use types occupied different fractions of the whole study area. In this situation, we also used transition probability Pij (Equation (2)) as a supplement.
P i j = ( S i j t / S T ) × 100 % ,
where ST is the total area. In order to obtain spatial distribution, we split the whole study area into 72 columns and 53 rows of cells that were 2 km on each side, and calculated the spatial distribution of Pij of cultivated land in each grid using ArcGIS software (ArcGIS, 10.2, Esri, Redlands, CA, USA) and Application Markup language (AML). To our knowledge, this work is the first to spatialize the transition probability index (Pij) in order to analyze land use and land cover changes.

2.4.2. Landscape Change

Fragstats software (Fragstats, 4.2, Oregon State University: Corvallis, OR, USA) was used, according to previous studies [31,32,33,34,35,36,37], and twelve indices were selected to analyze landscape patterns. The mean area (AREA_MN), largest patch index (LPI), patch density (PD), and connect index (CONNECT) were used to analyze the dynamic change of space configuration characteristic. Patch character was analyzed by percentage of landscape (PLAND), edge density (ED), landscape shape index (LSI), and the mean shape (SHAPE_MN). We used the patch cohesion index (COHESION), landscape division index (DIVISION), splitting index (SPLIT), and aggregation index (AI) to analyze the fragmentation character. Detailed descriptions of these twelve indices that comprise the landscape metrics of this study are shown in Table 1 [38].

3. Results

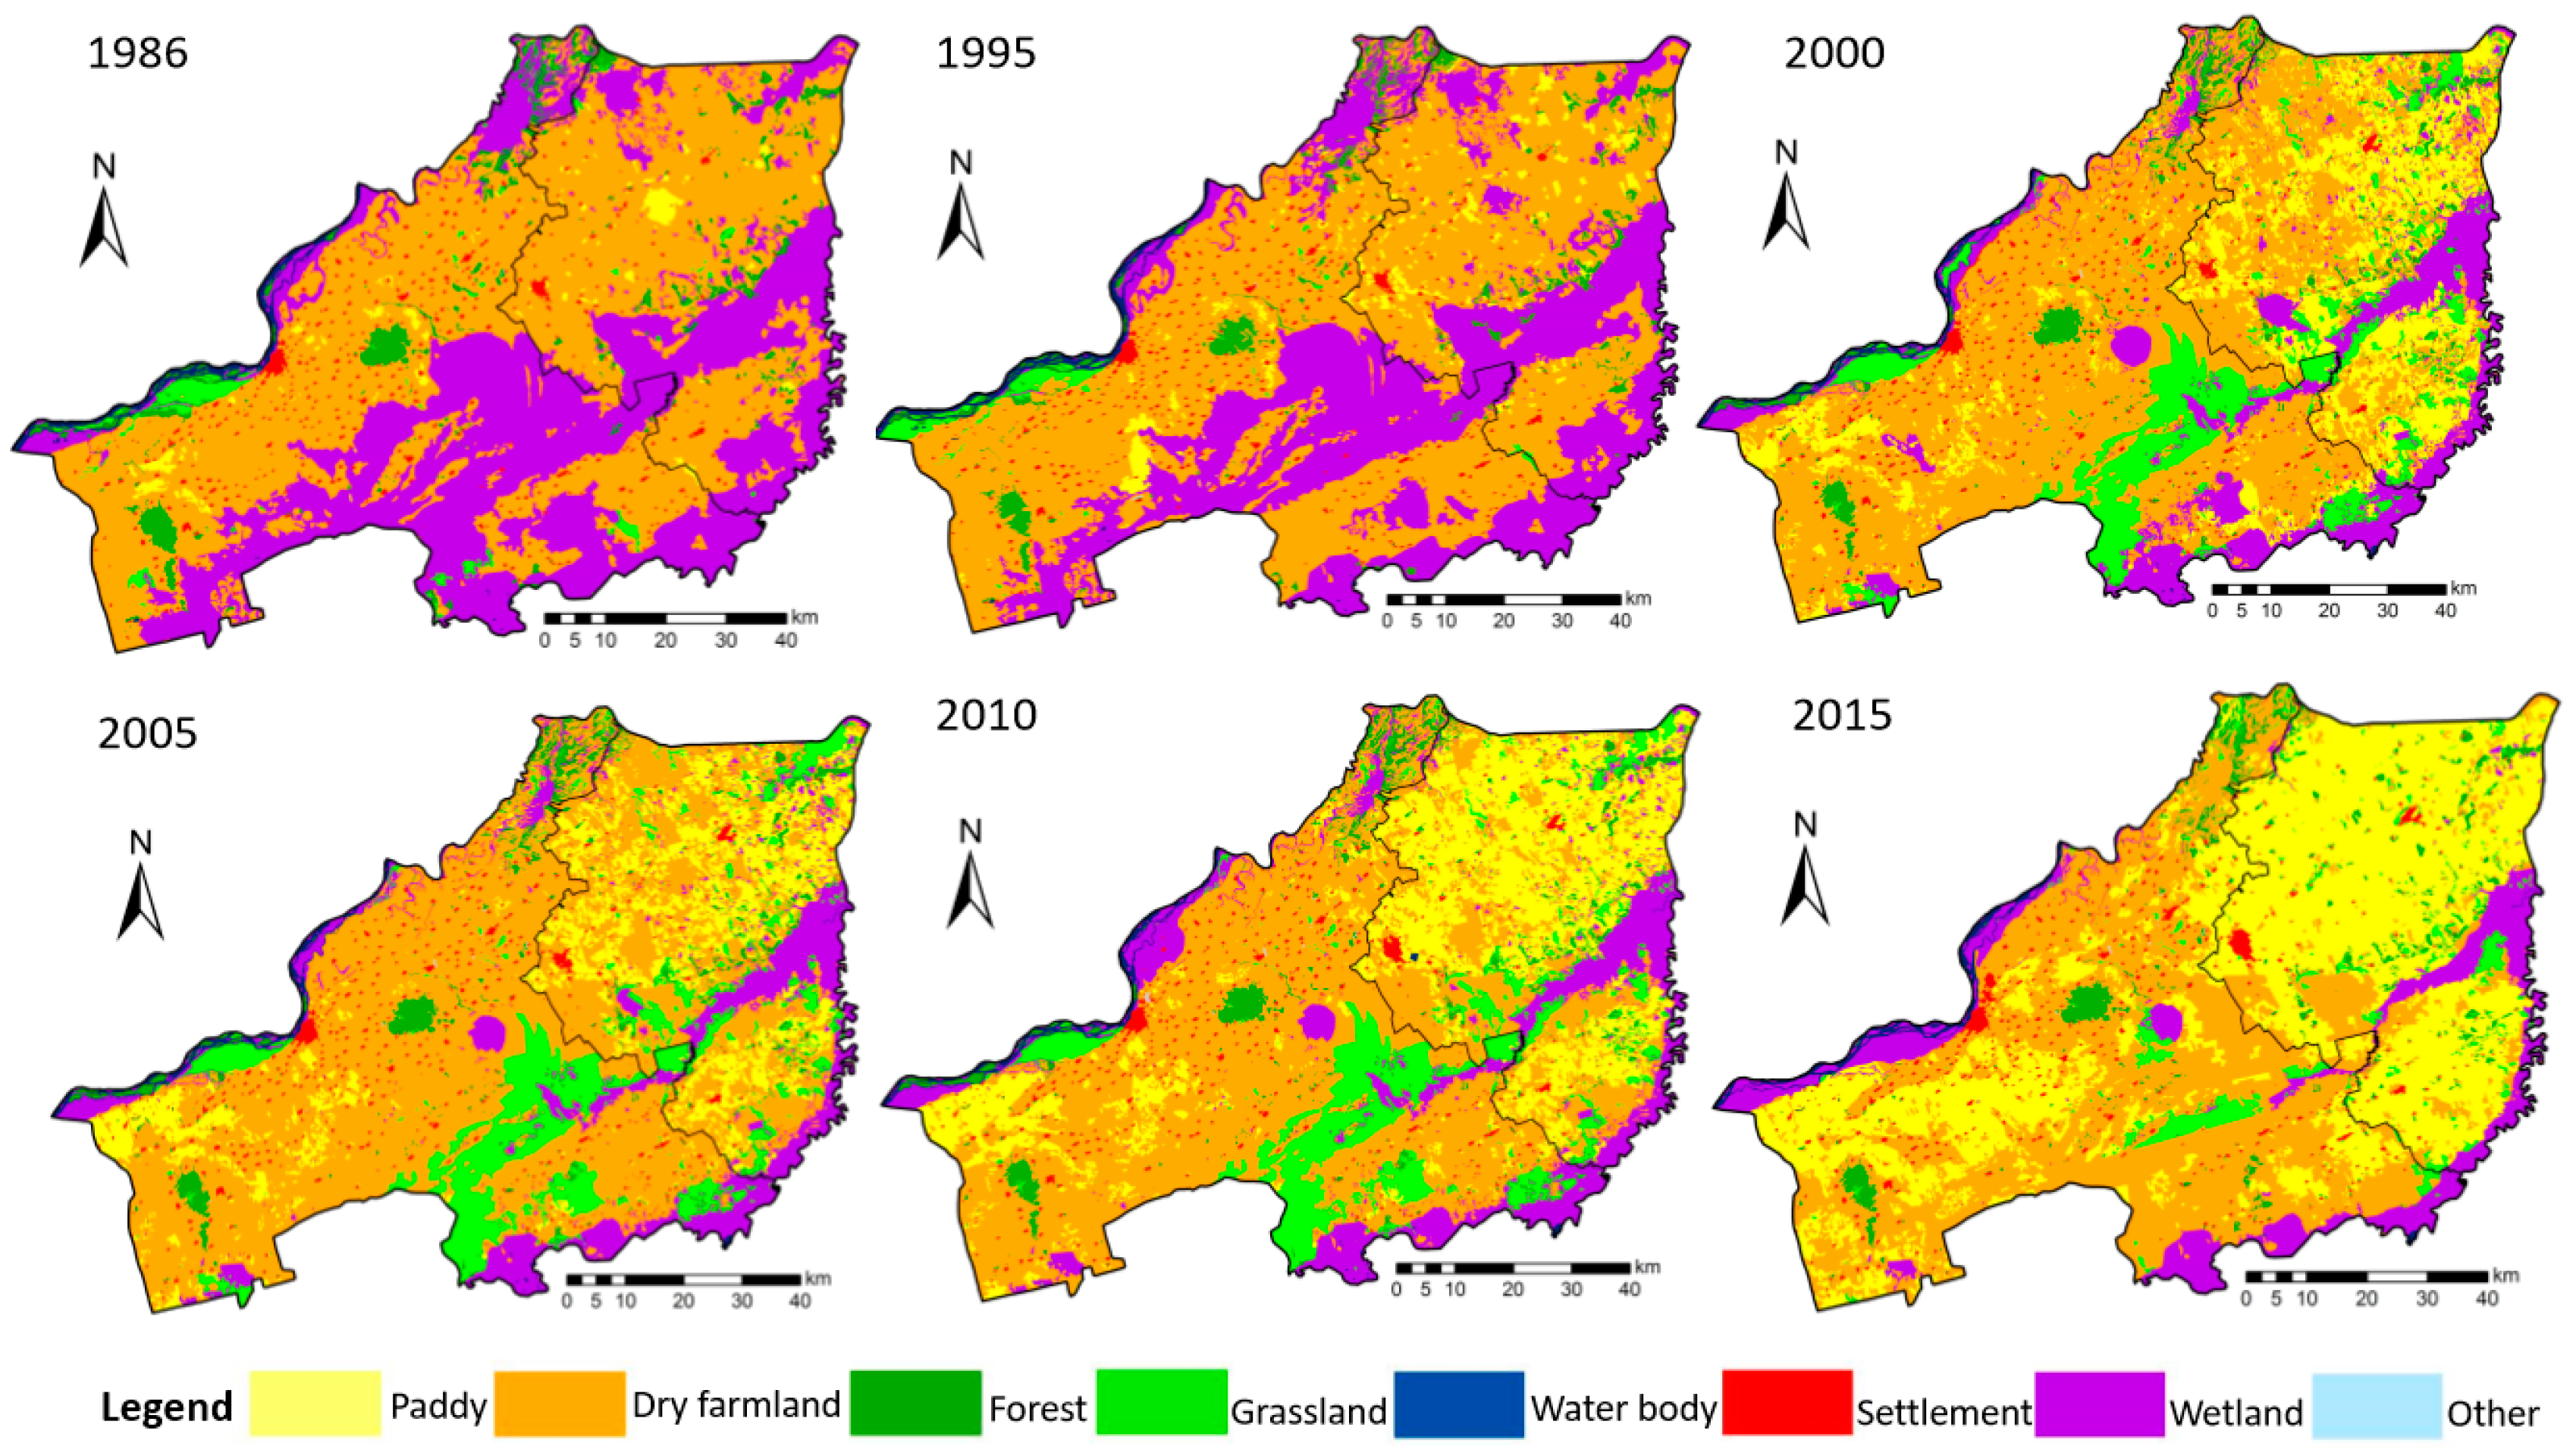
3.1. Spatio-Temporal Changes of Cultivated Land

The land use/cover of the study area and the percentages of paddy and dry farmland to cultivated land during the time intervals changed significantly as shown in Table 2 and Figure 2. Statistical data shows that cultivated land area increased from 4630.21 km2 to 6783.21 km2 during 1986–2015 in Fujin, where the percentage of paddy field increased from 2.58% to 52.75%. Paddy area increased by 3458.78 km2, while dry farmland area decreased by 1305.77 km2 in Fujin. Paddy area, as well as its percentage to cultivated land, grew linearly from 1986 to 2015, with a slight decrease during 2000–2005 in Fujin. The area of dry farmland presented a raising curve with fluctuations from 1986 to 2005, while it decreased sharply from 2005 to 2015. The percentage of dry farmland to arable land decreased linearly from 1986 to 2015, with a slight increase during 2000–2005 in Fujin. The growth rate of cultivated land area in the reclamation region (about 27.38%) was much lower than that in the agricultural region (about 61.47%) during the study periods. The area of paddy fields expanded rapidly both in the agricultural region (1282.63km2) and the reclamation region (2176.14 km2), with a small decline during 2000–2005. The ratio of paddy field in cultivated land increased from 2.96% to 86.33% in the reclamation region, while it increased from 2.28% to 32% in the agricultural region. The area of dry farmland decreased both in the agricultural region and the reclamation region during the study periods, with a small growth during 2000–2005. The decline of dry farmland in the reclamation region (about 83.38%) was more severe than that in the agricultural region (about 12.36%) in the last 30 years.
Transition probability matrices (Table 3) were used to analyze the dynamic change of paddy fields and dry farmland. Through the analysis of LUCC, we found that the main land change types in the study area, over the past 30 years, were the transition from dry farmland to paddy fields, and from wetland to cultivated land (dry farmland and paddy). Statistical results indicate that paddy fields expanded rapidly at the expense of dry farmland and wetland from 1986 to 2015. In all regions, 59.22% of dry farmland converted to paddy fields while 24.1% and 47.7% of wetland transferred to paddy fields and dry farmland, respectively. In the agricultural region, 35.94% of dry farmland converted to paddy fields while the percentage was 88.84% in the reclamation region. In the agricultural region, wetland mostly converted to dry farmland (58.38%) and only 16.37% transferred to paddy fields. On the contrary, wetland in the reclamation region mainly transferred to paddy fields (41.08%). In order to describe the three main LUCC types more intuitively, we calculated the spatial distribution of Pij and classified them into four categories (Figure 3). From Figure 3, we can observe that the transition from dry farmland to paddy fields mostly occurred in the reclamation region, while the transition from wetland to dry farmland mostly occurred in the agricultural region during the past 30 years and conversion from wetland to paddy fields was more dramatic in the reclamation region than in the agricultural region.

3.2. Landscape Pattern Change Analysis

3.2.1. Space Configuration Characteristic Analysis

Four indices (AREA_MN, LPI, PD, CONNECT) were selected to describe the space configuration characteristics of cultivated land during the time intervals (Table 4). In all regions, the mean patch area of both paddy fields and dry farmland decreased from 1986 to 1995 while the total area (Table 2) increased, which means that more crop patches were reclaimed but not formed at a certain scale during 1986 to 1995. The largest patch index (LPI) of paddy increased rapidly by 22.34% from 1986 to 2015, while the LPI of dry farmland showed a downward trend overall. This indicates that paddy fields became the dominant landscape in the agricultural landscape. The PD of paddy fields increased from 1.23 (10−2/km2) to 9.93 (10−2/km2) during 1986–2000 and then decreased to 3.31 (10−2/km2) in 2015. The growth was mainly caused by the reclamation of paddy fields while the decline was due to larger patch sizes. The CONNECT of paddy fields shows growth trend while the dry farmland showed the opposite trend. The CONNECT of paddy fields exceeds dry farmland since 2010, which means that paddy fields formed a certain scale while dry farmland was split by other land use types gradually.
In the agricultural region, the AREA_MN, LPI, PD, and CONNECT of dry farmland land in 1986 are much larger than paddy fields, and the ratio is 15.99:1, 176.31:1, 2.73:1, and 1.19:1, respectively, which indicates that dry farmland was dominant in the cultivated landscape at that time. Overall, the ratios of AREA_MN, LPI, and PD become smaller over the study period; 2.86:1 (AREA_MN), 4.16:1 (LPI), and 0.75:1 (PD) in 2015, respectively. The CONNECT ratio in 2015 (1.73:1) is larger than that in 1986. The changes of these metrics indicate that dry farmland is still the main cultivated landscape in the agricultural region, but its advantage are not as obvious as before.
In the reclamation region, AREA_MN, LPI, and PD of paddy fields show a declining trend while CONNECT displays a rapid growth trend. Overall, the same indices for dry farmland show the opposite trend. The CONNECT of dry farmland decreases from 3.90% in 1986 to 0.42% in 2015. This shows that dry farmland had been replaced by paddy fields as the dominant cultivated landscape in the past 30 years.

3.2.2. Patch Character Change Analysis

Patch character changes were analyzed by PLAND, ED, LSI, and SHAPE_MN (Table 5). In all regions, PLAND of paddy fields presents a linear increase from 1.44% in 1986 to 43.26% in 2015. Conversely, PLAND of dry farmland declines by 15.79%. ED of paddy fields shows an increasing trend while ED of dry farmland first increased from 1986 to 2000 and then declined from 2000 to 2015. LSI decreases after an initial increase. The changes of ED and LSI indicate that paddy fields gradually became the dominant landscape instead of dry farmland. The changes of SHAPE_MN indicate that the patch shape of paddy fields became more irregular while dry farmland became more regular.
In the agricultural region, the PLAND of paddy increases from 1.13% in 1986 to 25.8008% in 2015 while the PLAND of dry farmland increased from 49.07% in 1986 to 55.30% in 2015, with the peak in2005 (63.64%), which indicates that though paddy increased more quickly than dry farmland, dry farmland was still the main cultivated land in the agricultural region. Both ED and LSI of paddy fields and dry farmland show upward trends, indicating that both patch number and area were increased.
In the reclamation region, there was a substantial increase in paddy field scale while dry farmland scale reduced significantly (the PLAND index increases from 1.96% to 72.03% in paddy fields while it declines from 63.55% to 11.49% in dry farmland). Through the comparison of the SHAPE_MN indexes, we found that the patch shape of cultivated land in the reclamation region was more regular than in the agricultural region.

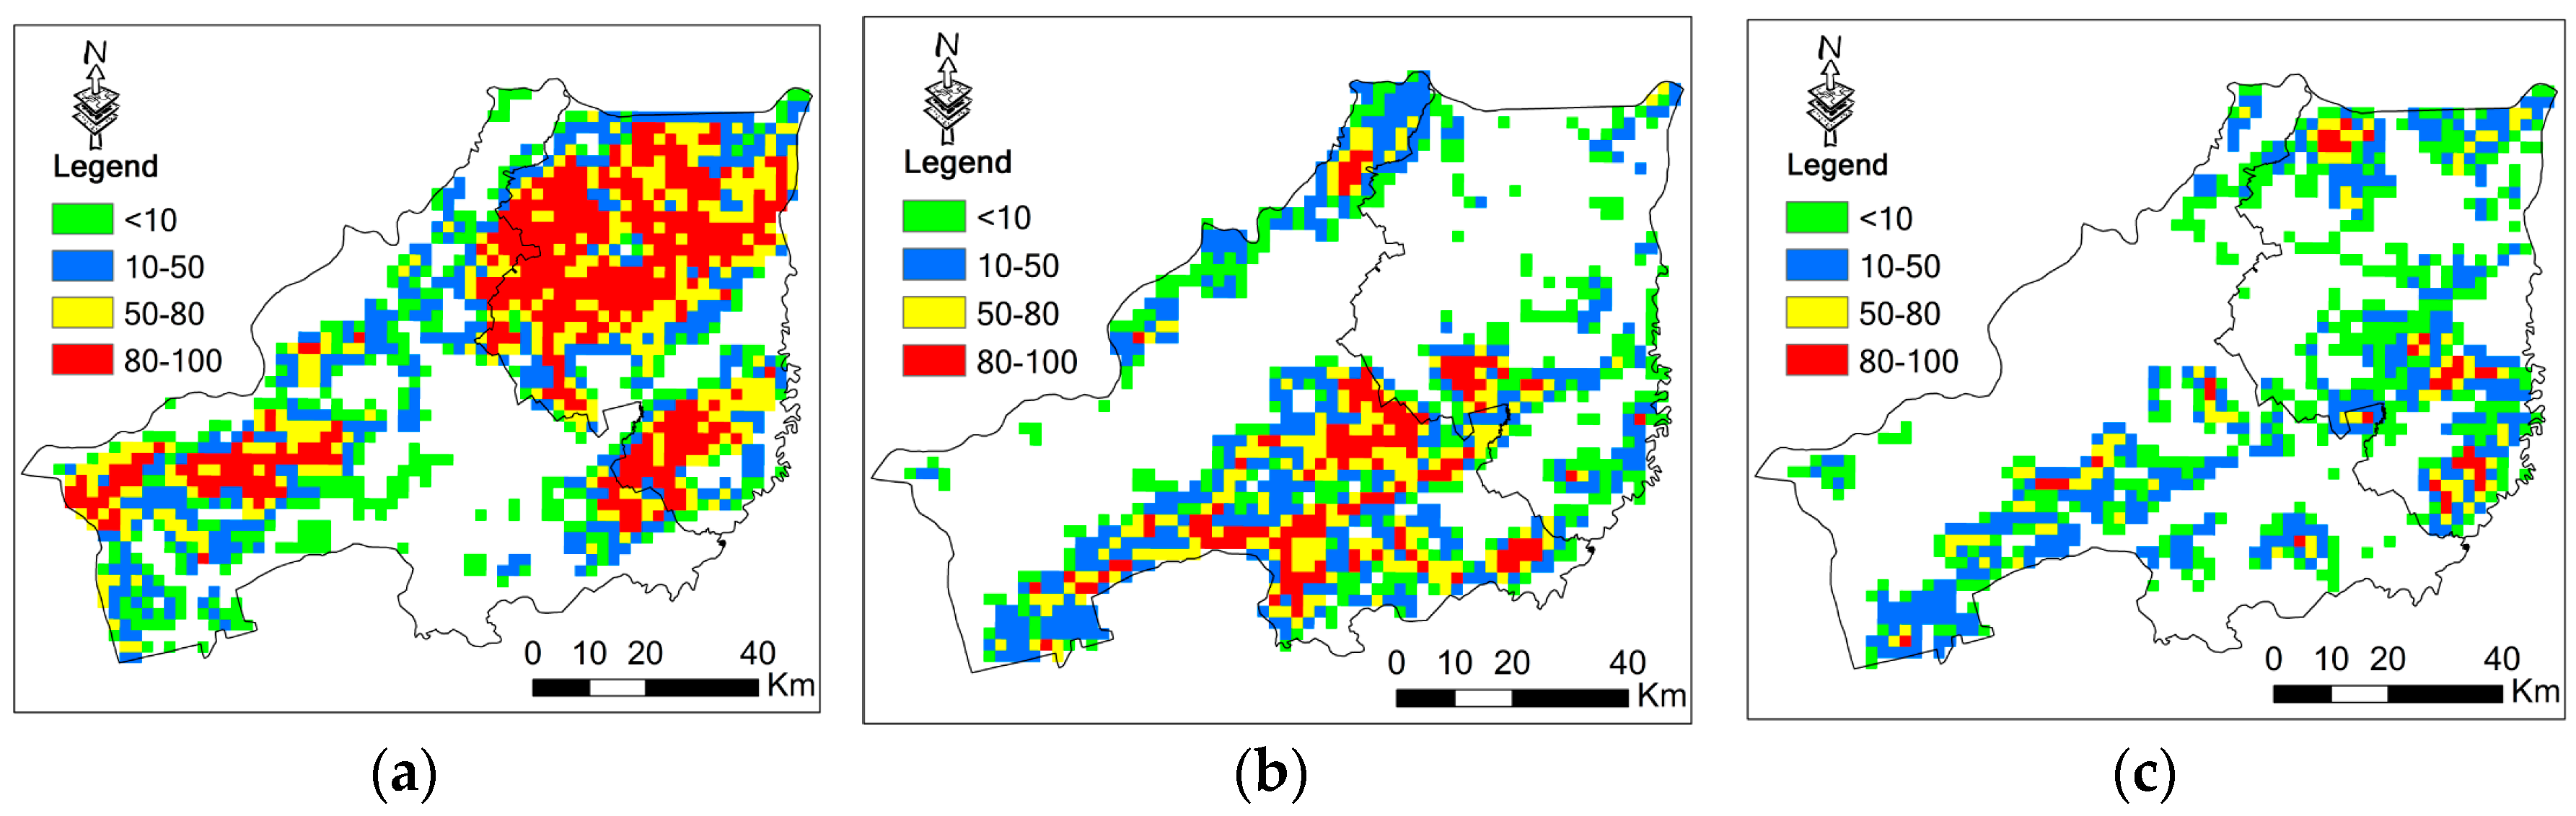
3.2.3. Fragmentation Character Analysis

The dynamic of fragmentation character was analyzed by COHESION, DIVISION, SPLIT, and AI indexes (Table 6). From 1986 to 2015, the decline of DIVISION of paddy fields indicates that the number of patches of other land use types among paddy field patches decreased in all regions. The decline of SPLIT indicates that the distance between paddy field patches decreased. The changes of COHESION and AI show that the small-scale reclamation caused the aggregation of paddy fields to decrease from 1986 to 1995 and the large-scale reclamation caused the aggregation to increase. The fragmentation of paddy fields declined from 1995 to 2015 after a growth from 1986 to 1995. The change of dry farmland was not as regular as paddy fields, which had a great relationship with the “dry farmland to paddy” activity [31]. Although with several fluctuations, the general trend is that DIVISION and SPLIT increase while the COHESION and AI decline, indicating that the number of patches of other land use types among dry farmland patches, as well as the distance between dry farmland patches, increased during the whole study period in Fujin city. Overall, the fragmentation of paddy fields decreased while the fragmentation of dry farmland increased in the whole study area in recent 30 years.
The changes in paddy fields in two regions (the agricultural region and the reclamation region) were consistent with the trend in all regions. The difference was that the change of paddy fields in the reclamation region was more intense. The change rates of COHESION, DIVISION, SPLIT, and AI indexes are 1.62%, −1.69%, −99.94%, and 1.68%, respectively, in the agricultural region, while they are 2.10%, −33.65%, −99.98%, and 2.49%, respectively, in the reclamation region. However, the fragmentation character of dry farmland shows the opposite trend. Landscape fragmentation of dry farmland was serious in the reclamation region while it lightened in the agricultural region. This phenomenon is mainly due to a larger percentage of dry farmland that was transformed into paddy fields in the reclamation region than in the agricultural region in the whole study period. In general, the fragmentation of paddy fields in the reclamation region was lighter in the agricultural region.
Our study indicates that patch shape of paddy fields became more irregular, while dry farmland became more regular and paddy fields became the dominated agricultural landscape instead of dry farmland in the past 30 years both in the agricultural region and the reclamation region. Because of different management modes, great differences exist in these two regions: paddy fields became the dominated cultivated landscape more rapidly in the reclamation region than in the agricultural region; the patch shape of cultivated land in the reclamation region was more regular than in the agricultural region; dry farmland in the reclamation region showed more dramatic fragmentation character than in the agricultural region.

4. Discussion

4.1. Spatio-Temporal Changes of Land Use and Cover Change (LUCC)

Our study reports that cultivated land increased rapidly at the loss of wetland, which is consistent with previous studies [20]. We found that paddy fields increased more quickly in the reclamation region than in the agricultural region and the area of dry farmland decreased heavily while it remained relatively stable in the agricultural region. This conclusion is consistent with a study which described the changes of paddy fields and dry farmland in two regions of the Sanjiang Plain according to statistical data from statistical yearbooks [26]. Our study also reports the spatial changes of cultivated land as well as the Pij (transition probability) index, which can describe LUCC progress more intuitively. Since the transition between paddy fields and dry farmland occurred frequently, especially the conversion from dry farmland to paddy fields in Sanjiang Plain, future studies should differ dry farmland from paddy fields in order to study the landscape change.
The large-scale land use change from wetland to cultivated land and from dry farmland to paddy fields will inevitably affect the surface radiation balance, water vapor transpiration, and other biogeochemical processes. Also, along with the expansion of cultivated land, pesticides and the use of chemical fertilizers, as well as irrigation, would have a significant impact on food security and ecological environment. How these changes affect food security and the ecological environment, as well as the contribution of each factor, should be given attention in the future.

4.2. The Difference of Cultivated Landscape Pattern Changes between the Two Regions

This study reports that paddy fields became the dominant landscape instead of dry farmland, and that large differences existed between two administrative regions. The basic conclusion is consistent with the study of Du et al. [24]. We also found that long time series and the use of several time intervals data can better describe the evolution progress. For example, both of these two studies showed that the overall trend of LPI and mean area declines in the agricultural region after 2000. However, our study find that these two indices increase first, before they decline. This is mainly because the transition rate from dry farmland to other land exceeded transition from other land to dry farmland in a certain year.
Our study also indicates that paddy fields in the reclamation region developed more rapidly and regularly than those in the agricultural region. These great differences of land use change patterns between the two regions indicate that it is necessary and possible to carry out land renovation in the agricultural region to promote rational land use distribution as well as improve cultivated land quality [39]. Paddy fields usually have higher economic efficiency than other farmland [29,39]. The expansion of paddy fields in the reclamation area can provide experiences for developing paddy fields in the agricultural region. Additionally, the differences in cultivated landscape pattern changes between the two regions will lead to the differences in their effect on food security and ecological environment. These differences should be given attention in the future in order to provide reference for policy-decision.

4.3. Possible Reasons for Landscape Pattern Differences

The reclamation region and the agricultural region in Fujin City have similar climatic conditions and topographic features, but their changes in cultivated landscape present different trends. The differences are closely related to different management modes and the influence of policies.
Firstly, the crop types, species, and other agricultural activities are mainly decided by farm governors in the reclamation region, while in the agricultural region they are mainly decided upon by farmers [40,41]. The reclamation region usually makes planned production decisions to meet country food needs and achieve balance between food supply and demand in the market by adjusting planting structures [24,30]. Under state ownership, it is easier to implement a new policy in the reclamation region [40]. For example, the rapid increase in paddy area in the reclamation region was mostly stimulated by a “dry farmland to paddy” policy in 1990s [31]. Secondly, agricultural infrastructures are better in the reclamation region than in the agricultural region. With rational planning of ditches and roads, modern agricultural machinery, and perfect power systems [20], it is easier to realize large-scale planting in the reclamation region [28]. For example, Xue et al. [41] found that the density of the ditches network in the reclamation region is 2.3 times of that in the agricultural region, which provides convenient water resources for the development of paddy fields; Wang et al. [32] and Du et al. [23] found that the agricultural input factors (e.g., labor, seeds, fertilizer, technology, and machines) are greater in the reclamation region. More scientific cultivation methods are applied in the reclamation region, which can help to maintain soil fertility and reduce farmland abandonment [28,40]. Thirdly, a series of policies promoted the landscape changes in the whole region as well as the differences between the two regions. In 1990, Heilongjiang Province implemented a “to develop paddy and to promote conversion from dry farmland to paddy” policy [39]. Additionally, the government also promoted this policy by increasing subsidies for rice cultivation. The “three major flood controls” and “controlling floods with planting paddies” policies also promoted the conversion from dry farmland to paddy fields and hindered the conversion from wetland to farmland [42,43]. Studies in other countries [44,45,46] have also shown that policies are important driving factors in agricultural landscape changes.

5. Conclusions

During the past 30 years, cultivated land in Fujin City showed a growth trend with the rapid growth of paddy fields and slow reduction of dry farmland. This trend is more obvious in the reclamation region than in the agricultural region, where both dry farmland and paddy fields show a growth trend. This is mainly due to a larger percentage of dry farmland being changed to paddy fields in the reclamation region than in the agricultural region. The transition from dry farmland to paddy fields and from wetland to cultivated land (dry farmland and paddy fields) were the main types of change in the study area, and the “dry farmland to paddy” activities were more dramatic in the reclamation region. The spatial distribution of Pij suggests more clearly that transition from dry farmland to paddy fields (in the reclamation region) and from wetland to dry farmland (in the agricultural region) were the dominant LUCC types, respectively. Our study shows that paddy fields became the dominant agricultural landscape instead of dry farmland and the fragmentation of paddy fields decreased while the fragmentation of dry farmland increased in the whole study area in the last 30 years. These differences indicate that the different management modes have great effects on cultivated landscape changes. More attention should be paid to these differences. The reclamation region and the agricultural region should learn from each other in order to improve regional grain production level, production efficiency, and economic growth [29,39].

Acknowledgments

This work was supported by National Basic Research Program of China, No. 2010CB95090103; Technological Basic Research Program of China, No. 2013FY111800; National Natural Science Foundation of China, No. 41571167, and China Scholarship Council. The paper was also completed with support from International Center for Climate and Global Change Research and School of Forestry and Wildlife Sciences, Auburn University (AU), USA. We would like to thank Hanqin Tian and Bowen Zhang of AU for their valuable suggestions. We also would like to thank Liping Chang, Kun Bu, Jiuchun Yang, and Dan Chen for collecting the data.

Author Contributions

F.Y., W.K., and S.Z. designed the research. G.D., C.J., X.L., and F.Y. processed and analyzed the results. L.Y. and C.Y. collected the data. F.Y. wrote the manuscript. All authors have read and approved the final manuscript.

Conflicts of Interest

The authors declare no conflict of interest.

References

  1. Searchinger, T.; Heimlich, R.; Houghton, R.A.; Dong, F.; Elobeid, A.; Fabiosa, J.; Tokgoz, S.; Hayes, D.; Yu, T.-H. Use of US croplands for biofuels increases greenhouse gases through emissions from land-use change. Science 2008, 319, 1238–1240. [Google Scholar] [CrossRef] [PubMed]
  2. Bosch, J.M.; Hewlett, J.D. A review of catchment experiments to determine the effect of vegetation changes on water yield and evapotranspiration. J. Hydrol. 1982, 55, 3–23. [Google Scholar] [CrossRef]
  3. Liu, M.; Tian, H.; Chen, G.; Ren, W.; Zhang, C.; Liu, J. Effects of land-use and land-cover change on evapotranspiration and water yield in China during 1900–2001. JAWRA J. Am. Water Resour. Assoc. 2008, 44, 1193–1207. [Google Scholar] [CrossRef]
  4. Dale, V.H. The relationship between land-use change and climate change. Ecol. Appl. 1997, 7, 753–769. [Google Scholar] [CrossRef]
  5. Costa, M.H.; Botta, A.; Cardille, J.A. Effects of large-scale changes in land cover on the discharge of the Tocantins river, southeastern Amazonia. J. Hydrol. 2003, 283, 206–217. [Google Scholar] [CrossRef]
  6. Ren, W.; Tian, H.; Tao, B.; Huang, Y.; Pan, S. China’s crop productivity and soil carbon storage as influenced by multifactor global change. Glob. Chang. Biol. 2012, 18, 2945–2957. [Google Scholar] [CrossRef] [PubMed]
  7. Tian, H.; Lu, C.; Melillo, J.; Ren, W.; Huang, Y.; Xu, X.; Liu, M.; Zhang, C.; Chen, G.; Pan, S. Food benefit and climate warming potential of nitrogen fertilizer uses in China. Environ. Res. Lett. 2012, 7, 044020. [Google Scholar] [CrossRef]
  8. Tian, H.; Chen, G.; Lu, C.; Xu, X.; Ren, W.; Zhang, B.; Banger, K.; Tao, B.; Pan, S.; Liu, M. Global methane and nitrous oxide emissions from terrestrial ecosystems due to multiple environmental changes. Ecosyst. Health Sustain. 2015, 1, 1–20. [Google Scholar] [CrossRef]
  9. Xu, X.; Tian, H.; Chen, G.; Liu, M.; Ren, W.; Lu, C.; Zhang, C. Multifactor controls on terrestrial N2O flux over North America from 1979 through 2010. Biogeosciences 2012, 9, 1351–1366. [Google Scholar] [CrossRef]
  10. Liu, J.; Zhang, Z.; Xu, X.; Kuang, W.; Zhou, W.; Zhang, S.; Li, R.; Yan, C.; Yu, D.; Wu, S. Spatial patterns and driving forces of land use change in China during the early 21st century. J. Geogr. Sci. 2010, 20, 483–494. [Google Scholar] [CrossRef]
  11. Turner, B.L.; Lambin, E.F.; Reenberg, A. The emergence of land change science for global environmental change and sustainability. Proc. Nat. Acad. Sci. USA 2007, 104, 20666–20671. [Google Scholar] [CrossRef] [PubMed]
  12. Houet, T.; Loveland, T.R.; Hubert-Moy, L.; Gaucherel, C.; Napton, D.; Barnes, C.A.; Sayler, K. Exploring subtle land use and land cover changes: A framework for future landscape studies. Landsc. Ecol. 2010, 25, 249–266. [Google Scholar] [CrossRef] [Green Version]
  13. Dearing, J.A.; Braimoh, A.K.; Reenberg, A.; Turner, B.L.; van der Leeuw, S. Complex land systems: The need for long time perspectives to assess their future. Ecol. Soc. 2010, 15, 21. [Google Scholar]
  14. Braimoh, A.K.; Osaki, M. Land-use change and environmental sustainability. Sustain. Sci. 2010, 5, 5–7. [Google Scholar] [CrossRef]
  15. Garrity, D.P.; Akinnifesi, F.K.; Ajayi, O.C.; Weldesemayat, S.G.; Mowo, J.G.; Kalinganire, A.; Larwanou, M.; Bayala, J. Evergreen agriculture: A robust approach to sustainable food security in Africa. Food Secur. 2010, 2, 197–214. [Google Scholar] [CrossRef]
  16. Ren, W.; Tian, H.; Xu, X.; Liu, M.; Lu, C.; Chen, G.; Melillo, J.; Reilly, J.; Liu, J. Spatial and temporal patterns of CO2 and CH4 fluxes in China’s croplands in response to multifactor environmental changes. Tellus B 2011, 63, 222–240. [Google Scholar] [CrossRef]
  17. Tian, H.; Ren, W.; Tao, B.; Sun, G.; Chappelka, A.; Wang, X.; Pan, S.; Yang, J.; Liu, J.; Felzer, B.S.; et al. Climate extremes and ozone pollution: A growing threat to china’s food security. Ecosyst. Health. Sustain. 2016, 2. [Google Scholar] [CrossRef]
  18. Forman, R.T.; Gordon, M. Landscape Ecology; Wiley: New York, NY, USA, 1986. [Google Scholar]
  19. Fu, B.-J.; Hu, C.-X.; Chen, L.-D.; Honnay, O.; Gulinck, H. Evaluating change in agricultural landscape pattern between 1980 and 2000 in the loess hilly region of Ansai county, China. Agric. Ecosyst. Environ. 2006, 114, 387–396. [Google Scholar] [CrossRef]
  20. Screen, J.A.; Simmonds, I. The central role of diminishing sea ice in recent Arctic temperature amplification. Nature 2010, 464, 1334–1337. [Google Scholar] [CrossRef] [PubMed] [Green Version]
  21. Wheeler, T.; Von Braun, J. Climate change impacts on global food security. Science 2013, 341, 508–513. [Google Scholar] [CrossRef] [PubMed]
  22. Brown, M.E.; Funk, C.C. Food security under climate change. Science 2008, 319, 580–581. [Google Scholar] [CrossRef] [PubMed]
  23. Parry, M.; Rosenzweig, C.; Iglesias, A.; Fischer, G.; Livermore, M. Climate change and world food security: A new assessment. Glob. Environ. Chang. 1999, 9, S51–S67. [Google Scholar] [CrossRef]
  24. Du, G.; Pan, T.; Yin, Z.; Dong, J. Cultivated landscape pattern change due to the rice paddy expansion in Northeast china: A case study in Fujin. J. Appl. Ecol. 2015, 26, 207–214. (In Chinese) [Google Scholar]
  25. Yang, X.-G.; Liu, Z.-J.; Fu, C. The possible effect of climate warming on northern limits of cropping system and crop yield in China. Agric. Sci. China 2011, 10, 585–594. [Google Scholar] [CrossRef]
  26. Song, K.; Liu, D.; Wang, Z.; Zhang, B.; Jin, C.; Li, F.; Liu, H. Land use change in Sanjiang plain and its driving forces analysis since 1954. Acta Geogr. Sin. 2008, 63, 93. (In Chinese) [Google Scholar]
  27. Huang, N.; Liu, D.; Wang, Z. Study on mutual transformation characteristics between paddy field and dry land in Sanjiang Plain from 1986 to 2005. Res. Sci. 2009, 2, 324–329. (In Chinese) [Google Scholar]
  28. Li, Q.; Du, G.; Hu, S. Comparative differences of comprehensive benefits from cultivated land use under different land property right systems. Res. Sci. 2015, 37, 1561–1570. (In Chinese) [Google Scholar]
  29. Du, G.; Lai, Z.; Li, J.; Wu, L. Comparative analysis on farmers’ management behaviors under different land systems in reclamation and agricultural areas. Guangdong Agric. Sci. 2015, 154–160. (In Chinese) [Google Scholar]
  30. Du, G.; Xue, J.; Zhou, Y. Comparative study on settlements system in reclamation and agricultural region. J. Northeast Agric. Univ. 2012, 43, 133–139. (In Chinese) [Google Scholar]
  31. Plexida, S.G.; Sfougaris, A.I.; Ispikoudis, I.P.; Papanastasis, V.P. Selecting landscape metrics as indicators of spatial heterogeneity—A comparison among Greek landscapes. Int. J. Appl. Earth Observ. Geoinform. 2014, 26, 26–35. [Google Scholar] [CrossRef]
  32. Schroeder, R.; Rawlins, M.; McDonald, K.; Podest, E.; Zimmermann, R.; Kueppers, M. Satellite microwave remote sensing of North Eurasian inundation dynamics: Development of coarse-resolution products and comparison with high-resolution synthetic aperture radar data. Environ. Res. Lett. 2010, 5, 015003. [Google Scholar] [CrossRef]
  33. Geri, F.; Amici, V.; Rocchini, D. Human activity impact on the heterogeneity of a Mediterranean landscape. Appl. Geogr. 2010, 30, 370–379. [Google Scholar] [CrossRef]
  34. Kupfer, J.A. Landscape ecology and biogeography: Rethinking landscape metrics in a post-fragstats landscape. Prog. Phys. Geogr. 2012. [Google Scholar] [CrossRef]
  35. Lausch, A.; Herzog, F. Applicability of landscape metrics for the monitoring of landscape change: Issues of scale, resolution and interpretability. Ecol. Indic. 2002, 2, 3–15. [Google Scholar] [CrossRef]
  36. Liu, Y.; Peng, L.; Chen, Y. Conversion of land use types and ecological effect in Northeast China. Trans. CSAE 2005, 21, 175–178. (In Chinese) [Google Scholar]
  37. Ruiz, J.; Domon, G. Analysis of landscape pattern change trajectories within areas of intensive agricultural use: Case study in a watershed of Southern Québec, Canada. Landsc. Ecol. 2009, 24, 419–432. [Google Scholar] [CrossRef]
  38. McGarigal, K. Fragstats Help. 2015. Available online: http://www.umass.edu/landeco/research/fragstats/documents/fragstats.help.4.2.pdf (accessed on 20 Ocotber 2016).
  39. Wang, Y.; Cheng, Y. Comparative analysis on influence factors of agricultural economic growth between reclamation areas and common agricultural areas in Heilongjiang province. Res. Agric. Mod. 2012, 5, 570–573. (In Chinese) [Google Scholar]
  40. Pan, T. The Process of Regional Paddy Farmland Landscape Evolution and Driving Factor Analysis. Master’s Thesis, Northeast Agricultural University, Harbin, China, 2015. [Google Scholar]
  41. Xue, J.; Yun, W.; Du, G.; Zhang, F. Difference analysis of land use patterns in modern and traditional agricultural region based on remote sensing. Trans. Chin. Soc. Agric. Eng. 2012, 28, 245–251. (In Chinese) [Google Scholar]
  42. Cui, B.; Liu, X. Changes of ecological characteristics and sustainable management of wetlands in Sanjiang Plain. Reg. Res. Dev. 1999, 18, 45–48. (In Chinese) [Google Scholar]
  43. Liu, X.T.; Ma, X.H. Effect of large-scale reclamation on natural environment and regional environmental protection in the Sanjiang Plain. Sci. Geogr. Sin. 2000, 20, 14–19. (In Chinese) [Google Scholar]
  44. Mottet, A.; Ladet, S.; Coqué, N.; Gibon, A. Agricultural land-use change and its drivers in mountain landscapes: A case study in the Pyrenees. Agric. Ecosyst. Environ. 2006, 114, 296–310. [Google Scholar] [CrossRef]
  45. Hersperger, A.M.; Bürgi, M. Going beyond landscape change description: Quantifying the importance of driving forces of landscape change in a central Europe case study. Land Use Policy 2009, 26, 640–648. [Google Scholar] [CrossRef]
  46. Bürgi, M.; Hersperger, A.M.; Schneeberger, N. Driving forces of landscape change—Current and new directions. Landsc. Ecol. 2004, 19, 857–868. [Google Scholar] [CrossRef]
Figure 1. The location of Fujin City, Northeast China.
Sustainability 08 01071 g001
Figure 2. Land use/cover maps for different years.
Sustainability 08 01071 g002
Figure 3. Spatial distribution of Pij (a) from dry farmland to paddy fields; (b) from wetland to dry farmland; (c) from wetland to paddy fields.
Sustainability 08 01071 g003
Table 1. The landscape metrics.
MetricsFormulaDescriptions
AREA_MN (mean area)AREA_MN = j = 1 n a i j n i where aij is the area of patch ij (ha), ni is the number of patches of type i.
LPI (largest patch index)LPI = max j = 1 n ( a i j ) A (100) where aij is the area of patch ij (m2), A is total landscape area (m2).
LPI quantifies the percentage of total landscape area comprised by the largest patch. As such, it is a simple measure of dominance.
PD (patch density)PD = N A where A is total patch area of each cultivated land type (100 ha), N is the number of patches of each cultivated land type. PD expresses the number of patches on a per unit area basis that facilitates comparisons among landscapes of varying size.
CONNECT (connect index)CONNECT = [ j = k n c i j k n i ( n i 1 ) 2 ] ( 100 ) where Cijk equals the connectivity between patch j and k (0 is unconnected, 1 is connected) of the corresponding patch type (i), based on a user specified threshold distance. ni is the number of patches in the landscape of the corresponding patch type (class). CONNECT is reported as a percentage of the maximum possible connectance given the number of patches.
PLAND (percentage of landscape)PLAND = j = 1 n a i j A × ( 100 ) where aij = area (m2) of patch ij, A is the total landscape area (m2). PLAND quantifies the proportional abundance of each patch type in the landscape.
ED (edge density)ED = k = 1 m ( e i k ) A where eik is the total patch length of type i, A is total patch area of each cultivated land type (ha). ED reports edge length on a per unit area.
LSI (landscape shape index)LSI = e i min e i where ei = total length of edge (or perimeter) of class i in terms of number of cell surfaces; includes all landscape boundaries and background edge segments involving class i.
min ei = minimum total length of edge (or perimeter) of class i in terms of number of cell surfaces. LSI provides a simple measure of class aggregation.
SHAPE_MN (mean shape)SHAPE_MN = i = 1 m j = 1 n ( 0.25 P i j a i j ) n i where pij = perimeter of patch ij in terms of number of cell surfaces. aij = area of patch ij in terms of number of cells. ni is the number of patches of type i.
COHESION (cohesion index)COHESION = [ 1 j = 1 n p i j j = 1 n p i j a i j ] × [ 1 1 Z ] × ( 100 ) where pij = perimeter of patch ij in terms of number of cell surfaces. aij = area of patch ij in terms of number of cells.
Z = total number of cells in the landscape. COHESION measures the physical connectedness of the corresponding patch type.
DIVISION (landscape division index)DIVISION = [ 1 j = 1 n ( a i j A ) 2 ] where aij = area (m2) of patch ij. A = total landscape area (m2). DIVISION shows the probability that two randomly chosen pixels in the landscape are not situated in the same patch.
SPLIT (splitting index)SPLIT = A 2 i = 1 m j = 1 n a i j 2 where aij = area (m) of patch ij. A2 = total landscape area (m2). It is interpreted as the effective mesh number, or number of patches with a constant patch size when the landscape is subdivided into S patches, where S is the value of the splitting index.
AI (aggregation index)AI = m i i max   m i i where mii = number of like adjacencies (connections) between pixels of patch type (class) i based on the single-count method; max mii = maximum number of like adjacencies (connections) between pixels of patch type. AI shows the frequency with which different pairs of patch types appear side-by-side on the map.
Table 2. The area and percentage of change during the time intervals.
Year198619952000200520102015
All regionsCultivated land4630.214914.385809.085865.565884.546783.21
PaddyArea (km2)119.33239.951445.471240.251936.813578.11
%2.584.8824.8821.1432.9152.75
Dry farmlandArea (km2)4510.884674.434363.604625.313947.743205.11
%97.4295.1275.1278.8667.0947.25
Agricultural regionCultivated land2596.682907.433534.983585.273543.824192.98
PaddyArea (km2)59.2091.39365.10302.10447.241341.83
%2.283.1410.338.4312.6232.00
Dry farmlandArea (km2)2537.482816.053169.893283.173096.582851.14
%97.7296.8689.6791.5787.3868.00
Reclamation regionCultivated land2033.532006.952274.092280.292340.732590.23
PaddyArea (km2)60.13148.561080.38938.151489.572236.27
%2.967.4047.5041.1463.6486.33
Dry farmlandArea (km2)1973.401858.391193.721342.15851.16353.96
%97.0492.6052.5058.8636.3613.67
Table 3. Transition probability matrices of land changes from 1986 to 2015 (%).
RegionCategoriesPDFGWSMO
All regionsP89.306.500.751.860.160.870.550.00
D59.2236.961.321.060.001.030.380.02
F14.1717.8453.614.041.000.588.610.13
G22.5730.892.442.080.540.0741.080.32
W0.751.110.260.1363.980.3733.400.00
S7.9213.891.170.920.0775.760.080.19
M24.1047.701.056.640.390.0820.030.00
O12.2416.992.1811.620.000.000.0056.98
Agricultural regionP87.819.740.132.030.000.290.000.00
D35.9461.320.880.410.011.100.300.04
F5.4022.0054.943.581.510.5511.830.19
G16.4132.582.102.240.590.0845.630.36
W0.761.110.270.1364.360.3733.010.00
S4.2516.531.110.340.0977.370.070.24
M16.3758.381.286.500.370.1017.000.00
O0.0019.501.7913.330.000.000.0065.39
Reclamation regionP90.733.431.341.700.311.421.080.00
D88.845.961.881.890.000.940.490.00
F31.599.5850.994.970.000.642.220.00
G77.5715.745.500.680.080.000.440.00
W0.000.000.000.000.000.00100.000.00
S21.054.441.403.000.0070.020.100.00
M41.0824.250.546.950.440.0426.690.00
O95.200.004.800.000.000.000.000.00
Notes: P = Paddy field; D = Dry farmland; F = Forest; G = Grassland; W = Water body; S = Settlement; M = Wetland; and O = Other.
Table 4. Space configuration characteristic.
RegionYearAREA_MN (ha)LPI (%)PD (10−2/km2)CONNECT (%)
PaddyDry FarmlandPaddyDry FarmlandPaddyDry FarmlandPaddyDry Farmland
All1986117.023268.600.3142.631.231.670.371.59
199599.552798.890.5140.662.912.020.281.22
2000176.05852.293.8841.819.936.190.220.42
2005227.981182.963.5242.976.584.730.330.54
2010526.30688.9613.9131.854.456.930.420.31
20151305.86797.3022.6534.873.314.860.570.33
Ag1986126.342020.480.2137.620.892.431.441.73
1995106.571908.430.8236.951.632.860.771.33
200090.621952.751.2849.687.663.150.331.56
2005111.192198.201.4750.205.192.890.491.55
2010168.441818.523.6246.005.053.300.441.34
2015512.711467.2412.6352.525.033.770.570.98
Re198694.233544.930.8250.232.081.790.483.90
199587.972395.950.2845.925.472.500.413.03
2000231.08272.8010.2626.1415.0814.080.470.58
2005305.29423.259.3224.549.8910.210.700.74
20101012.75174.4136.596.934.7415.721.450.37
20154245.70116.4755.853.261.709.864.930.42
Notes: All = All regions; Ag = Agricultural region; and Re = Reclamation region.
Table 5. Patch character.
RegionYearPLAND (%)ED (m·ha−1)LSISHAPE_MN
Paddy FieldDry FarmlandPaddy FieldDry FarmlandPaddy FieldDry FarmlandPaddy FieldDry Farmland
All19861.4454.540.738.0313.9525.221.622.14
19952.9056.521.668.9022.3227.581.602.22
200017.4852.768.9014.7548.7546.851.772.01
200515.0055.937.4614.6244.1645.121.881.97
201023.4247.738.2812.7039.3942.461.921.90
201543.2638.758.219.7828.9536.511.891.79
Ag19861.1349.070.617.6810.5620.641.732.05
19951.7454.510.918.3512.7821.401.682.20
20006.9461.464.2712.2129.7129.211.722.01
20055.7763.642.9311.6222.3427.461.692.10
20108.5160.073.9312.1624.8429.431.842.10
201525.8055.307.4212.6527.2731.591.881.79
Re19861.9663.550.928.579.8016.001.561.99
19954.8259.822.889.7918.7718.631.571.96
200034.8438.4216.5118.8939.5943.821.791.98
200530.2043.2214.9319.5138.2642.832.011.99
201047.9827.4115.4413.5631.5737.682.001.86
201572.0311.489.495.0216.4622.251.801.71
Notes: All = All regions; Ag = Agricultural region; and Re = Reclamation region.
Table 6. The dynamic of fragmentation character.
RegionYearCOHESIONDIVISIONSPLITAI (%)
PaddyDryPaddyDryPaddyDryPaddyDry
All198698.11599.96251.00000.811468040.025.3096.4398.92
199598.044599.96011.00000.821729563.265.6195.8698.83
200099.505799.95750.99790.8210484.185.5996.2397.92
200599.487599.96390.99850.8061656.175.1696.3298.05
201099.868099.92190.97980.891349.579.2097.3898.02
201599.906099.95740.93770.878416.048.2298.6098.12
Ag198698.154199.93851.00000.853992003.566.8496.2298.83
199598.523199.93150.99990.849914121.566.6696.2598.84
200098.703099.96140.99970.74523768.383.9295.4398.49
200598.831999.95990.99970.73783118.873.8196.2898.61
201099.271799.95050.99860.7790723.664.5296.5798.47
201599.743599.97470.98310.724159.163.6297.8498.28
Re198697.914299.95810.99990.735713992.033.7896.6198.99
199597.611699.95451.00000.776822506.004.4895.6498.78
200099.631199.85350.98630.930872.8314.4696.4996.29
200599.589599.87810.99020.9314101.9414.5796.3696.58
201099.927399.51290.86410.99107.36110.6297.6396.23
201599.96998.94420.66340.99852.97679.9099.0296.62
Notes: All = All regions; Ag = Agricultural regions; Re = Reclamation region; Paddy = Paddy fields; and Dry = Dry farmland.

