Article

A Mapping of Marine Biodiversity Research Trends and Collaboration in the East Asia Region from 1996–2015

1
Department of Scientometric Research, Korea Institute of Science and Technology Information, 66 Hoegi-ro, Dongdaemun-gu, Seoul 02456, Korea
2
Department of Science and Technology Management and Policy, Korea University of Science and Technology, 217 Gajeong-ro, Yuseong-gu, Daejeon 34113, Korea
3
Department of S&T Information Science, Korea University of Science and Technology, 217 Gajeong-ro, Yuseong-gu, Daejeon 34113, Korea
*
Author to whom correspondence should be addressed.
Sustainability 2016, 8(10), 1075; https://doi.org/10.3390/su8101075
Submission received: 27 July 2016 / Revised: 1 October 2016 / Accepted: 17 October 2016 / Published: 23 October 2016

Abstract

:
Many countries define policies to manage oceans and coastal areas in order to utilize marine ecosystems strategically. When we reviewed the strategies and policies of various countries in relation to ocean sustainability, we found that biodiversity preservation is a key issue for policies related to sustainable marine development. We investigated the research trends and collaboration status of China, Japan and South Korea regarding marine biodiversity through the analysis of scientific articles using bibliometric analysis. The results showed that Japan collaborated the most with other countries compared to China and South Korea. All three countries collaborated with the Organization for Economic Cooperation and Development (OECD) and Association of Southeast Asian Nations (ASEAN) countries frequently. South Korea showed the strongest inter-collaboration amongst China, Japan and South Korea. Microorganism research is a common research topic in China, Japan and South Korea. Each country demonstrated its own prominent research area, such as local region research in China, deep-sea research in Japan and aquaculture research in South Korea.

1. Introduction

Twenty years have passed since the forming of the Jakarta Mandate, one of the most important milestones in the history of marine biodiversity. The Jakarta Mandate on Marine and Coastal Biological Diversity was formed in a meeting of Ministers of the Conference of the Parties (COP) in Jakarta in 1995. The Jakarta Mandate stated the importance of marine and coastal biological diversity, as follows: “It should go without saying that the conservation and sustainable use of marine and coastal biodiversity is a prerequisite for future life on our planet. Life started in the sea. It will not go on without life in the sea and its nearshore nurseries.” [1].
The Census of Marine Life (CoML) was conducted by multi-national networks with the support of the Alfred P. Sloan Foundation in 2010. It took ten years, $650 million and over 2700 scientists from more than 80 countries to complete the census. Although this project discovered thousands of new species through books, papers, maps and databases, it did not provide a reliable estimation of the total number of species. The final report of CoML assumed that there were at least one million types of marine life and between tens to hundreds of million types of microbes [2]. One recent study approximated the total number at 1.4–1.6 million. According to this approximation, only 250,000 species, about 18% of the total approximation, were identified [3]. This vast diversity represents resources of living forms and materials that can fulfill the needs of human beings. The human population is continuing to increase, and land-based resources are limited. Therefore, humans need another source of resources and raw materials for various products, such as medicines, biofuels, electricity and food [4]. However, oceans have been neglected by strategy makers [5]. Fortunately, countries and organizations have started to formulate strategic policies to protect the biodiversity of oceans and coastal areas.
The Organization for Economic Co-operation and Development (OECD) held a forum for marine biotechnology, “Marine Biotechnology—Enabling Solutions for Ocean Productivity and Sustainability,” in 2012. The forum reported that collaboration and social engagement is key for establishing values and spreading innovations for the sustainable development of oceans [4]. It has articulated a purpose similar to that of the Jakarta Mandate. According to the executive summary of the report, “The biodiversity of the marine environment may help to address some global challenges through innovative food production systems, new sources of renewable energy, products for health and well-being, and sustainable industries.” [4].

1.1. Ocean Biodiversity Policies of China, Japan and South Korea

China, Japan and South Korea emphasized the importance of marine biodiversity in their policy statements [5,6]. In 2010, the Chinese government published a roadmap to 2050 for marine science and technology. This roadmap provides a comprehensive analysis for the national research and development (R&D) plan, including research trends and requirements for R&D. It summarized other countries’ marine policies and their assessments. Furthermore, it outlines points for China to accept and apply. This roadmap provided long-term research plans for marine biodiversity. As a conclusion to the roadmap to 2050, the plan of action for marine ecological security was launched [5].
Similarly, the Japanese government created the Basic Plan on Ocean Policy in 2013, and its vision upholds Japan as an oceanic state. It contains plans for marine bioenergy and fisheries, and emphasizes a comprehensive and systematic approach for development and conservation [6]. Japan also launched the “National Biodiversity Strategy 2012–2020”. The country has developed strategies to protect marine and coastal biodiversity for sustainable development.
South Korea has also recently taken action to preserve biodiversity. A strategy for national biological diversity was confirmed in 2014 in South Korea. As part of this strategy, an action plan for the protection of coastal areas and fishery resource preservation was launched at the 12th Meeting of the Conference of the Parties to the Convention on Biological Diversity held in Pyeongchang, South Korea. At this conference, the Pyeongchang Roadmap was declared, which included various actions and provided encouragement to member nations. It included “Decision XII/23” for marine and coastal biodiversity. These decisions encouraged collaboration among all actors in the marine sector. It emphasized the importance of ”Encouraging collaboration and communication among relevant international bodies to enhance synergies in addressing marine and coastal diversity” [7]. This decision highlighted the importance of collaboration between China, Japan and South Korea. These countries constitute the biggest economic community in Asia.

1.2. Preceding Research on Bibliometric Analysis for Biodiversity

A number of bibliometric analyses on academic research regarding biodiversity are available. The Science Citation Index (SCI) of the Web of Science (WoS) database is frequently used as a primary database of analysis. Xingjian Liu, Liang Zhang and Song Hong performed a bibliometric analysis for global biodiversity during the period between 1900 and 2009 based on Web of Science. Through this analysis, they addressed the biodiversity research trends of top journals, researchers, and countries [8]. Wei Li and Yang Zhao performed, through bibliometric analysis on a 20-year period, a global environment assessment using the Web of Science database [9]. Currently, other databases are also being used for bibliometric analyses. There are comparative studies among several databases, such as Web of Science, Scopus and Google Scholar [10,11]. Compared to other databases, Scopus is the strongest competitor of Web of Science because Scopus has a well-organized system for conducting various bibliometric analyses. However, Qi Wang and Ludo Waltman examined and compared the journal classification system of Scopus and Web of Science. The classification system of Web of Science is more accurate than that of Scopus [12]. Therefore, we chose Web of Science as the primary database for our analysis. However, a database merger needs to be considered for engaging in more comprehensive research, because the merger has a significant advantage in terms of coverage.
Some studies suggested that international collaboration can tackle global issues for the sustainability of Earth. Masaru Yarime, Yoshiyuki Takeda and Yuya Kajukawa reported on the research status of sustainability science at the institutional level [13]. Bibliometric analysis has been used to examine the collaboration of institutions through co-authorship and also the productivity of each country. This has been done through the use of a number of published articles in other research fields. They suggested that global collaboration can tackle various challenges for sustainability [13].
Saeed-Ul Hassan et al. performed bibliometric analysis of research activity in sustainable development at the country and institutional levels. This study suggested that research trend analysis can help understand how to effectively work together and find various niche strengths [14].
Until now, a bibliometric analysis for marine and coastal biological diversity has not been performed. China, Japan and South Korea have the highest diversity in their surrounding seas, and these three countries account for one-fifth of the world’s GDP [15]. For this reason, we selected China, Japan and South Korea as the subjects for this study.
We investigated a number of research studies to use bibliographic data mapping as an analysis tool for investigating research trends, as indicated in Table 1. We considered other bibliometric mapping analyses for choosing the appropriate methods and data sources. Our first finding was that Web of Science is the most common data source for bibliometric analyses. Then, we chose VOSviewer and Gephi as a visualizing tool to generate maps of research trends using a research topography map because Leydesdorff showed great performance to present global science map via VOSviewer [16,17,18,19]. Hoppen and Vanz also revealed that VOSviewer functionality is suitable for presenting research topics [20]. Yevide et al. also approached the country collaboration network using Gephi in the co-author approach, which is similar to the Gephi approach [21]. Gephi provided us with an effective overlay to present a world collaboration map [22]. VantagePoint (Search Technology, GA, USA) has an excellent function for cleansing data [22].
Fritz and Hanus suggested that an integrated policy is required for maximizing the sustainable use of the seas [24]. Given the high political tension between China, Japan and South Korea, we found that the suggestions of Fritz and Hanus are particularly valuable for the three countries. Collaboration and integrated endeavors toward enhancing the sustainability of the sea need to be promoted even in difficult situations. Moreover, the sea and coastal areas surrounding these three countries have some of the most abundant biodiversity; the coastal biodiversity in the western Pacific, which surrounds China, Japan and South Korea, represents the highest diversity in the area [25]. Therefore, we believe that it is useful to identify the countries’ research trends and collaboration status in the marine biodiversity field that may be significant for the strategic policymaking relevant to their countries’ technological, economic and political environments. In this context, we investigate the collaboration status and research trends of the three countries in relation to the census on marine life.

2. Materials and Methods

2.1. Data

We collected publications related to marine and coastal biological diversity from the bibliometric database of scientific articles provided by the Institute of Scientific Information (ISI) Web of Science (WoS), Thomson Reuter (Philadelphia, PA, USA). The ISI WoS of Thomson Reuter is a well-organized and indexed database used for several bibliometric analyses [17], and it is the most frequently-used database for scientific output analyses [18]. We selected keywords by marine science experts, following which we considered search results. We only selected peer-reviewed journal articles because we wanted to focus on confirmed innovative research results and not review papers nor conference papers. The detailed search query used is as follows:
TS = ((marine OR ocean OR sea OR coast*) AND (biodivers* OR divers*)), Year: 2010–2015, articles only
We imported, sorted and cleansed downloaded WoS data through the VantagePoint program (Search Technology, Atlanta, GA, USA). We combined duplicated words, synonyms and singular and plural forms and removed stop words. We defined “collaboration” as occurring in articles written by authors from different countries or affiliations; because not the author’s nationality, but the country of their affiliation is relevant. We found 50,297 publications referring to marine and coastal biodiversity in the Web of Science database from 1996–2015. In this dataset, we sorted by country to select publications from China, Japan and South Korea, respectively. China produced 3137 publications; Japan produced 2102; and South Korea produced 707 (Table 1). The compound annual growth rate of publication of China is 34%; South Korea is 28%; and Japan is only 19%. In this period, the compound annual growth rate of the world is 11%, implying that all three countries exceeded the world average in 20 years. Since 2003, the production of articles has been increasing. In 2002, the World Summit on Sustainable Development (WSSD) was held in Johannesburg, which was a significant milestone in marine biodiversity. It promoted the preservation of marine living organisms. It greatly promotes the production of research articles.

2.2. Methods

We generated country co-occurrence matrixes and keyword co-occurrence matrixes using VantagePoint and placed co-occurrence matrixes in CSV files for transfer to VOSviewer (Centre for Science and Technology Studies, Leiden University, Leiden, The Netherlands).
VOSviewer is a keyword mapping and clustering software used to produce a topography map using co-occurrence matrixes, which uses a self-developed weighted multi-dimensional scaling method [26]. The VOSviewer mapping and clustering algorithm works as follows: If nodes (research subjects, countries or affiliations) have frequent links among them, nodes will be located close to each other. Eventually, a group of items that has frequent links will creates a cluster. When VOSviewer decided the locations of items, the equation demonstrated similarity Sij (Sij ≥ 0) using the following similarity function:
S i j = m c i j c i i c j j   f o r   i j
where cij denotes the number of co-occurrences of keywords i and j, cii denotes the number of occurrences of keyword i and cjj denotes the number of occurrences of keyword j.
The similarity of the two keywords represents the ratio between co-occurrences of items and the expected co-occurrences [27]. VOSviewer situated items in the topography map by minimizing:
V ( x 1 , , x n ) = i j S i j x i x j 2
subject to:
2 n ( n 1 ) i j S i j x i x j = 1
where V denotes the location of the item and ‖ ‖ denotes the Euclidean norm [27,28].
We used an open-source graphic tool Gephi (The Gephi Consortium, Paris, France) to produce a co-occurrence map of research topics, which consisted both of the three primary countries individually and their relationship with each other. Simply put, the software situated every node on the plain and then drew links among the nodes [29].

3. Results

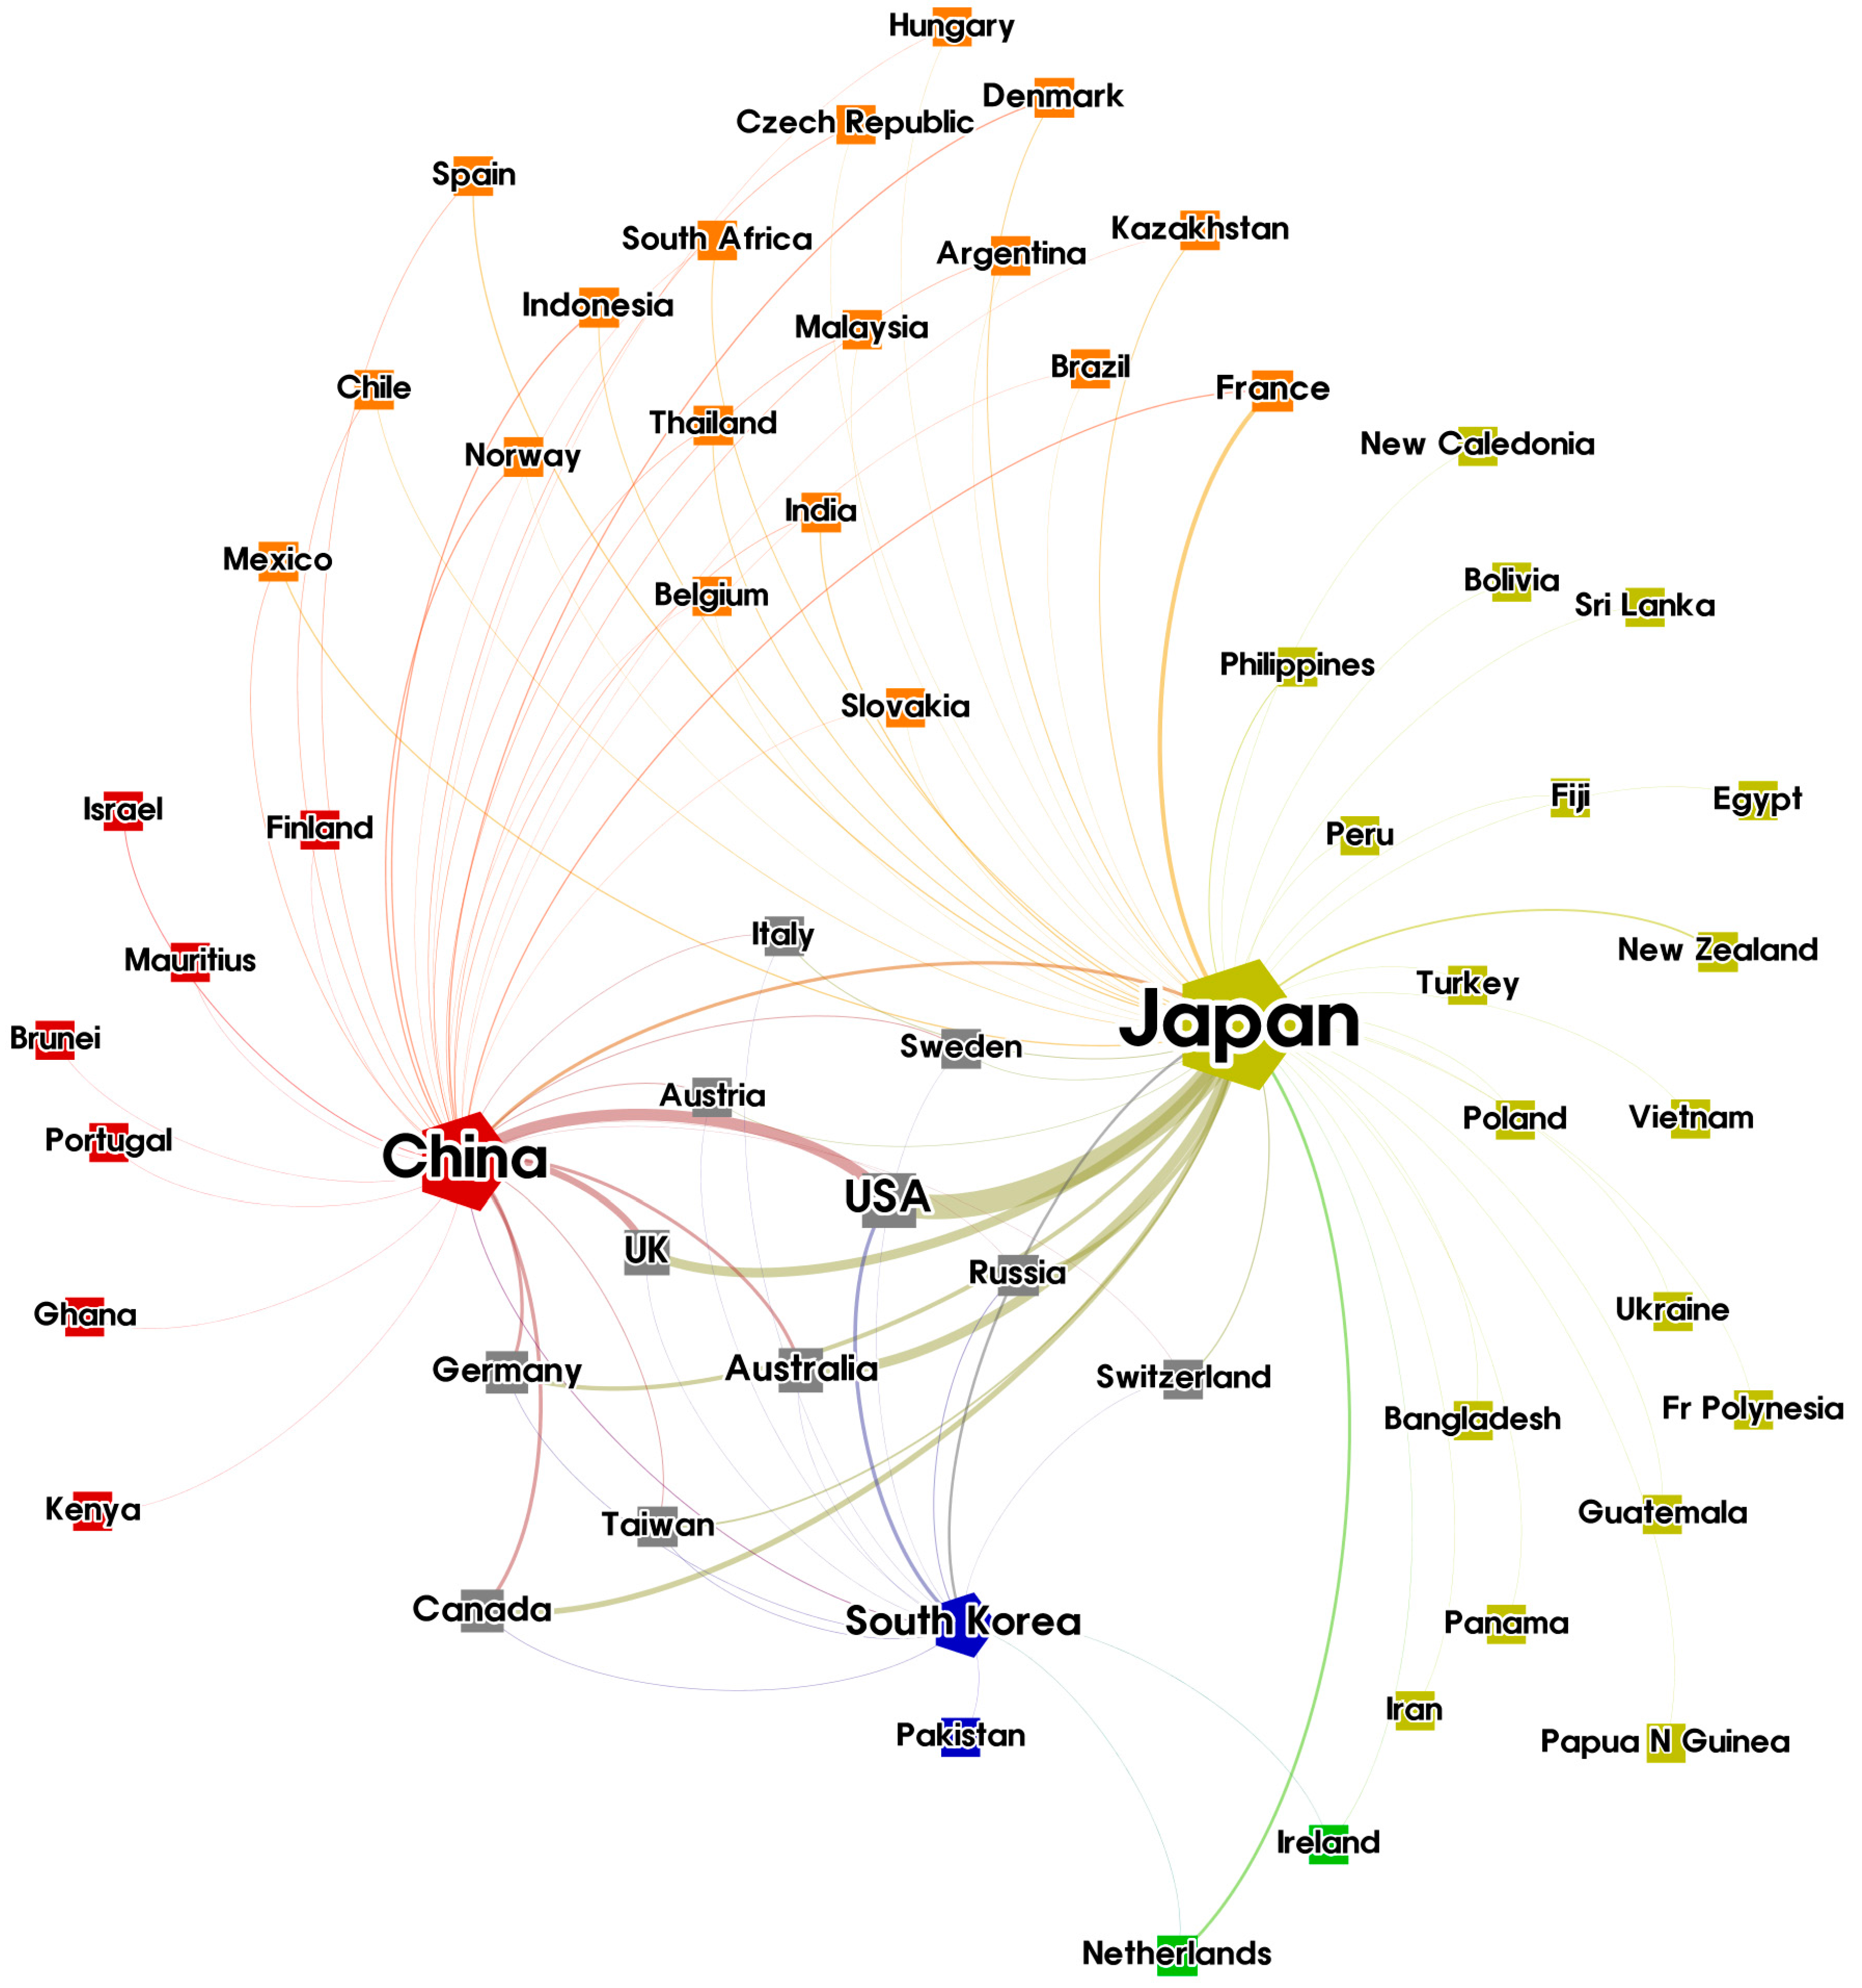
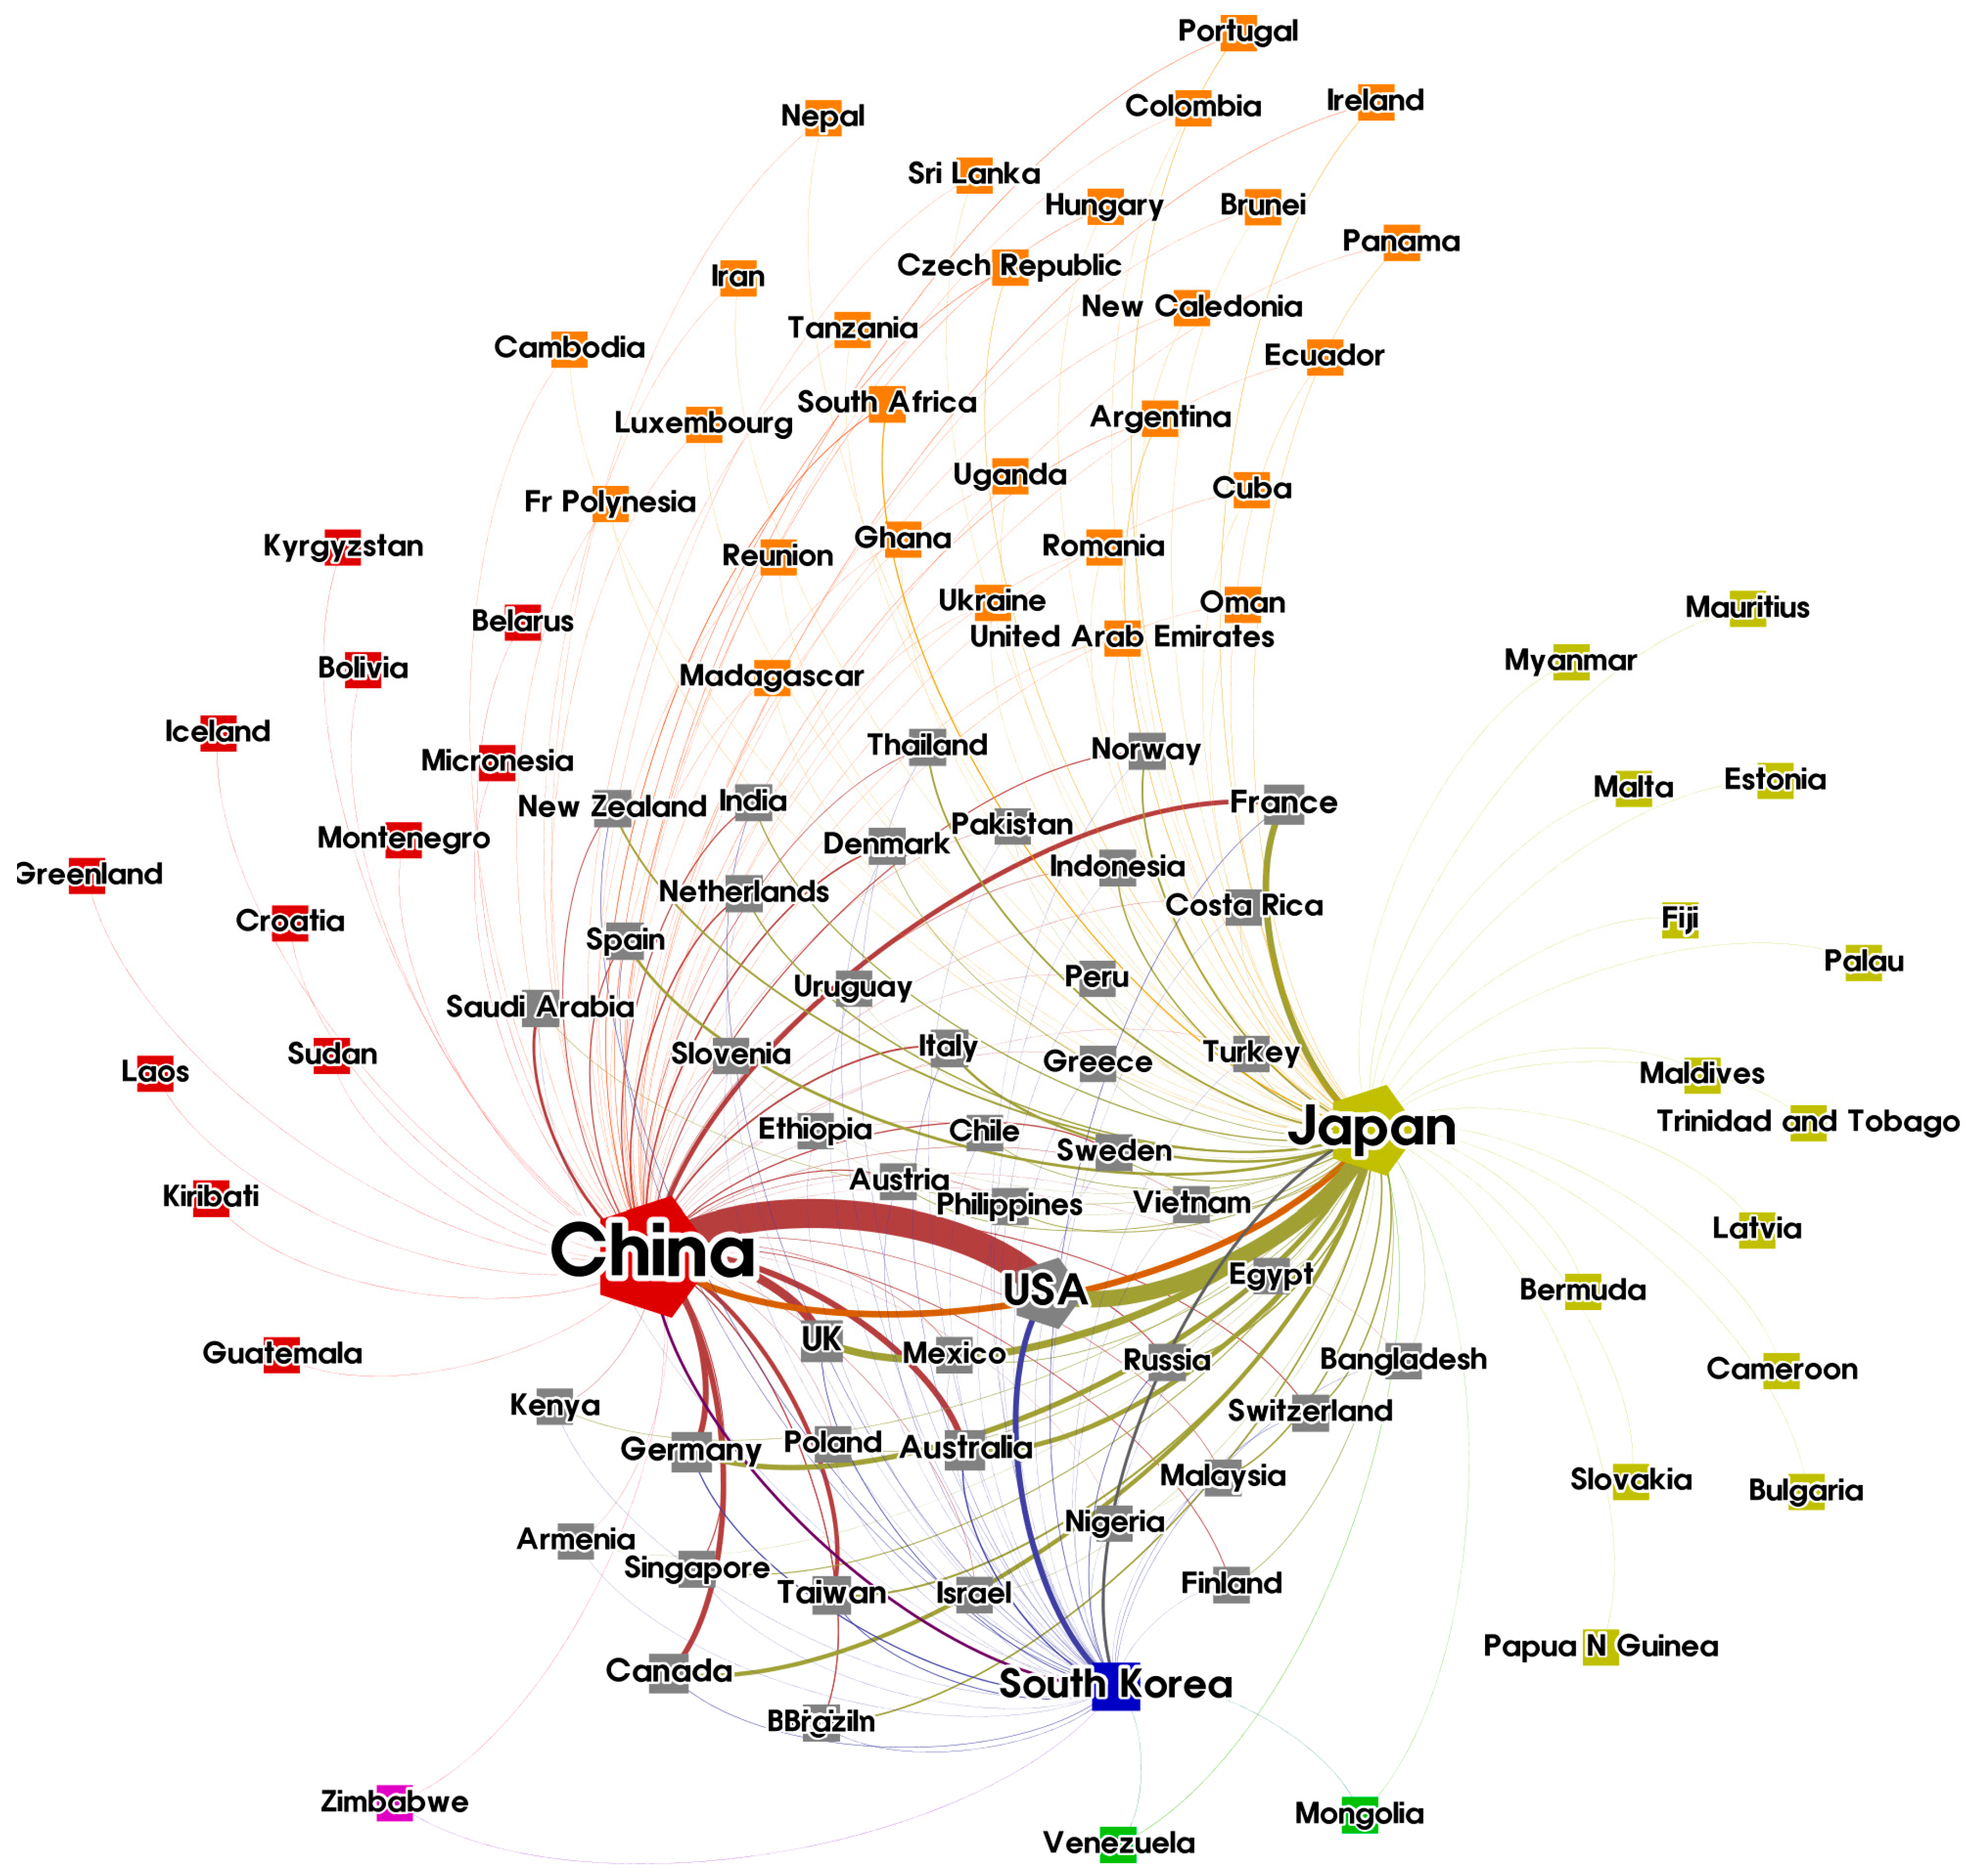
3.1. Collaboration Status of China, Japan and South Korea

First, we analyzed the collaboration strength quantitatively among the three countries in terms of the biodiversity research, which is presented in Table 2. We collected bibliometric data (Web of Science) from the years 1996–2015 and analyzed the co-author relationship. China collaborated with South Korea on 56 articles and with Japan on 134 articles. Japan and South Korea collaborated on 66 articles. We converted this into percentages of the total number of articles for each country. South Korea collaborated on 7.9% of the total articles with China and on 9.3% with Japan, which is a relatively higher ratio than that of the collaboration with the other countries by both Japan and China. Japan produced 3.1% of its total articles with South Korea and 6.4% with China. China produced 1.8% of its articles with South Korea and 4.3% with Japan (Table 3). South Korea exhibited a high percentage of collaboration with China and Japan. We also analyzed the number of authors who worked on collaborated articles in Table 4. Japan had the lowest average number of authors working on collaborated articles, and China had the highest average number of authors working on collaborated articles.
We subsequently investigated the collaboration status of China, Japan and South Korea in relation to the rest of the world through a collaboration map using a co-authorship network. Japan showed the most diverse collaboration with other countries in the first period (Figure 1). Japan collaborated with 49 countries. China collaborated with 36 countries, and South Korea collaborated with only 13 countries. The United States of America (U.S.A.) indicated the strongest collaboration strength with all three countries among any other countries. In collaboration frequency, as well, Japan indicated the most frequent collaboration with other countries.
In the second period, a significant improvement is detected in China and South Korea (Figure 2). Japan continues to reveal the highest variety of collaboration (86 countries). However, China exceeded Japan in the frequency of collaboration. The number of countries that collaborated with China is only slightly lesser than Japan (83 countries). South Korea did not collaborate with South East Asian countries in the first period, but collaborated with most of South East Asian countries, such as Thailand, Indonesia, Philippines, Vietnam, Bangladesh, Malaysia and Singapore, in the second period. This is noteworthy because it implies that South East Asia is becoming an increasingly prominent region in the marine biodiversity field. Particularly, the southern Philippines and central Indonesia are in the 10% richest locations for fish, corals, snails and lobsters [30]. Aquaculture in Thailand and Vietnam are also noteworthy in that the aquaculture industries in Thailand and Vietnam have become major industries requiring serious consideration for sustainable development [31]. Moreover, economic collaboration with three countries in East Asia and South East Asia is increasing. In this context, a deeper analysis of this area will lead to significant knowledge benefit. In addition, all OECD countries are now collaborating with China, Japan and South Korea. One notable thing is that eight of the countries among the 14 countries that collaborated only with Japan are small island countries. This appears to be because of the influence of the geological location of Japan.

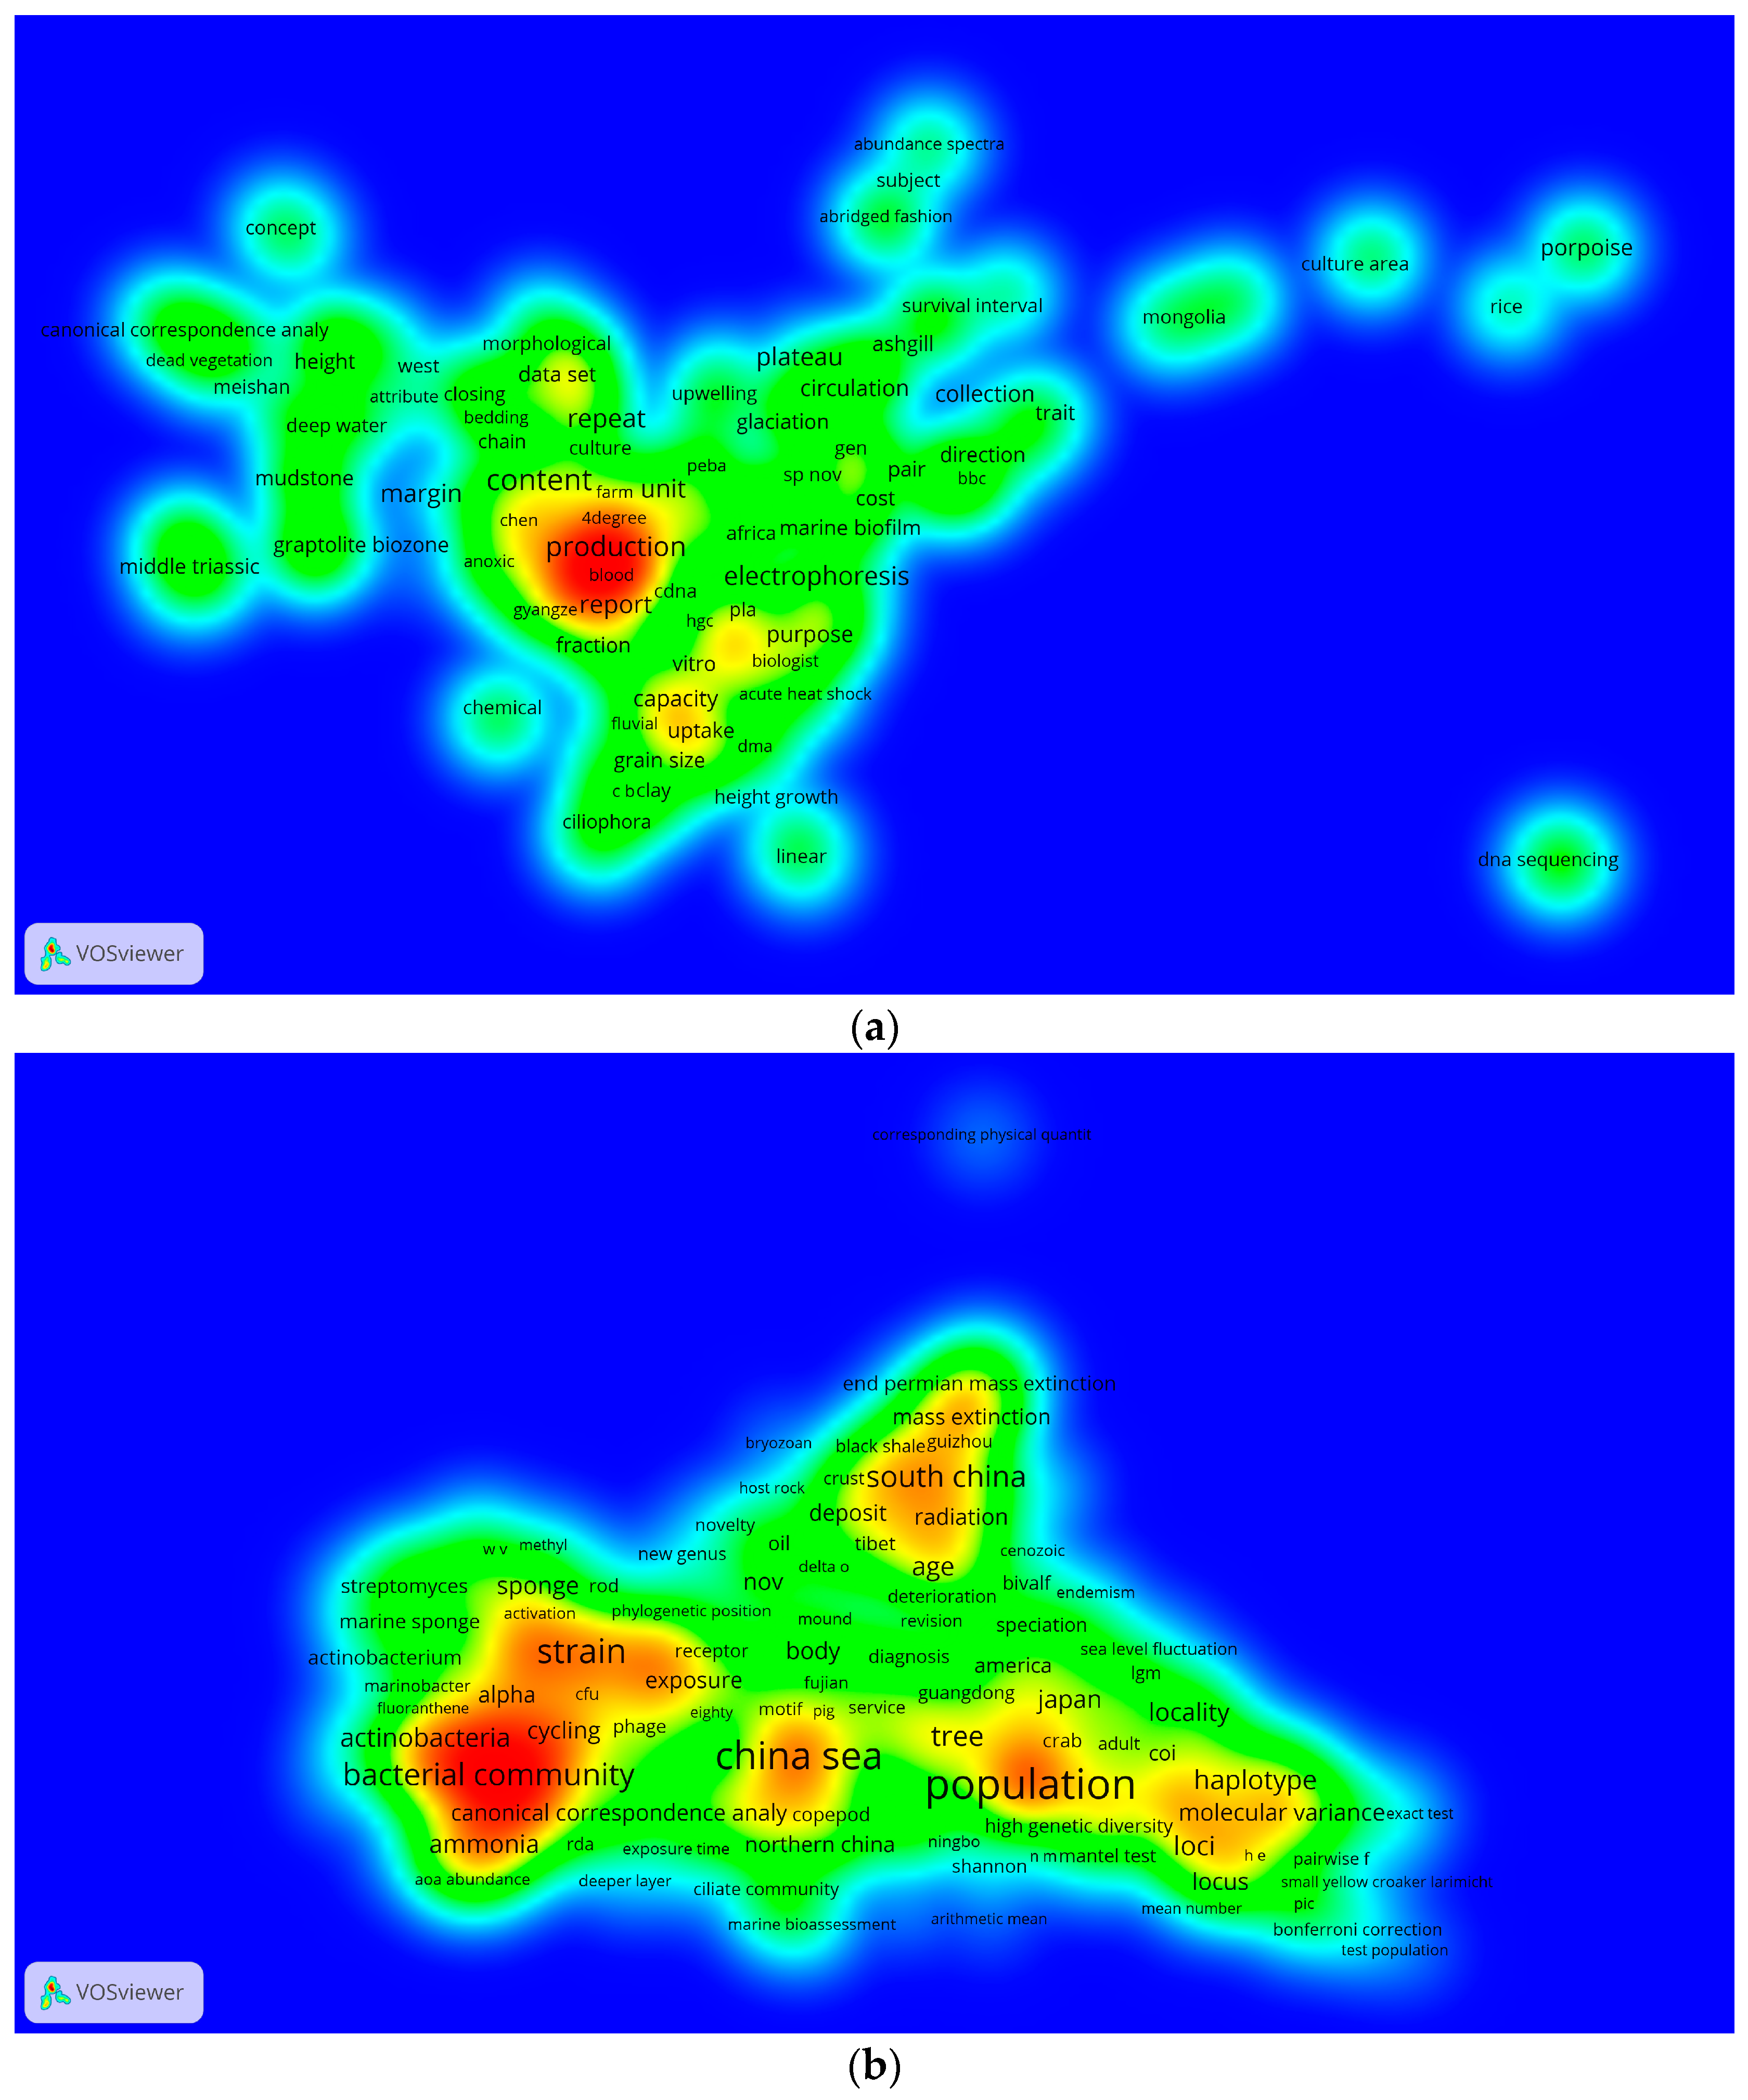
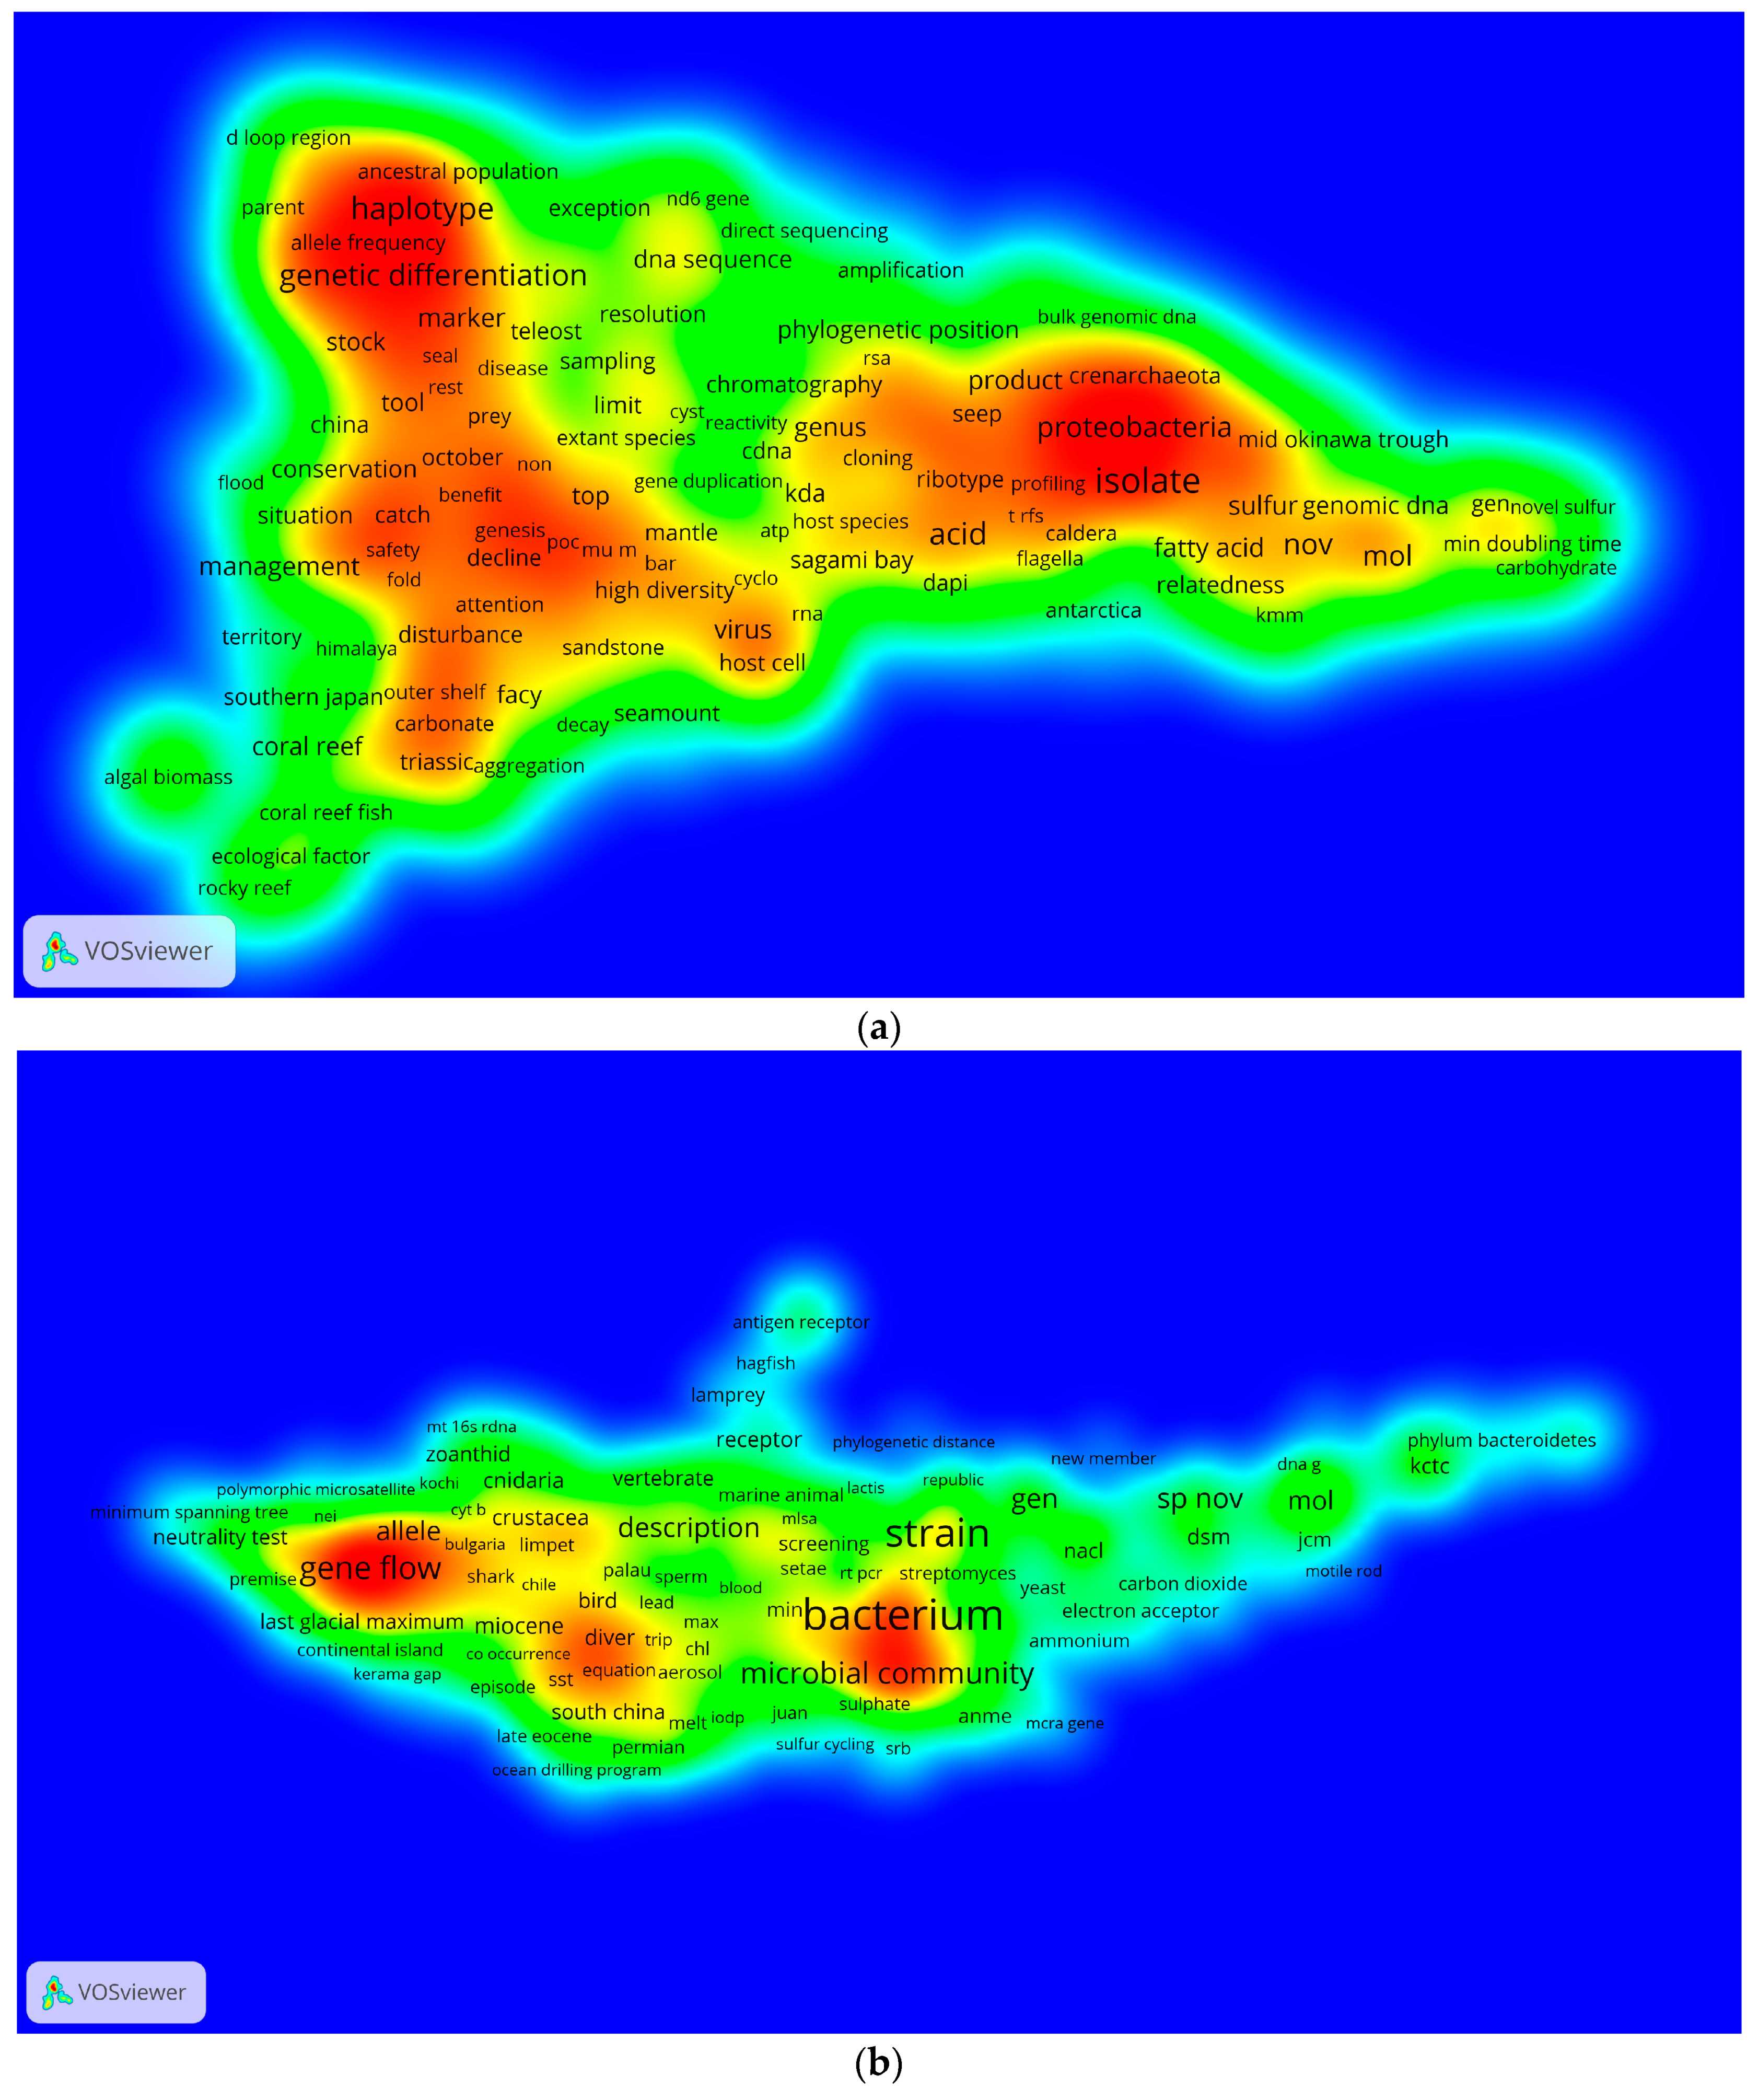
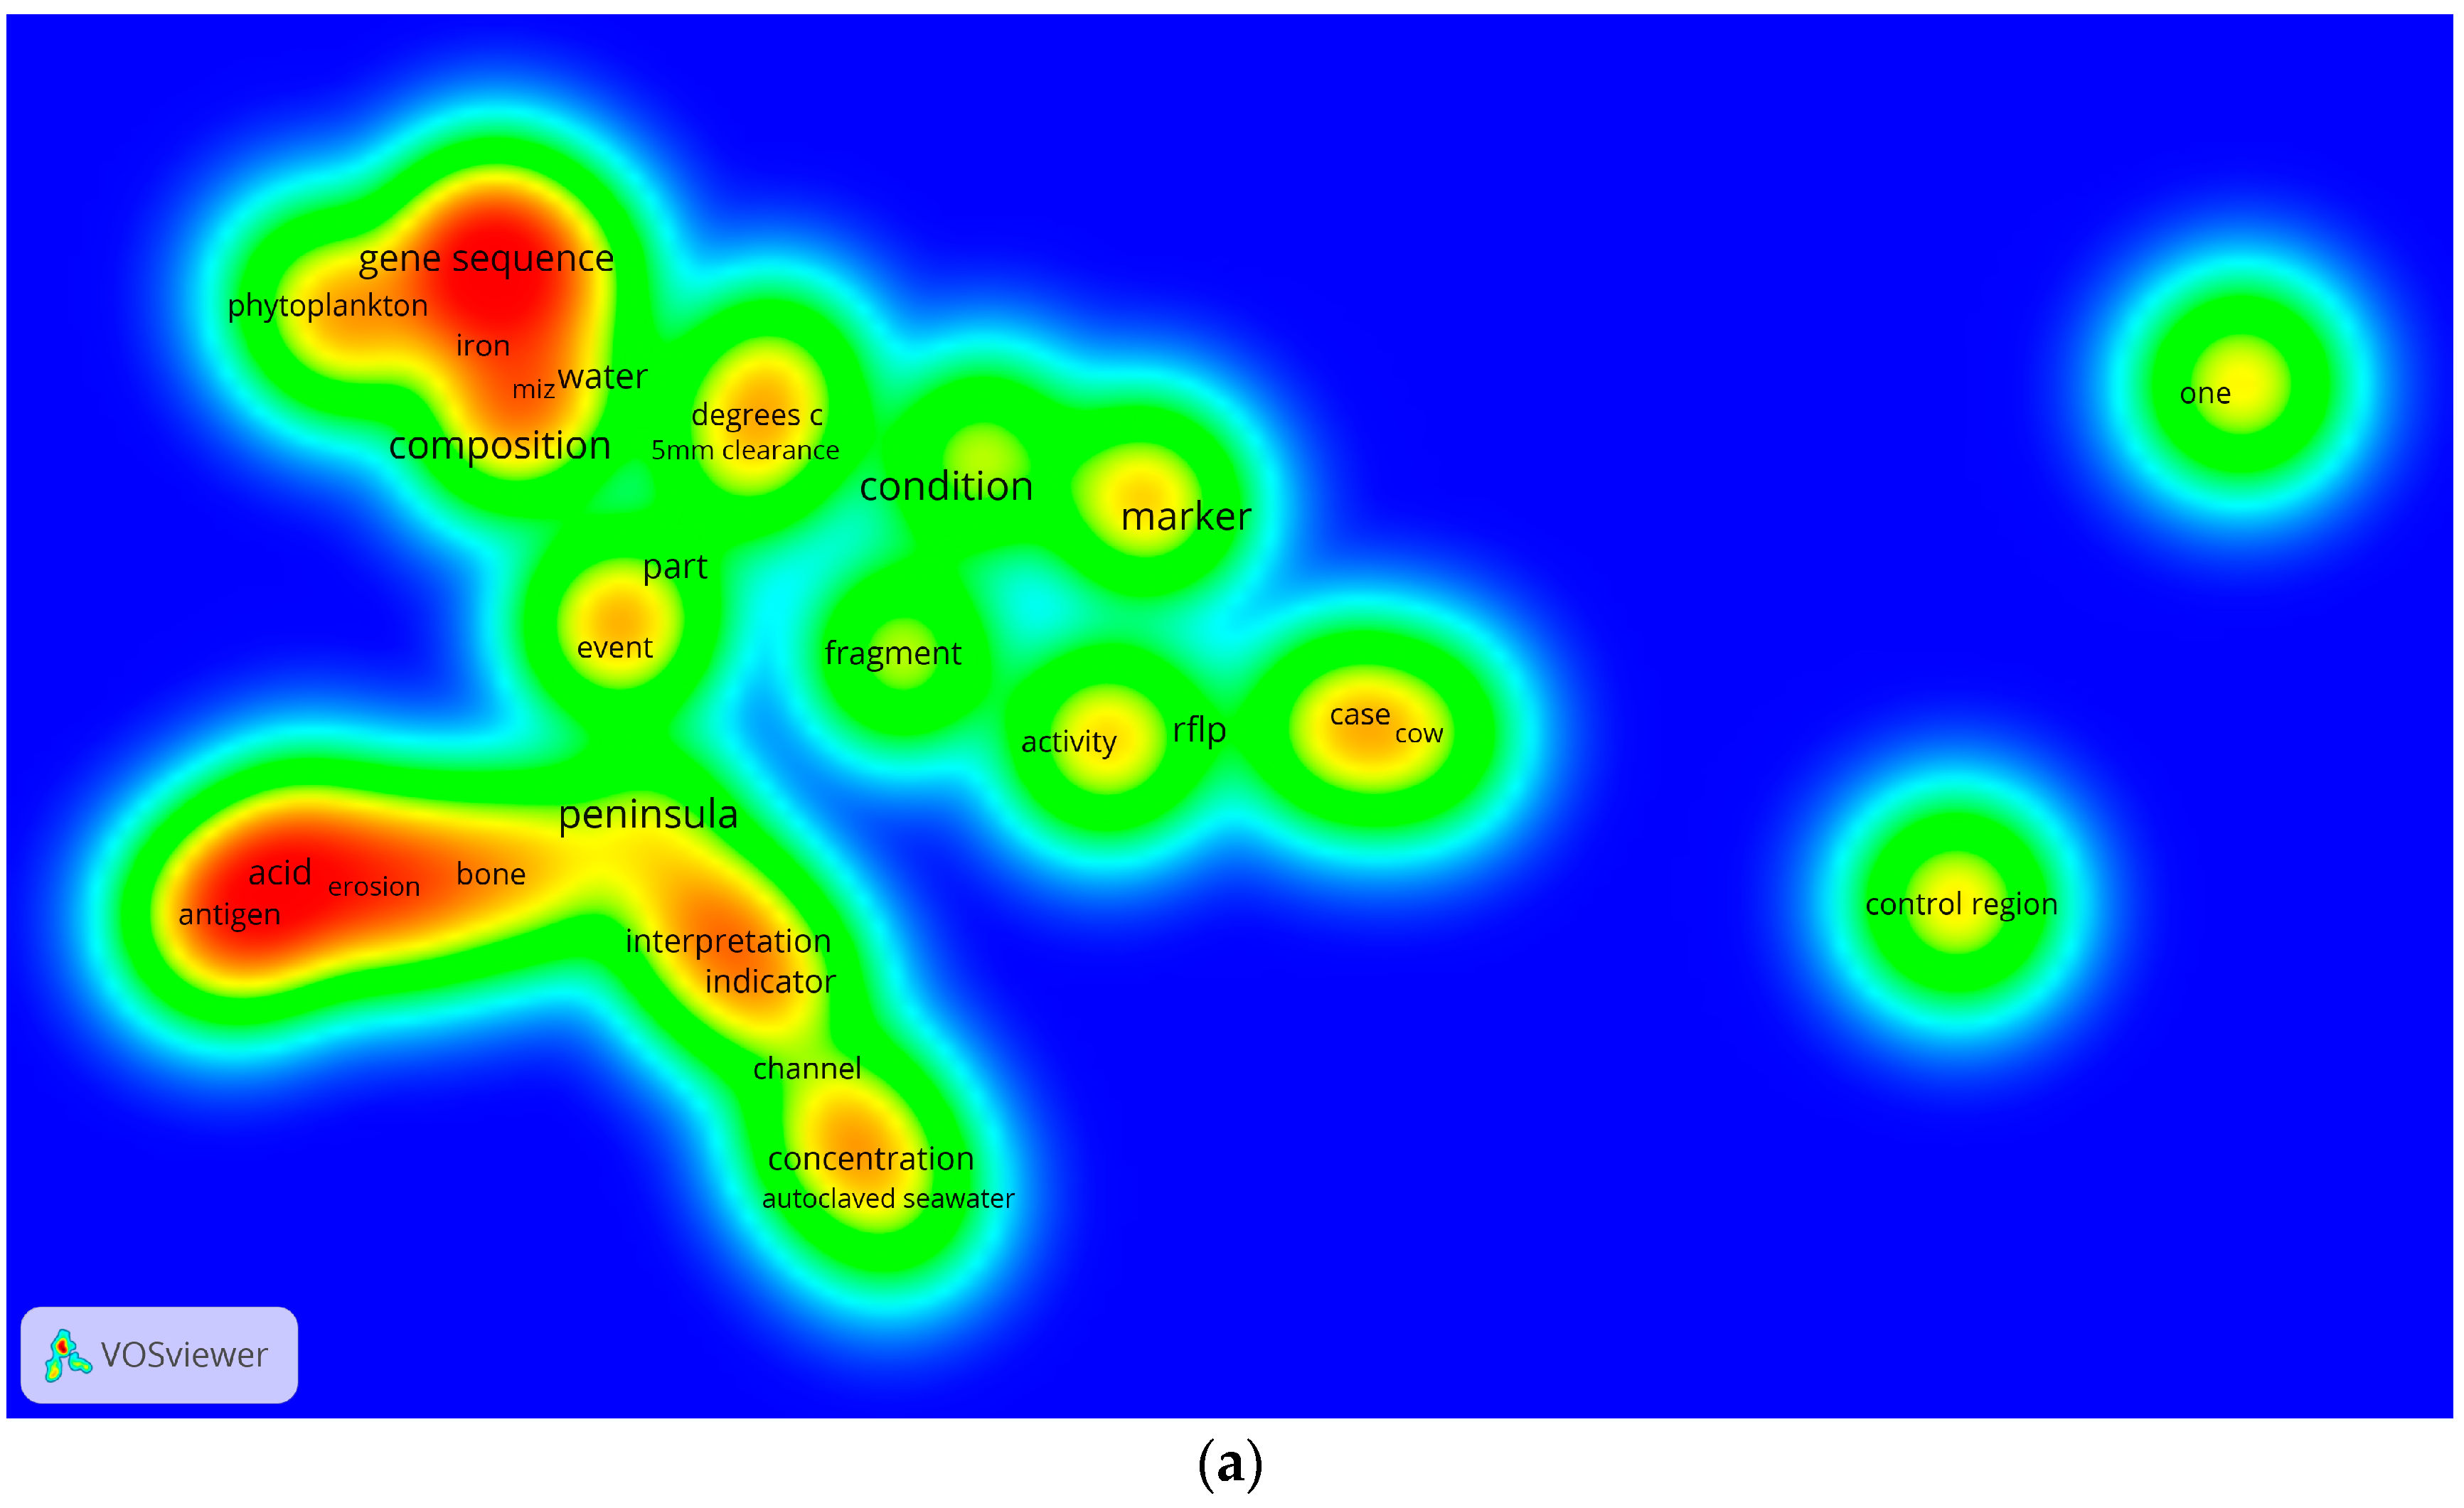
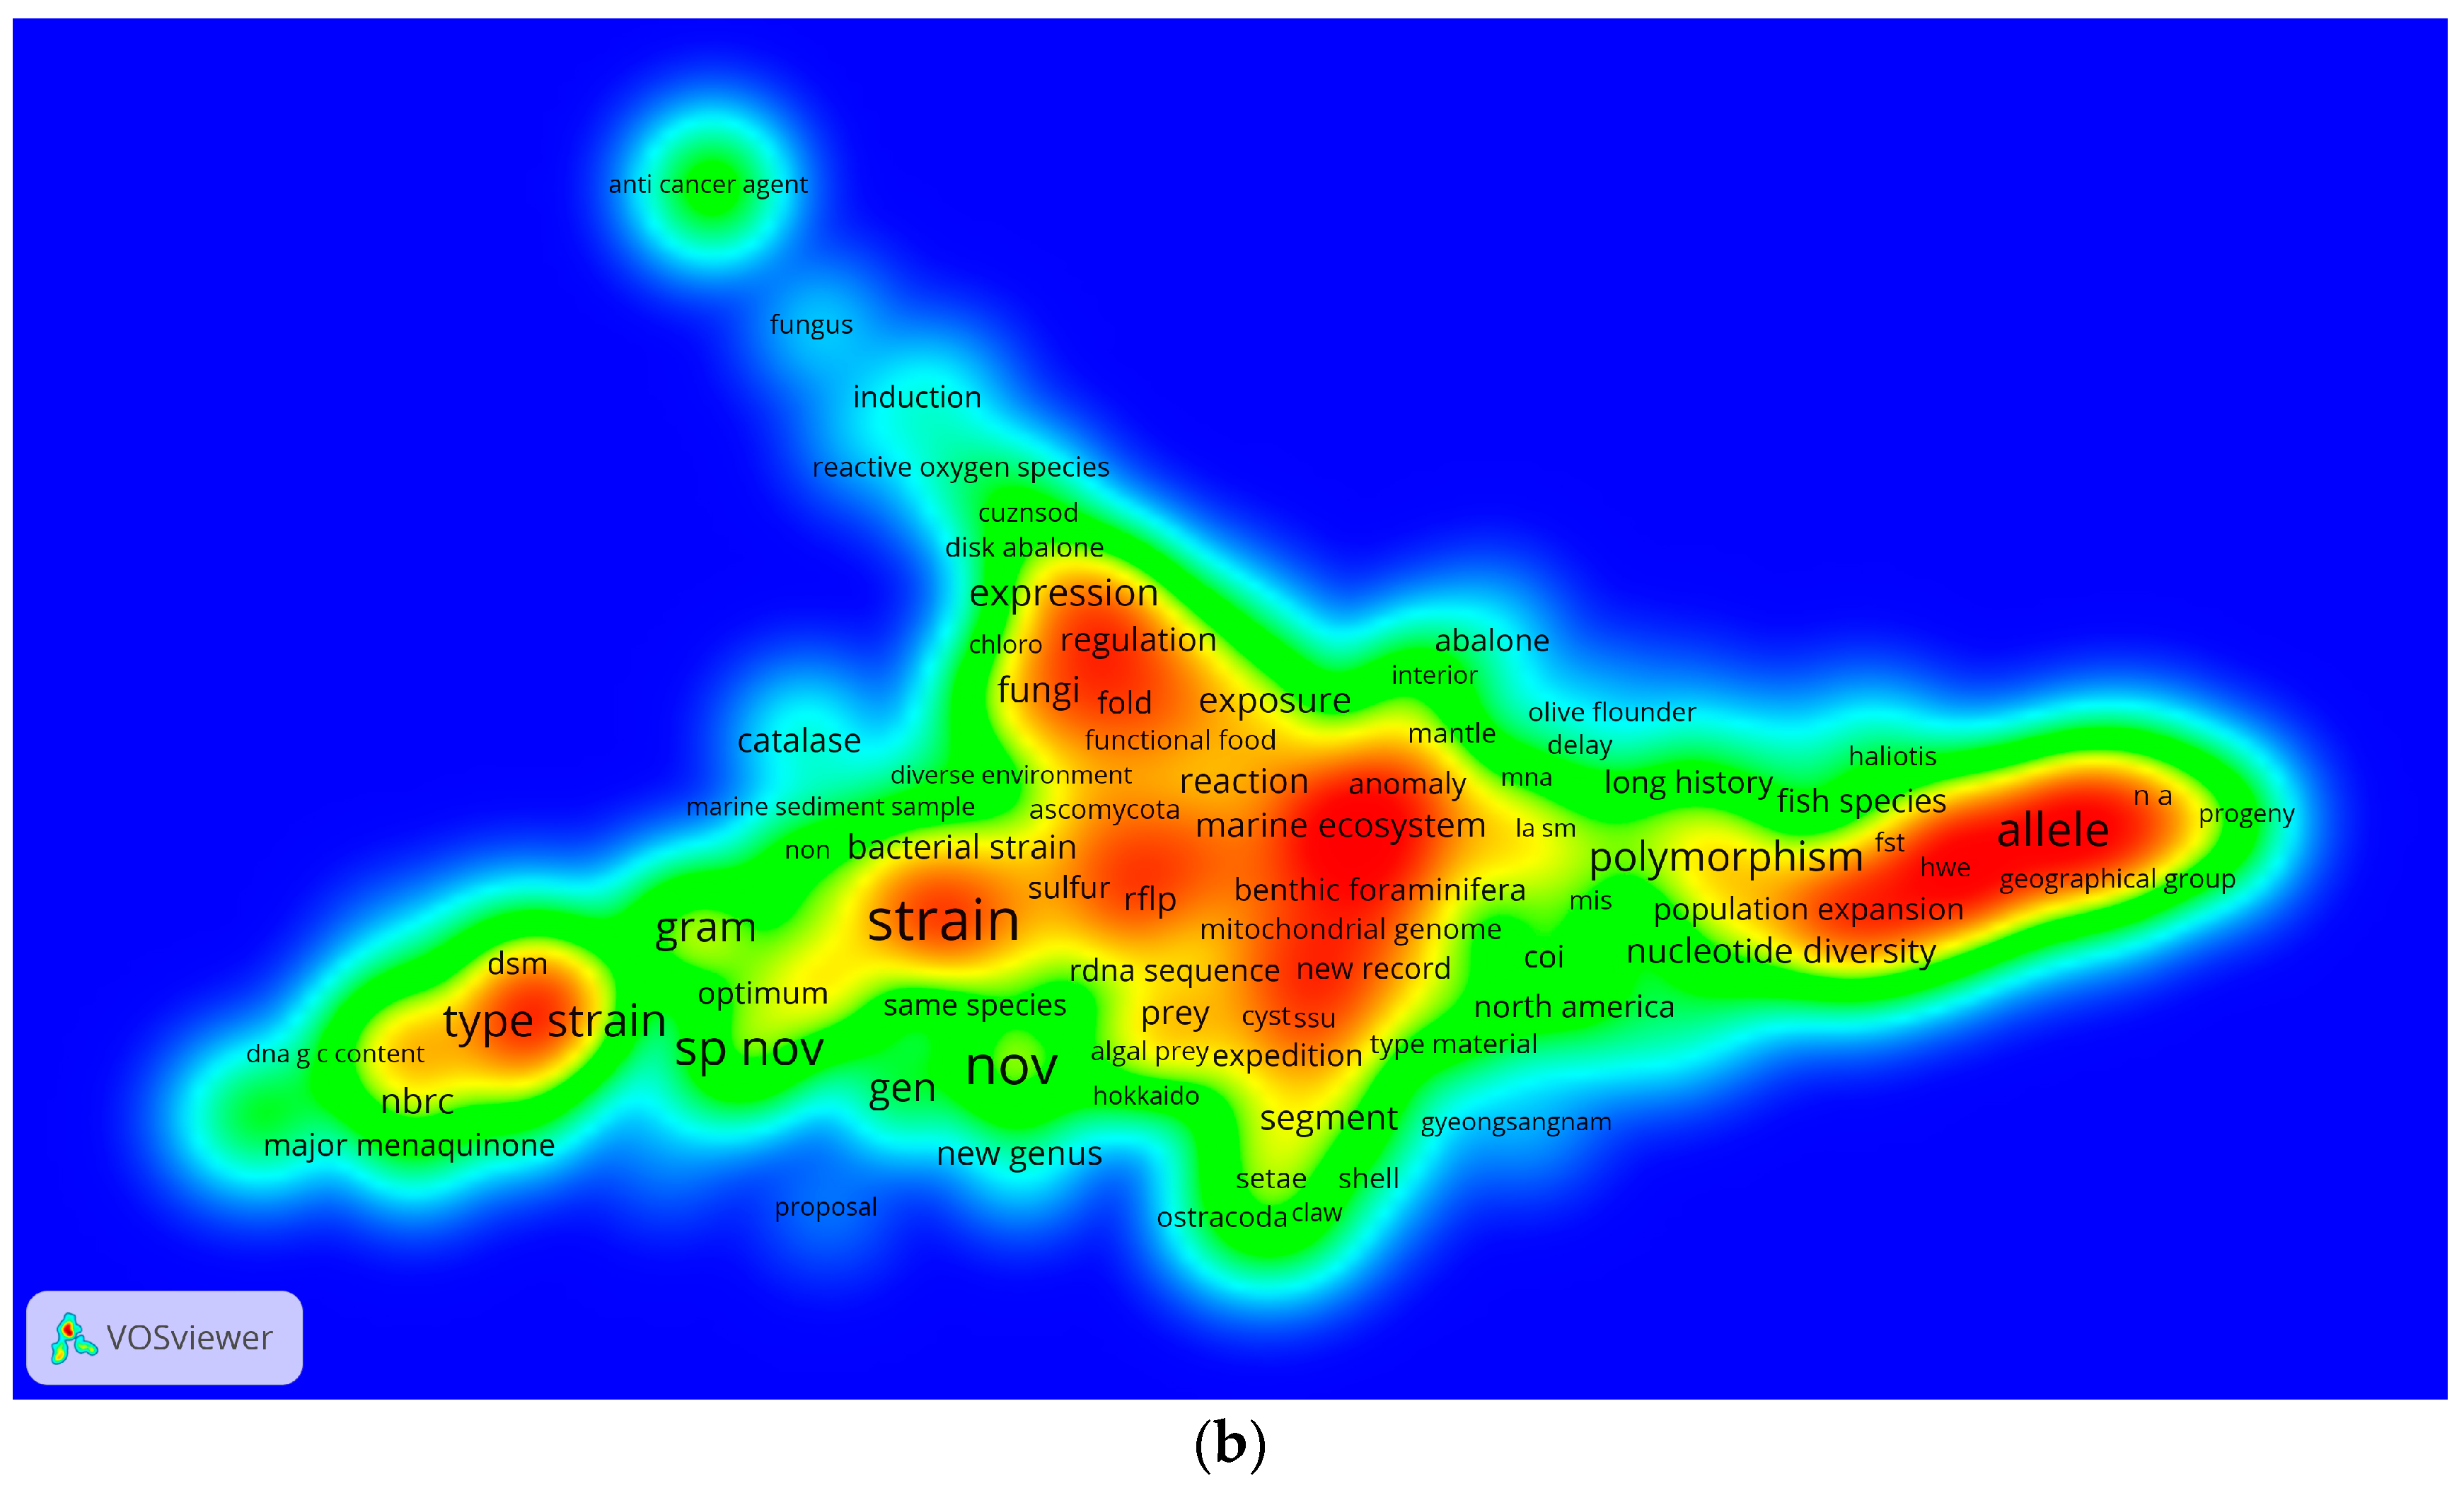
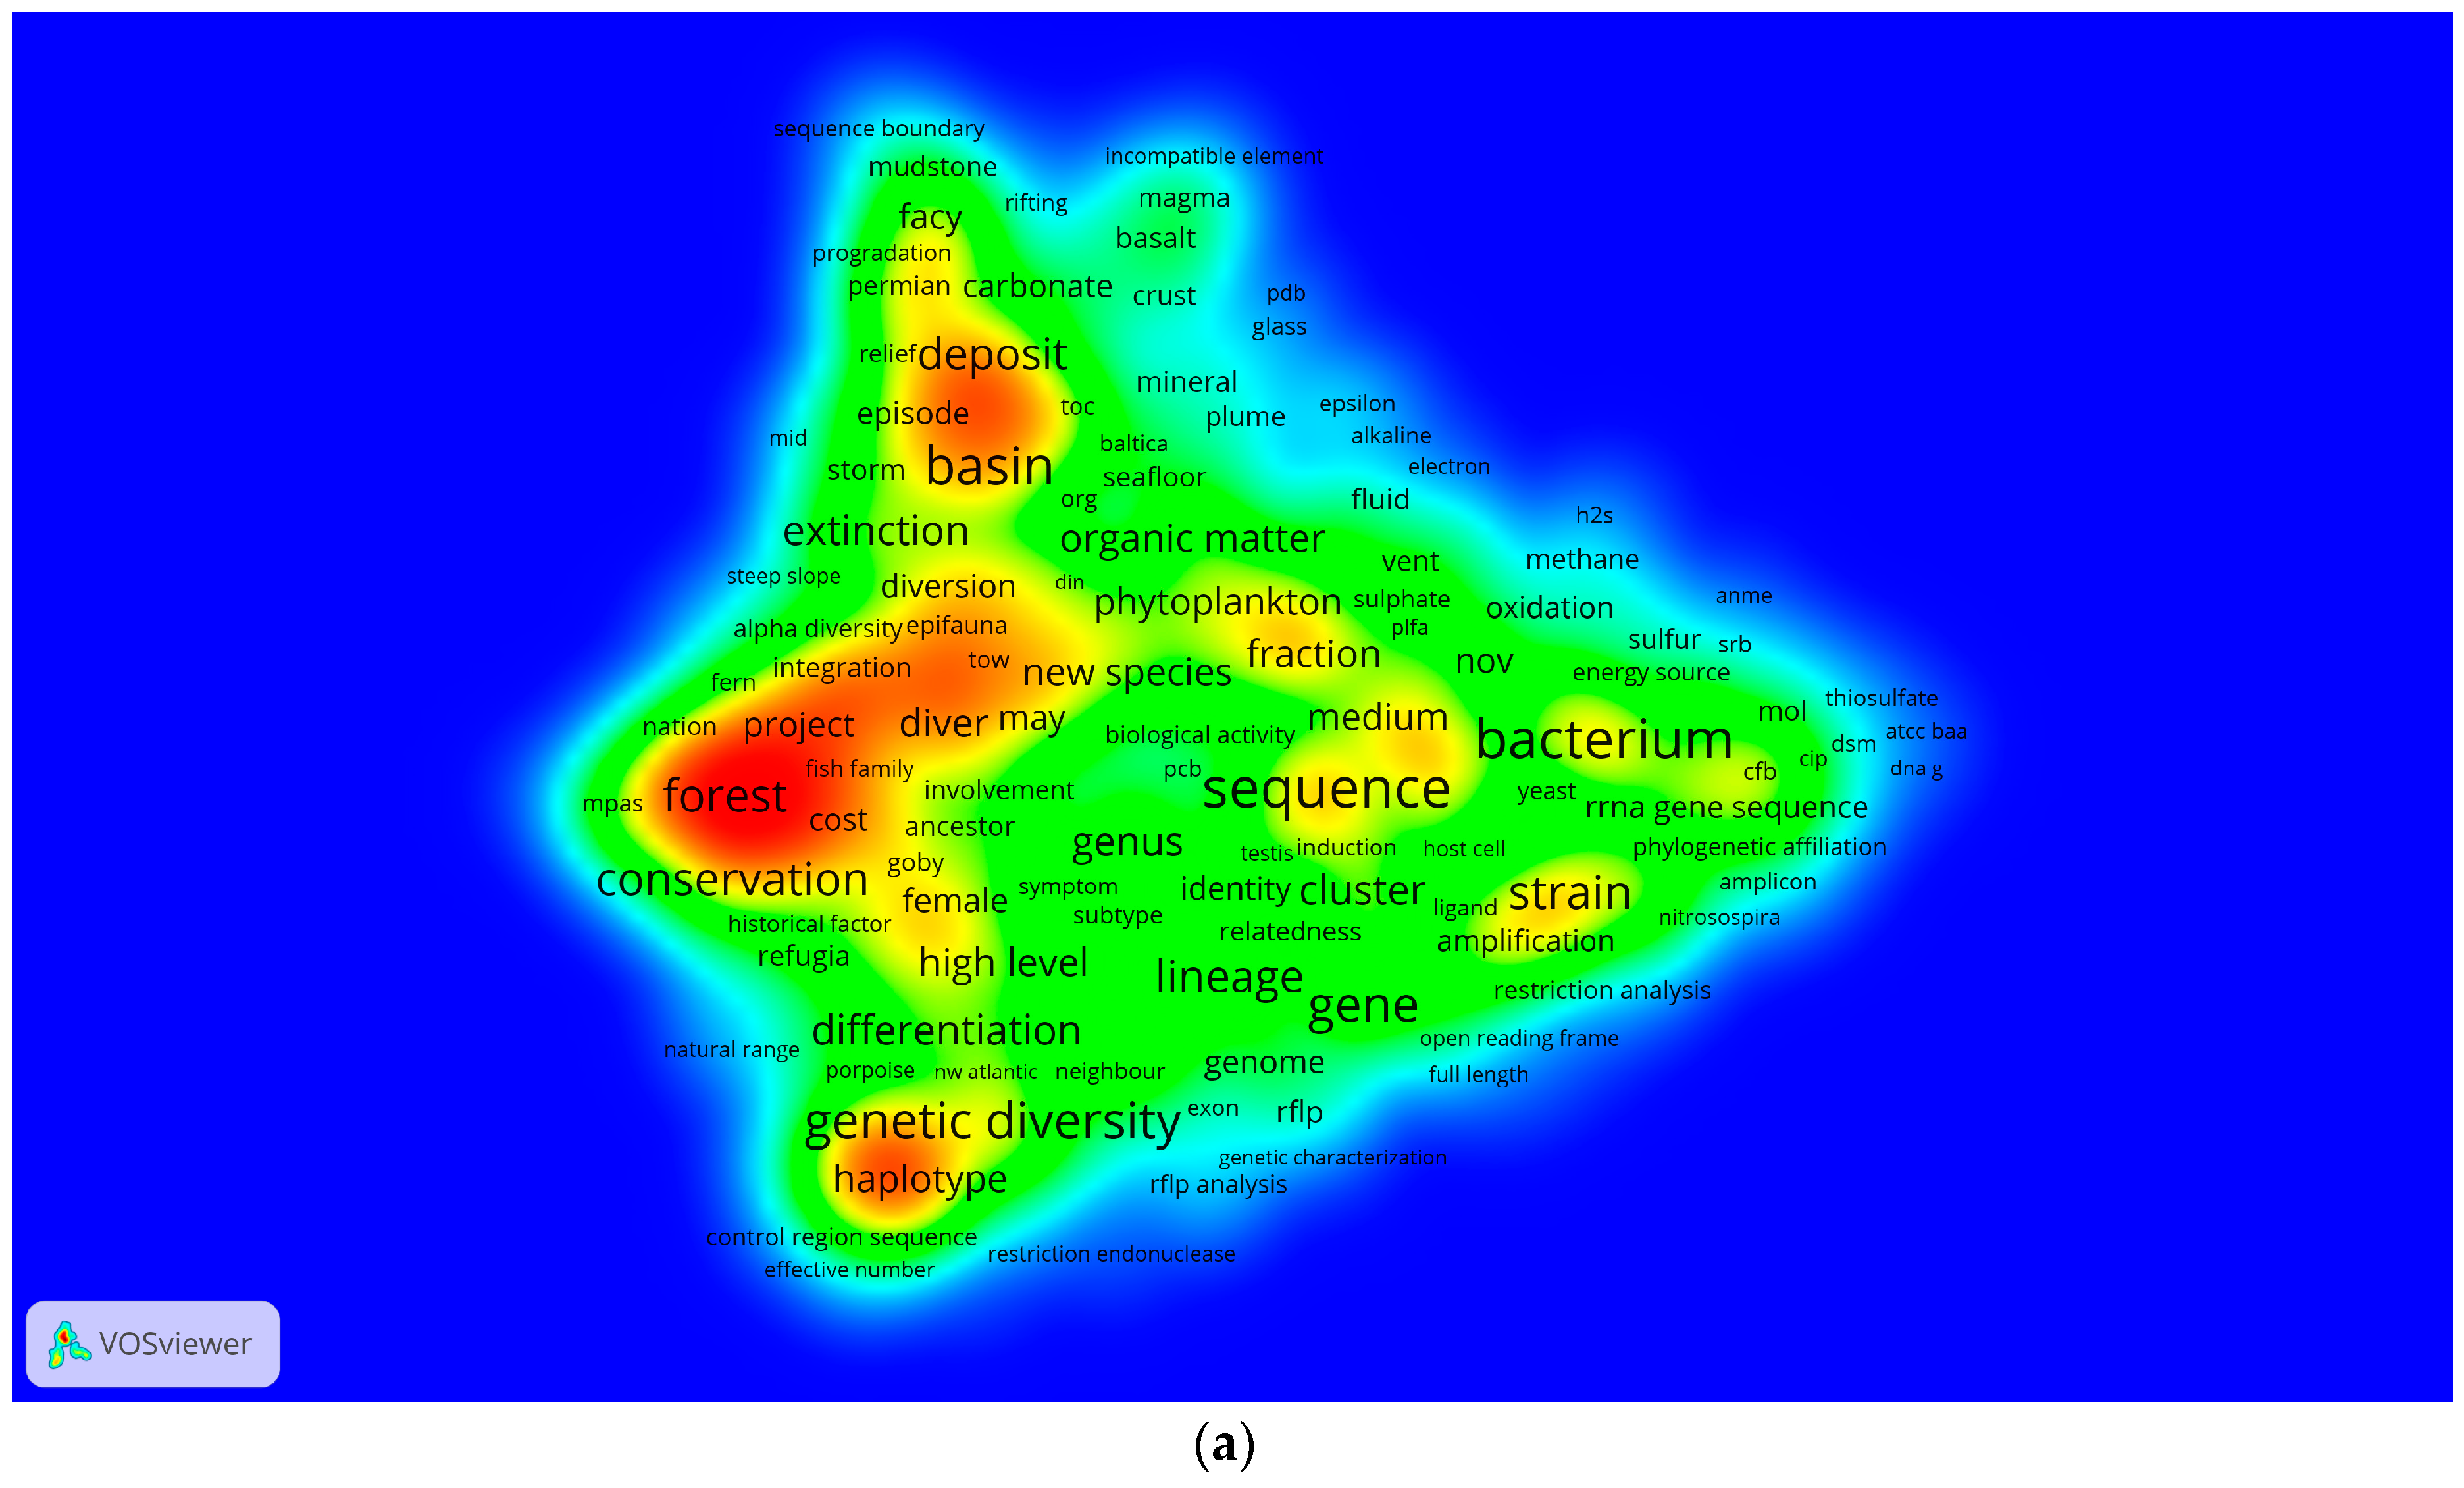
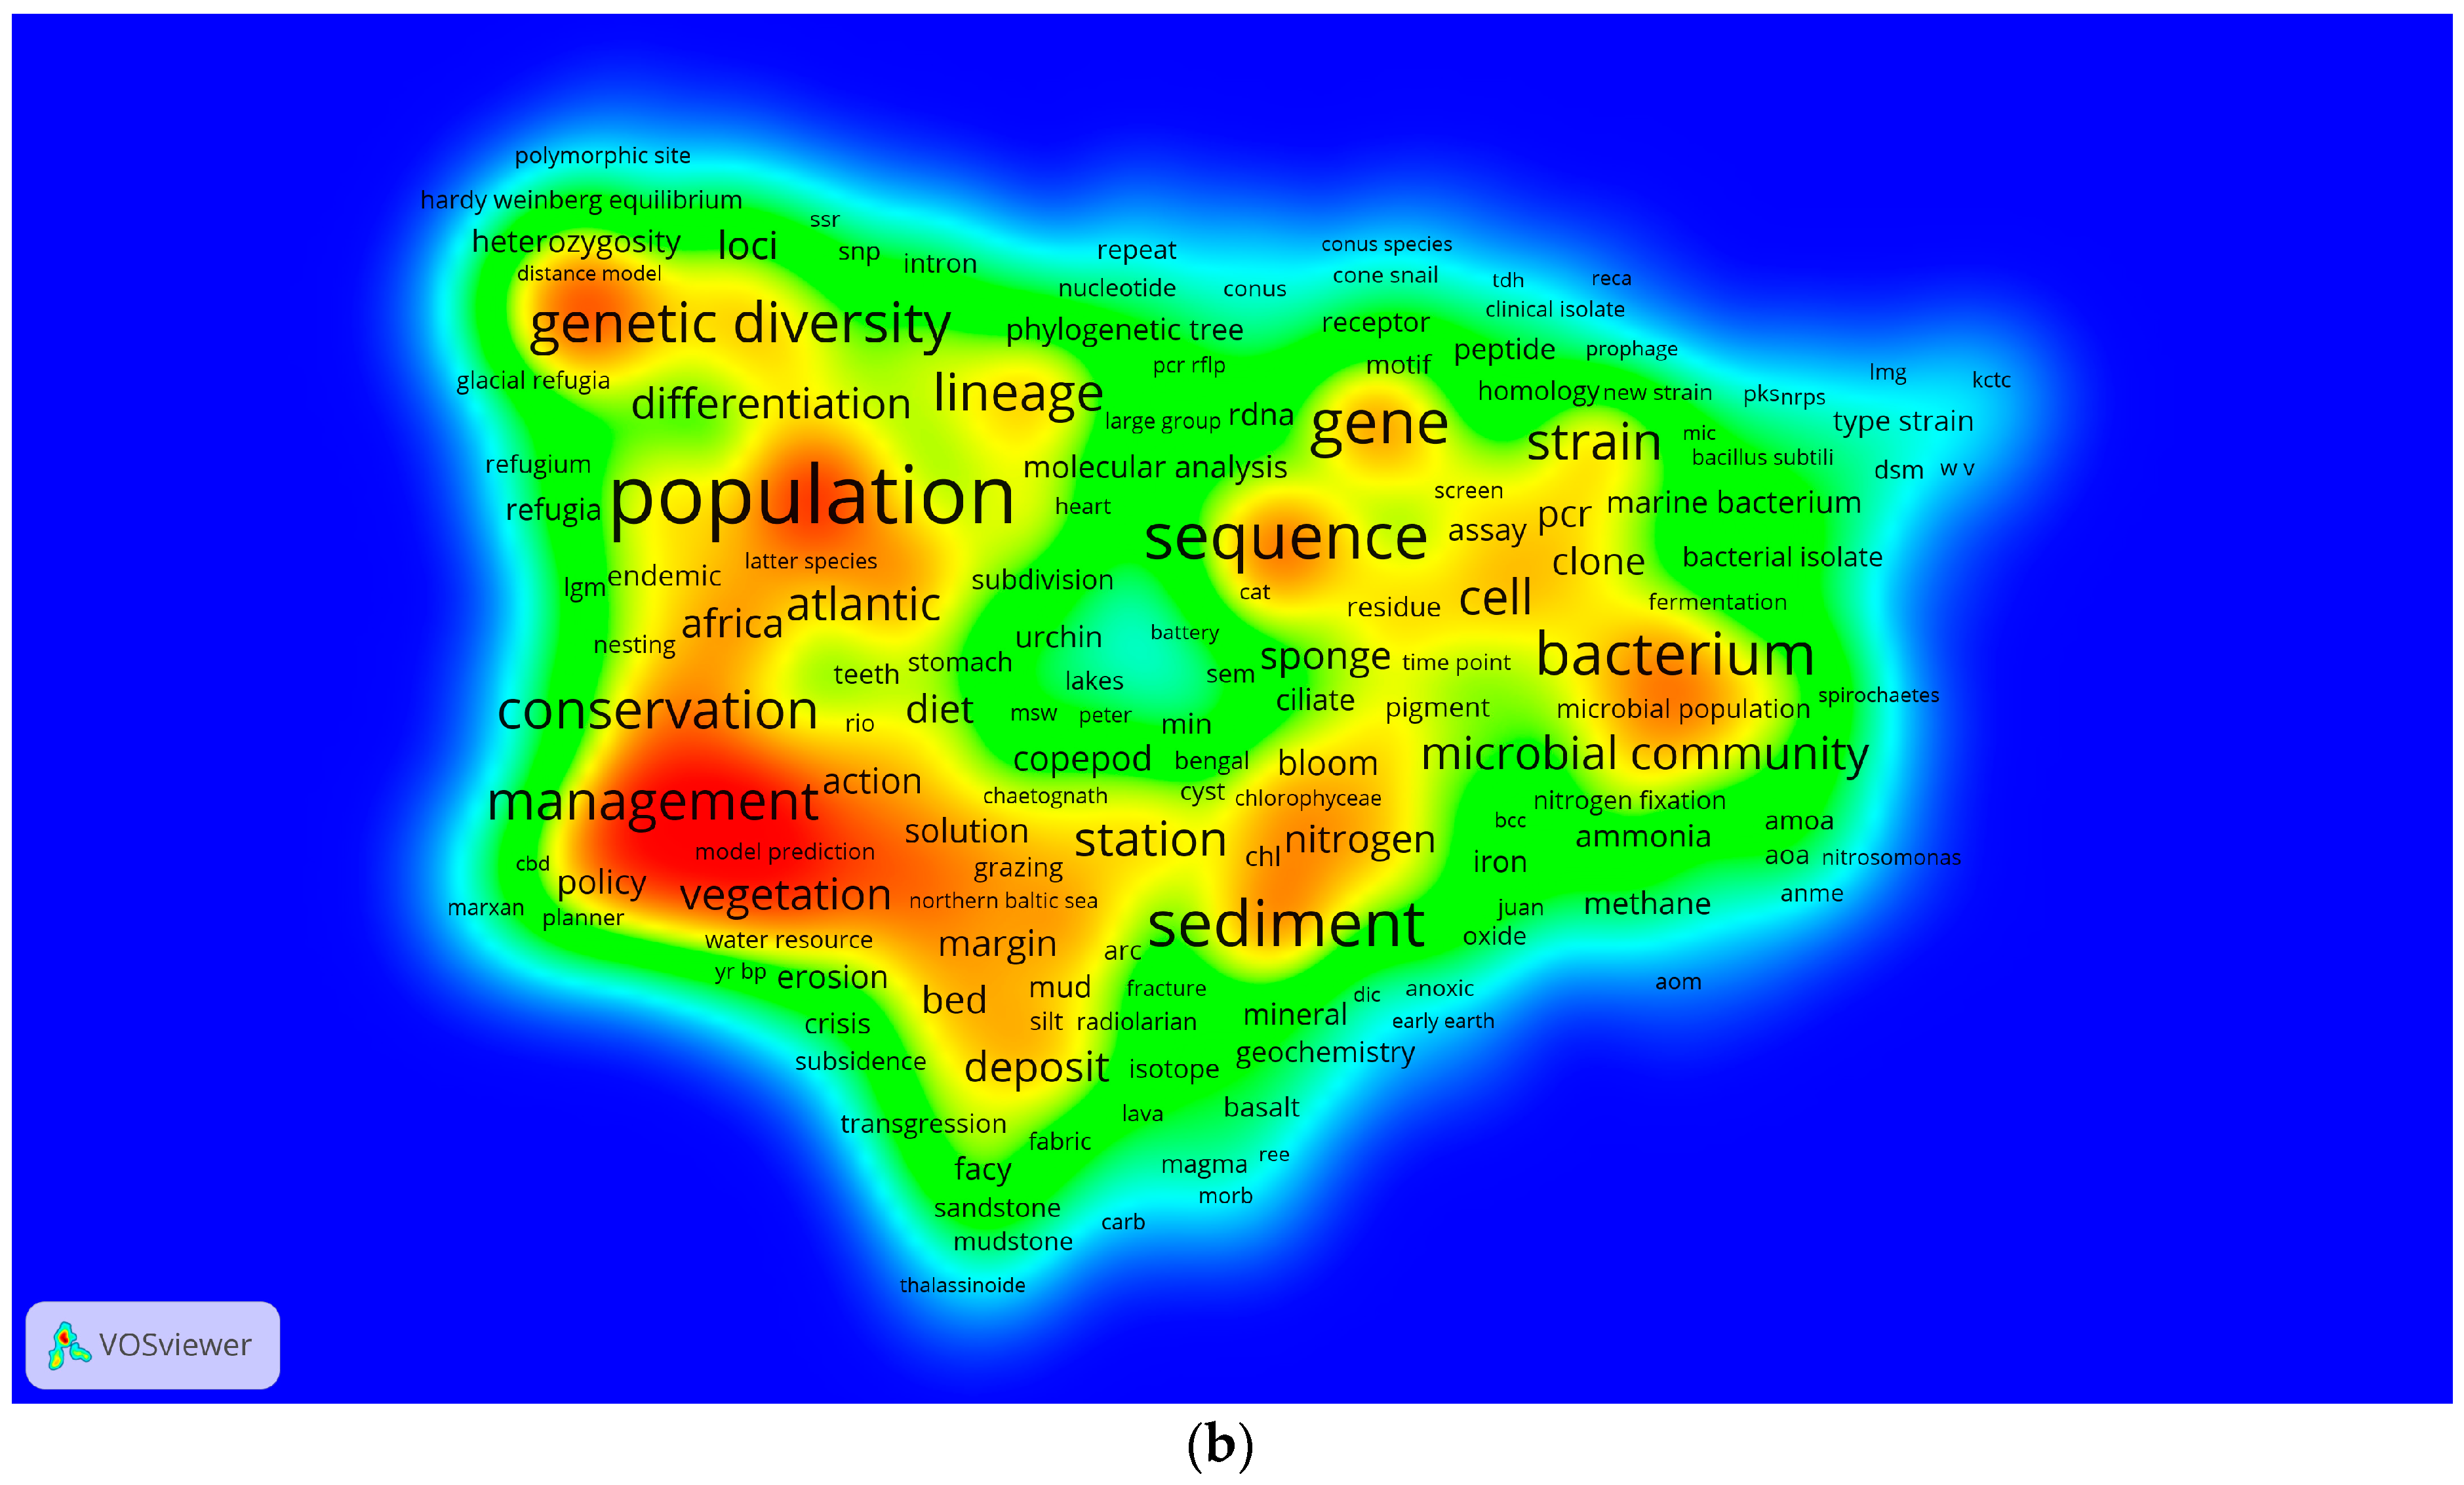
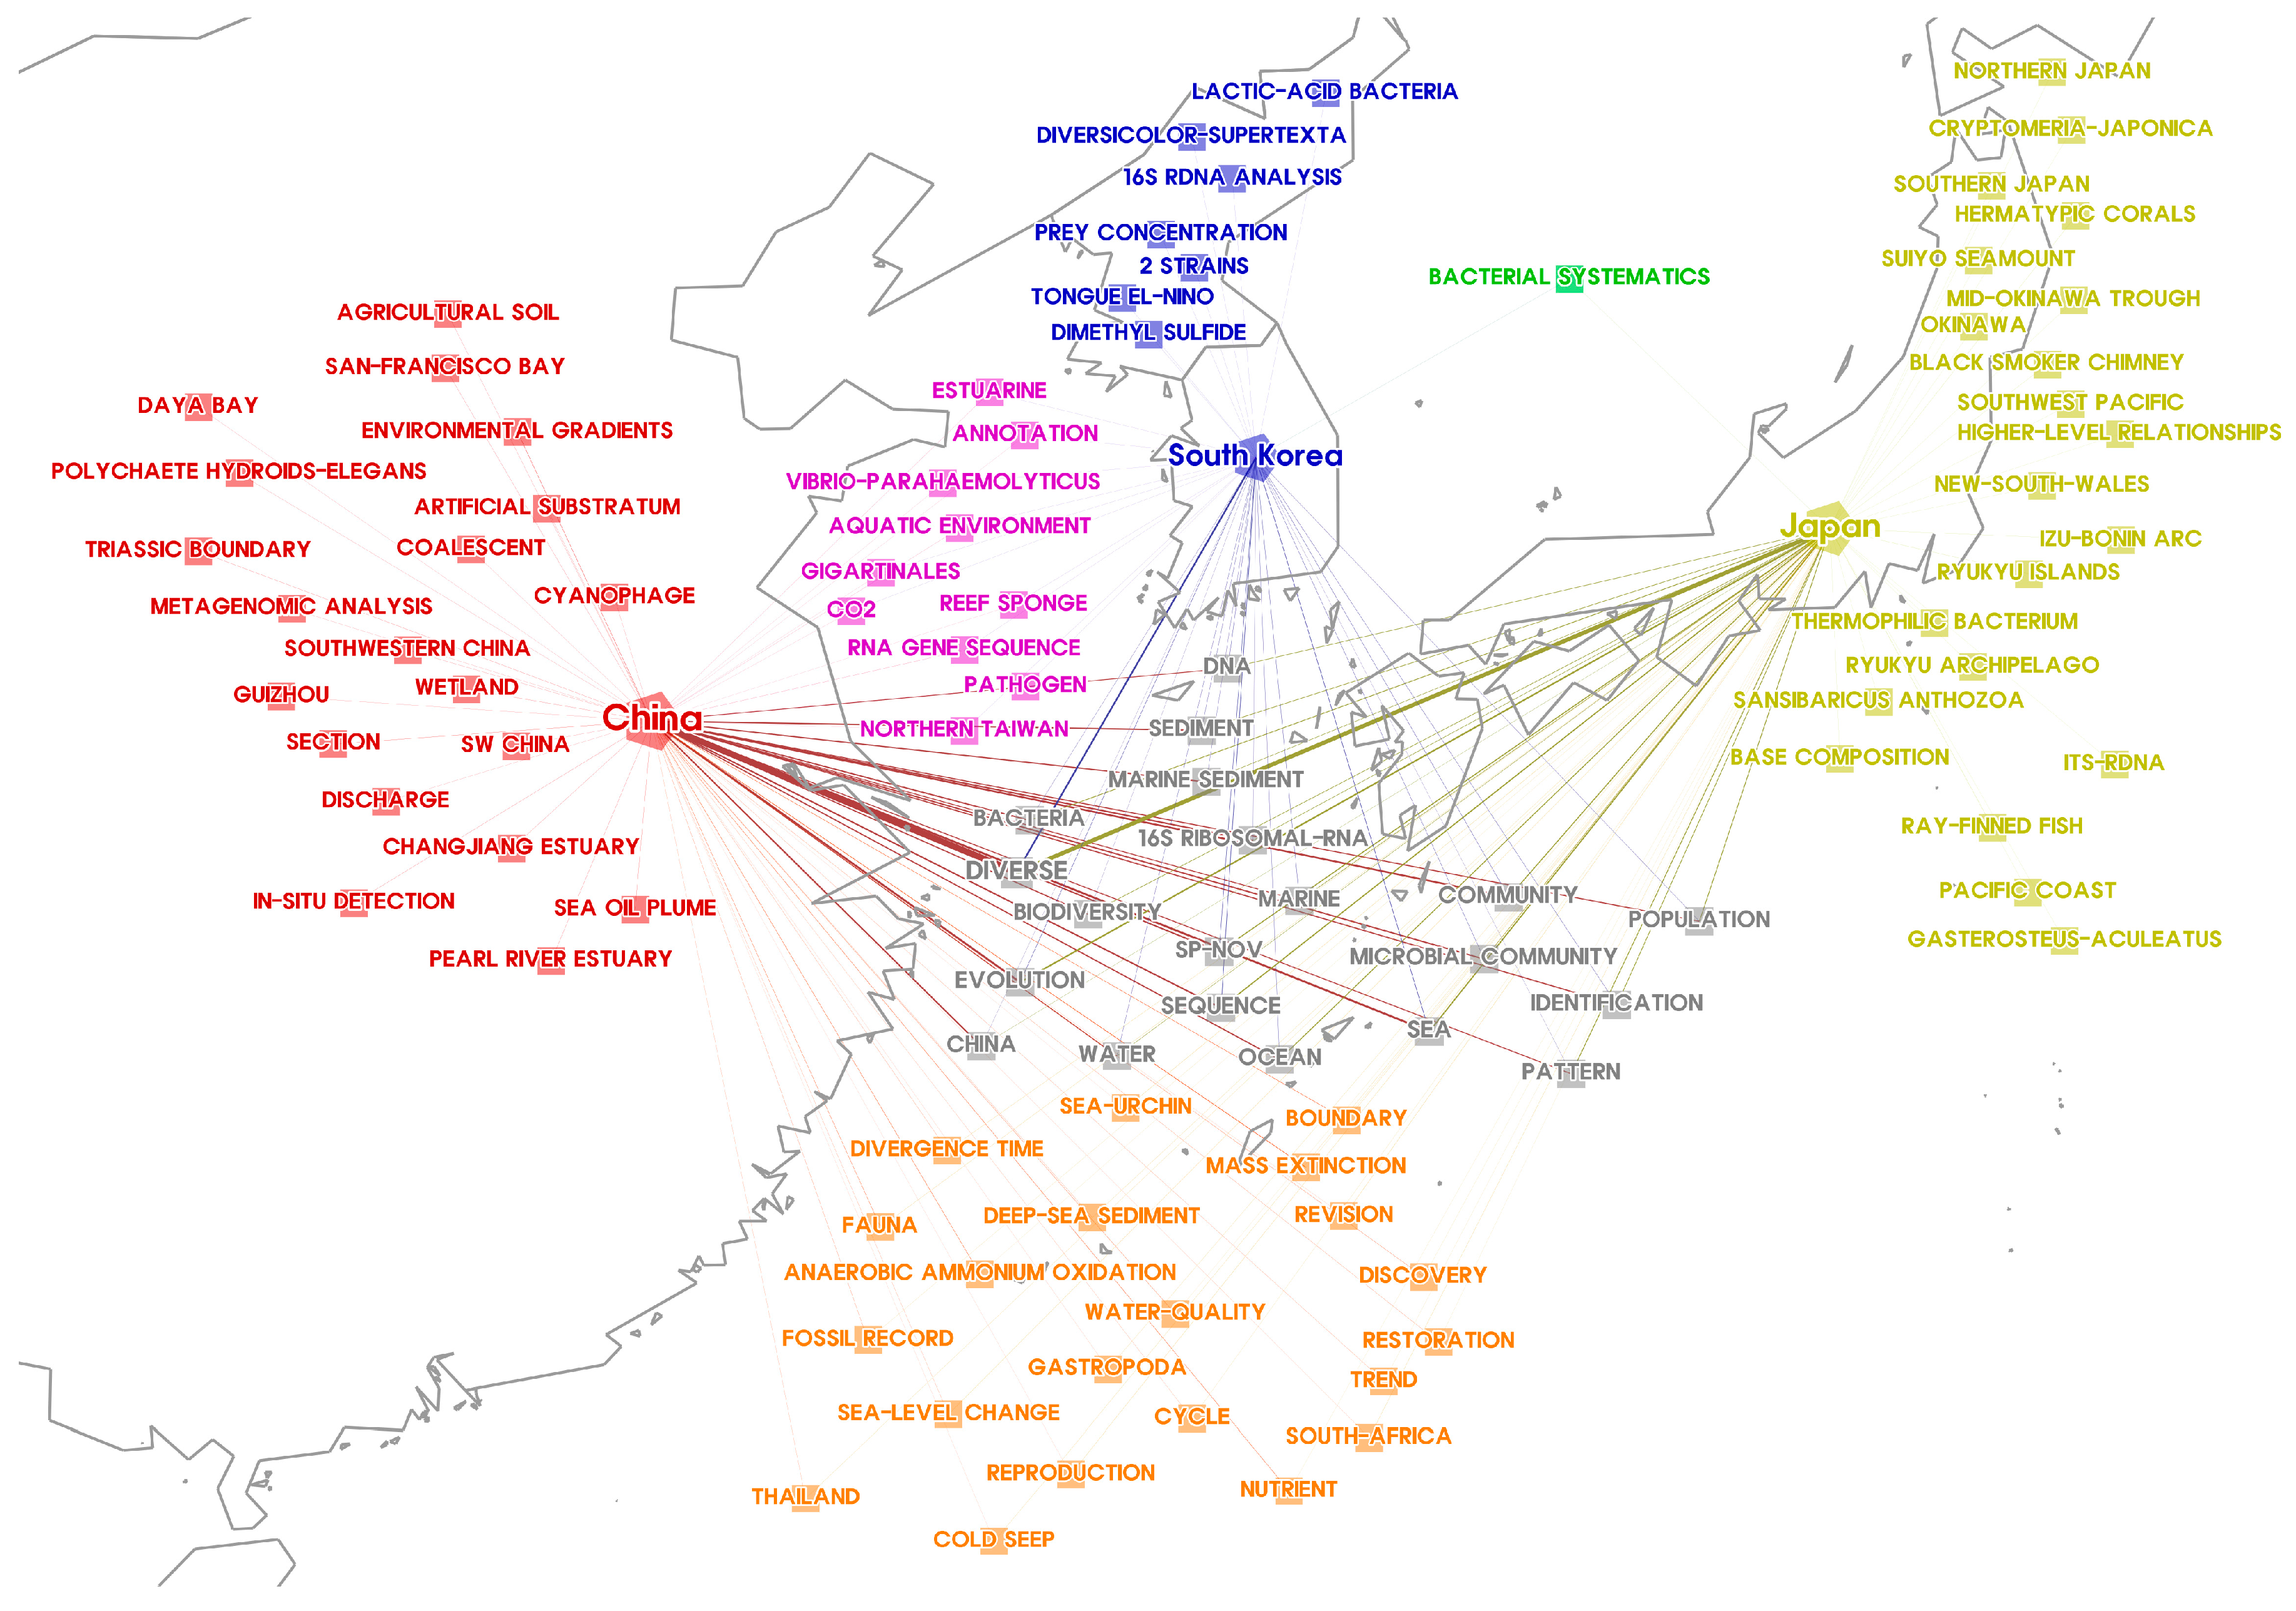
3.2. Analysis of Research Trends Using Topography Maps

We analyzed research trends using a research topography map using the author keywords of publications. We extracted phrases from the title and abstract of all articles for bibliometric mapping analysis. We divided the WoS database into two periods (first period: 1996–2005; second period: 2006–2015) to observe changes in research trends. In the VOSviewer topography map, the color of each area is dependent on the number of items at any given point. One characteristic of VOSviewer is that the size of the distribution does not match the range or diversity of distribution. This means that if some keywords are distributed far from the main cluster, other clusters become smaller in the whole map because VOSviewer zooms out to show all clusters of the topography map. This topography map is designed to provide an overview of the general structure and to emphasize important areas of the map [26].
The research trend in China has greatly expanded in 20 years. In the first period, only production-related research formed the major cluster. This cluster includes topics such as content, unit and report. These topics are closely related with aquaculture. The other research cluster also represents aquaculture-related topics, such as capacity, uptake and grain size. This means that aquaculture research was a major topic in the first period. Genetic research was only beginning (DNA sequencing in (a)). Compared to the first period, there was a dramatic increase in research diversity in the second period.
Four major research clusters are found in the second period (Figure 3). The first one is a cluster related to South China. This region is closely associated with mass extinction research. A cluster of words, such as black shale, oil and deposit, was also made. This cluster is clearly related to basic research on resource excavation in the South China Sea. The second cluster is related to bacteria community research. This cluster includes bacteria-related research topics, such as Actinobacteria, strain, bacterial community, Streptomyces and marine sponge. All aforementioned topics are related to bacterial community research. This cluster showed the most vibrant research activity in China. The third cluster is the population research cluster. Population research is foundational research for biodiversity research. Population research is required to identify the specific characteristics of many different areas in the marine environment. The fourth cluster is related to genetics. Haplotype, molecular variance and loci are all keywords related with gene expression. Over 20 years, research on marine biodiversity in China developed and became greatly diversified.
In Japan, several research topics showed vibrant activity in the first period (Figure 4). Genetic research was a strong topic in the first period. Genetic differentiation, allele and haplotype showed that advanced genetic research was ongoing in the first period. Compared to China and South Korea, this was advanced in the first period. Bacteria-related research was also strong in the first period. Coral research only appeared in Japan, such as coral reef fish, coral reef and rocky reef. This reflected the discovery of the world’s northernmost coral reef in Japan. Research topics included ribotype, proteobacteria and isolate. Additionally, vibrant research was detected in various research topics in the first period. In many aspects, research in Japan was more advanced than China and South Korea in the first period.
Compared to the first period, research in the second period of Japan lost vibrancy in many areas. However, research topics become more advanced than in the first period. Gene flow research was a major topic in genetic research. This means that genetic studies in Japan focused not merely on the allele itself, but allele transfer from population to population. Bacteria-related research also remained a major research topic, but remained focused on bacterial community research. It is noteworthy that research focus moved from the individual to the community.
We would like to note that the decrease in research diversity in Japan in 20 years does not imply a reduction in the amount of or interest in research. It can be perceived as the maturation of technology and focus for more advancement. A deeper analysis is required to identify the reasons for the change in the research trend.
Research in the first period of South Korea indicated that South Korea did not have an appropriate research cluster, except genetic research (Figure 5). However, there was a significant change in the second period. Four research clusters are found in the second period. First, research on allele and polymorphism created a huge research cluster; second, research conducted for discovering new bacterial strains is also strong; the third important cluster is the one on gene expression and regulation. Fourth and lastly, various ecosystem research created a research cluster.
Genetic research made two big research clusters in the second period: (1) allele and polymorphism research; and (2) gene expression and regulation. It is impressive that marine ecosystem research made a big advancement even though there were no appropriate research topics on ecosystem or marine environment in the first period.
China, Japan and South Korea have common research areas: (1) general diversity; (2) genetic diversity. First, the general diversity research area contains research topics that seek to find new species and determine the traits of marine populations. It also contains research topics related to habitats, the ecosystem and the environment. Second, research topics related to genetic diversity, such as microsatellite, phylogeny and sequencing, are found. Both research areas are inter-connected, because genetic research is necessary for a deeper understanding of the status of the sea and ecosystem.
A research trend analysis of the world was performed for comparing the world and the three countries (Figure 6). Interestingly, the most vibrant research cluster of the world in the first period included topics, such as forest, conservation, epifauna and integration. This cluster showed us that the environment around the sea and coast was a major research topic in the first period. In addition, deposit and basin also created one cluster of research. Permian, progradation and mudstone are also located close to this cluster. It is a research cluster on the estuary environment. Both clusters are related to environment research around the sea. Genetic diversity was identified as the third biggest cluster in the first period. Bacteria research was diverse, but vibrancy was not high at the moment.
In the second period, population research emerges as a major cluster. The microbial community also became a big research topic in microorganism research. This means that research focus moved from the individual to the community. This is a natural movement that we can identify: the shift of the research focus from the specification of the individual organism to interaction and communication in the community. Conservation and management research became a bigger research cluster than the first period. This cluster contains research topics, such as policy, planner and model prediction. It implies that a systemic approach to protecting the marine environment became vibrant in the second period.
We briefly investigated the top research topics of China, Japan and South Korea to observe specific research topics and found that each country has its own topics in addition to the topics on which it collaborates with the other countries. We attempted to figure out collaboration topics through this analysis. We removed research topics that occurred less than two times from 1996–2015. We did not consider those topics as major research topics. We then generated a country and research-wide top 20 frequently-appearing topics map, indicated in Figure 7. If keywords appeared with the exact same frequency, we selected all of them. Therefore, some groups have more than 20 topics. In addition, some groups only have a few research topics because topics in this group did not cross the threshold.
China, Japan and South Korea have common research topics about microorganism research (grey color group). It is not surprising that the three countries’ major research topic was microorganism research for 20 years. Bacteria, microbial community, SP-NOV, identification and 16S ribosomal RNA are topics from the field of microorganism research. Sediment research was also of common interest to the three countries.
China and South Korea collaborated on research on the marine environment (purple color group). The aquatic environment, Gigartinales and reef sponge are important parts of the marine habitat for marine organism. Other topics, such as estuarine, CO2 and pathogen, are also closely related to the environment of the sea and coast. From these research topics, we can conclude that China and South Korea collaborated on the general environment of the sea and coast.
China and Japan collaborated on environment research. Anaerobic ammonium oxidation, water quality and restoration revealed that the two countries are more focused on pollution and environment. Deep-sea research topics, such as cold seep and deep-sea sediment, were also revealed. It is noteworthy that China and Japan collaborated with each other despite their political conflicts.
Japan and South Korea shared only one topic in common: bacterial systematics (green color group). Bacterial systematics indicates that both countries were working together for taxonomy research.
We also found country-specific research topics. The research topics were reflective of each country’s endemic circumstances. China indicated a greater number of regional topics. Many region names are found in research topics, such as Daya Bay, Guizhou, Southwestern China, Changjiang estuary and Pearl River estuary. This means that China vibrantly performs region-specific research.
South Korea has a few research topics that are country-specific. However, it is impressive that South Korea is the only country that has a climate change-related topic as a research topic: (cold) tongue El-Niño. In addition, aquaculture-related topics are identified, such as prey concentration and diversicolor supertexta (Haliotis diversicolor, Haliotis supertexta). Recent research also suggested that lactic-acid bacteria have the potential to become an alternative for anti-biotics [32].
Japan revealed clear research topics in terms of country-specific topics, namely deep-sea research. We found several research topics related to deep-sea research, such as hermatypic corals, Suiyo Seamount, Mid-Okinawa Trough, black smoker chimney, Izu-Bonin Arc and thermophilic bacterium. Given Japan’s contact with the deep trench (Japan Trench), which is a part of the circum-Pacific belt via the Mariana Trench, it is only a natural result that deep-sea research should be a unique research topic in Japan. This area is a valuable research area not only for biodiversity, but also for earthquake research.

4. Discussion and Conclusions

The research questions raised by this study are “What are China, Japan and South Korea, who share the sea, doing in terms of marine biodiversity research?” Therefore, we started to investigate the collaboration status of the three countries and research topics using bibliometric data. Research trend analysis using bibliometric mapping is commonly used to evaluate a country’s research level and status. However, this study focused on the countries with which they are collaborating and the topics of research.
First, we examined the collaboration status to see whether China, Japan and South Korea are keen on collaboration. Japan showed the most vibrant collaboration among the three countries. Japan collaborated with the maximum number of countries. We assumed that this is because Japan is geographically located beside the Pacific Ocean. South Korea was the strongest inter-collaborator among the three countries. We assumed that this reflected geopolitical factors, since South Korea shares its main sea with the other two countries. Therefore, it is natural for South Korea to collaborate with China and Japan. However, collaboration variety and frequency is rapidly increasing for both China and South Korea.
Second, we investigated the research topics of China, Japan and South Korea to identify their areas of interest. We found that three countries have many common research topics. China, Japan and South Korea performed genetic research for marine and coastal biodiversity and microorganism study as their primary research topics. We identified several research trends in China, Japan and South Korea. China is more focused on bacterial community research and South China Sea research. Particularly, the South China Sea is closely related as a source of natural resources, such as natural gas. One limitation of China is its mediocre vibrancy in terms of genetic research, but genetic research is now connected with population research. Therefore, it is the right track for genetic research. Japan showed vibrant and diverse research on the first period. However, Japan revealed more focused research on the second period. Research topics have not changed, but have become more advanced in the second period. Even though the vibrancy of research is not as much as the first period, the research level increased in the second period. South Korea showed a dramatic increase from the first period to the second period. There were only a few research topics in the first period. However, South Korea exhibited a drastic change in the second period. South Korea showed vibrant research on genetic research, ecosystem research and microorganism research. Even though South Korea continues to lack research diversity in comparison with China and Japan, diversity is also increasing over time. All of the seas are connected, and therefore, joint policy and research are mandatory to assess the impact of climate change and protect from it. In addition, the three countries researched community structure and population structure. This is an essential research area for community preservation, remedy for habitat and understanding the ecosystem. Those three topics are considered basic research areas for sustainable development of marine and coastal environments. An appropriate limit for development and fishing is mandatory in the long-term perspective.
Despite our attempts at analyzing data and providing objective and clear insights, this study has several limitations. First, we considered only the Web of Science database as a data source. Scopus is more useful in terms of journal coverage than Web of Science. If the research should focus more deeply on a specific area or topic, Scopus can be an option for procuring data sources. Second, we did not account for language bias. Non-English countries also produced numerous articles in their own languages. However, most of databases cover mostly English journals. Publications in English can easily be cited from other articles. Therefore, many researchers published in English journals, but this is still a limitation for country-specific research, because some country-specific research does not require being published in English. For those reasons, bibliometric researchers have to consider country-wise language bias for more detailed research. Third, we do not use citation-base analysis in this paper. Citation-based analysis is commonly used for author, institution and country network analysis along with co-author analysis. Therefore, the co-citation network and co-author network have to be considered for a deeper analysis. Fourth, our work is more focused on quantitative and bibliometric analyses. We considered several methods on how to overview research trends of countries. Three methods are commonly used for analysis: (1) systematic reviews; (2) meta-analysis; and (3) bibliometric analysis. We considered other researches for clarifying our approach. First, a study on a systematic review and meta-analysis on the coastal marshes as a protective area of the eco-system is considered [33]. In addition, a systematic review on climate change adaptation research is considered [34]. A systematic review is an excellent method for analyzing the details of research studies. Meta-analysis is effective for revealing the statistical results of collected data. Those methods need to be considered for further and deeper analysis.
China, Japan and South Korea have experienced territorial water conflicts [35]. Conflict itself showed that the sea has much potential in the future, as well as in the present. Even though the three countries have faced conflicts at the political level, we believe that collaboration and cooperation at the research level must be continued and promoted. Management for such tremendous potential requires multinational collaboration considering the noblest attribute of the sea, its connectivity.
We hope that this study will be a good reference for policymakers and researchers to set up a new joint policy and research among China, Japan and South Korea. Understanding the present research status is essential to avoid overlaps for future research and to design a strong joint plan with other countries because it is possible to know the strong points of each country through research topic analysis.

Acknowledgments

The authors are grateful for the support from the Korea Institute of Science and Technology Information.

Author Contributions

Jongseok Kang and Jungjoon Kim conceived of and designed the experiments. Jungjoon Kim performed the experiments. Sangpil Lee contributed to analyzing the results of the study. Jongseok Kang and We Shim supported the writing and figure. Jungjoon Kim mainly wrote the paper. All authors read and approved the manuscript.

Conflicts of Interest

The authors declare no conflict of interest.

References

  1. United Nations Environment Programme (UNEP). The Jakarta Mandate—From Global Consensus to Global Work; UNEP: Nairobi, Kenya, 2000. [Google Scholar]
  2. Ausubel, J.H.; Darlene, T.C.; Waggonerirst, P.E. First Census of Marine Life 2010 Highlights of a Decade of Discovery; Census of Marine Life: London, UK, 2010. [Google Scholar]
  3. Mora, C.; Tittensor, D.P.; Adl, S.; Simpson, A.G.B.; Worm, B. How many species are there on earth and in the ocean? PLoS Biol. 2011, 9, e1001127. [Google Scholar] [CrossRef] [PubMed]
  4. The Organisation for Economic Co-operation and Development (OECD). Marine Biotechnology: Enabling Solutions for Ocean Productivity and Sustainability; OECD Publishing: Paris, France, 2013; Volume 46. [Google Scholar]
  5. Xiang, J. Marine Science & Technology in China: A Roadmap to 2050; Xiang, J., Ed.; Springer: Berlin/Heidelberg, Germany, 2010. [Google Scholar]
  6. Waseda University. Basic Plan on Ocean Policy; Waseda University: Tokyo, Japan, 2013. [Google Scholar]
  7. UNEP/CBD/COP/DEC/XII/23. Decision Adopted by the Conference of the Parties to the Convention on Biological Diversity at Its Twelfth Meeting XII/23. Marine and Coastal Biodiversity: Impacts on Marine and Coastal Biodiversity of Anthropogenic Underwater Noise and Ocean Acidificatio. Available online: https://www.cbd.int/doc/decisions/COP-12/cop-12-dec-23-en.pdf (accessed on 21 July 2016).
  8. Liu, X.; Zhang, L.; Hong, S. Global biodiversity research during 1900–2009: A bibliometric analysis. Biodivers. Conserv. 2011, 20, 807–826. [Google Scholar] [CrossRef]
  9. Li, W.; Zhao, Y. Bibliometric analysis of global environmental assessment research in a 20-year period. Environ. Impact Assess. Rev. 2015, 50, 158–166. [Google Scholar] [CrossRef]
  10. Kulkarni, A.V.; Aziz, B.; Shams, I.; Busse, J.W. Comparisons of Citations in Web of Science, Scopus, and Google Scholar for Articles Published in General Medical Journals. JAMA 2009, 302, 2847–2850. [Google Scholar] [CrossRef] [PubMed]
  11. Bakkalbasi, N.; Bauer, K.; Glover, J.; Wang, L. Three options for citation tracking: Google Scholar, Scopus and Web of Science. Biomed. Digit. Libr. 2006, 3, 423–435. [Google Scholar] [CrossRef] [PubMed]
  12. Wang, Q.; Waltman, L. Large-scale analysis of the accuracy of the journal classification systems of Web of Science and Scopus. J. Informetr. 2016, 10, 347–364. [Google Scholar] [CrossRef]
  13. Yarime, M.; Takeda, Y.; Kajikawa, Y. Towards institutional analysis of sustainability science: A quantitative examination of the patterns of research collaboration. Sustain. Sci. 2010, 5, 115–125. [Google Scholar] [CrossRef]
  14. Hassan, S.U.; Haddawy, P.; Zhu, J. A bibliometric study of the world’s research activity in sustainable development and its sub-areas using scientific literature. Scientometrics 2014, 99, 549–579. [Google Scholar] [CrossRef]
  15. The World Bank Gross Domestic Product. Available online: http://data.worldbank.org/data-catalog/GDP-ranking-table (accessed on 12 July 2016).
  16. Leydesdorff, L.; Heimeriks, G.; Rotolo, D. Journal portfolio analysis for countries, cities, and organizations: Maps and comparisons. J. Assoc. Inf. Sci. Technol. 2016, 67, 741–748. [Google Scholar] [CrossRef]
  17. Leydesdorff, L.; Carley, S.; Rafols, I. Global maps of science based on the new Web-of-Science categories. Scientometrics 2013, 94, 589–593. [Google Scholar] [CrossRef] [PubMed]
  18. Leydesdorff, L.; Wagner, C.; Park, H.W.; Adams, J. International Collaboration in Science: The Global Map and the Network. Digit. Libr. 2013; arXiv:1301.0801. [Google Scholar]
  19. Leydesdorff, L.; Rafols, I. A global map of science based on the ISI subject categories. J. Am. Soc. Inf. Sci. Technol. 2009, 60, 348–362. [Google Scholar] [CrossRef]
  20. Hoppen, N.H.F.; Vanz, S.A. Neurosciences in Brazil: A bibliometric study of main characteristics, collaboration and citations. Scientometrics 2016, 109, 121–141. [Google Scholar] [CrossRef]
  21. Yevide, A.S.I.; Wu, B.; Khan, A.S.; Zeng, Y.; Liu, J. Bibliometric analysis of ecosystem monitoring-related research in Africa: Implications for ecological stewardship and scientific collaboration. Int. J. Sustain. Dev. World Ecol. 2016. [Google Scholar] [CrossRef]
  22. Tang, L.; Shapira, P. China–US scientific collaboration in nanotechnology: Patterns and dynamics. Scientometrics 2011, 88, 1–16. [Google Scholar] [CrossRef]
  23. Fahimnia, B.; Sarkis, J.; Davarzani, H. Green supply chain management: A review and bibliometric analysis. Int. J. Prod. Econ. 2015, 162, 101–114. [Google Scholar] [CrossRef]
  24. Fritz, J.S.; Hanus, J. The European Integrated Maritime Policy: The next five years. Mar. Policy 2015, 53, 1–4. [Google Scholar] [CrossRef]
  25. Tittensor, D.; Mora, C.; Jetz, W.; Lotze, H.; Ricard, D.; Vanden Berghe, E.; Worm, B. Global patterns and predictors of marine biodiversity across taxa. Nature 2010, 466, 1098–1101. [Google Scholar] [CrossRef] [PubMed]
  26. Van Eck, N.J.; Waltman, L. Software survey: VOSviewer, a computer program for bibliometric mapping. Scientometrics 2010, 84, 523–538. [Google Scholar] [CrossRef] [PubMed]
  27. Van Eck, N.J.; Waltman, L. Bibliometric mapping of the computational intelligence field. Int. J. Uncertain. Fuzziness Knowl.-Based Syst. 2007, 15, 625–645. [Google Scholar] [CrossRef]
  28. Van Eck, N.J.; Waltman, L.; Dekker, R.; van Den Berg, J. A comparison of two techniques for bibliometric mapping: Multidimensional scaling and VOS. J. Am. Soc. Inf. Sci. Technol. 2010, 61, 2405–2416. [Google Scholar] [CrossRef]
  29. Bastian, M.; Heymann, S.; Jacomy, M. Gephi: An Open Source Software for Exploring and Manipulating Networks. In Proceedings of the Third International AAAI Conference on Weblogs and Social Media, San Jose, CA, USA, 17–20 May 2009; pp. 361–362.
  30. Roberts, C.M.; McClean, C.J.; Veron, J.E.N.; Hawkins, J.P.; Allen, G.R.; McAllister, D.E.; Mittermeier, C.G.; Schueler, F.W.; Spalding, M.; Wells, F.; et al. Marine Biodiversity Hotspots and Conservation Priorities for Tropical Reefs. Science 2002, 295, 1280–1284. [Google Scholar] [CrossRef] [PubMed]
  31. Lebel, L.; Tri, N.H.; Saengnoree, A.; Pasong, S.; Buatama, U.; Thoa, L.K. Industrial Transformation and Shrimp Aquaculture in Thailand and Vietnam: Pathways to Ecological, Social, and Economic Sustainability? AMBIO A J. Hum. Environ. 2002, 31, 311–323. [Google Scholar] [CrossRef]
  32. Kim, D.; Beck, B.R.; Heo, S.-B.; Kim, J.; Kim, H.D.; Lee, S.-M.; Kim, Y.; Oh, S.Y.; Lee, K.; Do, H.; et al. Lactococcus lactis BFE920 activates the innate immune system of olive flounder (Paralichthys olivaceus), resulting in protection against Streptococcus iniae infection and enhancing feed efficiency and weight gain in large-scale field studies. Fish Shellfish Immunol. 2013, 35, 1585–1590. [Google Scholar] [CrossRef] [PubMed]
  33. Shepard, C.C.; Crain, C.M.; Beck, M.W. The protective role of coastal marshes: A systematic review and meta-analysis. PLoS ONE 2011, 6, e27374. [Google Scholar] [CrossRef] [PubMed]
  34. Berrang-Ford, L.; Pearce, T.; Ford, J.D. Systematic review approaches for climate change adaptation research. Reg. Environ. Chang. 2015, 15, 755–769. [Google Scholar] [CrossRef]
  35. Dolven, B.; Kan, S.A.; Manyin, M.E. Maritime territorial disputes in East Asia: Issues for Congress. East Asia’s Marit. Territ. Disput. Claims Consid. U. S. 2013, 5, 1–46. [Google Scholar]
Figure 1. Collaboration status of China, Japan and South Korea in 1996–2005 (number of links: 108; number of countries: 57 (excluding China, Japan and South Korea)).
Sustainability 08 01075 g001
Figure 2. Collaboration status of China, Japan and South Korea in 2006–2015 (number of links: 230; number of countries: 101 (excluding China, Japan and South Korea)).
Sustainability 08 01075 g002
Figure 3. Research topography map of China: (a) first period (1996–2005); (b) second period (2006–2015).
Sustainability 08 01075 g003
Figure 4. Research topography map of Japan: (a) first period (1996–2005); (b) second period (2006–2015).
Sustainability 08 01075 g004
Figure 5. Research topography map of South Korea: (a) first period (1996–2005); (b) second period (2006–2015).
Sustainability 08 01075 g005aSustainability 08 01075 g005b
Figure 6. Research topography map of the world: (a) first period (1996–2005); (b) second period (2006–2015).
Sustainability 08 01075 g006aSustainability 08 01075 g006b
Figure 7. Top 20 research topic map of China, Japan and South Korea (threshold link value: two; number of topics: 102).
Sustainability 08 01075 g007
Table 1. Comparison of other studies using bibliometric mapping.
Leydesdorff, Carley and Rafols [17]Leydesdorff, Wagner and Park et.al. [18]Hoppen and Vanz [20]Tang and Shapira [22]Yevide, Wu and Khan et.al. [21]Fahimnia, Sarkis and Davarzani [23]
Mapping toolPajek, VOSviewerPajek, VOSviewerVOSviewerVantagePoint, GephiR, GephiGephi
IndicatorWeb of Science CategoryCo-authorshipCo-authorshipCo-authorship/Web of Science CategoryAuthor’s country networkCo-citation
Research focusGlobal maps of scienceInternational collaborationInstitutional collaboration/Research topicsNational collaboration/Research overlayCountry collaborationResearch area/cluster
Data sourceWeb of ScienceWeb of ScienceWeb of ScienceWeb of ScienceWeb of ScienceScopus
Table 2. Number of articles of China, Japan and South Korea by year.
ChinaJapanSouth KoreaWorld
1996281729
19972193783
19989311958
199913382985
2000143021104
2001244541161
2002255061299
20033760181440
20045278221725
20057873121955
20069997232251
2007122103162520
2008165139342960
2009231126383156
2010216175513527
2011324163724052
2012350195834406
20133752081004651
20144902361095089
20155092281105546
Total3137210270750,297
Table 3. Ratio of collaboration in scientific articles among China, Japan and South Korea.
WithChinaJapanSouth Korea
China 4.3% (134/3137 articles)1.8% (56/3137 articles)
Japan6.4% (134/2102 articles) 3.1% (66/2102 articles)
South Korea7.9% (56/707 articles)9.3% (66/707 articles)
Table 4. The number of collaborated articles, authors who worked on collaborated articles and the average number of authors who worked on collaborated articles.
Number of Collaborated Articles 1With ChinaWith JapanWith South KoreaWith Other Countries
China 120481063
Japan120 53704
South Korea4853 216
Other countries1063704216
Number of Authors Who Worked on Collaborated ArticlesWith ChinaWith JapanWith South KoreaWith Other Countries
China 3931253740
Japan241 911555
South Korea119112 516
Other countries37083654734
The Average of the Number of Authors in Collaborated ArticleWith ChinaWith JapanWith South KoreaWith Other Countries
China 3.282.603.52
Japan2.01 1.722.21
South Korea2.482.11 2.39
Other countries3.495.193.40
1 We excluded data that did not have author-affiliation information to avoid ambiguity.

