Abstract
The impacts of the urban heat island (UHI) phenomenon on energy consumption, air quality, and human health have been widely studied and described. Mitigation strategies have been developed to fight the UHI and its detrimental consequences. A potential countermeasure is the increase of urban albedo by using cool materials. Cool materials are highly reflective materials that can maintain lower surface temperatures and thus can present an effective solution to mitigate the UHI. Terni’s proven record of high temperatures along with related environmental and comfort issues in its urban areas have reflected the local consequences of global warming. On the other hand, it promoted integrated actions by the government and research institutes to investigate solutions to mitigate the UHI effects. In this study, the main goal is to investigate the effectiveness of albedo increase as a strategy to tackle the UHI, by using the Weather Research and Forecasting (WRF) mesoscale model to simulate the urban climate of Terni (Italy). Three different scenarios through a summer heat wave in the summer of 2015 are analyzed. The Base Scenario, which simulates the actual conditions of the urban area, is the control case. In the Albedo Scenario (ALB Scenario), the albedo of the roof, walls and road of the whole urban area is increased. In the Albedo-Industrial Scenario (ALB-IND Scenario), the albedo of the roof, walls and road of the area occupied by the main industrial site of Terni, located in close proximity to the city center, is increased. The simulation results show that the UHI is decreased up to 2 °C both at daytime and at nighttime in the ALB and in ALB-IND Scenarios. Peak temperatures in the urban area can be decreased by 1 °C at daytime, and by about 2 °C at nighttime. Albedo increase in the area of interest might thus represent an opportunity to decrease the UHI effect and its consequences.
1. Introduction
The urban heat island (UHI) phenomenon is the most widely documented climatological effect of man’s modification of the atmospheric environment [1], typically defined as the difference between the background rural and highest urban temperatures [1]. Some studies assessed that the temperature increase may reach up to 10 °C [1,2]. The intensity of the UHI depends strongly on the urban characteristics, the synoptic conditions, the local meteorological features, the type of urban materials and the presence (or lack) of green areas [3]. Urban warming has serious energy and environmental impacts on cities and its residents [4,5,6,7,8,9]. The UHI may increase the energy consumption of a reference building and leads to a rise of CO2 equivalent annual emissions for a cooling of up to 7% [10]. Between 1950 and 2010 the total load increased by 3.5% for small offices; for medium offices the cooling load increased by 18%, and for large offices the total load decreased by 1.0% [10]. According to the calculation of the total energy consumption for heating and cooling of a residential building, the total energy consumption for heating and cooling increased from 42.4 kWh/m2/year to 47.7 kWh/m2/year from 1990 to 2000 [11]. As shown in [12], only because of the UHI, heating demand will be reduced while the cooling and electricity consumption demand will be higher in 2050, resulting in a 500% growth in CO2 emissions in city-center offices. By means of a carbon footprint analysis, Rossi et al. [13] also calculated that the decrease of the performance of electronic and mechanical instruments can reach up to 25%. Furthermore, although the relationship between heat and mortality varies by location and population group, heat-related mortality during summer months is likely to become a dominant public health problem in the future due to the effects of climate change and will increase sharply over this century [14,15,16].
Materials used in the urban fabric play a very important role in the urban thermal balance as they absorb incident solar radiation and dissipate a percentage of the absorbed heat through convective and radiative processes in the atmosphere, increasing the ambient temperature [3,4,5,6,7,8,9,10,11,12,13,14,15,16,17]. The increase of the albedo of urban surfaces allows them to reflect a significant part of the incoming solar radiation. Several studies thus proposed the implementation of highly reflective materials for roofs, pavements and walls [3,4,5,6,7,8,9,10,11,12,13,14,15,16,17,18], with innovative solutions including thermochromic materials [19], directionally reflective materials [20] and retro-reflective materials [21,22,23,24]. The positive effect of higher albedo on building energy consumption and the UHI effect reduction, even in cold climates, has been demonstrated through various studies [25,26,27].
In this paper, the effect of increasing urban surfaces’ reflectivity in Terni is simulated using the Weather Research and Forecasting (WRF) mesoscale model. Due to Terni’s geographical location in a valley, heat is naturally trapped in the urban area, especially during heat waves.
Several parameterization schemes (microphysics, cumulus, radiation, planetary boundary layer, and land) are tested to represent the area of Terni and its interaction with the surrounding environment and the time-efficient parameterizations with the least errors are set as the Base Scenario.
The objective of the paper is two-fold: firstly, to provide a representative parametrization of the dynamics of the urban area of Terni to predict the vertical heat and moisture fluxes, and secondly, to investigate the effectiveness of increasing the urban albedo in the UHI mitigation. The effectiveness of this strategy has been discussed in [28,29,30,31]. In this paper a special focus is placed on the estimation of the effect of albedo increase both in the urban and in the industrial area of Terni, which is situated in the urban area and very close to the historical center of the city of Terni. In fact, in the Albedo Scenario (ALB Scenario) the reflectivity of the urban surfaces of the whole urban area is increased, and in the Albedo-Industrial Scenario (ALB-IND Scenario) the reflectivity of the surfaces that belong to the large industrial site located in the urban area of Terni is increased. Results from this study would help local authorities, policy-makers, regulators and developers in planning an urban redevelopment to pursue the sustainability measures in the economic, social, cultural and environmental life of the city.
For this purpose, three different simulations were carried out during four cloudless summer days in Terni during summer 2015. The simulations started on July 17 at midnight. The first 12 h are considered as the initialization time to eliminate the residues of the initial condition in numerical modeling.
2. Methodology
2.1. Area of Interest
The area of interest is Terni, a medium-sized city in the southwest of the Umbria region, Italy. According to the Köppen climate classification [32], Terni belongs to CSA (Temperate, dry summer, hot summer) category (i.e., to the temperate climate of the middle latitudes, with hot summer). The city experiences a typical mild Mediterranean climate during spring and autumn. The humid seasons are spring and autumn, mainly in November and April. The summer is hot, humid, muggy and basically has little rainfall, while winter is cold and rainy. In general, the weather is not characterized by strong winds, because the winds diminish in intensity encountering the surrounding mountains.
The geographic location is a key factor in the climate vulnerability of the city. The surrounding mountain barriers reduce air mixing, pollutant transport. In addition, the city climate is strongly affected by the human impact related to numerous industrial activities in the territory. The social-economic development related to the industrial sector involves the city sprawl and urbanization density, a change on morphology and land use, a reduction of evaporative surface, a greater energy consumption and pollutants emissions. The UHI causes thermal discomfort, exacerbates air pollution, and threatens the health of inhabitants. In summer 2012, seven heatwaves occurred in Terni with the maximum air temperature of 41.7 °C [33].
For simulations, four two-way nested domains have been defined. The number of grids of the domains (west-east/south-north) are 58 × 46, 101 × 76, 103 × 103, 100 × 70, with a land use resolution of 10 min, 2 min, 30 s, and 30 s respectively (“min” denotes arc minutes and “s” denotes arc seconds). The length (Dx and Dy in Table 1) of the coarsest domain (d01) grid is 11250 m, and the grid ratio (Parent grid ratio in Table 1) is 5 for domain 2 (d02), 3 for domain 3 (d03), and 3 for domains 4 (d04). The inner domain has been set as 100 × 70 grids, with the dimension of the grid length of about 260 m, to cover the urban area of Terni. 35 vertical eta levels are set, with a higher concentration in the first kilometers to better represent the fluxes from the surfaces. In Table 1 the inputs for WPS (The WRF Preprocessing System) are reported.

Table 1.
WPS preprocessing system inputs.
The domains configuration as defined and interpolated by the WRF Preprocessing System (WPS) is shown in Figure 1.
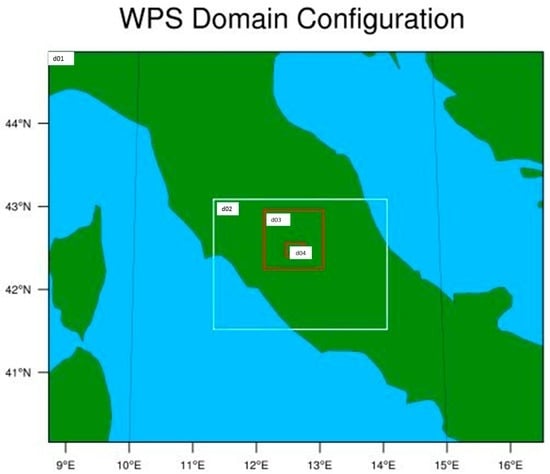
Figure 1.
WPS domain configuration. d01 is the larger, coarser domain. d04 is the inner domain that covers the urban area and the surroundings.
The land use for the inner domain is also shown in Figure 2. The black area defines the urban area of Terni, as in Figure 3. The urban grids (68 squared grids, 260 m on each side) cover an area of about 5 km2.
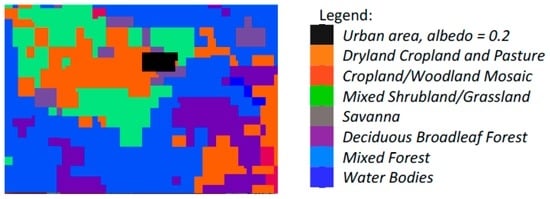
Figure 2.
Land use for the inner domain D04. Land use category data sets are matched with the USGS categories [34].
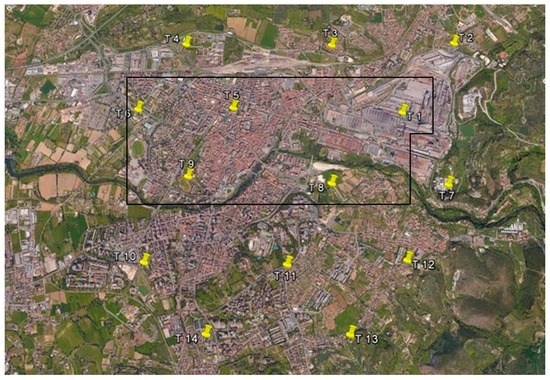
Figure 3.
Fourteen-point grid above Terni. T1, T5, T6, T8, T9 are inside the urban area (the black line is the border of the black grids of Figure 2). T1 is in the middle of the industrial area.
2.2. Model Setup
The physics models that are set in the simulations are shown in Table 2.
Table 2.
Physics model configuration used in the simulations with the nonhydrostatic WRF-ARW model.
The WRF model is coupled to multi-layer urban canopy model (UCM) and building energy model (BEM). The multi-layer UCM developed by [42], is the most sophisticated urban modelling in WRF, since it recognizes the three-dimensional nature of urban surfaces (whereas slab and single layer UCMs consider urban areas as the roughness of the surface) and accounts for buildings as sources and sinks of heat, moisture and momentum through the whole urban canopy layer. The estimation of exchanges of energy between the interior of buildings and the outdoor atmosphere, are improved by a simple building energy model [43]. BEM accounts for the (1) diffusion of heat through the walls, roofs, and floors; (2) radiation exchanged through windows; (3) longwave radiation exchanged between indoor surfaces; (4) generation of heat due to occupants and equipment; and (5) air conditioning, ventilation, and heating [28].
In the simulations, the height of buildings is considered as varying randomly between 5 m and 20 m. Streets and buildings width is set between 20 m and 30 m and 13 m and 20 m. These assumptions cam be improved by a more in-depth analysis on morphology of urban area (this is beyond the scope of the present work).
The convection of the clouds and thus the cumulus parametrization is not considered for the inner domains. The initial and boundary conditions of the simulations are determined using different datasets. The ECMWF [44] dataset and the USGS [45] are used for the weather data and the terrestrial data, respectively. Three different simulations were carried out during four cloudless summer days in Terni during summer 2015. The simulations start on July 17 at 12 a.m. The first 12 h are considered as initialization time to allow the model to reach stability.
2.3. Scenarios
Three different scenarios are defined to study the urban temperature reduction due to the albedo increase of urban surfaces (i.e., roof, wall, and road).
In the Base Scenario the albedo of all surfaces is set as 0.2, that well represents the typical average albedo of urban surfaces according to the values provided by Oke et al. in [46]: from 0.05 to 0.2 for asphalt roads, from 0.1 to 0.35 for concrete walls, from 0.2 to 0.4 for brick walls, from 0.1 to 0.35 for tile roofs.
Typically, highly reflective materials are characterized by a high albedo that can reach up to 0.95. However, an albedo of 0.95 has not been chosen for the simulation since it would have meant treating all the existing surfaces and it would not have been realistic. Furthermore, according to Balsamo et al. [44] and several other studies, albedo of surfaces is not constant during the whole day but multiple reflections and shadings may cause its variation. According to this, a value of 0.8 of albedo has been chosen to show the effect of albedo increase on urban temperature.
In detail, in the ALB Scenario the albedo surfaces is set to 0.8 for roofs, walls and roads in the urban canopy model table. The increase of urban surfaces albedo effects the updating of surface variables (ground temperature and canopy properties) in each iteration step in land surface model. Planetary boundary layer model is also affected since land surface model provides its boundary conditions.
In the ALB-IND Scenario the albedo is increased to 0.8 for roofs, walls and roads in the grids that include the main industrial area of Terni.
Figure 4 shows the grids that are characterized by albedo increase in the inner domain. The white grids represent the urban grids where albedo increase is performed.
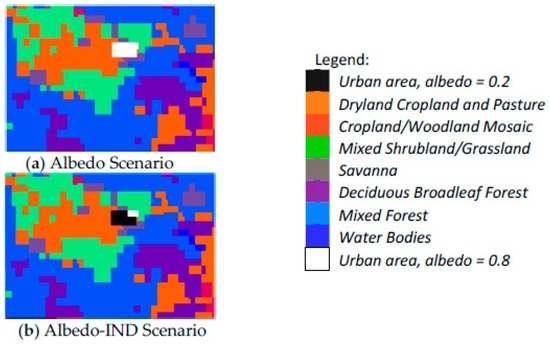
Figure 4.
Land use for the inner domain d04. White grids are the urban grids characterized by albedo increase. Land use category data sets are matched with the USGS categories [24].
3. Results and Discussion
3.1. Model Validation
Measured meteorological parameters (e.g., 2-m air temperature, 2-m relative humidity, and 10-m wind speed) from weather stations are compared to the simulated parameters. Here, the model validation for air temperature at four weather stations is discussed. For their distribution over the domain, the considered weather stations are meaningful for the validation of the model.
The daily trend of simulated temperatures is consistent with the trend of measured temperatures. Figure 5 provides, as an example, the trend of temperatures at weather station D from 17 July at 1 p.m. to 19 July at 11:30 p.m.
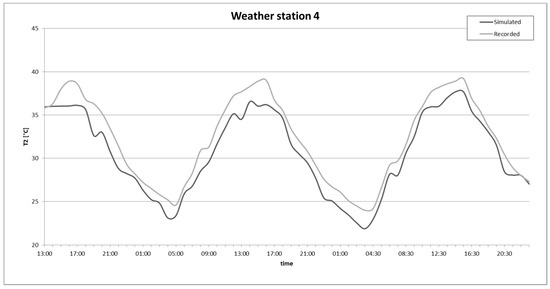
Figure 5.
Plot of simulated and measured temperatures at weather station D from 17 July at 1 p.m. to 19 July at 11:30 p.m.
The mean bias error (MBE) has been calculated as the difference between the recorded and simulated values as:
where fi is the observed value and yi is the simulated value.
The errors (Table 3) are considered acceptable [47]. MBE is calculated as the difference between recorded and simulated values; therefore, a slight underestimation occurs in the model.
Table 3.
Mean absolute error (MAE) and mean bias error (MBE) of 2 m air temperature (°C) and wind velocity (m/s).
3.2. UHI Characterization
The analysis of the UHI effect involves estimating the air temperature differences between pairs of selected “urban” or “rural” measurement sites. A network of 14 points that cover the whole area of Terni has been set as a reference for the UHI assessment and mitigation. The 14-point network is shown in Figure 3. In order to ascertain an unambiguous measure of the UHI effect, it is crucial to choose the urban and rural stations using clear, objective, and significant criteria. The land use classification of the 14 points is shown in Table 4. Land use 1 refers to “Urban and Built-up Land” as in Appendix A.
Table 4.
Land use classification of the 14-point network of Figure 5 according to USGS classification (Appendix A).
T5 has been positioned in correspondence to the location of “Weather Station D”, which is located in the urban area of Terni and whose recorded values have been discussed for the validation of the model. T1 is chosen as another reference point for the urban area, since it is located in the industrial site. T6 and T8 are also classified as urban areas, and theirs are key positions since they are located at the borderline of the urban area in the simulation domain.
The difference between 2-m air temperature simulated in the correspondence of the 14-point network locations has been calculated. In particular, to assess and characterize the UHI phenomenon, the 2-m temperature of locations classified as “Urban and Built-up Land” in the land use characterization has been compared to the 2-m temperature of locations classified as “Dryland Cropland and Pasture” and “Mixed Shrubland/Grassland”.
In further detail, in Figure 6 the temperatures in T5 have been compared to T12 and T10 and the temperatures in T1 to the temperatures in T3. Temperature differences between urban and rural points are positive throughout the whole day, both at night and at daytime. In particular, these values are higher at nighttime. This is because construction materials exhibit a high thermal inertia (i.e., a low response to temperature changes), and consequently, they continue releasing heat slowly after sunset and even near dawn, when most of the rural surfaces have cooled down [48].

Figure 6.
UHI assessment. Temperature differences between urban and non-urban points are shown.
The daily average values of the UHI intensity for the considered points reach 1.4 °C and the maximum value is 4.4 °C.
The results that are shown in Figure 6 are consistent with the values plotted in Figure 7. The heat island is noticeable at night and at daytime, when the urban grids are hotter than the further rural grids and hotter than the closer non-urban grids as well.
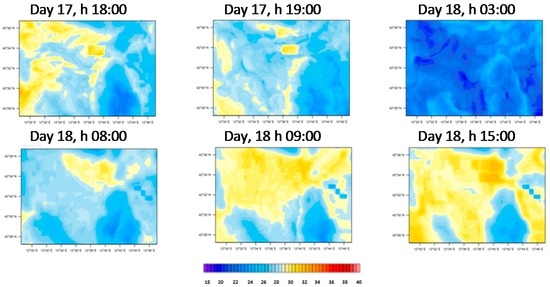
Figure 7.
Plot of 2 m air temperature in the inner domain.
3.3. UHI Mitigation
As introduced in Section 2.3, the increase of albedo in the urban and in the industrial area is simulated in the ALB Scenario and ALB-IND Scenario, respectively.
3.3.1. Base Scenario and ALB Scenario
In the ALB Scenario, the albedo of the whole urban area (i.e., roof, building wall and ground) has been increased to 0.8 according to previous discussions to reduce the urban temperature and thus the UHI phenomenon.
Figure 8 shows the ΔT of some points from 17 July at 12 p.m. to 19 July at 12 a.m. The points where the ΔT is at maximum have been shown, in particular T1, T5, T6 and T8, according to Figure 5. It can be noticed that the temperature is decreased by the albedo increase throughout the whole day and at night as well. The maximum decrease is 2 °C in T1 and T8, and 2.5 °C in T5 and in T6. The average daily decrease is about 1 °C in the three reference points. The decrease of the thermal storage of surfaces is thus highly influential on air temperature.
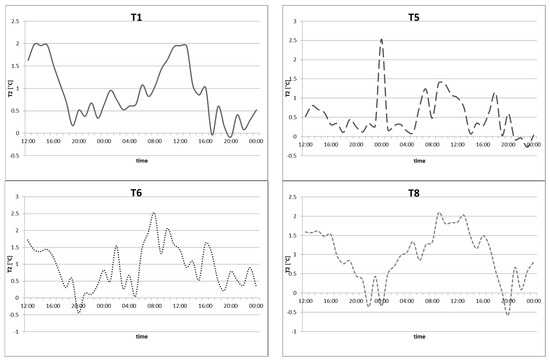
Figure 8.
The 2 m temperature decrease in the ALB-Scenario.
Table 5 provides the values of the peak temperature reduction in T1, T5, T6, T8.
Table 5.
Peak temperature reduction in T1, T5, T6, T8 (Base-ALB Scenario).
Peak temperatures decrease during the day (from 6 a.m. to 6 p.m.), evening (from 6 p.m. to 12 a.m.) and at night (from 12 a.m. am to 6 a.m.) up to 1.8 °C.
3.3.2. Base Scenario and ALB-IND Scenario
In the ALB-IND Scenario, the albedo of the grid points that represent the main industrial area of Terni, which covers an area of about 1 km2, has been increased to 0.8. The trends of the temperature of the industrial area and the surrounding areas have been investigated.
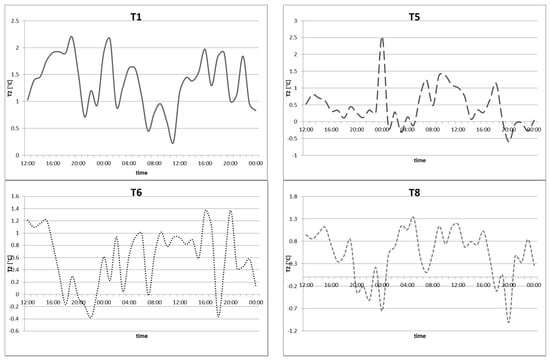
Figure 9.
The 2 m temperature decrease in the ALB-IND Scenario.
T1 is included in the points where the albedo is increased. As was foreseen, the temperature is decreased during the whole day. The maximum decrease is about 2 °C.
T5, T6 and T8 are not included in the area where the albedo has been increased. However, they are very close to that area. The 2-m air temperature is decreased in the ALB-IND Scenario with respect to the Base Scenario. It means that the albedo increase effect is noticeable in the surrounding areas as well. The maximum decrease is about 1.4 °C and 1.3 °C in T6 and T8, respectively.
The peak temperature reduction is shown in Table 6 in T1, T5, T6, T8.
Table 6.
Peak temperature reduction in T1, T5, T6, T8 (Base and ALB-IND Scenarios).
The peak temperatures in T1, which is in the central position of the area where the albedo increase is foreseen, are decreased during the whole day with the maximum decrease in the evening. Daily and evening peak temperatures are almost constant; a slight peak temperature increase is noticed at night.
The values in Table 7 show the maximum and the daily average temperature decrease at the 14 selected points in the ALB Scenario and the ALB-IND Scenario.
Table 7.
Maximum and average temperature decrease simulated in the 14 selected points.
It can be noticed that at the positions where the albedo has been increased in both the ALB and ALB-IND Scenarios or very close to the boundary of that same area, the maximum and the average decrease are comparable (T1, T2, T5).
Furthermore, it is very interesting to underline that the effect of the albedo increase in the industrial area is not limited to that area, but, although with less intensity, it is perceived to influence further distances, as far as T4, T10, T13 and T14.
4. Conclusions
The urban climate in the area of Terni (Italy) during cloudless, sunny days in summer 2015 has been simulated. The simulations have been implemented in four nested domains, the coarser one covering about 650 × 500 km2. The inner domain d04 is focused on the area of Terni and the surrounding rural areas.
The Base Scenario simulation has been used as a reference scenario. Several parameterization schemes have been tested to represent the area of Terni and its interaction with the surrounding environment and the time-efficient parameterization combinations with the least errors are set as the Base Scenario. The UHI phenomenon has also been characterized: urban temperatures may be up to 5 °C higher than rural temperatures.
In order to reduce the UHI effect, the effect of the urban albedo increase has been investigated. In the ALB Scenario the average albedo of the whole urban area has been increased from 0.2 to 0.8 for roofs, walls and roads. The increase of the albedo leads to a decrease of the urban temperature by up to 2.5 °C at daytime and also at nighttime. At a few points of the domain the temperature might be increased as well.
In the ALB-IND Scenario, the albedo of a part of the urban area, and in particular the area covered by the largest industrial site in Terni, has been increased. A great improvement of the urban temperature is noticed in the points that are located in the area where the albedo has been increased, where the temperature can be decreased by 2 °C as in the ALB Scenario. The paper demonstrates the effectiveness of albedo increase as a strategy to reduce the UHI in the urban area of Terni both at daytime and at nighttime. In particular it has been shown that the effect of albedo increase in the industrial site is not restricted to that area, but it also influences the temperature of the surrounding areas, allowing the reduction of temperature over a larger domain.
The results can offer important decision support to local authorities that, in order to improve the thermal comfort and the environmental conditions of the urban area of Terni, may address the exploitation of the industrial area whose low architectural value may instead become a strength and an opportunity.
All the results that have been shown in the paper are considered valuable and meaningful in the optics of evaluating the effect of albedo increase on urban temperatures in Terni. However, some shortcomings of the simulation are pointed out. There might be a more effective solution than albedo increase among the developed effective countermeasures for fighting the UHI. Other simulations should be undertaken to investigate the effectiveness of urban greening, for example. Furthermore, assumptions made in BEM can be improved in order to better represent the energy characteristics of buildings in Terni. A more in-depth analysis on the morphology of the urban area may also improve the simulation. Future follow-up studies could then be undertaken to provide more in-depth analysis and modeling details for implementation plans or scenarios.
Acknowledgments
The authors acknowledge the WU Weather Underground and Associazione ONLUS MeteoNetwork (website: www.meteonetwork.it) for weather data, NCAR for the WRF-ARW sorce code, ECMWF for data analyses and CALCULQUEBEC Canada for computing resources.
Author Contributions
Federico Rossi and Franco Cotana conceived and designed the research; Elena Morini and Ali G. Touchaei performed the simulations; Beatrice Castellani analyzed the data; Elena Morini wrote the paper. All authors read and approved the final manuscript.
Conflicts of Interest
The authors declare no conflict of interest.
Appendix A
Table A1.
USGS 24-category land use categories.
| Land Use Category | Land Use Description |
|---|---|
| 1 | Urban and Built-up Land |
| 2 | Dryland Cropland and Pasture |
| 3 | Irrigated Cropland and Pasture |
| 4 | Mixed Dryland/Irrigated Cropland and Pasture |
| 5 | Cropland/Grassland Mosaic |
| 6 | Cropland/Woodland Mosaic |
| 7 | Grassland |
| 8 | Shrubland |
| 9 | Mixed Shrubland/Grassland |
| 10 | Savanna |
| 11 | Deciduous Broadleaf Forest |
| 12 | Deciduous Needleleaf Forest |
| 13 | Evergreen Broadleaf |
| 14 | Evergreen Needleleaf |
| 15 | Mixed Forest |
| 16 | Water Bodies |
| 17 | Herbaceous Wetland |
| 18 | Wooden Wetland |
| 19 | Barren or Sparsely Vegetated |
| 20 | Herbaceous Tundra |
| 21 | Wooded Tundra |
| 22 | Mixed Tundra |
| 23 | Bare Ground Tundra |
| 24 | Snow or Ice |
References
- Oke, T.R. City size and the urban heat island. Atmos. Environ. 1967, 7, 769–779. [Google Scholar] [CrossRef]
- Phelan, P.E.; Kaloush, K.; Miner, M.; Golden, J.; Phelan, B.; Silva, H.; Taylor, R.A. Urban Heat Island: Mechanisms, Implications, and Possible Remedies. Ann. Rev. Environ. Resour. 2015, 40, 285–307. [Google Scholar] [CrossRef]
- Akbari, H.; Cartalis, C.; Kolokotsa, D.; Muscio, A.; Pisello, A.L.; Rossi, F.; Santamouris, M.; Synnefa, A.; Wong, N.H.; Zinzi, M. Local climate change and urban heat island mitigation techniques—The state of the art. J. Civil Eng. Manag. 2016, 22, 1–16. [Google Scholar] [CrossRef]
- Santamouris, M. On the energy impact of urban heat island and global warming on buildings. Energy Build. 2014, 82, 100–113. [Google Scholar] [CrossRef]
- Castellani, B.; Morini, E.; Filipponi, M.; Nicolini, A.; Palombo, M.; Cotana, F.; Rossi, F. Clathrate Hydrates for Thermal Energy Storage in Buildings: Overview of Proper Hydrate-Forming Compounds. Sustainability 2014, 6, 6815–6829. [Google Scholar] [CrossRef]
- Nastasi, B. Renewable Hydrogen Potential for Low-carbon Retrofit of the Building Stocks. Energy Procedia 2015, 82, 944–949. [Google Scholar] [CrossRef]
- Nastasi, B.; Di Matteo, U. Innovative use of Hydrogen in energy retrofitting of listed buildings. Energy Procedia 2016, in press. [Google Scholar]
- Nastasi, B.; Lo Basso, G. Hydrogen to link heat and electricity in the transition towards future Smart Energy Systems. Energy 2016. [Google Scholar] [CrossRef]
- Magli, S.; Lodi, C.; Lombroso, L.; Muscio, A.; Teggi, S. Analysis of the urban heat island effects on building energy consumption. Int. J. Energy Environ. Eng. 2015, 6, 91–99. [Google Scholar] [CrossRef]
- Doddaballapur, S. Analysis of the impact of urban heat island on building energy consumption. In Proceedings of the 2012 ACES Solar Conference, World Renewable Energy Forum (WREF), Denver, CO, USA, 13–17 May 2012.
- Golden, J.S.; Brazel, A.; Salmond, J.; Laws, D. Energy and water sustainability the role of urban climate change from metropolitan infrastructure. J. Green Build. 2006, 1, 124–138. [Google Scholar] [CrossRef]
- Kolokotroni, M.; Ren, X.; Davies, M.; Mavrogianni, A. London’s urban heat island: Impact on current and future energy consumption in office buildings. Energy Build. 2012, 47, 302–311. [Google Scholar] [CrossRef]
- Rossi, F.; Bonamente, E.; Nicolini, A.; Anderini, E.; Cotana, F. A carbon footprint and energy consumption assessment methodology for UHI-affected lighting systems in built areas. Energy Build. 2015, 114, 96–103. [Google Scholar] [CrossRef]
- Heaviside, C.; Tsangari, H.; Paschalidou, A.; Vardoulakis, S.; Kassomenos, P.; Georgiou, K.E.; Yamasaki, E.N. Heat-related mortality in Cyprus for current and future climate scenarios. Sci. Total Environ. 2016, 569–570, 627–633. [Google Scholar] [CrossRef] [PubMed]
- Ebi, K.L.; Teisberg, T.J.; Kalkstein, L.S.; Robinson, L.; Weiher, L.H. Heat watch/warning systems save lives: Estimated costs and benefits for Philadelphia 1995–1998. Bull. Am. Meteorol. Soc. 2004, 85, 1067–1074. [Google Scholar] [CrossRef]
- Greene, J.S.; Kalkstein, L.S.; Kim, K.R.; Choi, Y.-J.; Lee, D.-G. The application of the European heat wave of 2003 to Korean cities to analyze impacts on heat-related mortality. Int. J. Biometeorol. 2016, 60, 231–243. [Google Scholar] [CrossRef] [PubMed]
- Baldinelli, G.; Bonafoni, S.; Anniballe, R.; Presciutti, A.; Gioli, B.; Magliulo, V. Spaceborne detection of roof and impervious surface albedo: Potentialities and comparison with airborne thermography measurements. Sol. Energy 2015, 113, 281–294. [Google Scholar] [CrossRef]
- Rosenfeld, A.H.; Akbari, H.; Bretz, S.; Fishman, B.L.; Kurn, D.M.; Sailor, D.; Taha, H. Mitigation of urban heat islands: Materials, utility programs, updates. Energy Build. 1995, 22, 255–265. [Google Scholar] [CrossRef]
- Doulos, L.; Santamouris, M.; Livada, I. Passive cooling of outdoor urban spaces. The role of materials. Sol. Energy 2004, 77, 231–249. [Google Scholar] [CrossRef]
- Hooshangi, H.R.; Akbari, H.; Touchaei, A.G. Measuring solar reflectance of variegated flat roofing materials using quasi-Monte Carlo method. Energy Build. 2015, in press. [Google Scholar]
- Rossi, F.; Morini, E.; Castellani, B.; Nicolini, A.; Bonamente, E.; Anderini, E.; Cotana, F. Beneficial effects of retroreflective materials in urban canyons: Results from seasonal monitoring campaign. In Proceedings of the 33rd UIT (Italian Union of Thermo-fluid dynamics) Heat Transfer Conference, L’Aquila, Italy, 22–24 June 2015.
- Rossi, F.; Castellani, B.; Presciutti, A.; Morini, E.; Filipponi, M.; Nicolini, A.; Santamouris, M. Retroreflective façades for urban heat island mitigation: Experimental investigation and energy evaluations. Appl. Energy 2015, 145, 8–20. [Google Scholar] [CrossRef]
- Rossi, F.; Pisello, A.L.; Nicolini, A.; Filipponi, M.; Palombo, M. Analysis of retro-reflective surfaces for urban heat island mitigation: A new analytical model. Appl. Energy 2014, 114, 621–631. [Google Scholar] [CrossRef]
- Rossi, F.; Castellani, B.; Presciutti, A.; Morini, E.; Anderini, E.; Filipponi, M.; Nicolini, A. Experimental evaluation of urban heat island mitigation potential of retro-reflective pavement in urban canyons. Energy Build. 2016, 126, 340–352. [Google Scholar] [CrossRef]
- Touchaei, A.G.; Hosseini, M.; Akbari, H. Energy savings potentials of commercial buildings by urban heat island reduction strategies in Montreal (Canada). Energy Build. 2016, 110, 41–48. [Google Scholar] [CrossRef]
- Touchaei, A.G.; Akbari, H. Evaluation of the seasonal effect of increasing the albedo on urban climate and energy consumption of buildings in Montreal. Urban Clim. 2015, in press. [Google Scholar] [CrossRef]
- Touchaei, A.G.; Wang, Y. Characterizing urban heat island in Montreal (Canada)—Effect of urban morphology. Sustain. Cities Soc. 2015, 19, 395–402. [Google Scholar] [CrossRef]
- Chen, F.; Kusaka, H.; Bornstein, R.; Ching, J.; Grimmond, C.S.B.; Grossman-Clarke, S.; Loridan, T.; Manning, K.W.; Martilli, A.; Miao, S.; et al. The integrated WRF/urban modelling system: Development, evaluation, and applications to urban environmental problems. Int. J. Climatol. 2011, 31, 273–288. [Google Scholar] [CrossRef]
- Salamanca, F.; Martilli, A.; Tewari, M.; Chen, F. A Study of the Urban Boundary Layer Using Different Urban Parameterizations and High-Resolution Urban Canopy Parameters with WRF. J. Appl. Meteorol. Climatol. 2011, 50, 1107–1128. [Google Scholar] [CrossRef]
- Kusaka, H.; Chen, F.; Tewari, M.; Dudhia, J.; Gill, D.O.; Duda, M.G.; Wang, W. Numerical simulation of urban heat island effect by the WRF model with 4-km grid increment: An inter-comparison study between the urban canopy model and slab model. J. Meteorol. Soc. Jpn. 2012, 90, 33–45. [Google Scholar] [CrossRef]
- Fallmann, J.; Emeis, S.; Suppan, P. Mitigation of urban heat stress—A modelling case study for the area of Stuttgart. ERDE 2013, 144, 202–216. [Google Scholar]
- Peel, M.C.; Finlayson, B.L.; McMahon, T.A. Updated world map of the Köppen-Geiger climate classification. Hydrol. Earth Syst. Sci. 2007, 11, 1633–1644. [Google Scholar] [CrossRef]
- Feliciani, J. Numeri meteo dell’estate 2012. Available online: http://www.notitiae.info/2012/09/15/numeri-meteo-dellestate-2012/ (accessed on 3 October 2015).
- WRF User Guide. Chapter 3: WRF Preprocessing System (WPS). Land Use and Soil Categories in the Static Data. Available online: http://www2.mmm.ucar.edu/wrf/users/docs/user_guide_V3/users_guide_chap3.htm (accessed on 1 March 2014).
- Morrison, H.; Thompson, G.; Tatarskii, V. Impact of Cloud Microphysics on the Development of Trailing Stratiform Precipitation in a Simulated Squall Line: Comparison of One– and Two–Moment Schemes. Mon. Weather Rev. 2009, 137, 991–1007. [Google Scholar] [CrossRef]
- Mlawer, E.J.; Taubman, S.J.; Brown, P.D.; Iacono, M.J.; Clough, S.A. Radiative transfer for inhomogeneous atmospheres: RRTM, a validated correlated–k model for the longwave. J. Geophys. Res. 1997, 102, 16663–16682. [Google Scholar] [CrossRef]
- Dudhia, J. Numerical study of convection observed during the Winter Monsoon Experiment using a mesoscale two–dimensional model. J. Atmos. Sci. 1989, 46, 3077–3107. [Google Scholar] [CrossRef]
- Janjic, Z.I. Nonsingular Implementation of the Mellor-Yamada Level 2.5 Scheme in the NCEP Meso Model. 2002. Available online: http://www2.mmm.ucar.edu/wrf/users/phys_refs/SURFACE_LAYER/eta_part4.pdf (accessed on 29 September 2016).
- Tewari, M.; Chen, F.; Wang, W.; Dudhia, J.; LeMone, M.A.; Mitchell, K.; Ek, M.; Gayno, G.; Wegiel, J.; Cuenca, R.H. Implementation and verification of the unified NOAH land surface model in the WRF model. In Proceedings of the 20th Conference on Weather Analysis and Forecasting/16th Conference on Numerical Weather Prediction, Seattle, WA, USA, 12–16 January 2004 ; pp. 11–15.
- Janjic, Z.I. The Step–Mountain Eta Coordinate Model: Further developments of the convection, viscous sublayer, and turbulence closure schemes. Mon. Weather Rev. 1994, 122, 927–945. [Google Scholar] [CrossRef]
- Kain, J.S. The Kain–Fritsch convective parameterization: An update. J. Appl. Meteorol. 2004, 43, 170–181. [Google Scholar] [CrossRef]
- Martilli, A.; Clappier, A.; Rotach, M.W. An urban surface exchange parameterization for mesoscale models. Bound.-Layer Meteorol. 2002, 104, 261–304. [Google Scholar] [CrossRef]
- Salamanca, F.; Martilli, A. A new building energy model coupled with an urban canopy parameterization for urban climate simulations—Part II. Validation with one dimension off-line simulations. Theor. Appl. Climatol. 2010, 99, 345–356. [Google Scholar] [CrossRef]
- Balsamo, G.; Albergel, C.; Beljaars, A.; Boussetta, S.; Brun, E.; Cloke, H.L.; Dee, D.P.; Dutra, E.; Pappenberger, F.; De Rosnay, P.; et al. ERA-Interim/Land: A Global Land-Surface Reanalysis Based on ERA-Interim Meteorological Forcing; ECMWF: Reading, UK, 2012. [Google Scholar]
- U.S. Geological Survey. USGS for a changing world. Available online: https://www.usgs.gov/ (accessed on 1 March 2014).
- Oke, T.R. Boundary Layer Climates, 2nd ed.; Methuen: London, UK; New York, NY, USA, 1987; p. 452. [Google Scholar]
- Zhang, H.; Zhaoxia, P. Examination of Errors in Near-Surface Temperature and Wind from WRF Numerical Simulations in Regions of Complex Terrain. Am. Meteorol. Soc. 2013, 28, 893–914. [Google Scholar] [CrossRef]
- Urban Heat Islands (UHIs). Available online: http://www.urbanheatislands.com/ (accessed on 1 July 2016).
© 2016 by the authors; licensee MDPI, Basel, Switzerland. This article is an open access article distributed under the terms and conditions of the Creative Commons Attribution (CC-BY) license (http://creativecommons.org/licenses/by/4.0/).