Comment

Regional Inequality in Underdeveloped Areas: A Case Study of Guizhou Province in China

1
Institute of Geographical Sciences and Natural Resources Research, Chinese Academy of Sciences, Beijing 100101, China
2
Key Laboratory of Regional Sustainable Development Modeling, Chinese Academy of Sciences, Beijing 100101, China
3
Department of Resources and Environment, University of Chinese Academy of Sciences, Beijing 100049, China
4
Center of Integrated Geographic Information Analysis, School of Geography and Planning, Sun Yat-sen University, Guangzhou 510275, China
*
Author to whom correspondence should be addressed.
Sustainability 2016, 8(11), 1141; https://doi.org/10.3390/su8111141
Submission received: 16 August 2016 / Accepted: 24 October 2016 / Published: 6 November 2016

Abstract

:
This study analyzes regional development in one of the poorest provinces in China, Guizhou Province, between 2000 and 2012 using a multiscale and multi-mechanism framework. In general, regional inequality has been declining since 2000. In addition, economic development in Guizhou Province presented spatial agglomeration and club convergence, which shows how the development pattern of core-periphery has been developed between 2006 and 2012. Multilevel regression analysis revealed that industrialization, marketization and investment level were the primary driving forces of regional economic disparity in Guizhou Province. We can get a deeper understanding of the mechanisms involved in regional inequality in Guizhou Province with the multilevel regression models. The influences of decentralization on regional economic disparity were actually relatively weak, and investment level exhibited more importance on the regional inequality when the variable of time was considered. In addition, both the topography and urban-rural differentiation were the two main reasons for forming a core-periphery structure in Guizhou Province.

1. Introduction

China has experienced rapid development since the early 1980s, but is now facing the challenge of determining how to move smoothly beyond the middle income stage of economic development [1,2]. At the same time, uneven economic development among different regions of China has also intensified [3]. Since regional inequality may threaten national unity and social stability, it has become an important issue both for policy makers and for scholars [4].
Provincial China has been the frontier of research on regional inequality. With the aid of GIS and spatial analysis methods, this body of research literature has produced a rich harvest from China’s provinces [5,6,7]. Recent work on provincial China has focused on the eastern provinces, such as Jiangsu [8], Zhejiang [9,10], Beijing [5] and Guangdong [11,12]. The regional development mechanisms in these provinces can be interpreted by the triple transitions, namely decentralization, marketization and globalization. However, studies on the western provinces remain limited, especially on those that are economically underdeveloped. Moreover, the effect of decentralization, marketization and globalization on economic development on the western provinces is different from the eastern provinces [4,13].
Being one of China’s poorest areas, Guizhou Province is representative of regional inequality in provincial China. In 2013, its per capita gross domestic product (GDP) was the lowest in China. In order to narrow the economic gap between regions, the Chinese government has begun paying more attention to endorsing programs to alleviate inequality. In 1999, the “Western Development Program” (WDP) was launched to boost the economic development of 12 provinces in the poorer western region [3]. The central government has strengthened industrial investment throughstate-owned enterprise [7]. Fan and Sun [13] argued that the government’s programs and efforts since the late 1990s to reduce regional inequality have had some initial success: interregional and intraregional inequalities first stabilized and then declined. However, the government’s efforts toward inequality reduction in disadvantaged provinces have rarely been investigated. Does promoting the level of industrialization of undeveloped areas reduce regional inequality in Guizhou Province to a certain degree? Therefore, it is necessary to examine the efforts of the government to alleviate inequality in economically-underdeveloped areas in China.
Drawing upon a multiscale and multi-mechanism framework [14], this study examines changing patterns of regional inequality in Guizhou Province and investigates the mechanisms using methods of spatial analysis. This paper deepens the existing literature on regional inequality in China and examines which factors affect the regional inequality in undeveloped areas. The rest of this paper is structured as follows. Section 2 presents a brief review of the literature; Section 3 describes the methodology and the dataset; Section 4 presents the distributional dynamics of regional inequality and the spatial-temporal hierarchy of the mechanisms; and Section 5 concludes with major findings and a discussion.

2. Literature Review

Regional inequality has been a subject of heated debate among various schools of development, such as convergence, divergence, inverted-U and endogenous growth theories [15,16,17]: (1) Neoclassical theory and inverted-U models are the most influential representations of the convergence school of thought [18,19,20,21]. Neoclassical economists maintain that regional inequality is a temporary phenomenon [22], and inverted-U theory holds that regional inequality tends to initially increase, then peaks and, finally, decreases, following an inverted-U trajectory [16,21]. Drawing on two important notions, Barro and Sala-i-Martin [15,23] identified that poorer states or regions grew faster, resulting in convergence over the long run. In contrast to the convergence view, the findings of persistent poverty and inequality prompted new thinking on development and inequality, such as cumulative causation, dependency and neo-Marxism [17]; (2) Different from neoclassical approaches, scholars such as Perroux and Hirschman advocated government intervention and promoted the development of growth poles. The notion provoked by Perroux and Hirschman is known as top-down development and the growth pole policies or development from above [6]; (3) However, scholars have challenged this theory for ignoring scales, space and time [7]. The new economic geography theory has provided strong evidence for the importance of geography in economic and regional development [24]. In this context, the role of space and scale in shaping the evolution of regional inequality is emphasized by scholars [25].
Recent research on regional inequality has attempted to strengthen the study of regional inequality by incorporating the recent developments in GIS and spatial analysis. The multiscale and multi-mechanism framework has proved to be a valuable framework for these studies [25]. With the aid of GIS and spatial analysis methods, the patterns of regional inequality can be explored at regional, municipal and county levels. Moreover, the spatial-temporal hierarchy of the underlying mechanisms can be analyzed in a multilevel model using Markov chains [5,6,11,12].
China’s market reforms and rapid economic growth have generated considerable scholarly attention on the issue of regional inequality, deepening our understanding of the evolution of regional inequality in a transitional economy [13,25]. Wei [25] argued that China’s regional development mechanisms can be interpreted by the triple transitions, namely decentralization, marketization and globalization. However, case studies show that the various factors resulting in regional inequality in China were different [5,6,7,8,9,10,11,12]. Researchers have investigated the effects of decentralization, marketization and globalization on the eastern provinces, such as Jiangsu [8], Zhejiang [9,10], Beijing [5] and Guangdong [11,12]. Fan and Sun [13] argued that the government’s programs and efforts since the late 1990s to reduce regional inequality have had some initial success. In order to explore regional inequality in Guizhou Province, this paper draws on a multiscale and multi-mechanism analytical framework to describe the space-time of regional inequality and explain its driving forces. The paper also provides a realistic reference point for reducing the regional gap.

3. Study Area and Methods

3.1. Study Area

Guizhou Province is located in southwestern China and contains six prefecture-level cities (Guiyang, Liupanshui, Zunyi, Bijie, Anshun, Tongren) and three autonomous prefectures (Buyi-Miao Autonomous Prefecture of Qianxinan, Miao-Dong Autonomous Prefecture of Qiandongnan, Buyi-Miao Autonomous Prefecture of Qiannan); it is one of the 12 provinces of the WDP (Figure 1). With a population of 35.02 million people, the province covers 176,200 square kilometers, occupying 1.8% of China’s territory. GDP reached 800.68 billion Yuan by 2013, with an annual average growth rate of 11.8% between 2000 and 2013, ranking it sixth from the bottom, thus making it one of the most underdeveloped provinces in China. Per capita GDP was 22,922 Yuan in 2013, which is equivalent to only 53.8% of the national average (Table 1). Guizhou Province has made some positive achievements in the ecological environment, infrastructure and economy since the implementation of the WDP in 1999, but it is also confronted by many problems, such as the widening inequality of development within the provinces.
This paper studied Guizhou Province in the period of 2000–2012 in order to explore regional inequality in underdeveloped areas and to compare it with developed coastal regions to get a better understanding of the laws governing the regional economic disparity, which may have some value for testing and formulating government policy.

3.2. Methods

3.2.1. Theil Index

There are many methods of measuring regional inequality. We selected the Theil index to describe the regional economic disparities of Guizhou Province in this paper. The Theil index was established by Claude Elwood Shannon, which was applied to studying the income gap between countries by Theil. We used the population-weighted Theil index formula shown in Equation (1) to investigate the evolution of regional inequality in Guizhou at the county scale:
T w = i   f ( x i ) log f ( x i ) g ( x i )
where f(xi) is the share of per capita GDP of county i in the province and g(xi) is the share of population of county i in the province.

3.2.2. Scale Variance Analysis

Scale variance gradually decomposes the variance in the system according to the hierarchical level, so the spatial variability of the scale in which the variance has mutations is the most outstanding, and it also indicates the characteristic scales at different levels. The scale variance statistical model has been described in the literature [26]; the formula is shown in Equation (2) [27]:
X i j k   z = μ + α i + β i j + γ i j k + + ω i j k   z
where Xijk … z are the values of the units in the hierarchical region at the smallest scale, μ is the total mean of the entire basic unit in the whole research object and α is the overall impact on the regional variance from the highest scale. In this paper, the method is applied so that the regional scale nests the municipal scale and the municipal scale nests the county scale; ω i j k   z is the overall impact on the regional variance from the highest scale α of the units in the hierarchical region to the smallest scale z, i.e., a three-level spatial regional system for regional-level α, municipal-level β and county-level γ. The decomposition formula of the scale variance is shown in Table 2.

3.2.3. Spatial Autocorrelation Analysis

Global Moran’s I is used to analyze the distribution characteristic of the spatial data in the whole region. The formula is shown in Equation (3):
I = n i = 1 n j = 1 n w i j ( x i X ¯ ) ( x j X ¯ ) i = 1 n j = 1 n w i j i = 1 n ( x i X ) 2 = n i = 1 n j = 1 n w i j ( x i X ¯ ) ( x j X ¯ ) S 2 i = 1 n j = 1 n w i j
where n is the number of regions, wij are the spatial weights, xi and xj are, respectively, the properties of region i and region j, X ¯ = 1 n i = 1 1 X i is the mean of the property and S 2 = i = 1 n j = 1 n w i j is the variance of the property. Moran’s I index can be viewed as the correlation coefficient between the observations and the spatial lag. A Moran’s I index greater than 0, less than 0 and equal to 0, respectively, indicates a positive correlation, negative correlation and random distribution [28].
A local Moran’s I is used to test whether there are similar or different agglomerations of observations in the local area [29], which is usually measured by a Moran scatter diagram and a local indicators of spatial association (LISA) figure. The local Moran’s I of region i is a measurement of the degree of association between region i and its adjacent areas, which is defined as Equation (4):
I i = ( x i X ¯ ) S 2 i j ( x j X ¯ )
A high value is surrounded by high values or a low value is surrounded by low values if the value of Ii is positive, and a high value is surrounded by low values or a low value is surrounded by high values if the value of Ii is negative. Its significance is tested by the Z‑value of its normal statistics.
In addition, there are many kinds of methods defining the spatial weight matrix. This paper establishes a spatial weights matrix according to the first order Rook principle, which defines the unit sharing the border as the neighbors, so the spatial weight matrix elements are wij = 1 or wij = 0. The formula is shown in Equation (5):
w i j = { 1 , r e g i o n   i   i s   a d j a c e n t   t o   r e g i o n   j 0 , r e g i o n   i   i s   n o t   a d j a c e n t   t o   r e g i o n   j

3.2.4. Markov Chains

This paper used a Markov chain to study the evolution of the distribution pattern of regional inequality in Guizhou Province. First of all, we discretized per capita GDP in Guizhou Province into k types and calculated the probability distribution of each type and its internal evolution. The transitions of per capita GDP types in different years can be represented by a k × k Markov transition probability matrix M, which approximately approaches the whole process of regional evolution (Table 3). The elements mij in matrix M (Table 3) are the probabilities of moving from regional type i in year t to regional type j in the following year t + 1 [12], which is calculated as follows.

3.2.5. Spatial Multilevel Regression Model

Three levels of the spatial multilevel regression model are applied in this paper. The one-level model uses regression with per capita GDP at the county-level scale without considering the core-periphery structure and the time level. The core-periphery structure is added to the two-level model, which analyzes the influence of the geographical structure through four categories, core, semi-core, semi-periphery and periphery. The three-level model adds the time level based on the two-level model and researches in the time period 2000–2012. The expression for the model is shown in Equation (6) [11,12]:
y i j t = β 0 + β 1 x i j t + v 0 t + μ 0 j t + e 0 i j t
where y i j t is per capita GDP of county i belonging to type j in the core-periphery structure in year t, x i j t is the independent variable of county i belonging to type j in the core-periphery structure in year t, v 0 t is the residual term in year t, μ 0 j t is the residual term of type j in the core-periphery structure in year t and e 0 i j t is the residual term of county i belonging to type j in the core-periphery structure in year t.

3.3. Variable Selection and Data Sources

Regional inequality is the result of a complex interaction of multiple factors. This paper explores regional inequality in Guizhou Province from the viewpoint of human factors and selects the per capita GDP of 88 counties to describe the regional development level. Referring to the relevant research literature and the actual situation in Guizhou Province, we chose four socio-economic variables, reflecting industrialization, marketization, decentralization and investment level, to analyze the dynamic mechanism of regional inequality in Guizhou Province.
Industrialization is measured by per capita industrial added value above the designed size (the designed size is annual main business income of 5 million Yuan and above before 2010 and 20 million Yuan and above after 2010), and we used the gross industrial output value above the designed size for the period 2000–2005 because the appropriate data were unavailable. Marketization is measured by the per capita retail sales of consumer goods and investment level by the per capita fixed asset investment index. We used the share of per capita budget expenditure of local government fiscal expenditure to measure the process of decentralization, which reflects the degree of financial decentralization and the process of streamlining administration and delegating power.
In addition, we selected the urban-rural divide (assigning values of 1 in urban areas and 0 in rural areas) and topography (counties in which mountain areas are more than 50% were assigned a value of 1, other counties were assigned a value of 0) as dummy variables.
All of the data come from the Guizhou Statistics Yearbook [30], the China Statistics Yearbook [31], Guizhou 60 Years [32], Guizhou Reform 30 Years [33] and the China Economic and Social Development Statistics Data Library from 2001–2013 [34]. The data for counties and cities in some years were calculated from the growth rate, and data for some regions were calculated from the data for the counties. In addition, this paper also merges and unifies the administrative region in Guizhou Province according to the administrative divisions in 2010.

4. Results

4.1. Multi-Scalar Regional Inequality in Guizhou Province

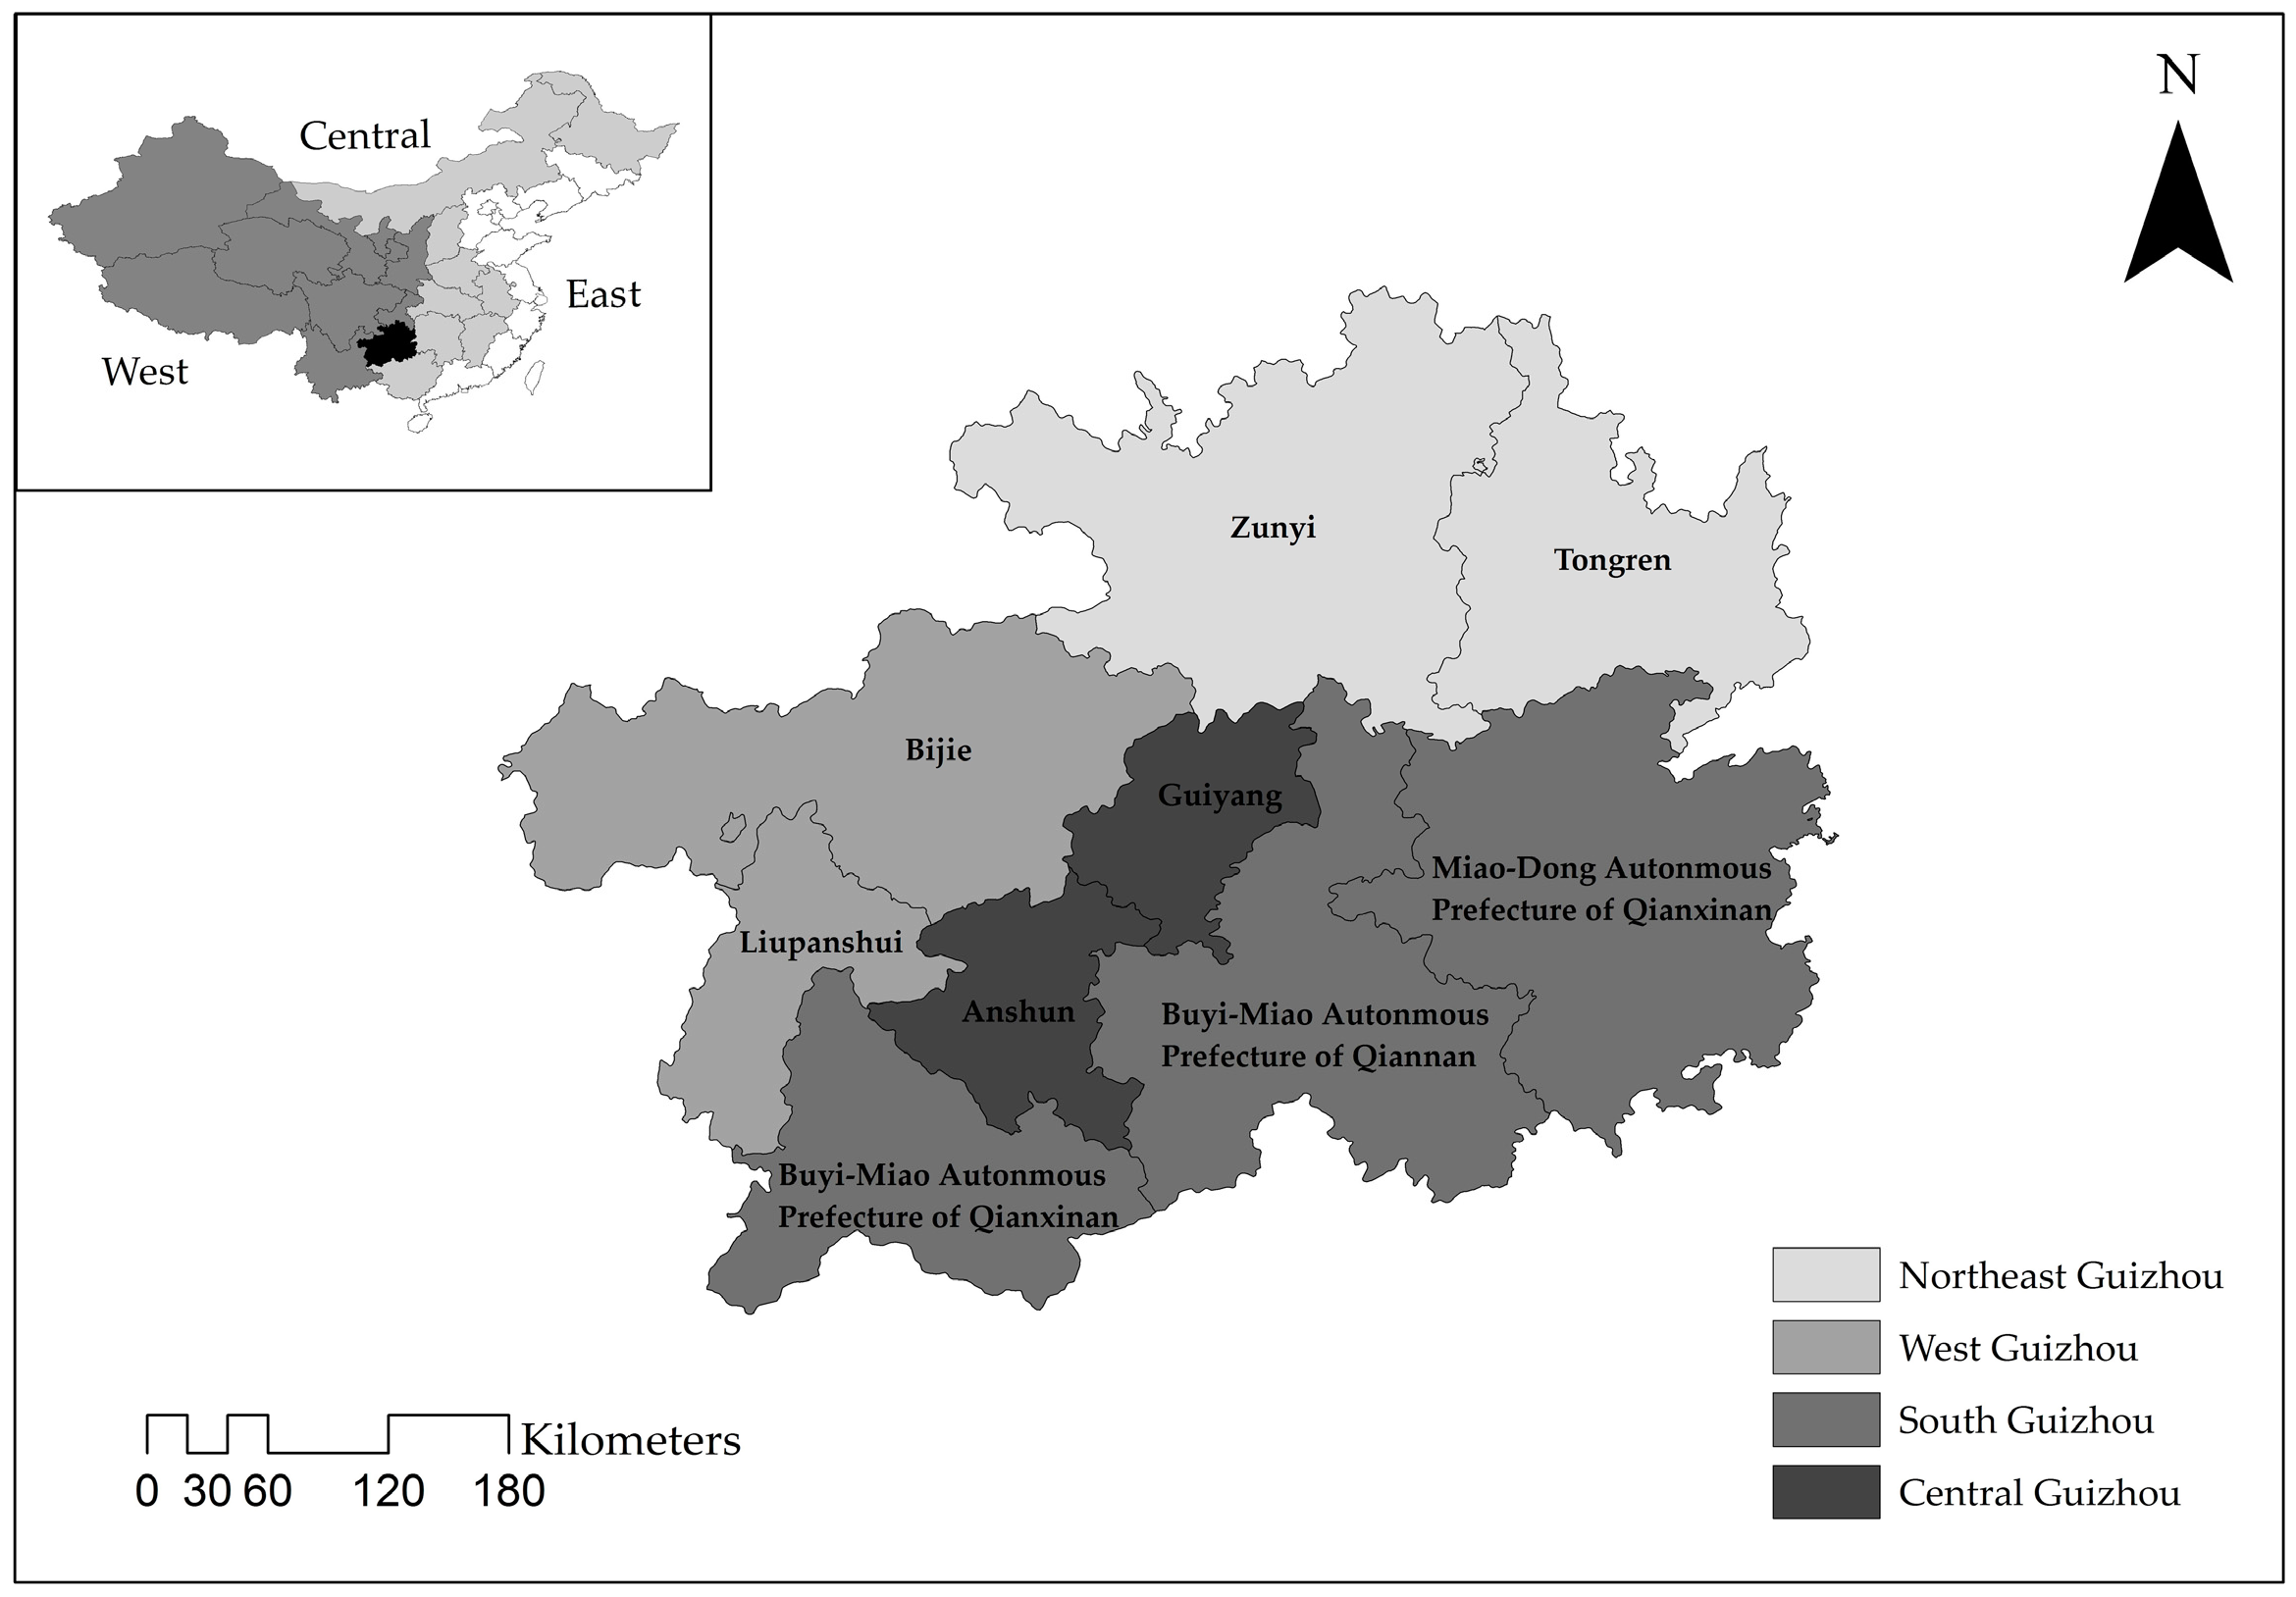
In order to reveal the dynamics of regional inequality at different scales, we decomposed overall inter-county inequality into inequality among four regions in Guizhou Province and inequality within four regions in the province. The four regions were respectively Central Guizhou, Northeast Guizhou, West Guizhou and South Guizhou. Scale variance analysis was applied to provide more details of regional inequality in Guizhou Province with the three nested scales, which focused on the relative importance of different spatial scales to regional disparity. The results of the scale variance analysis are described in the following sections.
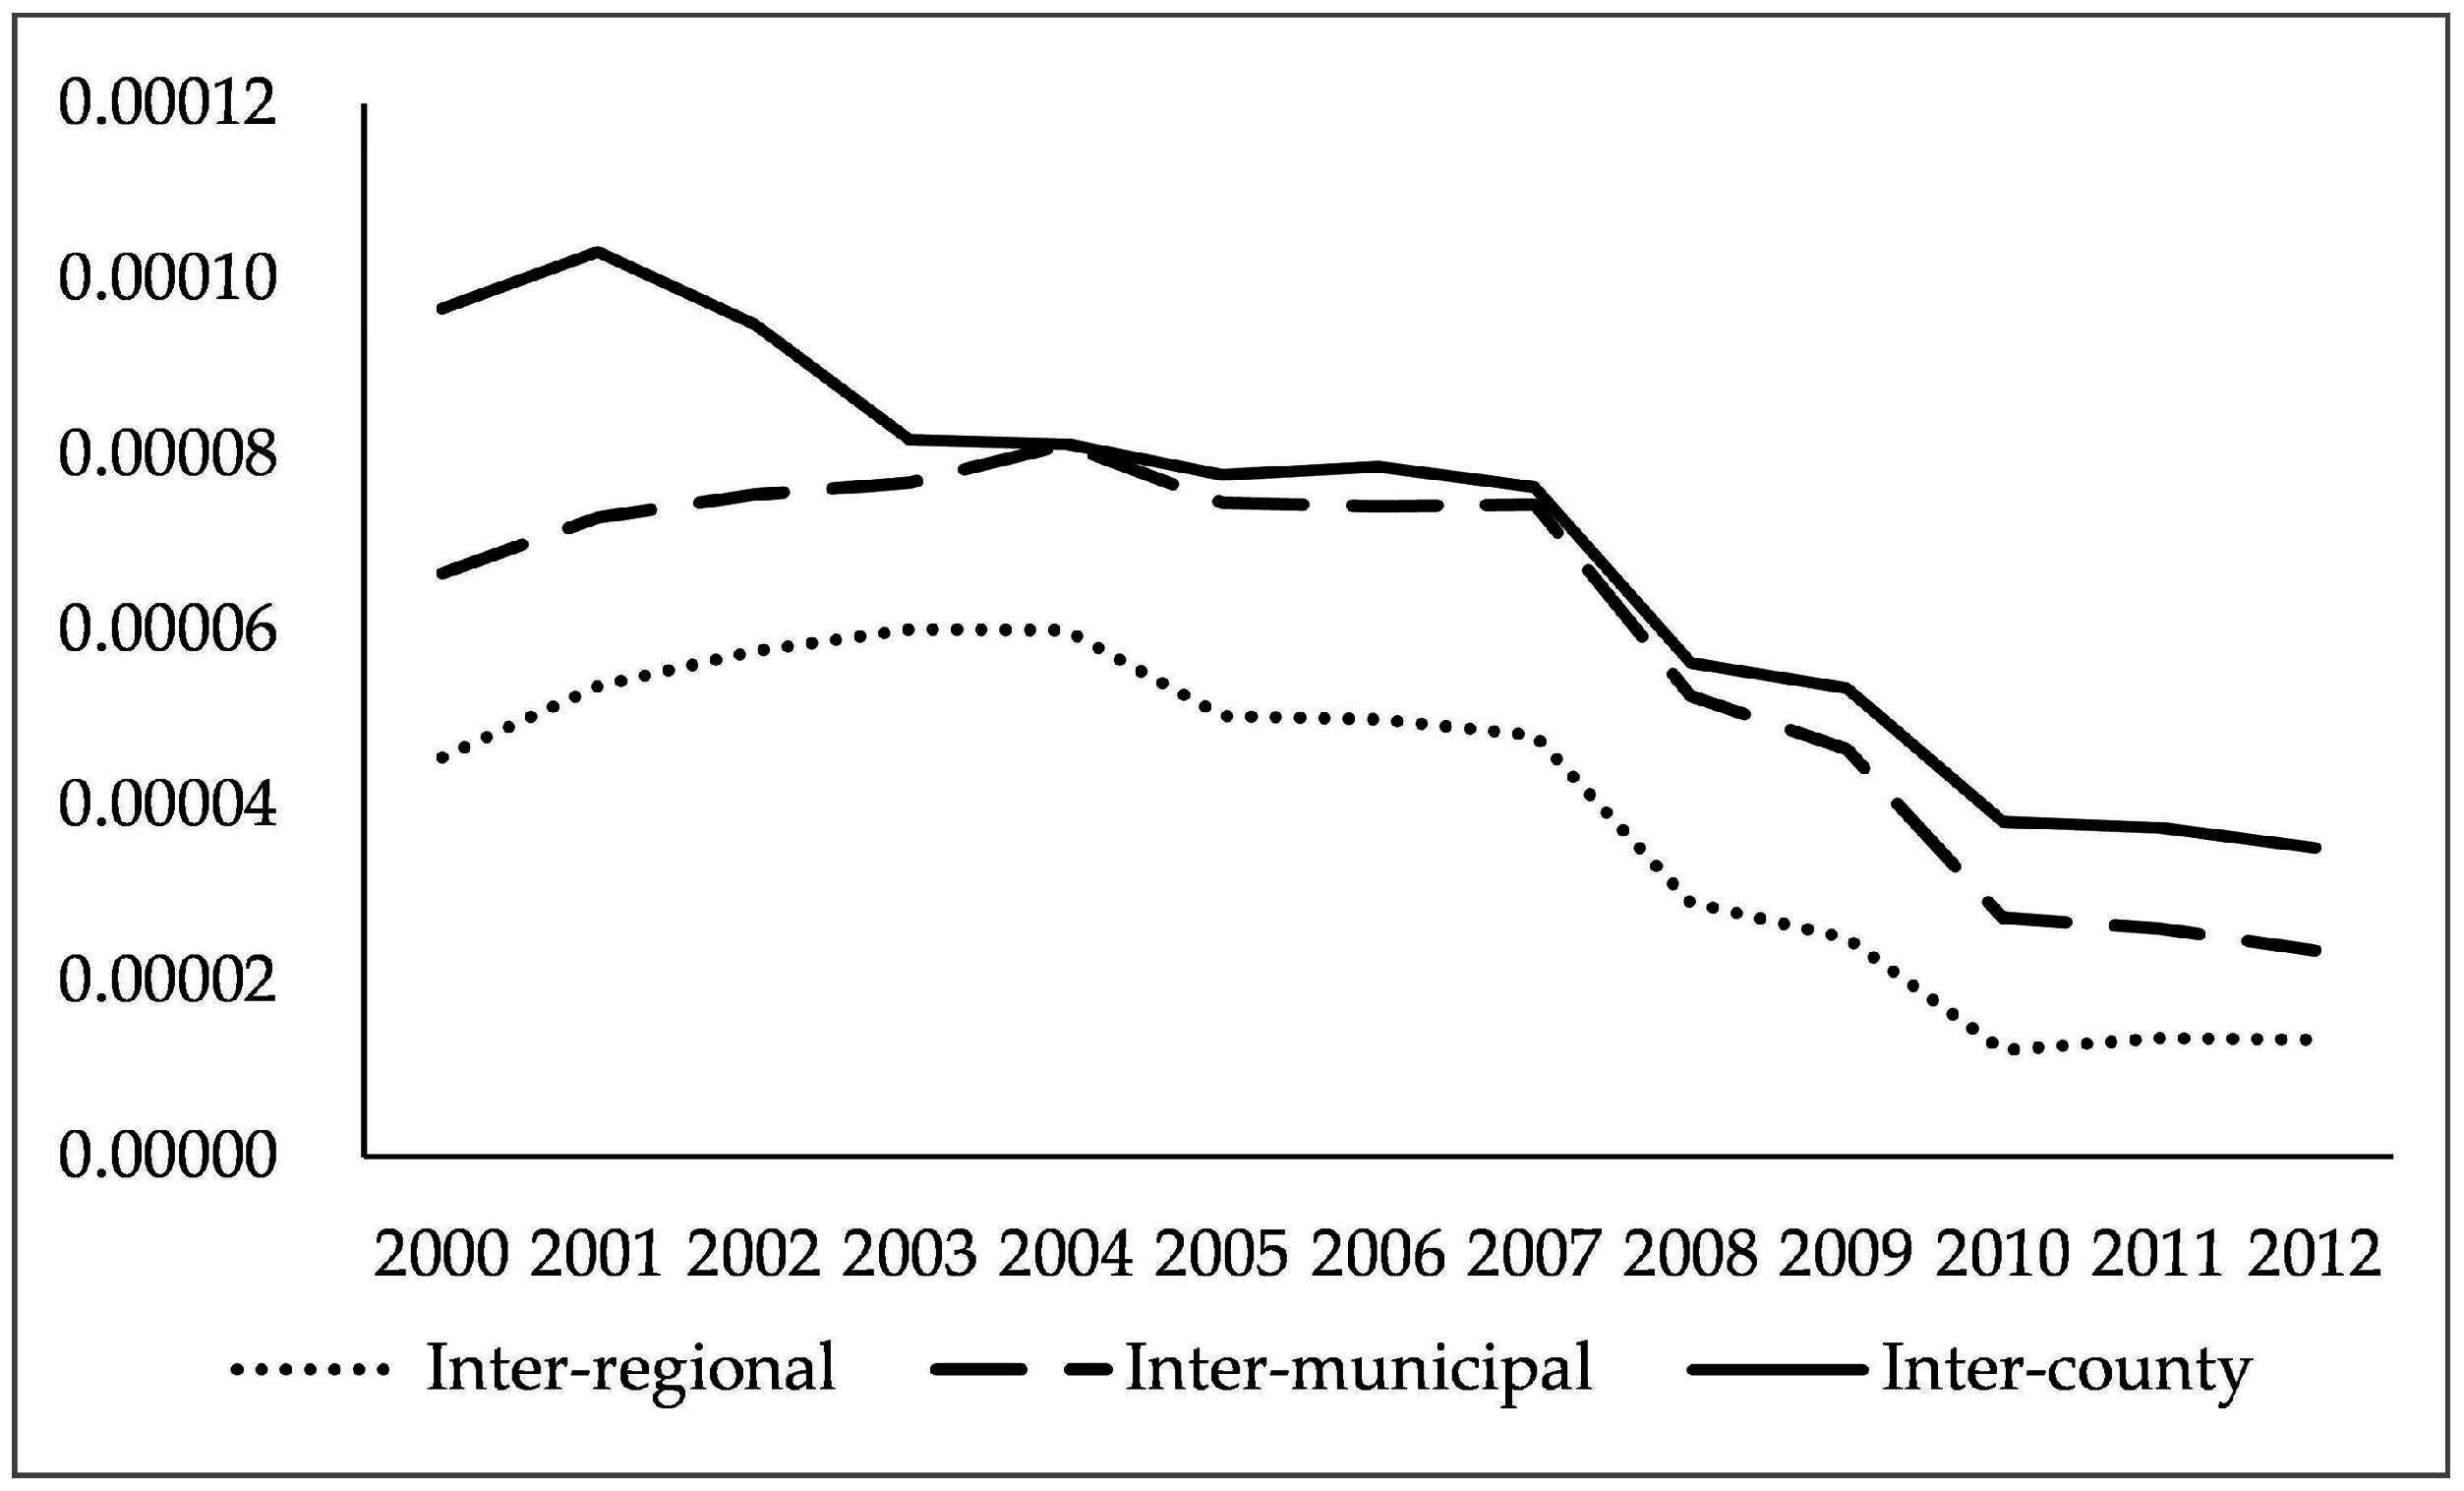
Regional inequality at the county scale declined before 2004, while inequality at the municipal and regional scales rose slightly; and inequality at the three levels of spatial scale showed a similar downward tendency after 2004 (Figure 2). The scale variance of the county scale was successively greater than that of the municipal and regional scales, but the county scale was close to the municipal scale. It is suggested that regional inequality increases with scaling down, which tallies with the comparison of the single scale. As 
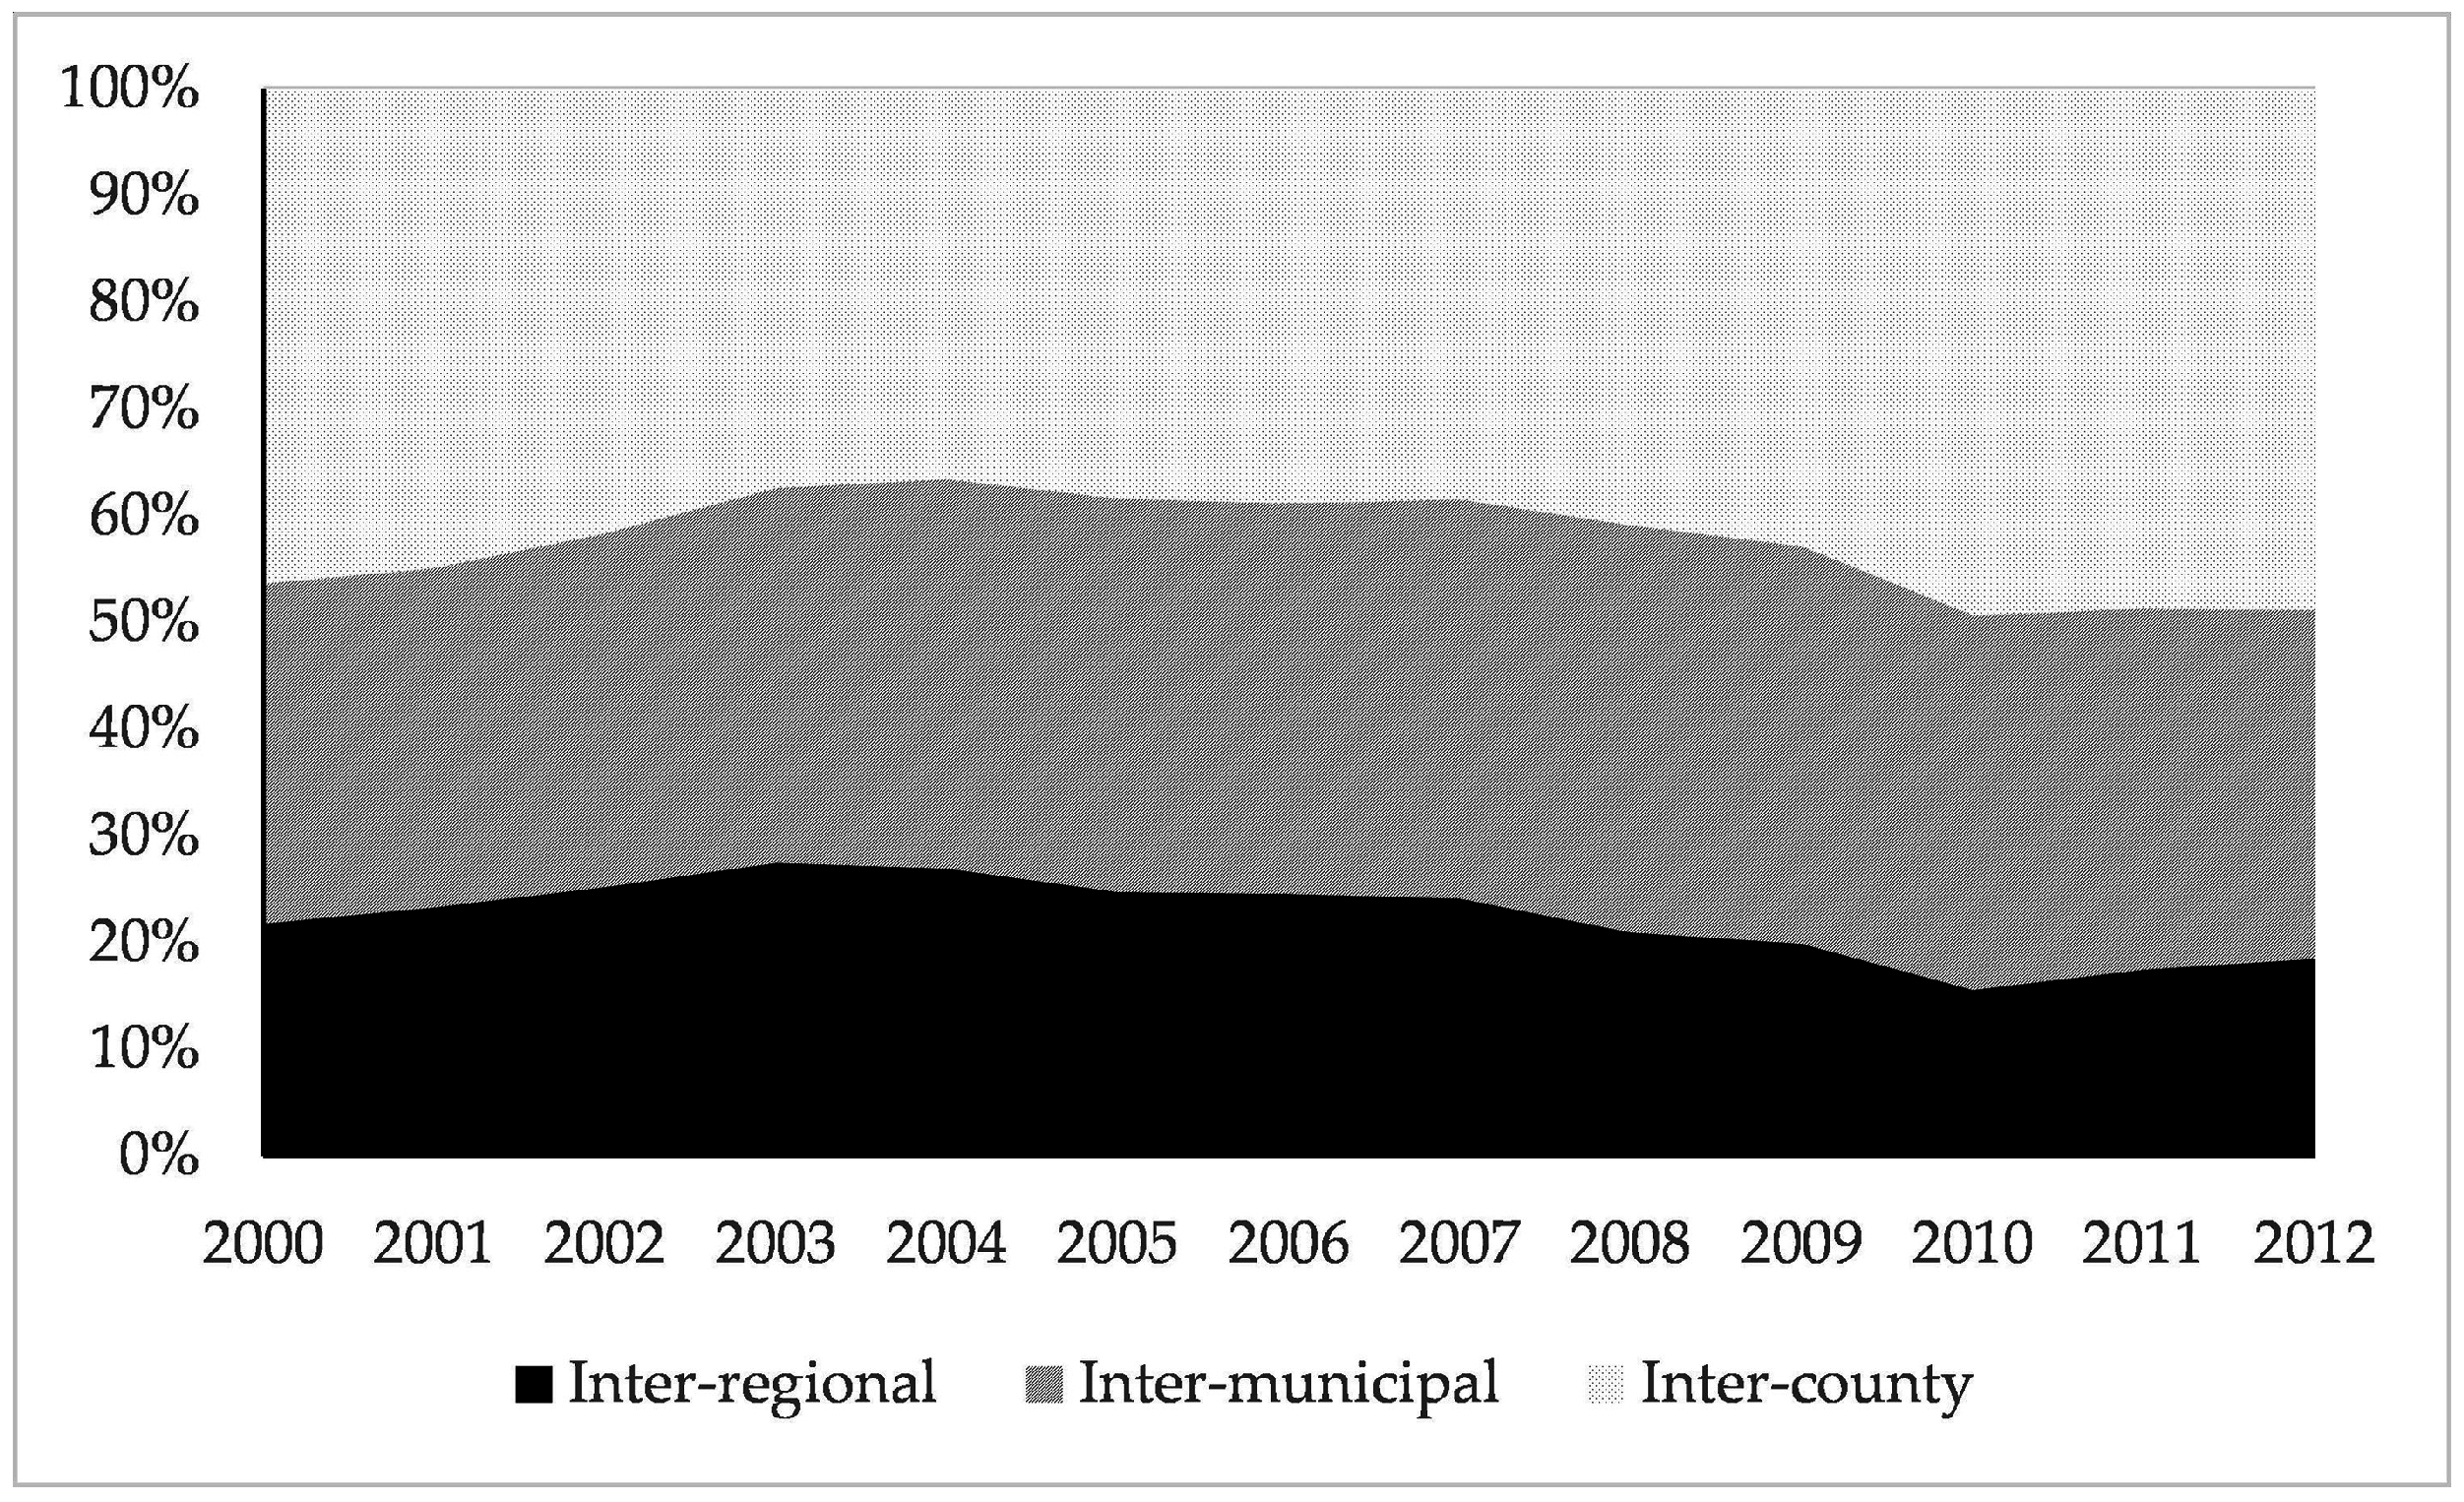
Figure 3 illustrates, contributions from the county and municipal scales accounted for the majority of regional inequality in Guizhou Province.
Scale variance analysis is aimed at studying the relationship between different scales. In this section, we found that regional inequality in Guizhou Province was sensitive to geographical scales and closely related to spatial organization, which tallies with eastern coastal areas, such as Guangdong and Zhejiang provinces. Scale effects on regional inequality had a certain influence, while the impact varied in different regions. The county and municipal scales had the greatest influence on regional inequality in Guizhou Province, while the county scale had the greatest effect on regional inequality in Guangdong and Zhejiang provinces [9,10,11].

4.2. Distributional Dynamics of Regional Disparities

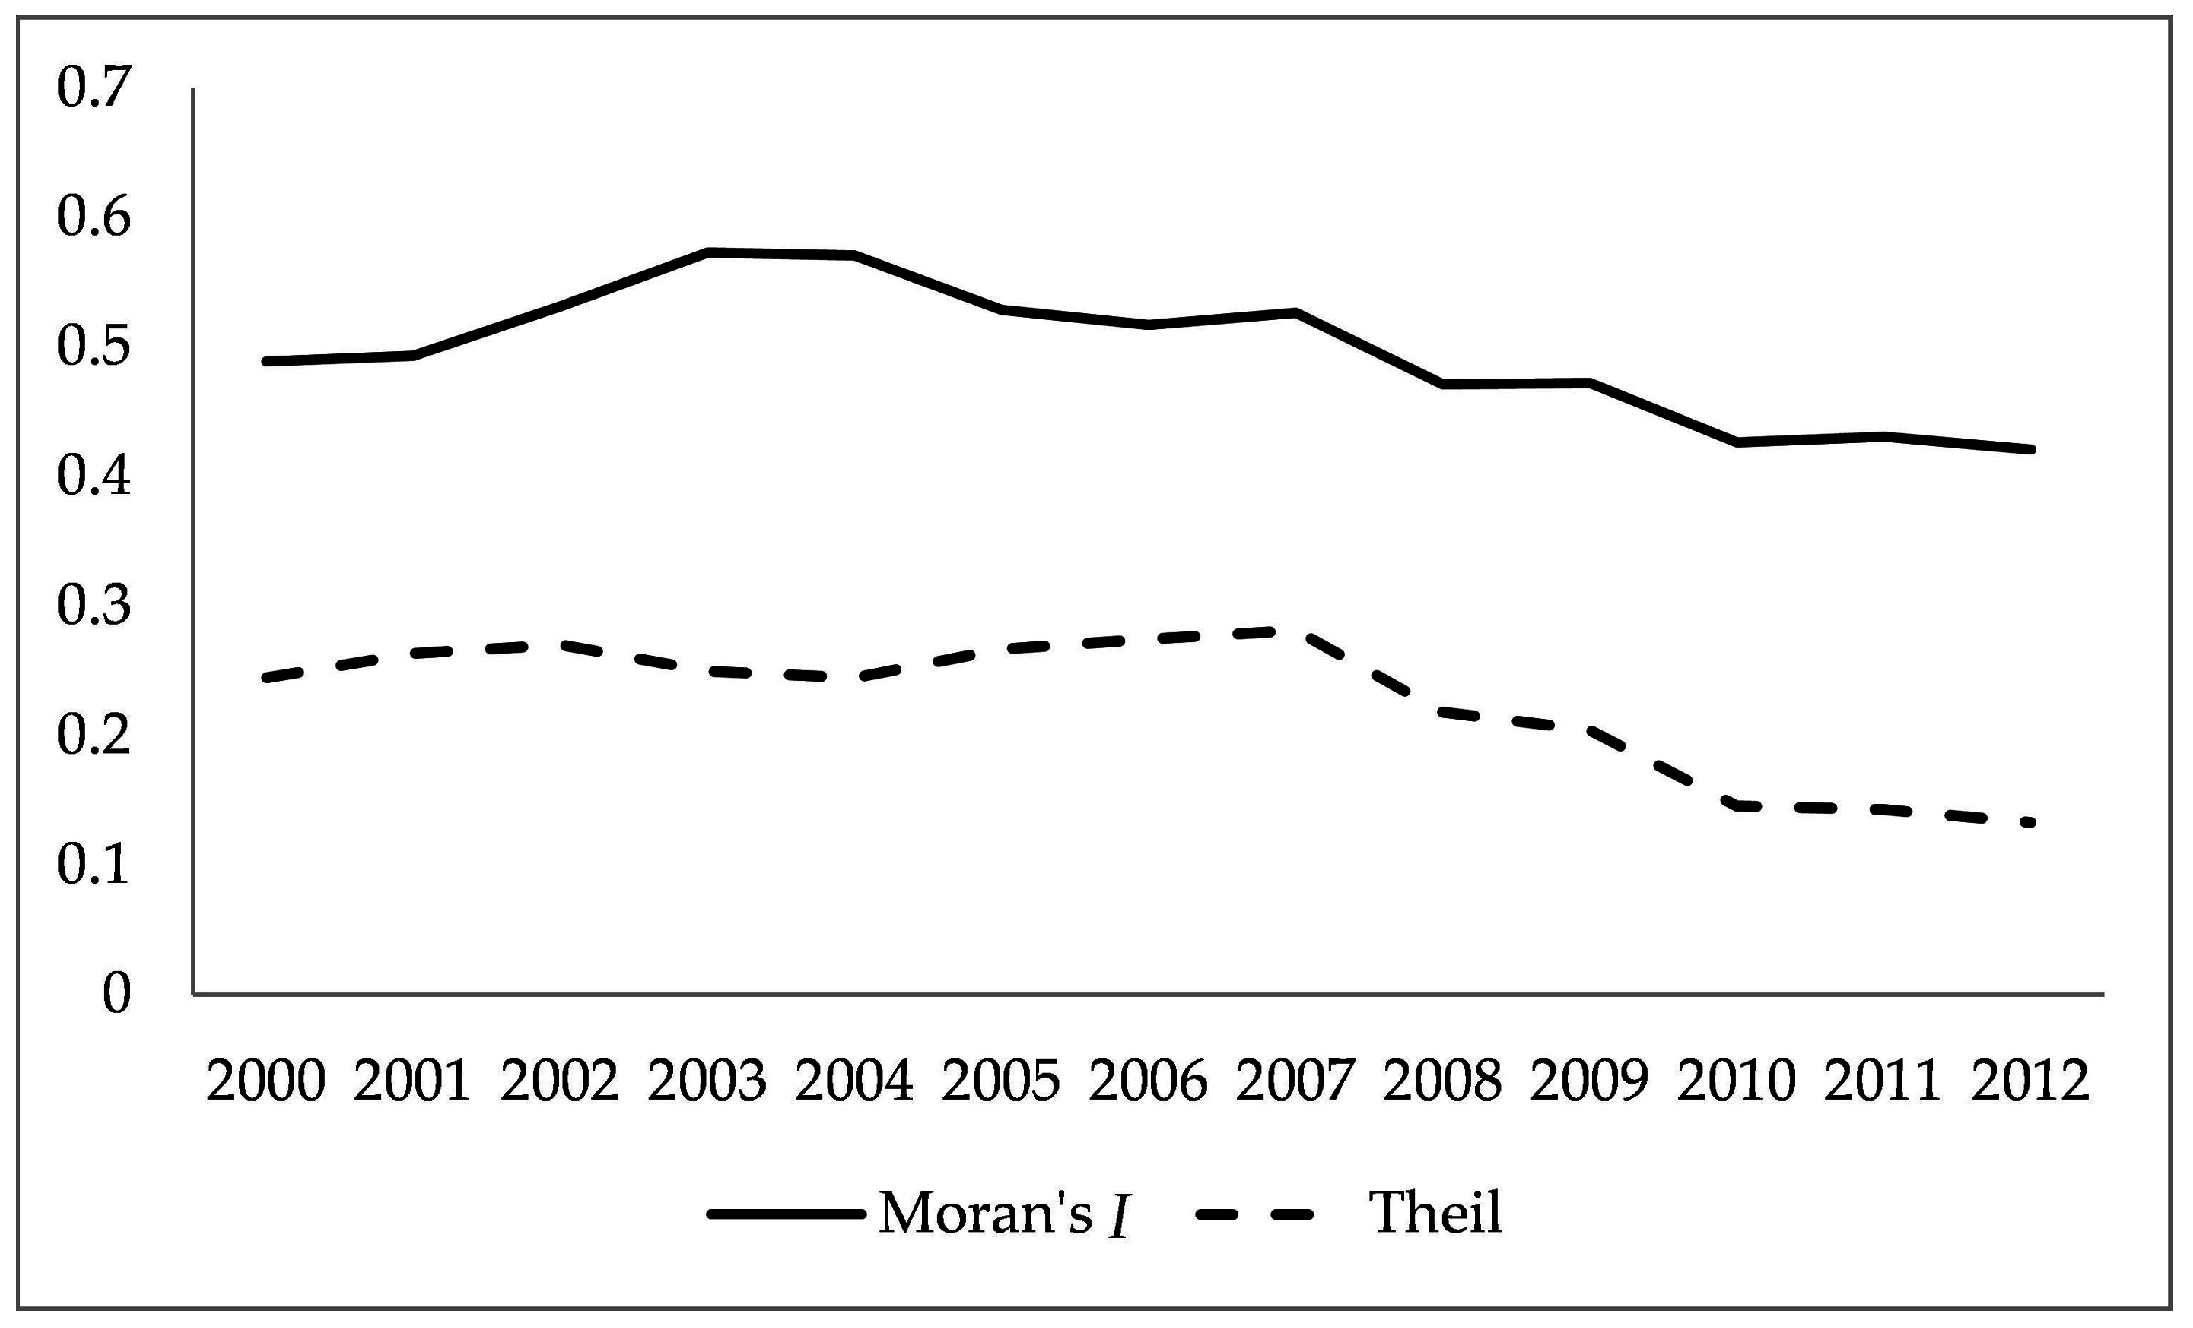
Based on the above analysis, inequality at the county scale was the most significant factor in regional inequality in Guizhou Province, and so, we analyzed the regional disparity with the county-scale data. To further understand the dynamics of regional inequality, we computed the global Moran’s I to explore the spatial-temporal correlation and the geographical concentration of economic development in Guizhou Province. The results of global Moran’s I were all significant at the 0.01 level. As Figure 4 shows, the values of global Moran’s I were positive, which indicates a positive spatial autocorrelation of per capita GDP in Guizhou Province. The values increased from 0.489 in 2000 to 0.573 in 2003 and decreased after 2003. This result implies that the spatial autocorrelation of regional inequality was enhanced before 2003 and showed a weakening trend after 2003.
During the first half of the study period, the Theil index of regional inequalities at the county scale rose, and the values of the global Moran’s I increased at the same time. This reflects the fact that enhancement of the spatial agglomeration of regional economic development in Guizhou Province led, to some extent, to a widening of regional inequality. An opposite result was found during the latter half of the study period. When considering spatial independence, even though the global Moran’s I of development inequality is not sensitive to the fluctuation over specific time periods, it still reflects a downward trend in development disparity at the county scale in Guizhou Province.
We also introduced the local Moran’s I into the study to get a deeper understanding of the spatial relationship. As illustrated in 
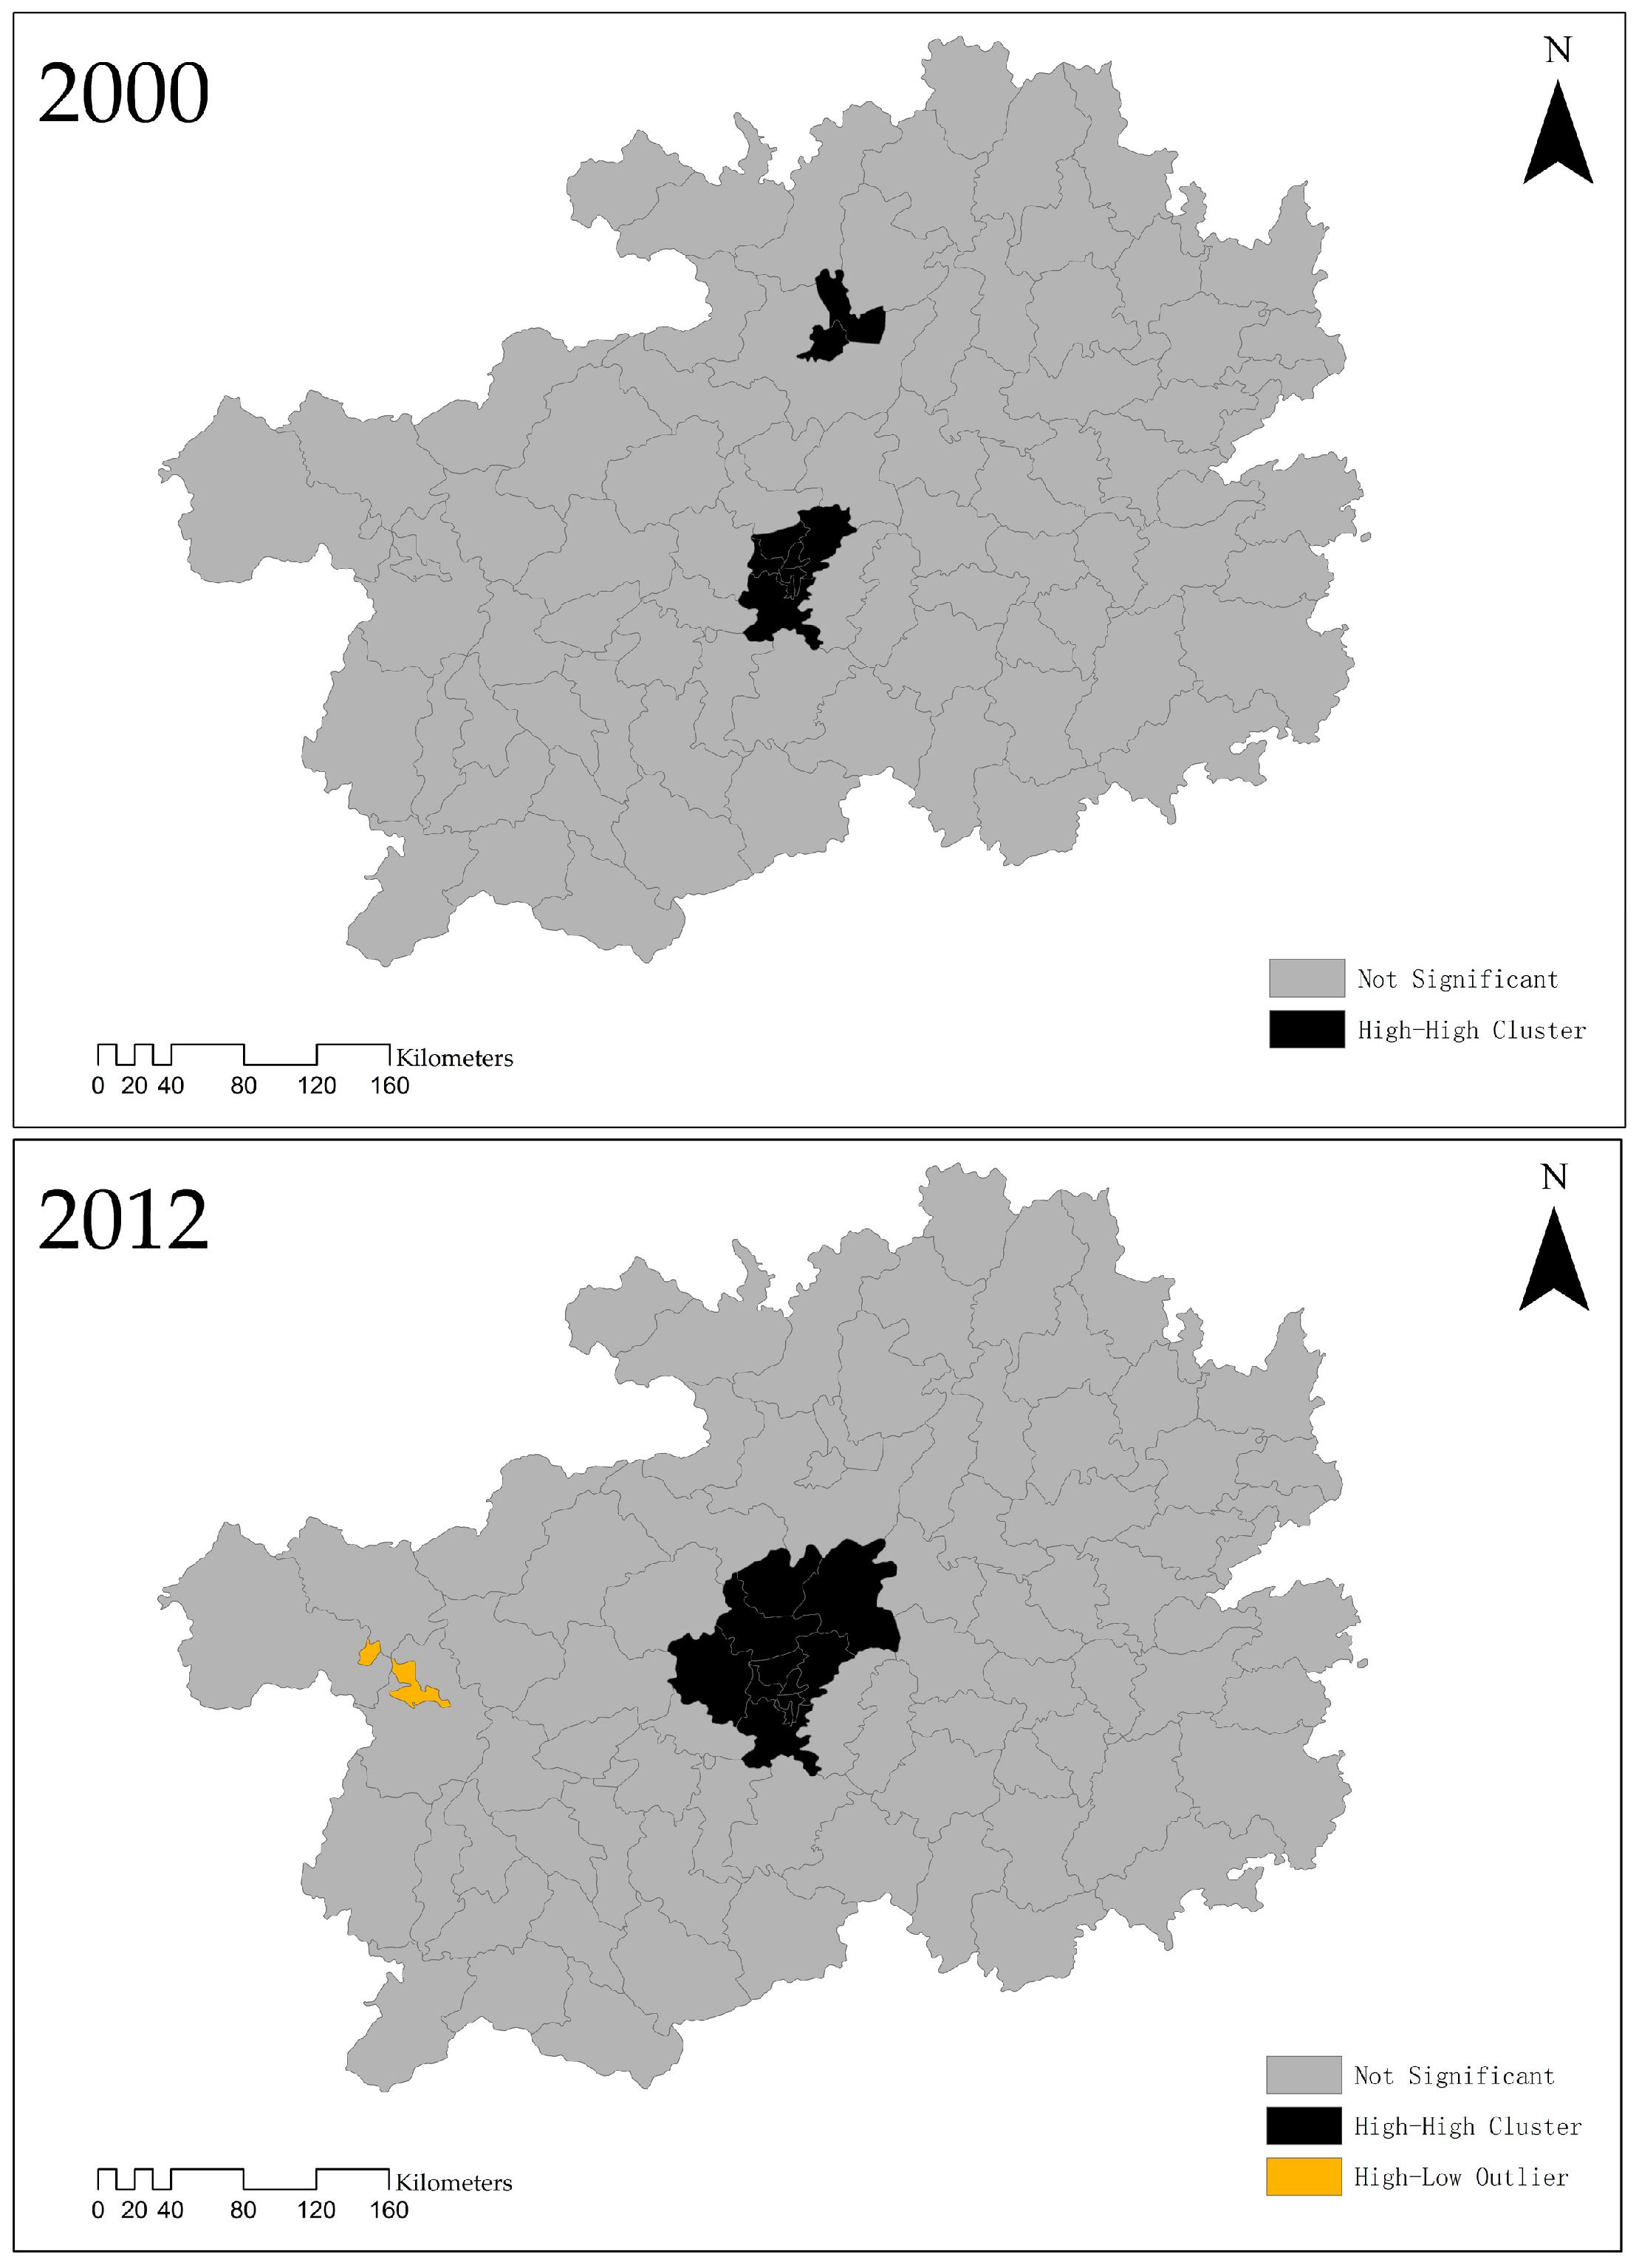
Figure 5, local spatial agglomeration at the county level of per capita GDP relates mainly to the high-high agglomeration type and is mostly distributed in Guiyang City. There was only a high-high agglomeration type in 2000, which was located mainly in the Huaxi, Xiaohe, Nanming, Yunyan, Wudang and Baiyun districts of Guiyang City and the Huichuan and Honghuagang districts of Zunyi City. In 2012, the high-high agglomeration type was distributed mainly throughout the whole of Guiyang City (Huaxi, Yunyan, Xiaohe, Nanming, Wudang and Baiyun districts, Xiuwen, Kaiyang and Xifeng counties and Qingzhen City), and the newly-added high-low agglomeration type was located in Liupanshui City. The center of Zunyi City was removed from the high-high agglomeration area, and its agglomeration effect was weakened.
The municipal district of Guiyang had been the most obvious area for regional economic agglomeration effects, which spread outwards from the center. Liupanshui showed negative spatial autocorrelation in 2012 and indicated a situation of local spatial differentiation. Zhongshan District belongs to the high-low agglomeration type, which meant that there was a polarization effect of per capita GDP in Zhongshan District. By comparing the LISA of the county-level per capita GDP in Guizhou Province between 2000 and 2012, the spatial agglomeration displayed an increasing trend and gradually showed a local spatial differentiation, which provided an explanation for the downward trend in the global Moran’s I.
The regional economic development of Guizhou Province presents the characteristics of spatial agglomeration and spatial connection, which first increased and then decreased during the study period in the global spatial autocorrelation analysis. From the local spatial autocorrelation, we can find that the high-high agglomeration type appeared in the regional economy of Guizhou Province, and its scope was distributed throughout Guiyang City and expanded over time. Polarization effects occurred in Liupanshui City, while the spatial convergence of regional economic development in Guizhou Province increased. The enhancement in spatial concentration tallied with the upward trend of global Moran’s I during the first half of the study period, and the downward tendency in the second half of the period was caused mainly by local spatial differentiation.

4.3. Changing Spatial Patterns of Development and Spatial Dependence of Dynamics

Markov chain analysis provides further details for the dynamics of regional inequality in Guizhou Province. Referring to the World Bank regional economic classifications and standards, we divided Guizhou Province into four classes according to per capita GDP: (1) Poor class: per capita GDP was lower than the 50% average of Guizhou Province; (2) Less developed class: per capita GDP was 50%–100% of the average for Guizhou Province; (3) Developed class: per capita GDP was 100%–150% of the average for Guizhou Province; (4) Rich class: per capita GDP was higher than 150% of the average for Guizhou Province. The poor and less developed classes were classified, respectively, as periphery and semi-periphery regions, which belonged to the underdeveloped areas. The developed and rich classes were classified, respectively, as semi-core and core regions, which belonged to the rich areas.
We calculated the transition probability matrices over the period between 2000 and 2012, as well as in the two sub-periods: 2000–2006 (the 10th Five-Year Plan period) and 2006–2012 (the 11th Five-Year Plan period). China implemented the WDP in 1999, planning to lay a solid foundation during the 10th Five-Year Plan period and make breakthroughs during the 11th Five-Year Plan period. The interval between the 10th Five-Year Plan and the 11th Five-Year Plan for the National Economy and Social Development of China is the year 2006. The selection of this interval is mainly to test the effectiveness of the implementation of the policy while exploring the spatial characteristics of the regional economic inequality.
The results of Markov chain analysis are shown in Table 4. The diagonal elements in the table represent the probability that the area keeps its original state, and non-diagonal elements represent the probability that different area types transfer. From an overall perspective, the transition of regional economy in Guizhou Province shows the characteristics described in the following paragraph.
First, all of the diagonal elements are larger than the non-diagonal elements in three different periods of the Markov transition probability matrix, which means that the probability of keeping the original type for a county is larger than that of transferring into other classes during the study period. This implies that the regional economy in Guizhou Province has structural stability and that regional inequality shows the characteristics of path dependence.
Second, the frequency of the underdeveloped areas is much higher than that of the rich areas, and the elements far away from the diagonal are zero, which indicates that cross-class movement did not exist and there was no jumping development area in Guizhou Province. This result is different from that of Guangxi Zhuang Autonomous Region and, thus, reflects the fact that spatial transitions in different regions have different characteristics.
Third, the probability of moving upward from underdeveloped areas was 16%, and that of remaining in the same class was up to 84% during the entire study period. The probability of moving downward from rich areas was 11.1%, and that of remaining in the same class was up to 88.9%. This implies that “club convergence” in the rich group was more obvious than in the underdeveloped region.
Finally, the transitions of per capita GDP types in Guizhou Province showed different characteristics in the two periods. The frequencies of both poor and developed classes reduced, and those of both less-developed and rich classes increased in the period of 2006–2012. The probability of ascending into a richer class from the underdeveloped areas was up to 9.2%, while that of falling into a poorer class from the rich areas was 9.5% in the period of 2000–2006. In contrast, the probability of moving upward from the underdeveloped areas increased substantially to 28.6%, while that of moving downward from the rich areas increased slightly to 13.5% in the period of 2006–2012. This indicates that ‘‘club convergence” in Guizhou Province was more pronounced for the period of 2000–2006 when the underdeveloped counties underwent improved development.
From the viewpoint of space, rich regions were distributed mainly in the middle region of Guizhou Province and the municipal districts of other cities, except Bijie City. The underdeveloped areas were located mainly in the external ring surrounding the core zone, and the ring-like distribution of spatial structure reflected the large-area spatial concentration of poverty in Guizhou Province.
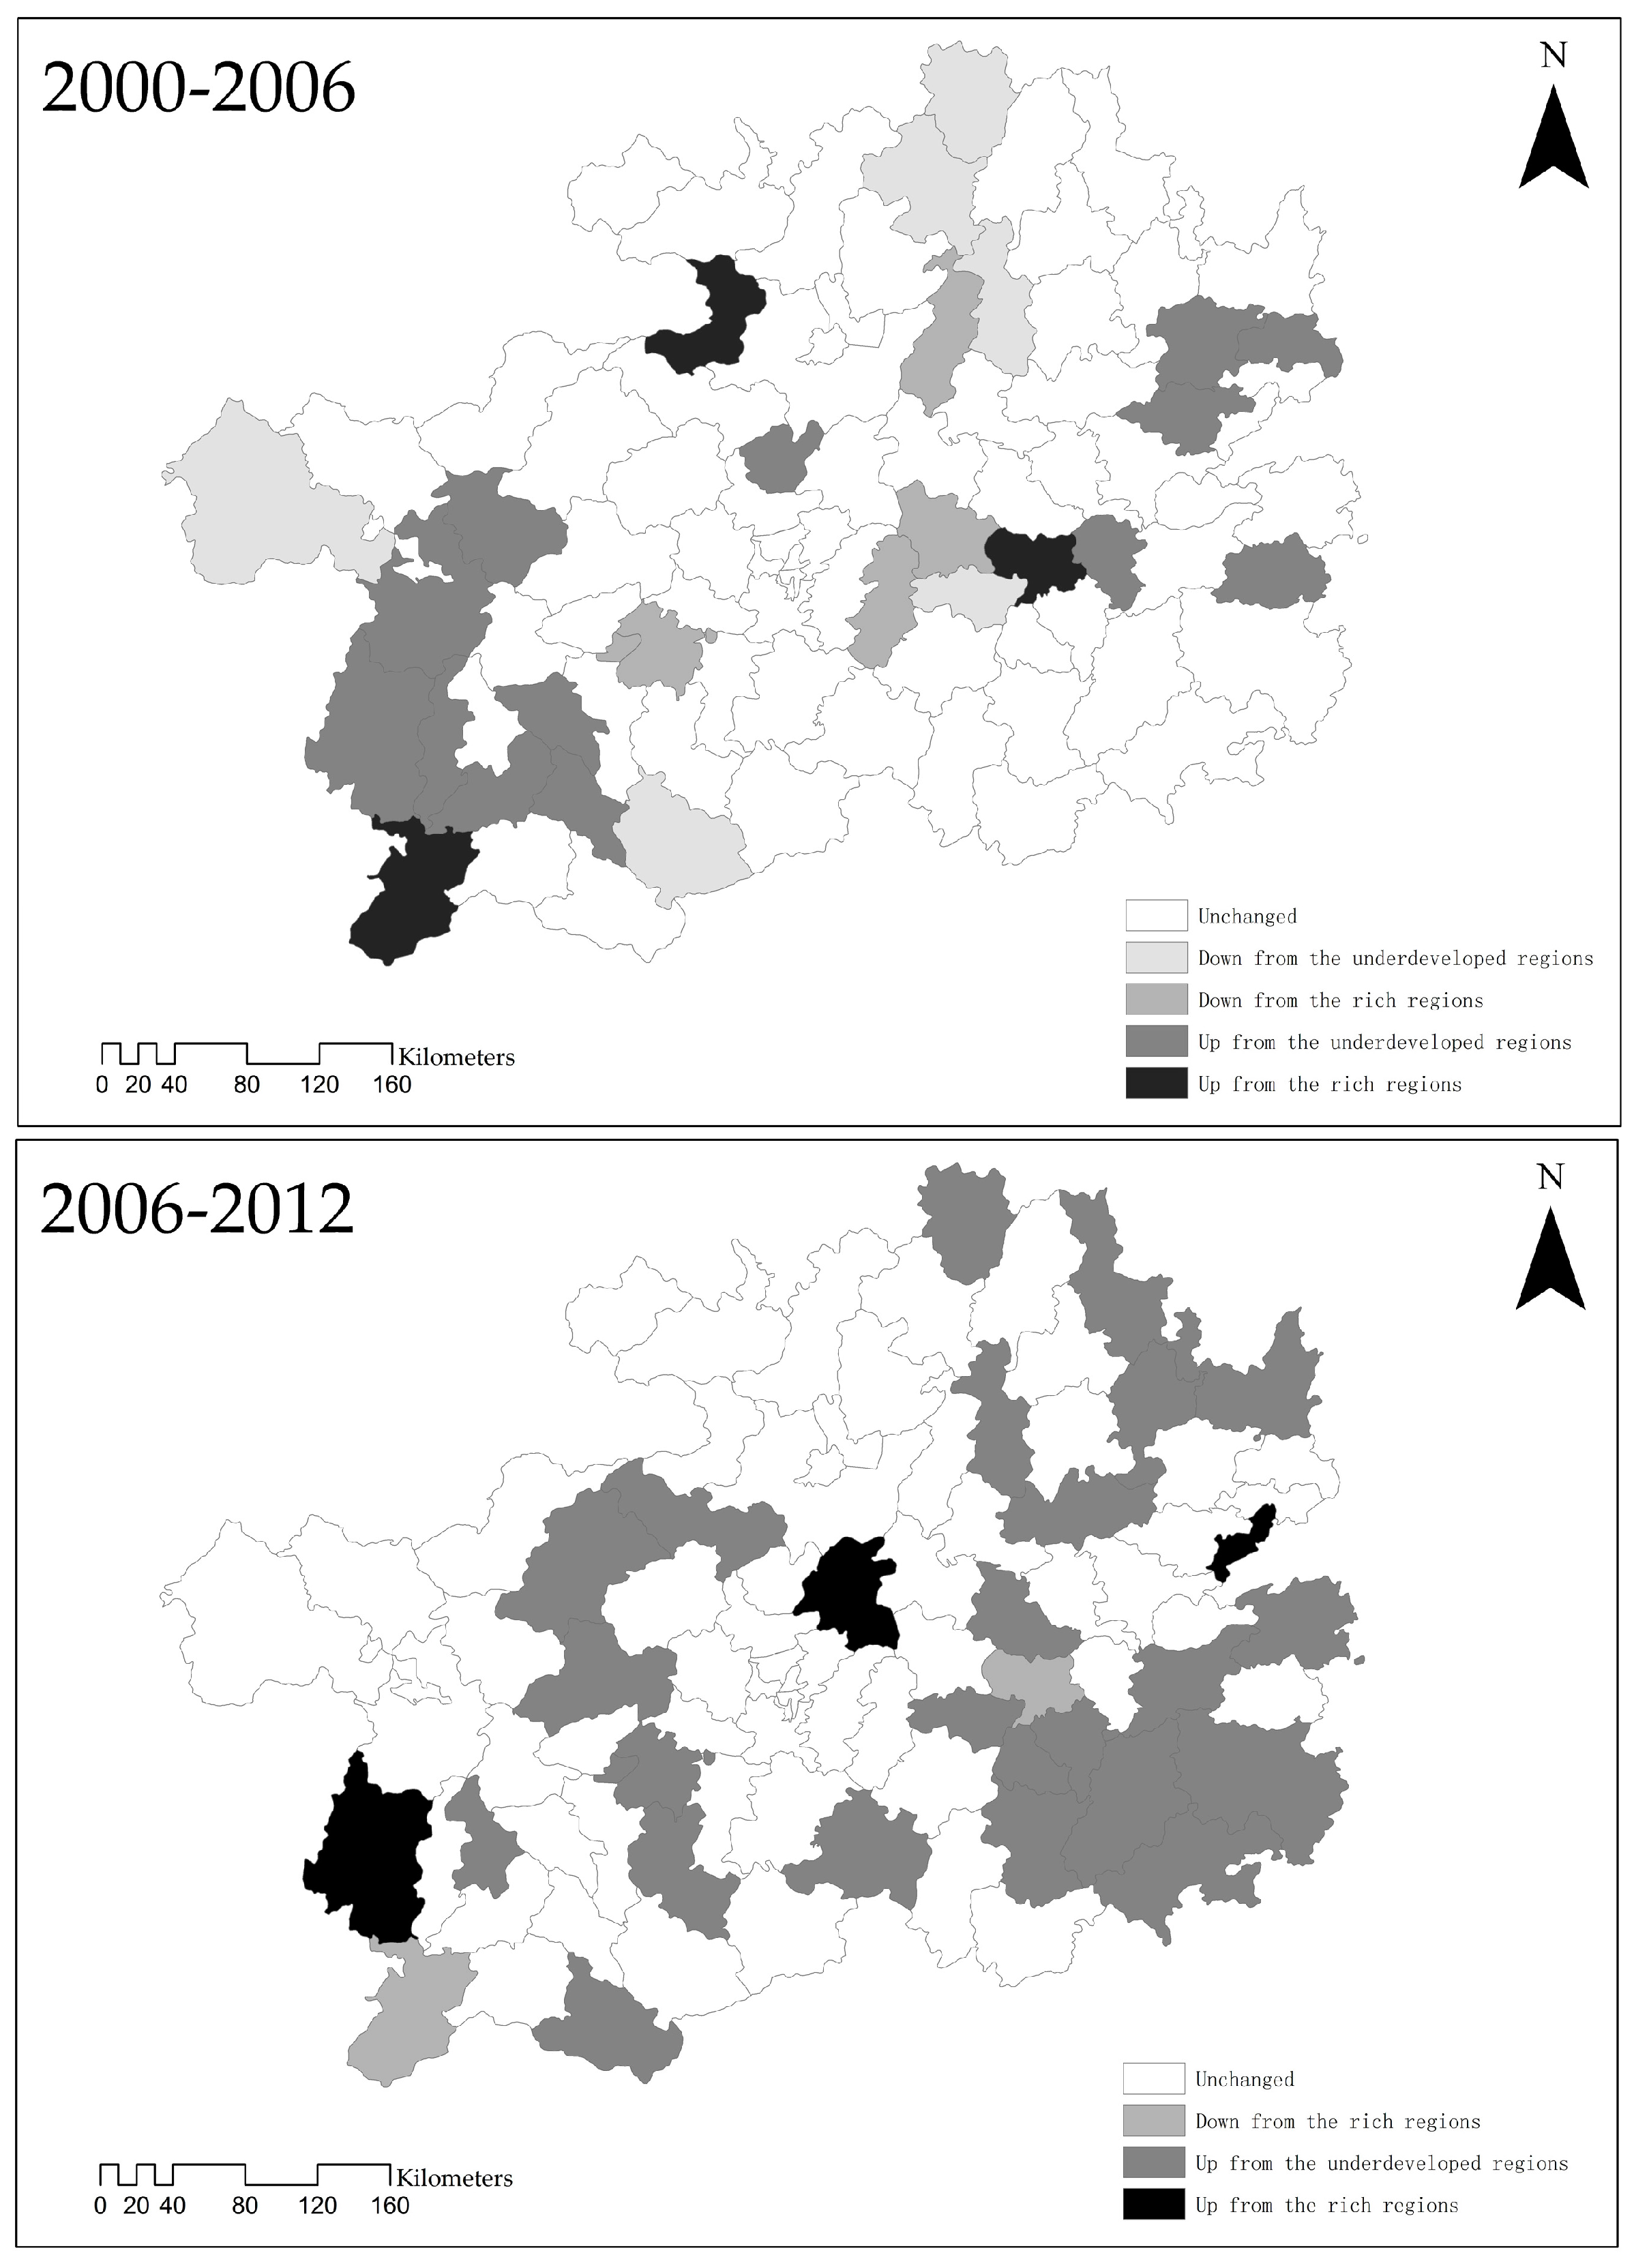
With respect to upward shift, regions in which it was possible to move upward to the richer type were concentrated mostly in the central urban area of the prefecture-level city, which were distributed mainly in the east and west regions of Guizhou Province in the period of 2000–2006. There were contiguous and annular underdeveloped areas moving upward between 2006 and 2012 (Figure 6).
The downward shift in spatial distribution was scattered in the period of 2000–2006, and only the phenomenon of moving downward to the developed class appeared in Xingyi City and Kaili City; there was no situation of transferring down to the underdeveloped areas. The regions of poor class were substantially reduced, and those of the less-developed class were greatly increased in the period of 2006–2012. This is in accord with the Markov transition probability matrix described above. Most regions of Guizhou Province are integrated into the contiguous poor areas of national poverty alleviation and development. The upward shift of contiguous poor areas is closely related to national poverty alleviation policies. The social development report for Guizhou Province (2013) also points out that the province invested special financial funds of more than six billion Yuan, and the incidence of poverty declined from 23.9% down to 14.9% since the implementation of the 11th Five-Year plan for the national economy and social development.
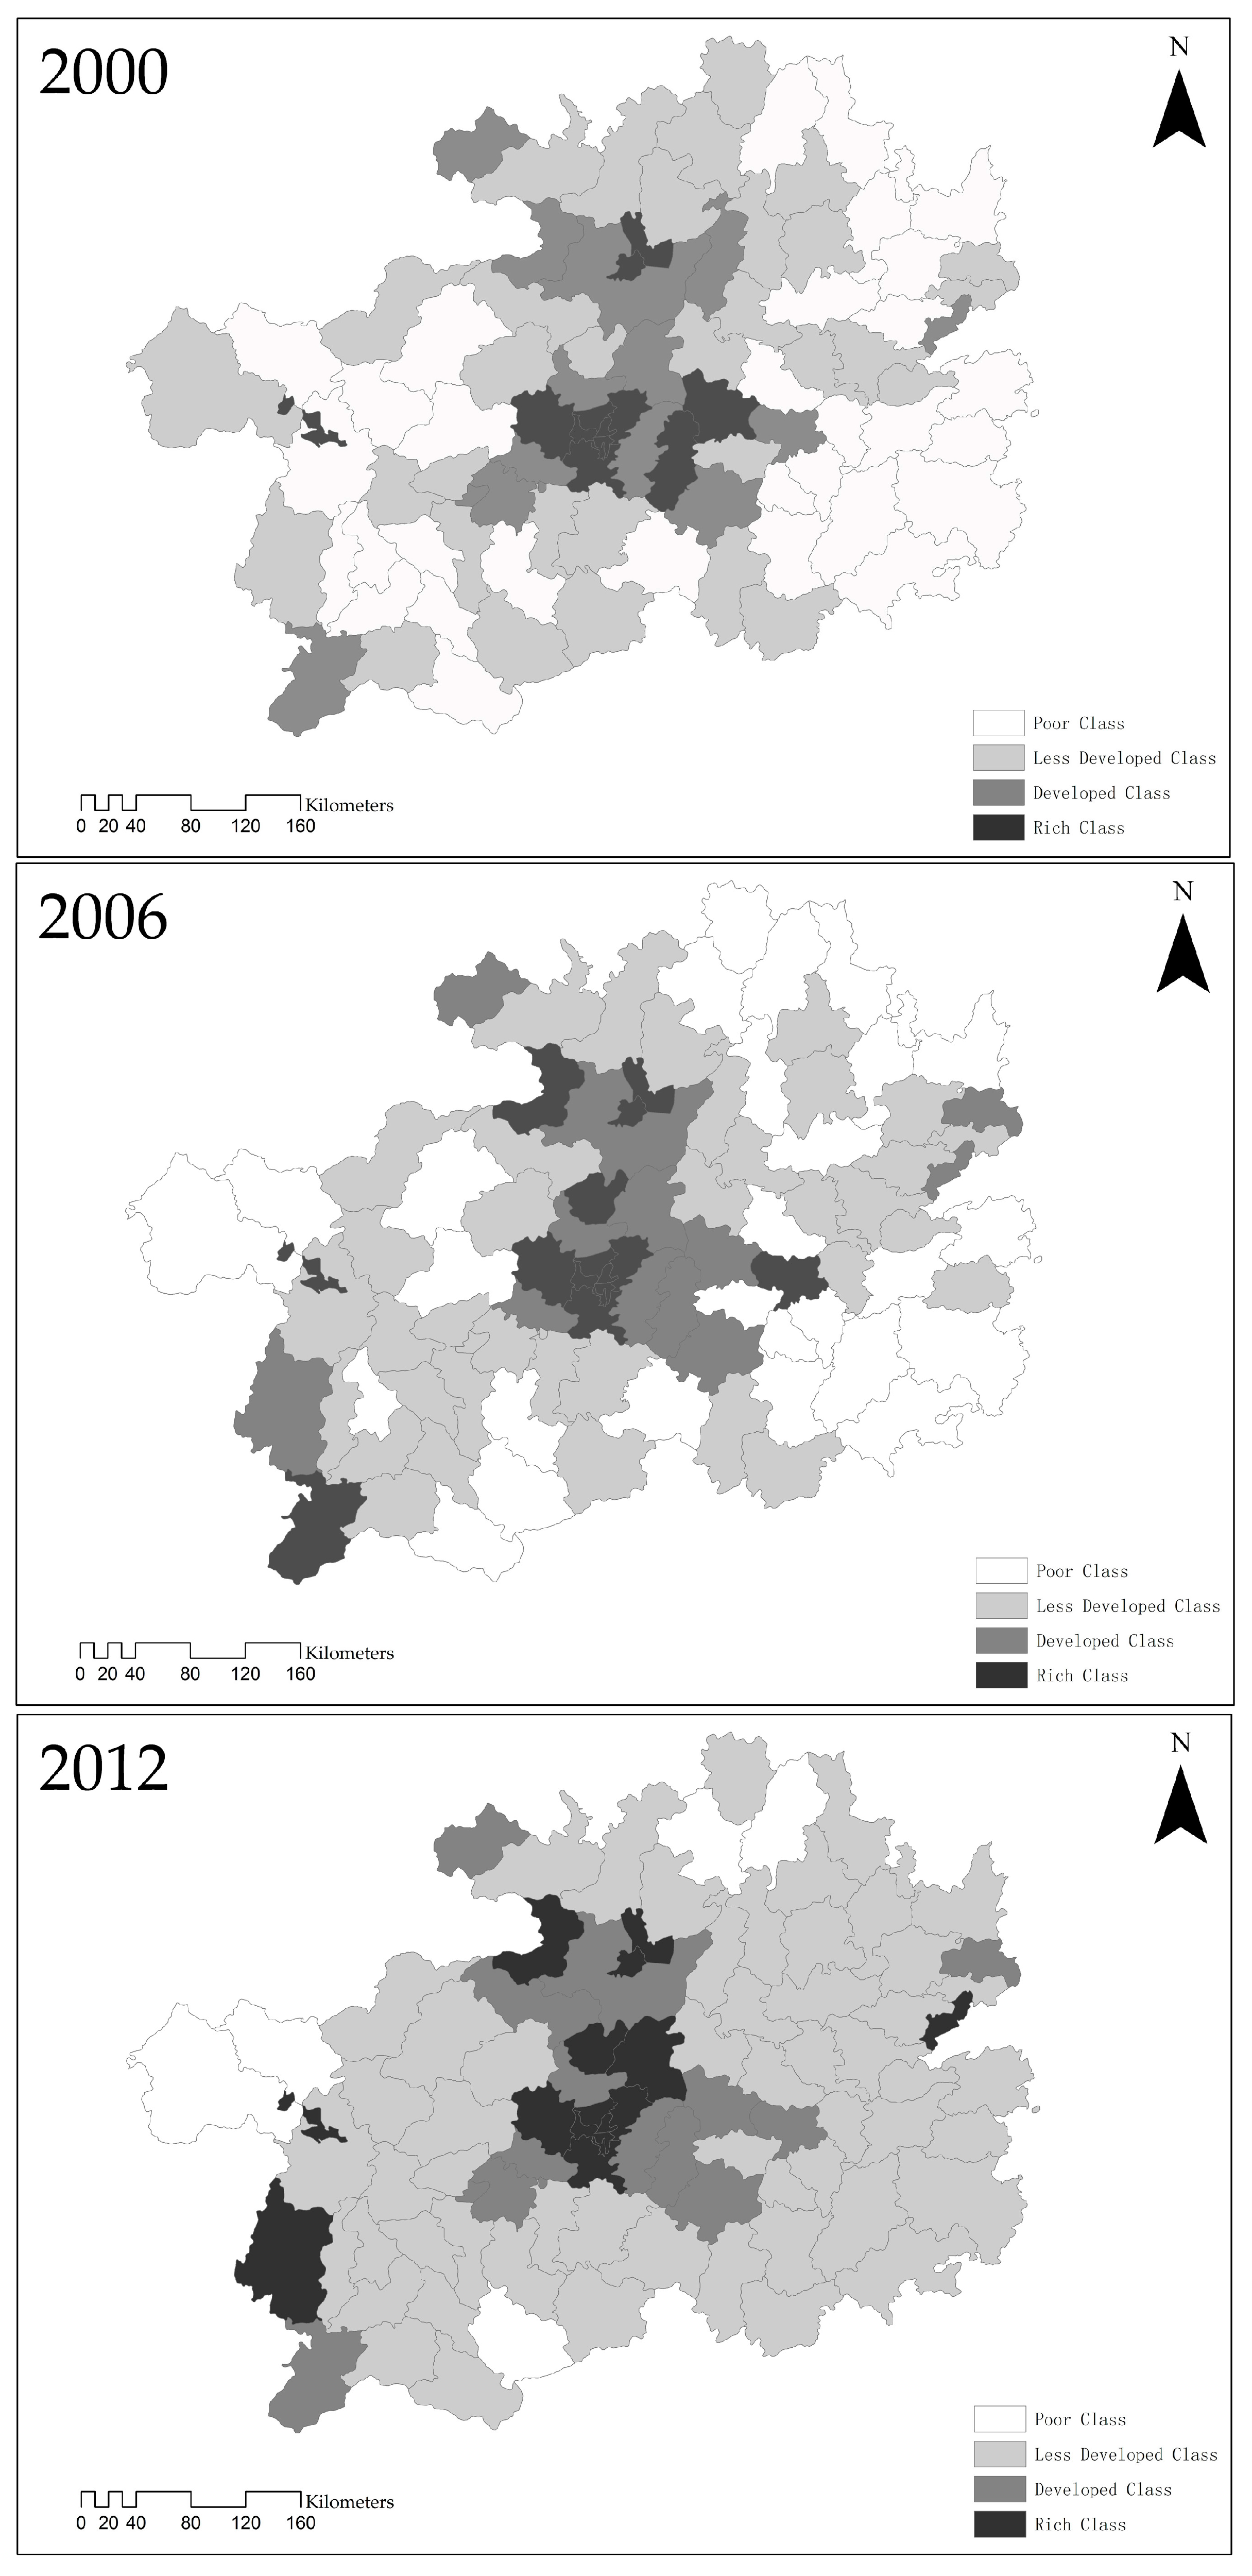
Comparing the spatial distribution of county-level per capita GDP in Guizhou Province in 2000, 2006 and 2012, a degree of economic spatial agglomeration gradually formed in the province with Guiyang City at its core (Figure 7). The regions of the rich type spread from Guiyang City to the surrounding areas with a scattered distribution. The core area in central Guizhou exhibited spatial concentration because of the growth effect.
The rich areas of Guizhou Province were, respectively, Tongren City, Bijiang District and Yuping Dong Autonomous County in the east and Liupanshui City, Zhongshan District, Pan County and Xingyi City in the west. The east rich areas of Guizhou Province are located in the Hunan-Guizhou economic corridor and along the Hunan-Guizhou extended railway line. As a result, Yuping Dong Autonomous County plays an important role in commodity distribution. The west rich areas of Guizhou Province have abundant energy and mineral resources, with obvious superiority over the east rich areas of Guizhou Province represented by the coal resources in Pan County. Xingyi and Pan counties are situated in the integration area of Yunnan, Guizhou and Guangxi provinces with advantages in location, which to some extent, have promoted the formation of a growth pole in the east and west rich areas of Guizhou Province.

4.4. Core-Periphery Structure of the Underlying Mechanism of Regional Inequality

The analyses above show the scale effects and core-periphery structure of regional development in Guizhou Province, and regional inequality is closely related to the time variables. The spatial multilevel regression model, incorporating industrialization, marketization, decentralization, investment level variables and two dummy variables, was applied to reveal the dynamic mechanism of regional inequality in the province. In this regression analysis, the dependent variable is per capita GDP in each county that belongs to the core-periphery continuum defined by the Markov chains at each year.
Table 5 shows a well-fitted one-level model, which can explain 65.3% of the total variance of county-level per capita GDP; and the F value is significant, which indicates that all of the explanatory variables have significant effects on per capita GDP. The variance inflation factor (VIF) of each variable is less than five, and therefore, the model has no multicollinearity problem [11,12].
The F value is significant and illustrates that all of the explanatory variables have significant effects on per capita GDP; the variance inflation factor (VIF) of the explanatory variables is less than 5, and thus, the model has no multicollinearity problem.
The likelihood ratio test is used to compare two models when fitting the same set of data in different nested models. As the data in Table 6 show, the significances of the deviation from the one-level model to the two-level model (p < 0.001) and from the two-level model to the three-level model (p < 0.001) decrease, which implies that regional inequality in Guizhou Province is associated with the core-periphery structure and the time variable.
Industrialization exhibited great importance in the three-level regression model, which suggests that industrialization is one of the main driving factors of regional disparity in Guizhou Province. Regional inequality decreased because east and west rich areas and several periphery areas experienced increased development. This indicates that industrial development strategies in Guizhou Province resulted in improvements in the industrialization level of underdeveloped areas. In addition, the implementation of WDP promoted the development of industrialization in Guizhou Province. Jinsha, Zhijin and Dafang counties sped up the construction of hydroelectric power plants, as well as the development of coal resources and developed related supporting industries as a result of the opportunities afforded by China’s West-East Electricity Transfer Project. The local economy achieved increased development, which reduced regional inequality in Guizhou Province to a certain extent.
Decentralization includes the process of delegating power, which has helped inspire the creative ability of the market to generate a new impetus for local economic development. Streamlining administration and delegating power can effectively improve the degree of marketization, allow the market to play a more important regulatory role in economic development and promote balanced regional development. Fiscal decentralization stimulates local governments to actively engage in local economic development. Local governments can then finance infrastructure development and public works to promote economic growth and attract investment as a result of changes in fiscal capacity. This process, however, often results in greater development of the already-rich areas to the detriment of the poor areas; polarized effects and Matthew effects coexist. Decentralization also reinforces local governments’ reliance on local revenue, which encourages local protectionism and weakens the ability of local governments to redistribute resources equitably [11].
Decentralization in the first-level and second-level models was particularly important, but became less important after the addition of the time level. This result shows that decentralization partly made an impact on regional gaps, but was not as important as we thought over the entire study period. In other words, the government played a regulatory role in adjusting the balance of resource utilization and overcame the polarization effect and local protectionism. Local financial revenue can be compensated through transfer payments, because most of the poor areas are ethnic districts that have special preferential policies. WDP and national poverty alleviation policies focus on underdeveloped areas, which encourages local governments to engage in local economic development and, thus, affect the regional inequality in Guizhou Province. However, the importance of decentralization seemed to be overemphasized, and it was quite weaker compared to other variables. The power of local government is not strong enough.
Investment level plays an important role in regional inequality in Guizhou Province. Economic development in Guizhou Province has largely depended on investment level, which in the one-level and two-level models exhibited a significant negative correlation, indicating that it had an important effect on regional inequality and promoted a core-periphery structure in the province. Guizhou Province is in the middle of an investment-driven period, so that fixed asset investment is an important driving force for economic growth. The uneven distribution of fixed asset investment that is concentrated in Guiyang City and Zunyi City became an important reason for expanding the regional gap [11]. Investment level in the first-level and second-level models did not show a notable effect on the regional development in Guizhou Province. With the addition of the time variable, investment level showed a more significant positive correlation to regional gap in the three-level model. Investment level actually influenced the regional gaps in Guizhou Province over the entire study period. As shown in Table 6, the uneven distribution of investment patterns still exists, while also indicating that the benefit brought about by investment improved and boosted economic development in the underdeveloped areas during the study period. Therefore, we can get a deeper understanding of the mechanisms involved in regional disparity with the multilevel regression models from the above.
Consistent significance in the multilevel model demonstrates that marketization had a great impact on regional inequality in Guizhou Province. Marketization in the first-level and second-level models had a relatively important effect on the regional inequality in Guizhou Province. The three-level model demonstrated that marketization has indeed played a significant part in narrowing regional inequality, which implies that the development of the non-public ownership economy there has achieved some useful results. A good example is the supportive policy of encouraging the development of the self-employed economy in Guizhou Province, combined with WDP, and the proportion of the added value of the non-publicly-owned economy has increased as a result.
The variables of topography and the urban-rural divide are not dynamic independent variables. The results of these two variables can explain their influence on regional inequality and interpret the pattern of regional economic development, but they are unable to explain the evolution of regional disparity in Guizhou Province. From the results, we can find that topography and the urban-rural divide both exerted influences on regional development, but were weaker than other variables, such as industrialization, which are also significant factors for the formation of the core-periphery structure. Counties in which mountain areas are less than 50% are distributed mainly in the hinterland of central Guizhou and its adjacent regions, which provides good natural conditions for economic development and promotes the formation of regional disparity patterns in the province as a whole. The urban-rural dual structure makes a difference to the regional disparity patterns in Guizhou Province [35]. Most of the urban areas are located in the regions containing municipal governments and their adjacent regions. Moreover, the majority of the urban areas are distributed in Guiyang City, and the rural areas are located mainly in the periphery regions.

5. Discussion and Conclusions

5.1. Discussion

Globalization, decentralization and marketization are three basic processes to be considered in analyzing the phenomenon of regional inequality. The Guizhou Province case study, however, did not consider globalization. The level of development and the degree of opening up of Guizhou Province are both the lowest for any province in China. Since the advent of economic reform and the opening up of Chinese society, actual utilization of foreign capital increased year on year. However, the actual utilization of foreign capital in 2013 was only US$1.57 billion, and the foreign investment economy accounted for only 0.4% of the entire social fixed asset investment. Because the degree of export-orientation is low, the effect of globalization on economic development is limited.
At the same time, this study shows that decentralization had a relatively weak effect on regional inequality in Guizhou Province. The difference exists when compared with developed coastal regions like Guangdong and Zhejiang provinces. As for decentralization, 57% of the counties in Guizhou Province are undergoing national key poverty alleviation work. Revenues received by county governments are low and are hardly improved by national fiscal transfer payments to poor and ethnic minority areas. The regional economic policy of Guizhou Province mainly reflected the strategic direction of the central government, that is to say, it was a passive fiscal decentralization for the underdeveloped areas to some extent. Overall, the effects of the three basic processes of globalization and decentralization performance were not obvious in the economy of Guizhou Province. This is related to its economic development stage, pattern of ownership and the geographical location of Guizhou Province.
As for marketization, the state-owned economy is the major component of Guizhou Province’s economy. Calculated in accordance with gross industrial output value and industrial staff and workers, the proportions of the state-owned and state-controlled economy were as high as 53.3% and 55.8%, respectively, in 2013 and more than 20% higher than the national average. However, non-public economic growth accelerated under the economic reform and Guizhou’s non-public ownership economy had accounted for more than one-third of GDP, in particular the Guizhou non-public industrial economy, showing a strong momentum of development. Guizhou private capital had entered a stage of rapid expansion, as an important driving force for investment growth, which suggested that marketization has been an important driving force for regional development.
Industrialization is the main dynamic in narrowing regional inequality in Guizhou Province. Since the implementation of WDP, especially under the opportunity afforded by China’s West-East Electricity Transfer Project, both central government and the Guizhou provincial government have strengthened energy and mineral resources development in the coastal area of the Wujiang River, in the region of Liupanshui west of Panzhihua and in the coastal area north and south of the Pan River and the Red River and have formed competitive industries, including mining, washing of coal, mining and processing of non-metal ores and the production and supply of electric power and heat. Promoting the level of industrialization of undeveloped areas will reduce regional inequality in Guizhou Province to a certain degree. This is why this paper chose industrialization as an index.
This study has considered both urban and rural concepts under a multiscale and multi-mechanism framework. “Urban” refers to municipal districts and county-level cities, and “rural” refers to counties. In the view of Chinese researchers, however, urban areas are settlements formed by the agglomeration of non-agricultural industries and non-agricultural populations, and rural areas are a general term of settlement where the basic economic activity of residents is agriculture. Therefore, rural areas in China refer to the vast region below the county level. Taking all counties as rural areas is inaccurate.
The topography of Guizhou Province is mainly mountains, and mountain areas account for 61.7% of the total land area of Guizhou Province. Terrain and traffic are key constraints constantly affecting regional development. Since the implementation of WDP, both central government and the Guizhou provincial government have speeded up the pace of the construction of highways and railways. Traffic conditions in the counties along the main expressways have improved considerably, and the effects on regional inequality remain to be seen.

5.2. Conclusions

This paper studied the scale effect and spatial-temporal evolution and dynamics of regional inequality in Guizhou Province between 2000 and 2012 under a multiscale and multi-mechanism analytical framework.
Scale effect analysis showed a downward trend in regional inequality in Guizhou Province, which is sensitive to scale and regional gap increases with the shrinking of the spatial scale.
Global autocorrelation analysis showed that economic development under the current county-level spatial agglomeration first increased then decreased between 2000 and 2012. Local autocorrelation analysis showed that high-high aggregate regions widened over time, but the space range was concentrated mainly in central counties of Guizhou Province. As spatial agglomeration increased, the polarization effect appeared in some regions, which is a spatial variation phenomenon.
Analysis of the Markov transition probability matrix for different periods showed that regional inequality at the county level possessed the characteristics of structural stability and path dependence, and no counties leapfrogged from poor to rich or from less developed to rich. Relative to undeveloped areas, the “club convergence” phenomenon of developed counties was more obvious.
Spatial multilevel regression analysis showed that industrialization, marketization and investment level are the main factors affecting regional inequality in Guizhou Province. When the variable of time was considered, the effect of decentralization on regional inequality was relatively weak. Investment level expanded regional inequality and promoted the formation of a core-periphery structure and weakened regional inequality in Guizhou Province since the 11th Five-Year Plan. Moreover, topography and the urban-rural divide were key factors in the formation of the regional distribution and the core-periphery structure of Guizhou Province.

Acknowledgments

The authors acknowledge the support of the National Natural Science Foundation of China (Project No. 41271146, No. 41301112), the Science and Technology Project of the Department of Education of Guangdong Province (Project No. 2013KJCX0006) and the Key Research Program of the Chinese Academy of Sciences (KZZD-EW-06).

Author Contributions

Wei Sun and Yutian Liang designed the research. Xiaona Lin and Lu Li analyzed the data. Wei Sun, Xiaona Lin and Yutian Liang wrote the paper. All authors read and approved the final manuscript.

Conflicts of Interest

The authors declare no conflict of interest.

References

  1. Cai, F. Is there a “Middle-income Trap”? Theories, experiences and relevance to China. China World Econ. 2012, 20, 49–61. [Google Scholar] [CrossRef]
  2. Agénor, P.; Canuto, O.; Jelenic, M. Avoiding Middle-Income Growth Traps. Econ. Premise 2012, 98, 1–7. [Google Scholar]
  3. Li, Y.R.; Wei, Y.H.D. The spatial-temporal hierarchy of regional inequality of China. Appl. Geogr. 2010, 30, 303–316. [Google Scholar] [CrossRef]
  4. Wei, Y.H.D. Multiscale and multimechanisms of regional inequality in China: Implications for regional policy. J. Contemp. China 2002, 11, 109–124. [Google Scholar] [CrossRef]
  5. Yu, D.; Wei, Y.H.D. Spatial data analysis of regional development in Greater Beijing, China, in a GIS environment. Pap. Reg. Sci. 2008, 87, 97–117. [Google Scholar] [CrossRef]
  6. Wei, Y.H.D.; Ye, X. Beyond convergence: Space, scale and regional inequality in China. Tijdschrift voor Economische en Sociale Geografie 2009, 100, 59–80. [Google Scholar] [CrossRef]
  7. Wei, Y.H.D.; Yu, D.; Chen, X. Scale, agglomeration, and regional inequality in provincial China. Tijdschrift voor Economische en Sociale Geografie 2011, 102, 406–425. [Google Scholar] [CrossRef]
  8. Wei, Y.H.D.; Fan, C.C. Regional inequality in China: A case study of Jiangsu Province. Prof. Geogr. 2000, 52, 455–469. [Google Scholar] [CrossRef]
  9. Ye, X.; Wei, Y.H.D. Geospatial analysis of regional development in China: The case of Zhejiang Province and the Wenzhou model. Eurasian Geogr. Econ. 2005, 46, 445–464. [Google Scholar] [CrossRef]
  10. Yue, W.; Zhang, Y.; Ye, X.; Cheng, Y.Q.; Leipnik, M.R. 2014 Dynamics of multi-scale intra-provincial regional inequality in Zhejiang, China. Sustainability 2014, 6, 5763–5784. [Google Scholar] [CrossRef]
  11. Liao, F.H.F.; Wei, Y.D. Dynamics, space, and regional inequality in provincial China: A case study of Guangdong Province. Appl. Geogr. 2012, 35, 71–83. [Google Scholar] [CrossRef]
  12. Liao, F.H.F.; Wei, Y.H.D. Space, scale, and regional inequality in provincial China: A spatial filtering approach. Appl. Geogr. 2015, 61, 94–104. [Google Scholar] [CrossRef]
  13. Fan, C.C.; Sun, M. Regional inequality in China, 1978–2006. Eurasian Geogr. Econ. 2008, 49, 1–18. [Google Scholar] [CrossRef]
  14. Wei, Y.H.D. Regional development in China: Transitional institutions, embedded globalization, and hybrid economies. Eurasian Geogr. Econ. 2007, 48, 16–36. [Google Scholar] [CrossRef]
  15. Barro, R.J.; Sala-i-Martin, X. Convergence. J. Political Econ. 1992, 100, 223–251. [Google Scholar] [CrossRef]
  16. Kuznets, S. Economic growth and income inequality. Am. Econ. Rev. 1955, 45, 1–28. [Google Scholar]
  17. Smith, N. Uneven Development: Nature, Captial and the Production of Space; Basil Blackwell: Oxford, UK, 1984. [Google Scholar]
  18. Alonso, W. Five bell shapes in development. Pap. Reg. Sci. 1980, 45, 5–16. [Google Scholar] [CrossRef]
  19. Friedmann, J. Regional Development Policy; MIT Press: Cambridge, MA, USA, 1996. [Google Scholar]
  20. Hirschman, A.O. The Strategy of Economic Development; Yale University Press: New Haven, NJ, USA, 1958. [Google Scholar]
  21. Williamson, G.J. Regional inequality and the process of national development: A description of the patterns. Econ. Dev. Cult. Chang. 1965, 13, 3–45. [Google Scholar] [CrossRef]
  22. Solow, R.M. A contribution to the theory of economic growth. Q. J. Econ. 1956, 70, 65–94. [Google Scholar] [CrossRef]
  23. Barro, J.R.; Sala-i-Martin, X. Convergence across states and regions. Brook. Pap. Econ. Activ. 1991, 22, 107–182. [Google Scholar] [CrossRef]
  24. Krugman, P. Geography and Trade; MIT Press: Cambridge, MA, USA, 1991. [Google Scholar]
  25. Wei, Y.H.D. Regional inequality in China. Prog. Hum. Geogr. 1999, 23, 49–59. [Google Scholar] [CrossRef]
  26. Yamamoto, D. Scales of regional income disparities in the USA, 1955–2003. J. Econ. Geogr. 2007, 8, 79–103. [Google Scholar] [CrossRef]
  27. Moellering, H.; Tobler, W. Geographical variances. Geogr. Anal. 1972, 4, 34–50. [Google Scholar] [CrossRef]
  28. Moran, P.A.P. Notes on continuous stochastic phenomena. Biometrika 1950, 37, 17–23. [Google Scholar] [CrossRef] [PubMed]
  29. Anselin, L. Local indicators of spatial association-LISA. Geogr. Anal. 1995, 272, 93–115. [Google Scholar] [CrossRef]
  30. Statistics Bureau of Guizhou Province; Guizhou Survey Corps of the National Bureau of Statistics of the People’s Republic of China. Guizhou Statistics Yearbook; China Statistics Press: Beijing, China, 2013. (In Chinese)
  31. National Bureau of Statics of the People’s Republic of China. China Statistics Yearbook; China Statistics Press: Beijing, China, 2013. (In Chinese)
  32. Statistics Bureau of Guizhou Province; Guizhou Survey Corps of the National Bureau of Statistics of the People’s Republic of China. Guizhou 60 Years; China Statistics Press: Beijing, China, 2009. (In Chinese)
  33. Statistics Bureau of Guizhou Province; Guizhou Survey Corps of the National Bureau of Statistics of the People’s Republic of China. Guizhou Reform 30 Years; China Statistics Press: Beijing, China, 2009. (In Chinese)
  34. The China Economic and Social Development Statistics Data Library from 2001–2013. Available online: http://tongji.cnki.net/kns55/brief/result.asxp (accessed on 20 July 2016). (In Chinese)
  35. Li, X.; Fan, S.G.; Luo, X.P.; Zhang, X.B. Community poverty and inequality in western China: A tale of three villages in Guizhou Province. China Econ. Rev. 2009, 20, 338–349. [Google Scholar]
Figure 1. Location and zoning in Guizhou Province.
Sustainability 08 01141 g001
Figure 2. Scale variance of regional inequality at different scales, 2000–2012.
Sustainability 08 01141 g002
Figure 3. Contribution of the scale variance of regional inequality at different scales, 2000–2012.
Sustainability 08 01141 g003
Figure 4. Global Moran’s I and Theil index of county-level per capita GDP, 2000–2012.
Sustainability 08 01141 g004
Figure 5. Local indicators of spatial association (LISA) of county-level per capita GDP in Guizhou Province in 2000 and 2012.
Sustainability 08 01141 g005
Figure 6. Spatial transition of county-level per capita GDP, 2000–2006 and 2006–2012.
Sustainability 08 01141 g006
Figure 7. Spatial distribution of county-level per capita GDP, 2000, 2006 and 2012.
Sustainability 08 01141 g007
Table 1. Development indicators of Guizhou Province, 2013. (Source: Guizhou Province Statistics Bureau in 2014.)
IndicatorGuizhou ProvinceProportion (China = 100)
Land area (million km2)0.181.8
Population (million)35.022.6
Employees (million)18.642.4
GDP (billion Yuan)800.681.4
Per capita GDP (Yuan)22,922.0053.8
Investment in fixed assets (billion Yuan)737.361.6
Per capita investment in fixed assets (Yuan)21,055.4061.5
Annual retail sales (billion Yuan)236.621.0
Per capita annual retail sales(Yuan)6756.7138.5
Local fiscal revenue (billion Yuan)120.641.7
Local fiscal expenditure (billion Yuan)308.272.6
Table 2. Components of the average variance estimation and scale variance in a three-level spatial regional system.
ScaleDegrees of FreedomAverage Variance EstimationScale Variance
Regional-level α I 1 S V α / ( I 1 ) i = 1 I ( X ¯ i X ) ¯ 2 / ( I 1 )
Municipal-level β i = 1 I ( J i 1 ) S V β / i = 1 I ( J i 1 ) i = 1 I j = 1 J i ( X ¯ i j X ¯ i ) 2 / i = 1 I ( J i 1 )
County-level γ i = 1 I j = 1 J i ( K i j 1 ) S V β / i = 1 I j = 1 J i ( K i j 1 ) i = 1 I j = 1 J i k = 1 K i j ( X ¯ i j k X ¯ i j ) 2 / i = 1 I ( J i 1 )
Notes: SV is the scale variance at each spatial scale, which is the value of the mean at different scales; i, j and kij are, respectively, the number of units at the α scale, the number of units at the β scale, which is included in unit i at the α scale, and the number of units at the γ scale, which is included in unit ij at the β scale.
Table 3. Markov transition probability matrix M.
ti/ti + 112k
1m11m12m1k
2m21m22m2k
kmk1mk2mkk
Table 4. Markov chain transitional matrices for county-level per capita GDP, 2000–2012.
Transition ProbabilityPoorLess DevelopedDevelopedRich
2000–2012
Poor (290)0.8620.1380.0000.000
Less developed (449)0.0310.9470.0220.000
Developed (157)0.0000.0450.8660.089
Rich (160)0.0000.0000.0690.931
Ergodic distribution
2000–2006
Poor (185)0.9350.0650.0000.000
Less developed (187)0.0430.9300.0270.000
Developed (88)0.0000.0450.8860.068
Rich (68)0.0000.0000.0590.941
Ergodic distribution
2006–2012
Poor (105)0.7330.2670.0000.000
Less developed (262)0.0230.9580.0190.000
Developed (69)0.0000.0430.8410.116
Rich (92)0.0000.0000.0760.924
Ergodic distribution
Table 5. Spatial multilevel regression model parameters.
Regression StatisticsVIF
R20.661Industrialization1.900
Adjusted R20.659Decentralization1.361
df6Marketization2.337
F368.868Investment2.243
F significance test0.000Topography1.262
Urban-rural divide1.486
Table 6. Multilevel dynamic mechanism analysis.
One-Level (County)Two-Level (County and Core-Periphery)Three-Level (County, Core-Periphery and Time)
CoefficientpCoefficientpCoefficientp
Industrialization0.3550.0140.2530.0170.1160.007
Decentralization0.4090.0420.4350.0390.0070.020
Marketization0.1420.0200.1160.0190.1240.012
Investment level−0.0450.014−0.0540.0130.0420.008
Topography0.0360.0160.0200.0140.0120.006
Urban-rural divide0.0760.0190.0180.0150.0340.007
−2log likelihood:−186.184 −315.431 −2421.163
Likelihood ratio test<0.001Likelihood ratio test<0.001
Notes: All of the selected variables were standardized.

