
Quantifying the City’s Green Area Potential Gain Using Remote Sensing Data


Abstract
:1. Introduction
2. Study Area and Materials
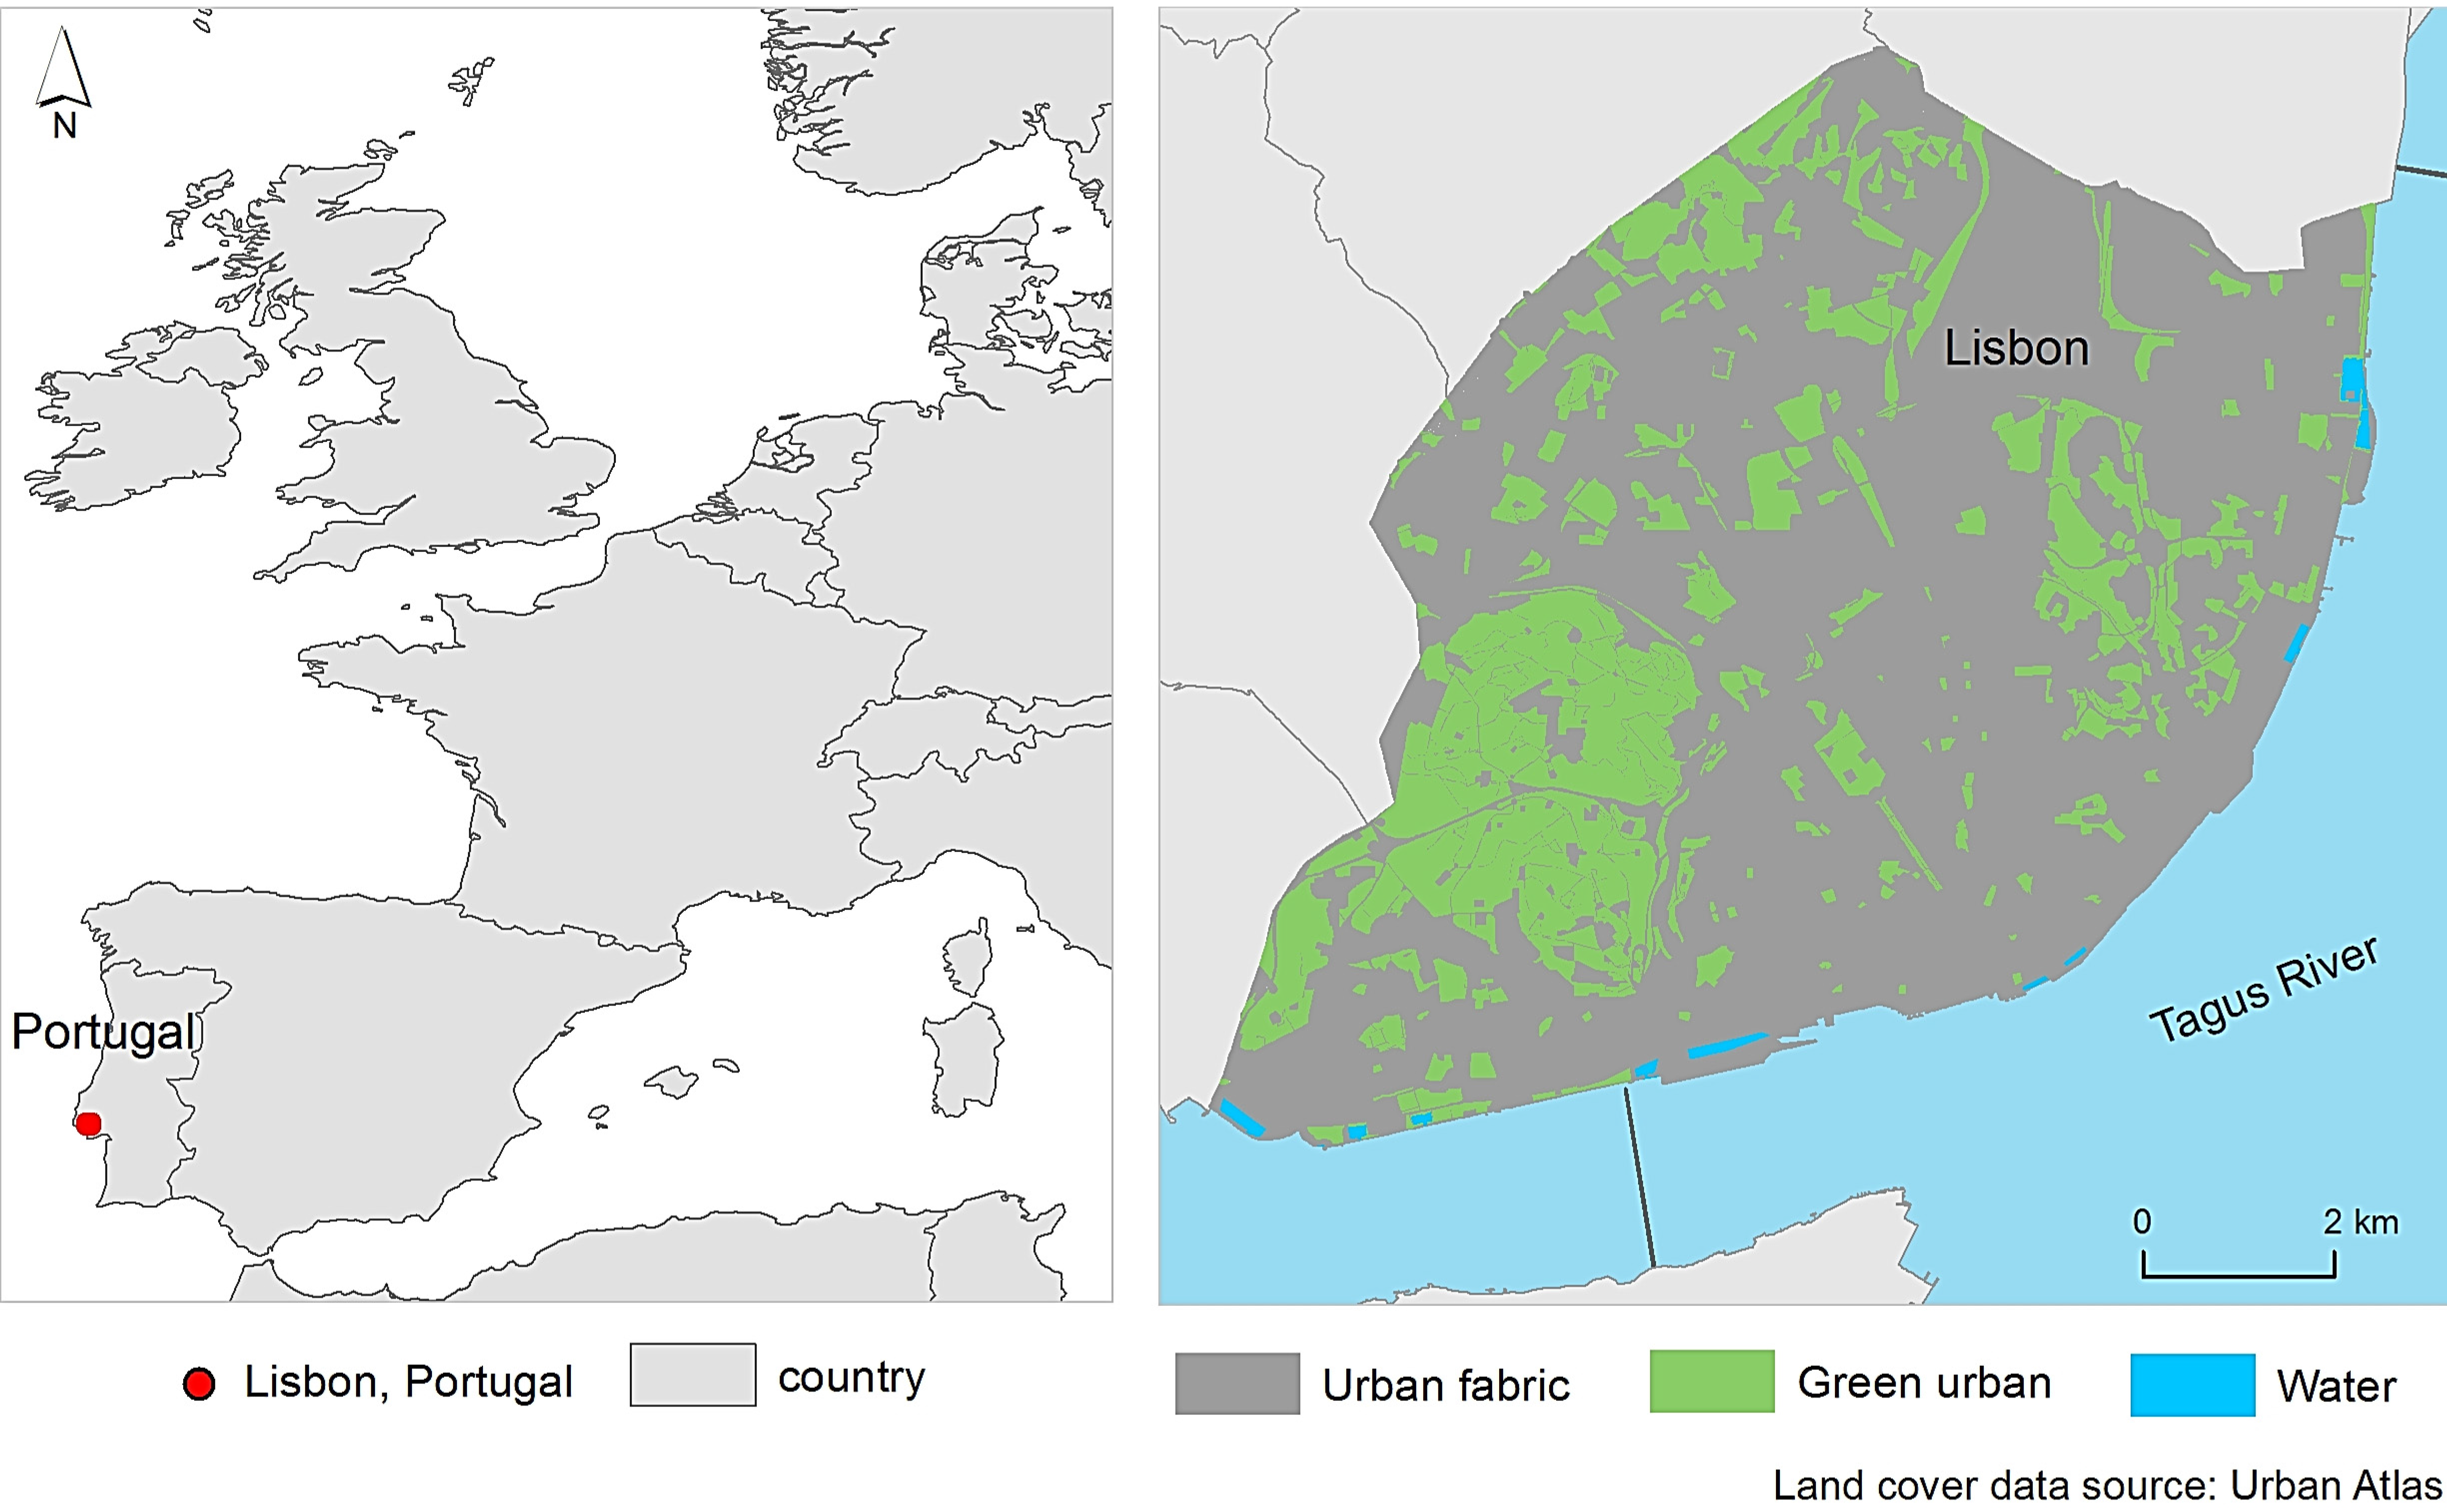
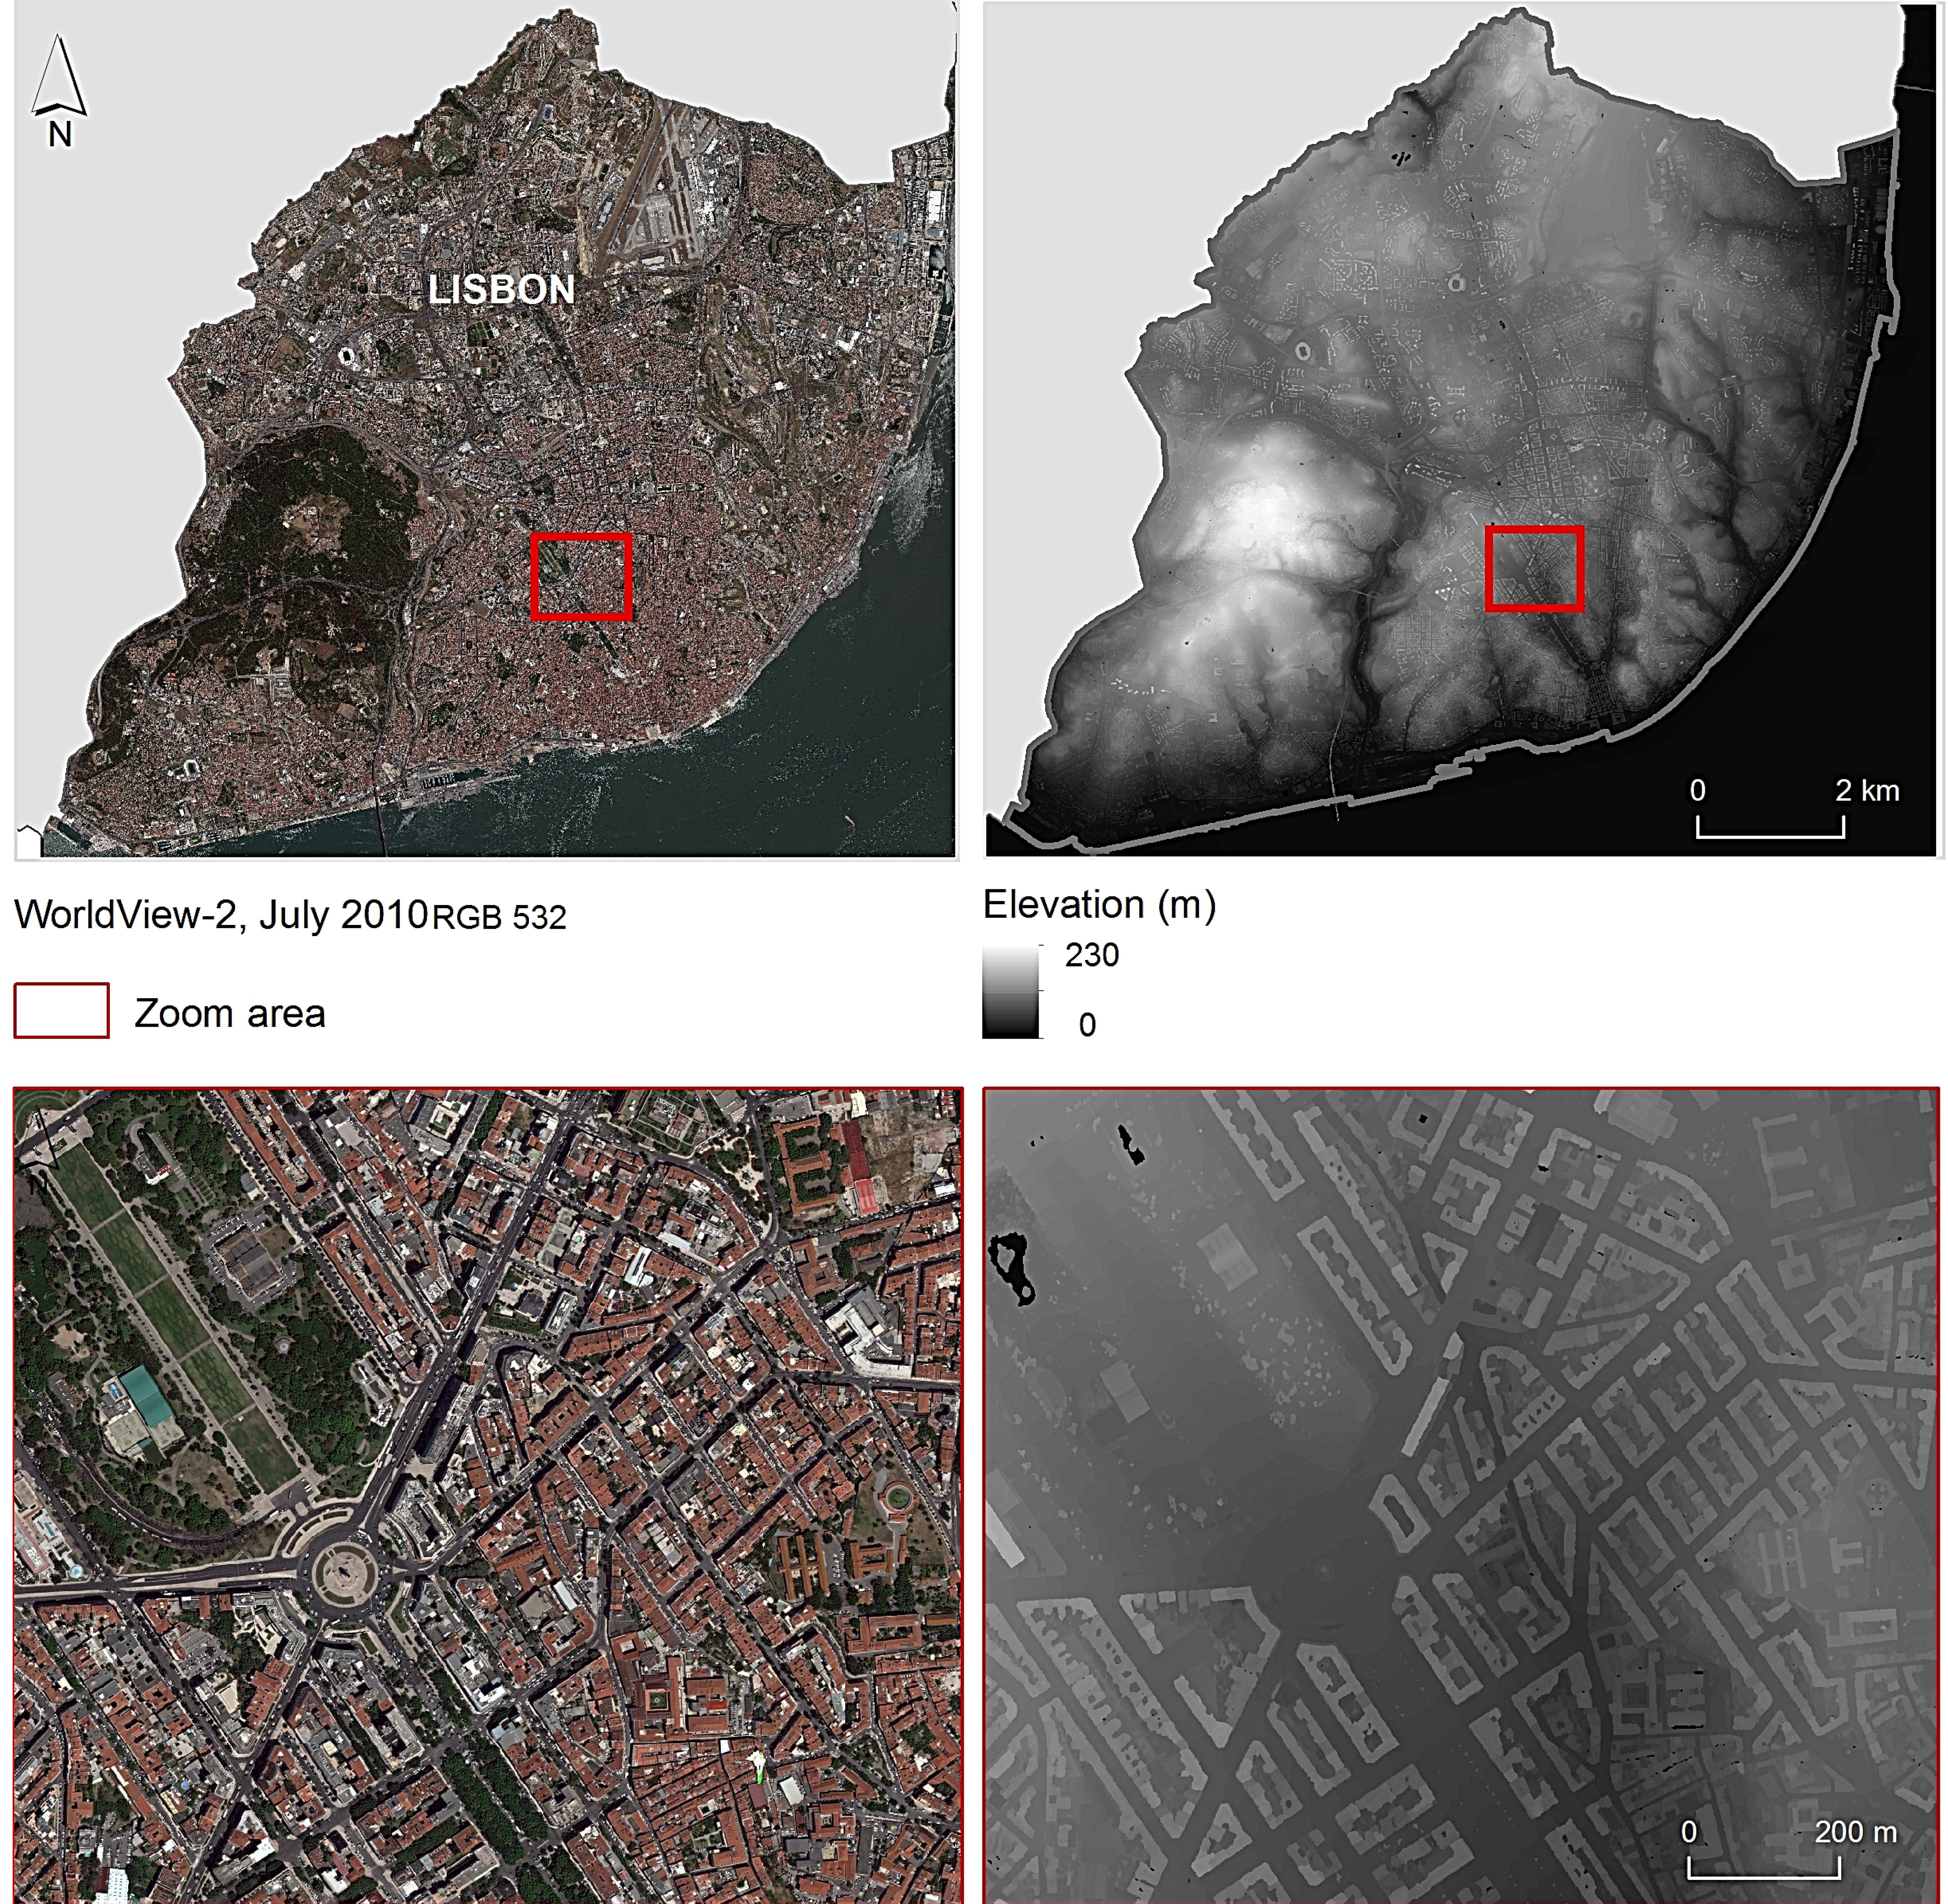
2.1. Study Area
2.2. Materials
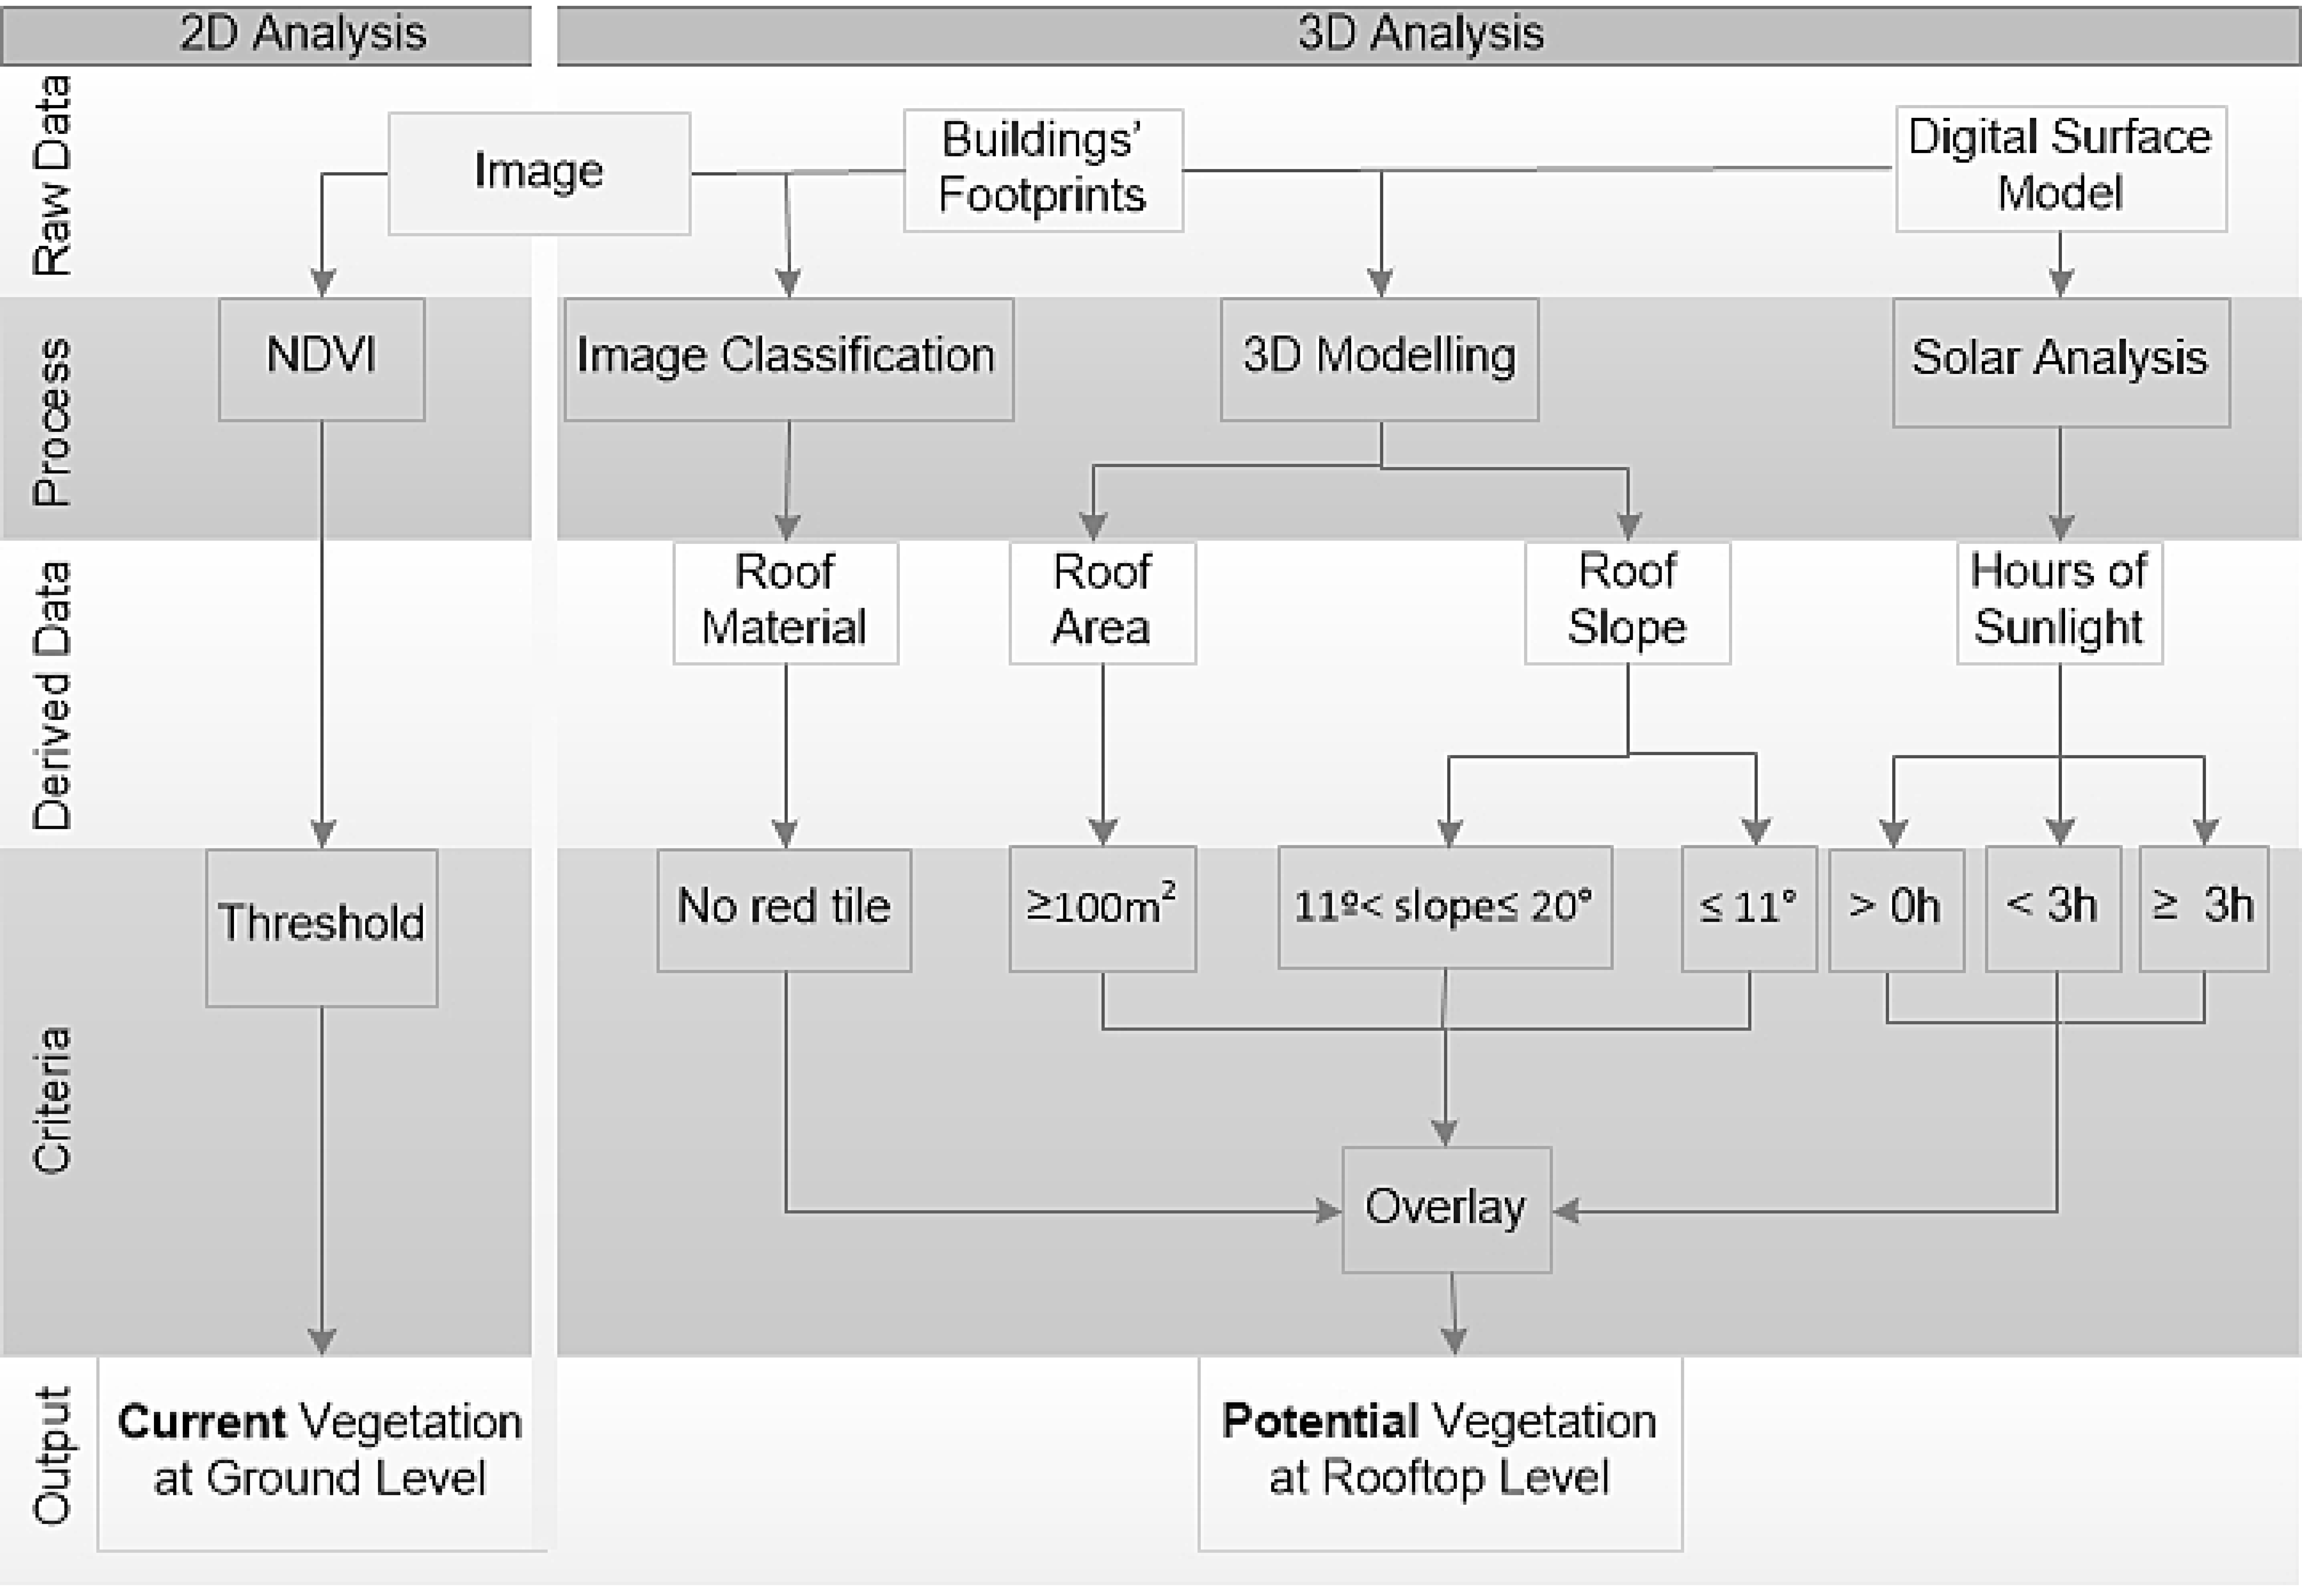
3. Methods
3.1. Quantifying Current Ground Cover Vegetation
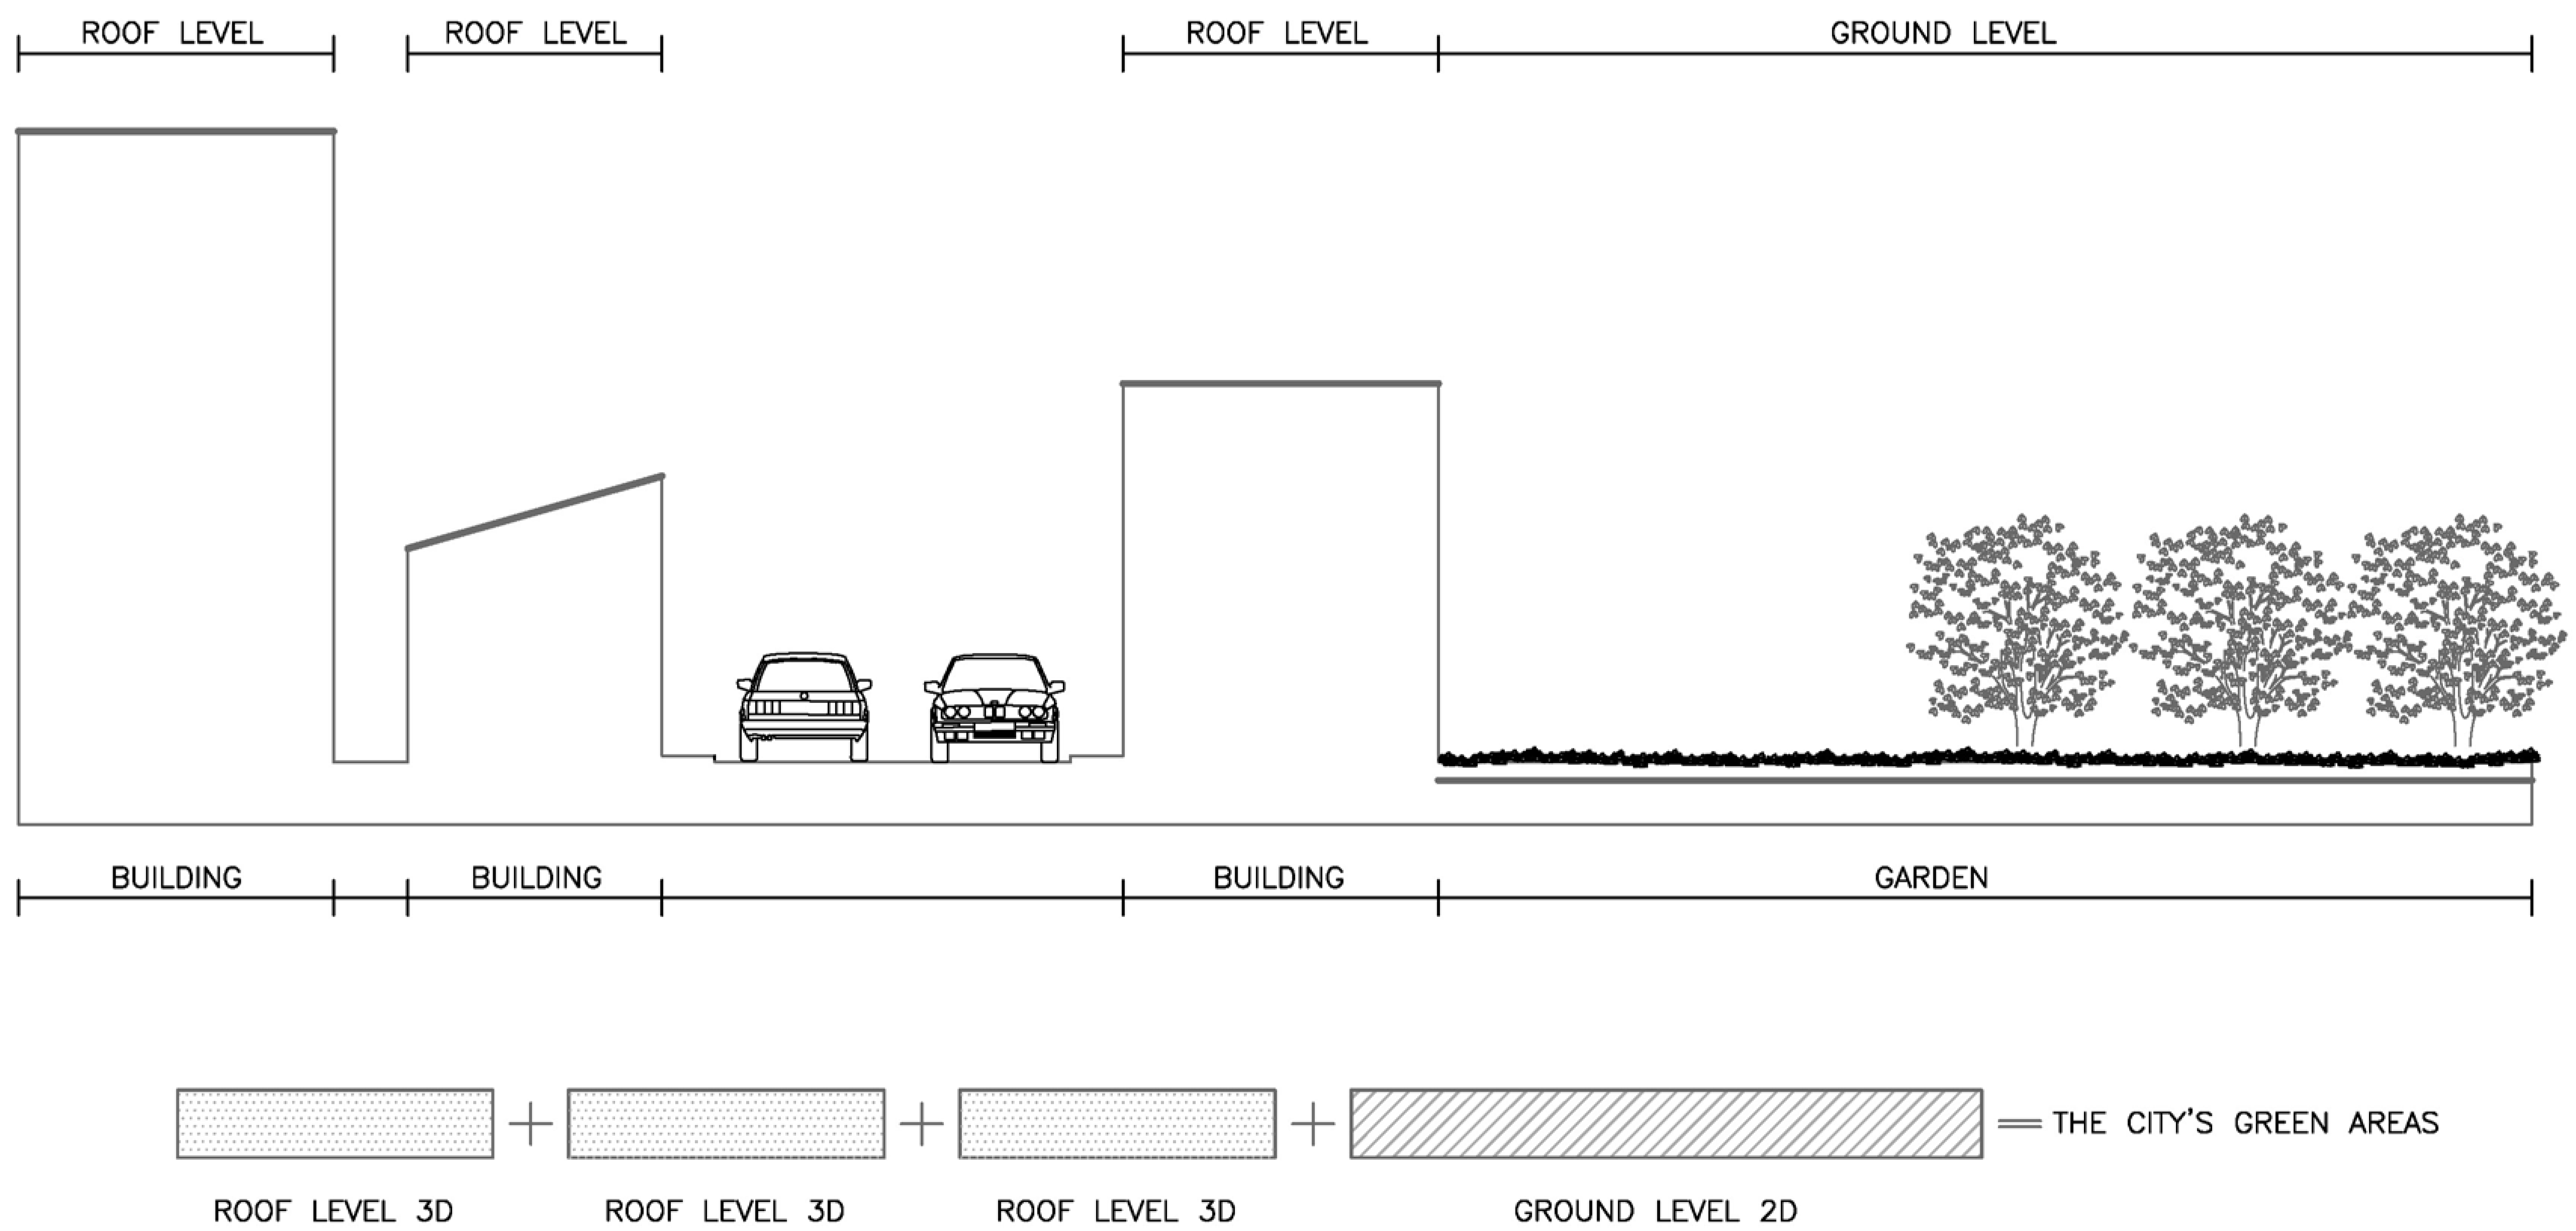
3.2. Evaluating Rooftop Suitability to Receive Green Cover
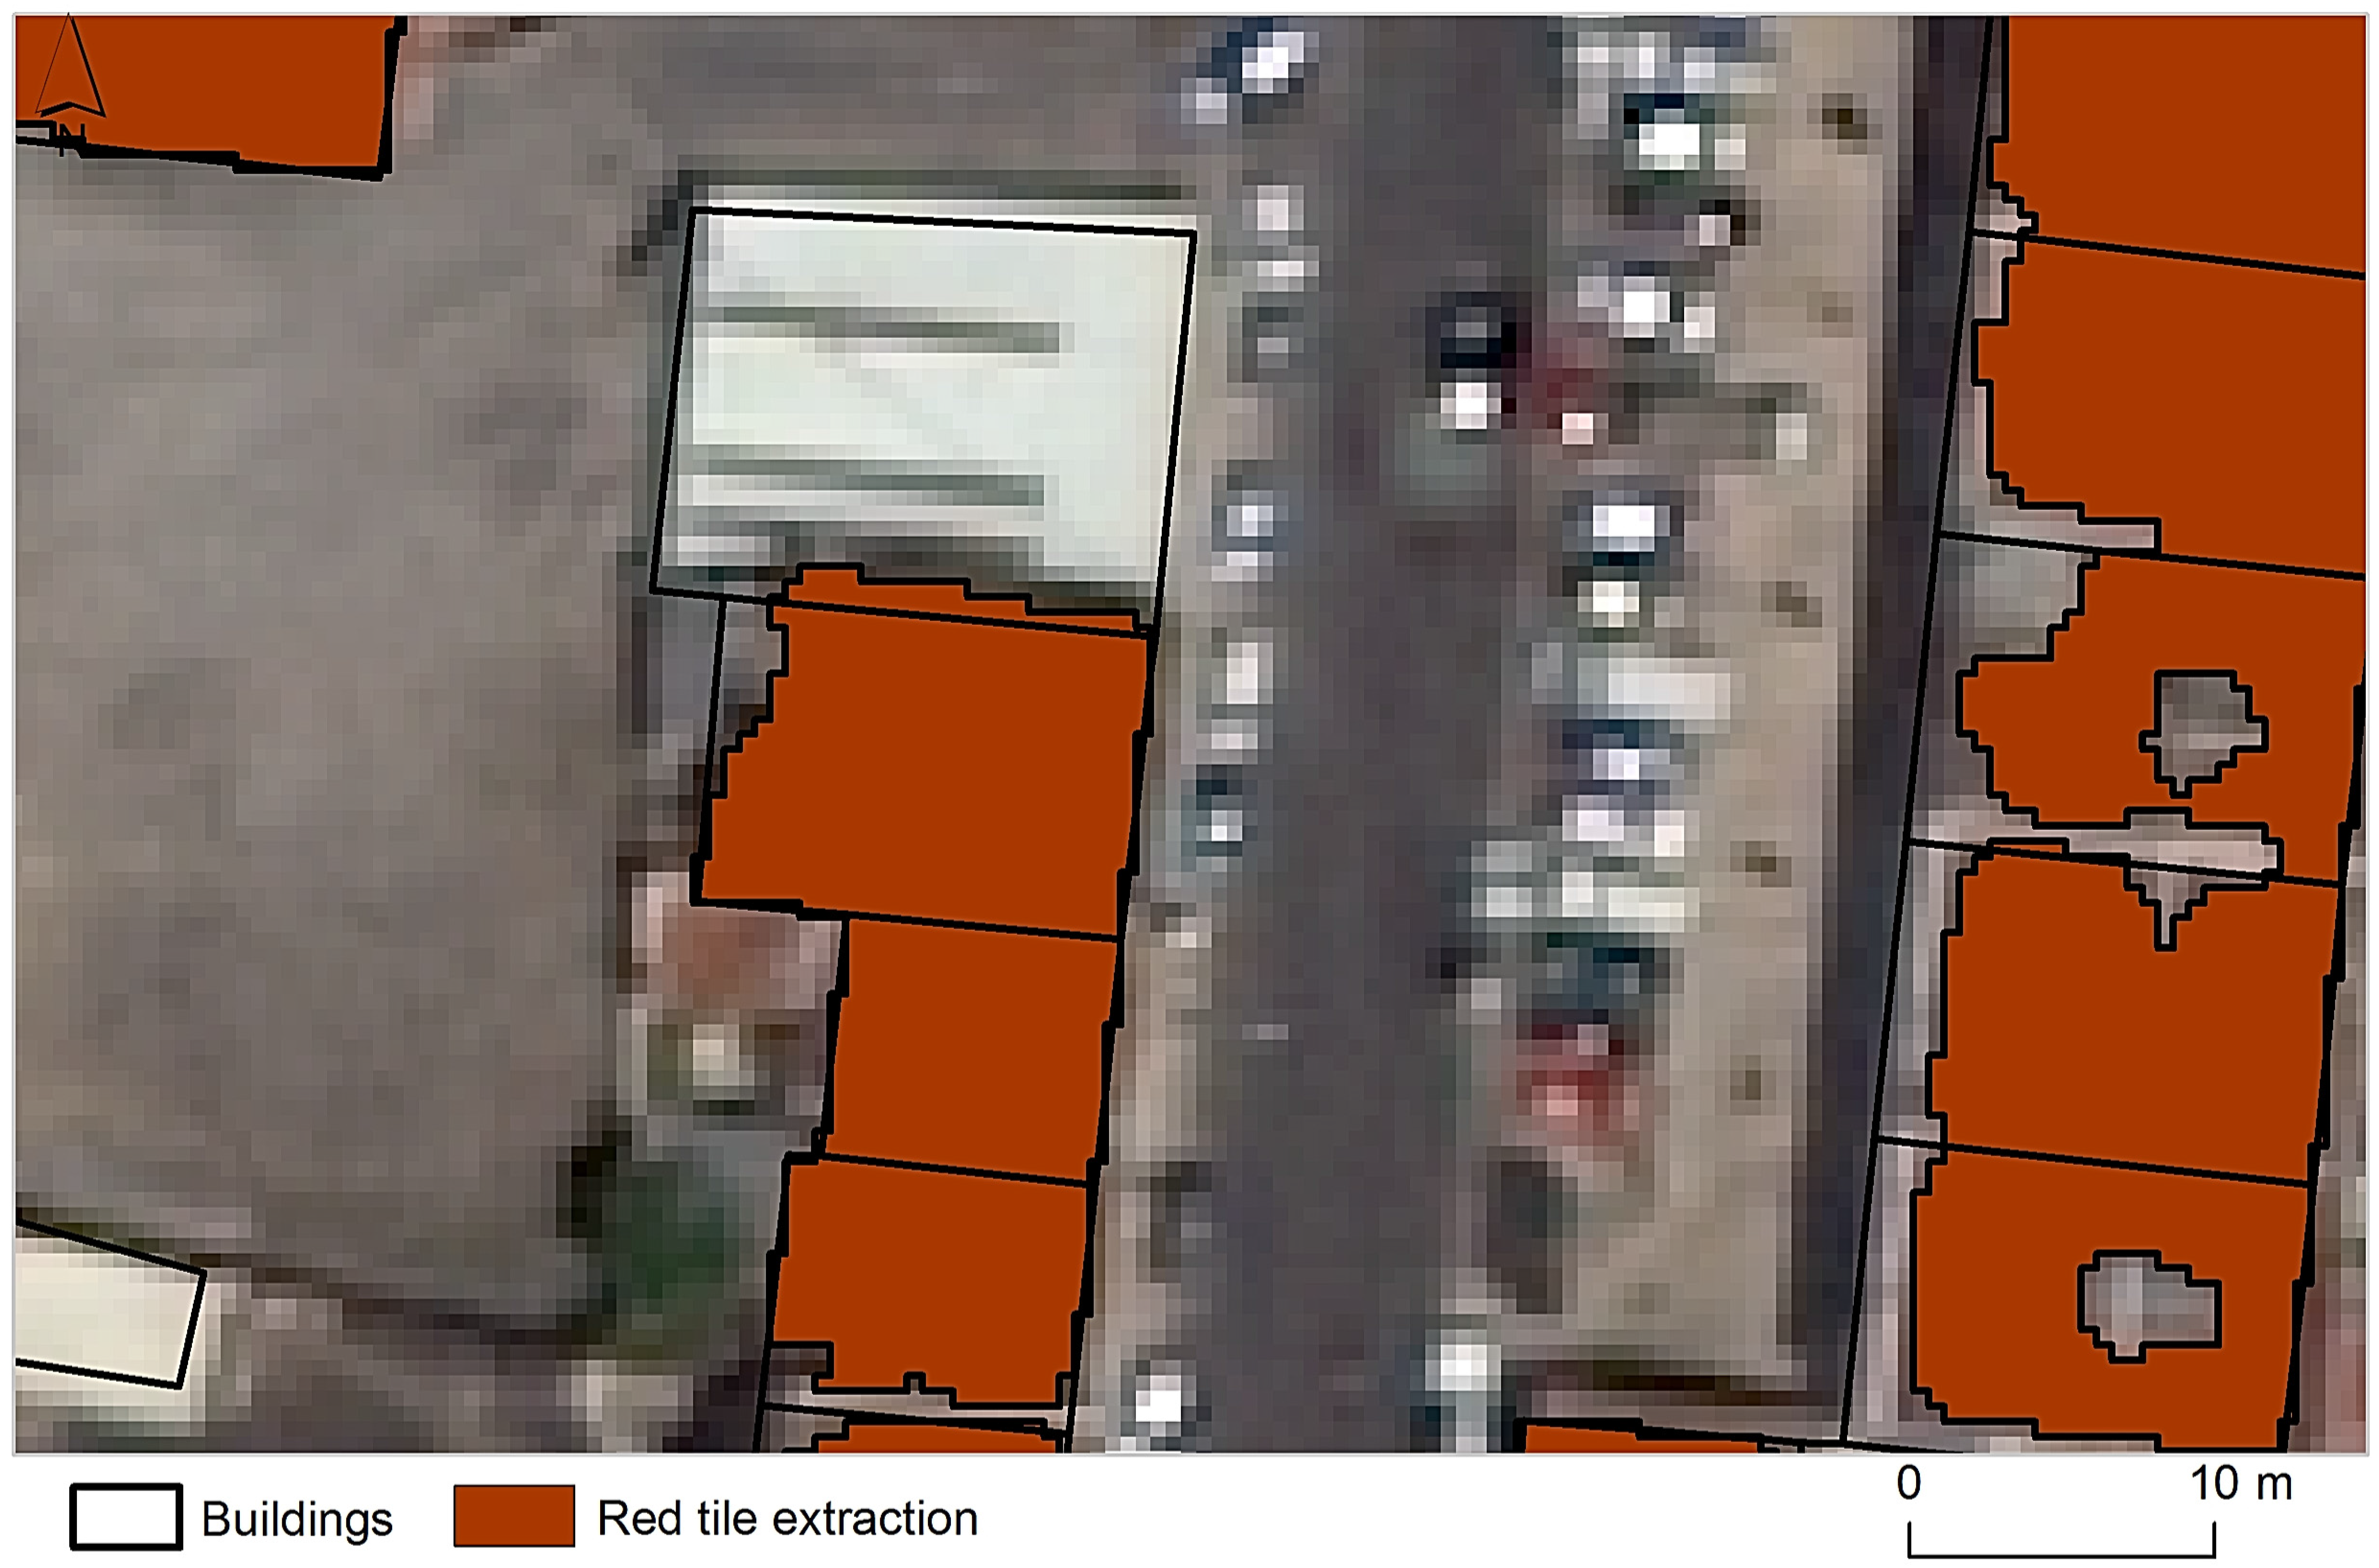
3.2.1. Rooftop Covering Materials
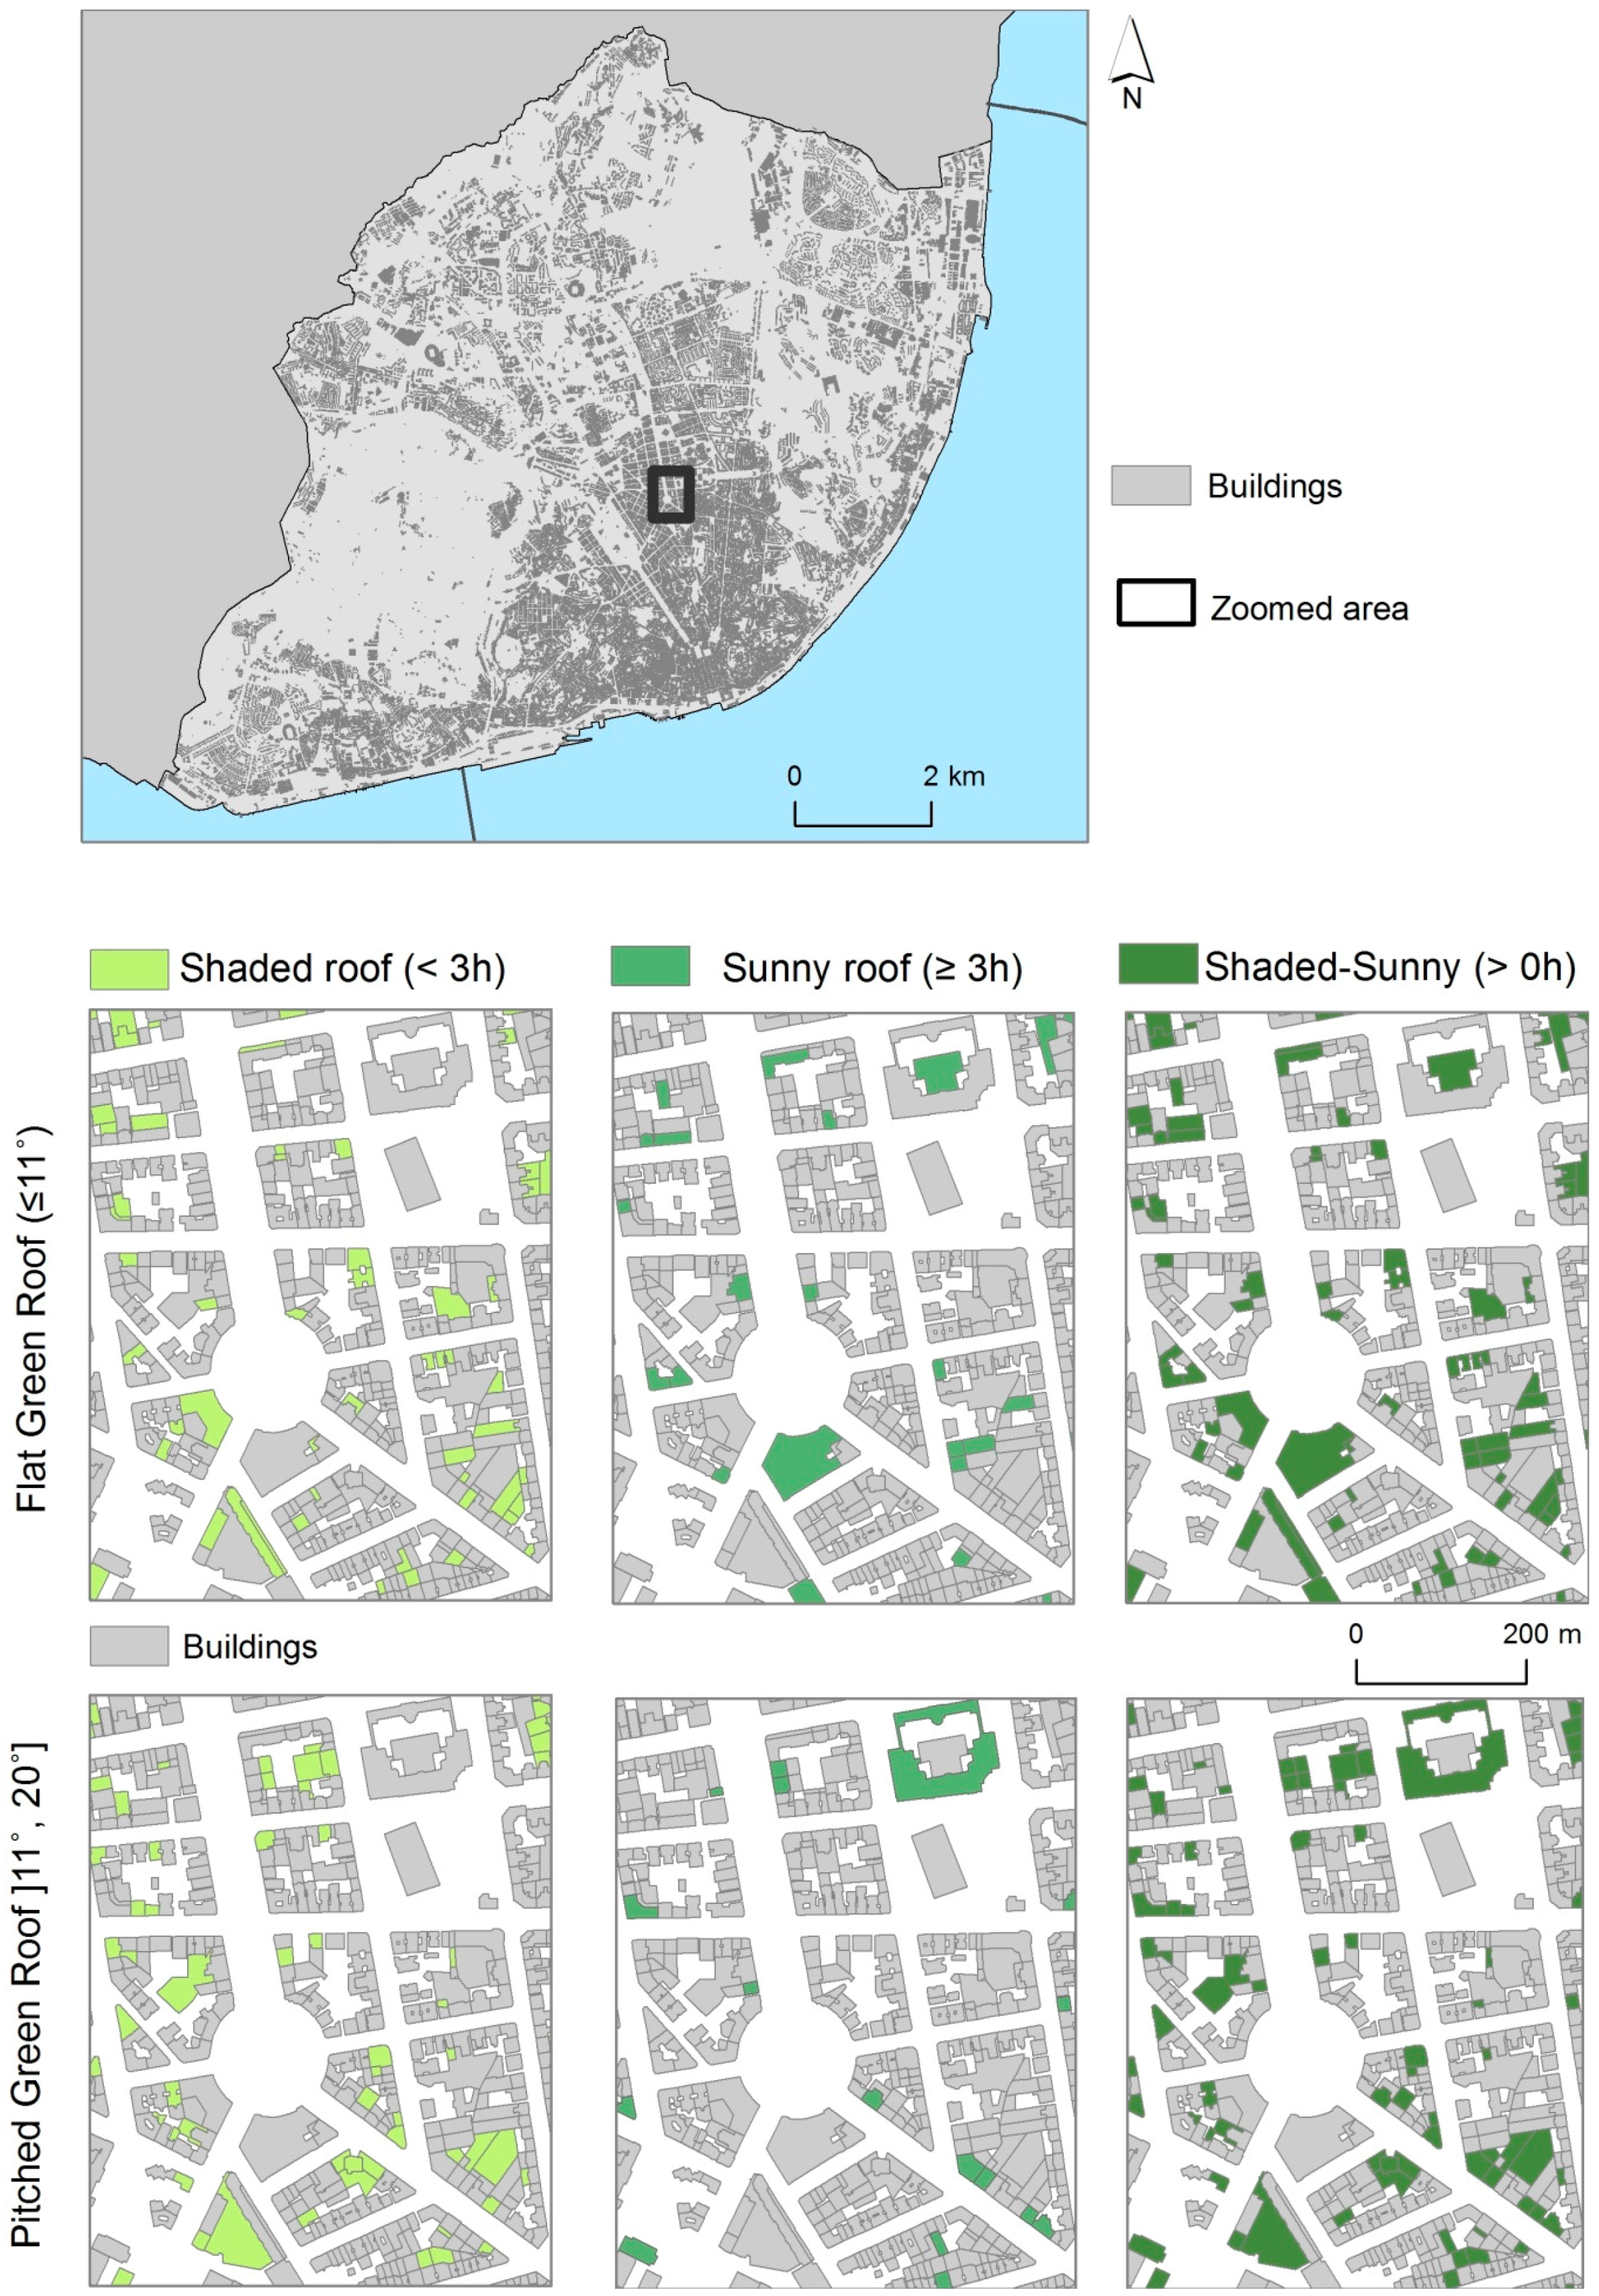
3.2.2. Rooftop Area, Slope, and Sunlight
3.2.3. Selection of Rooftops with Potential to Be Used as Green Roofs
4. Results and Discussion
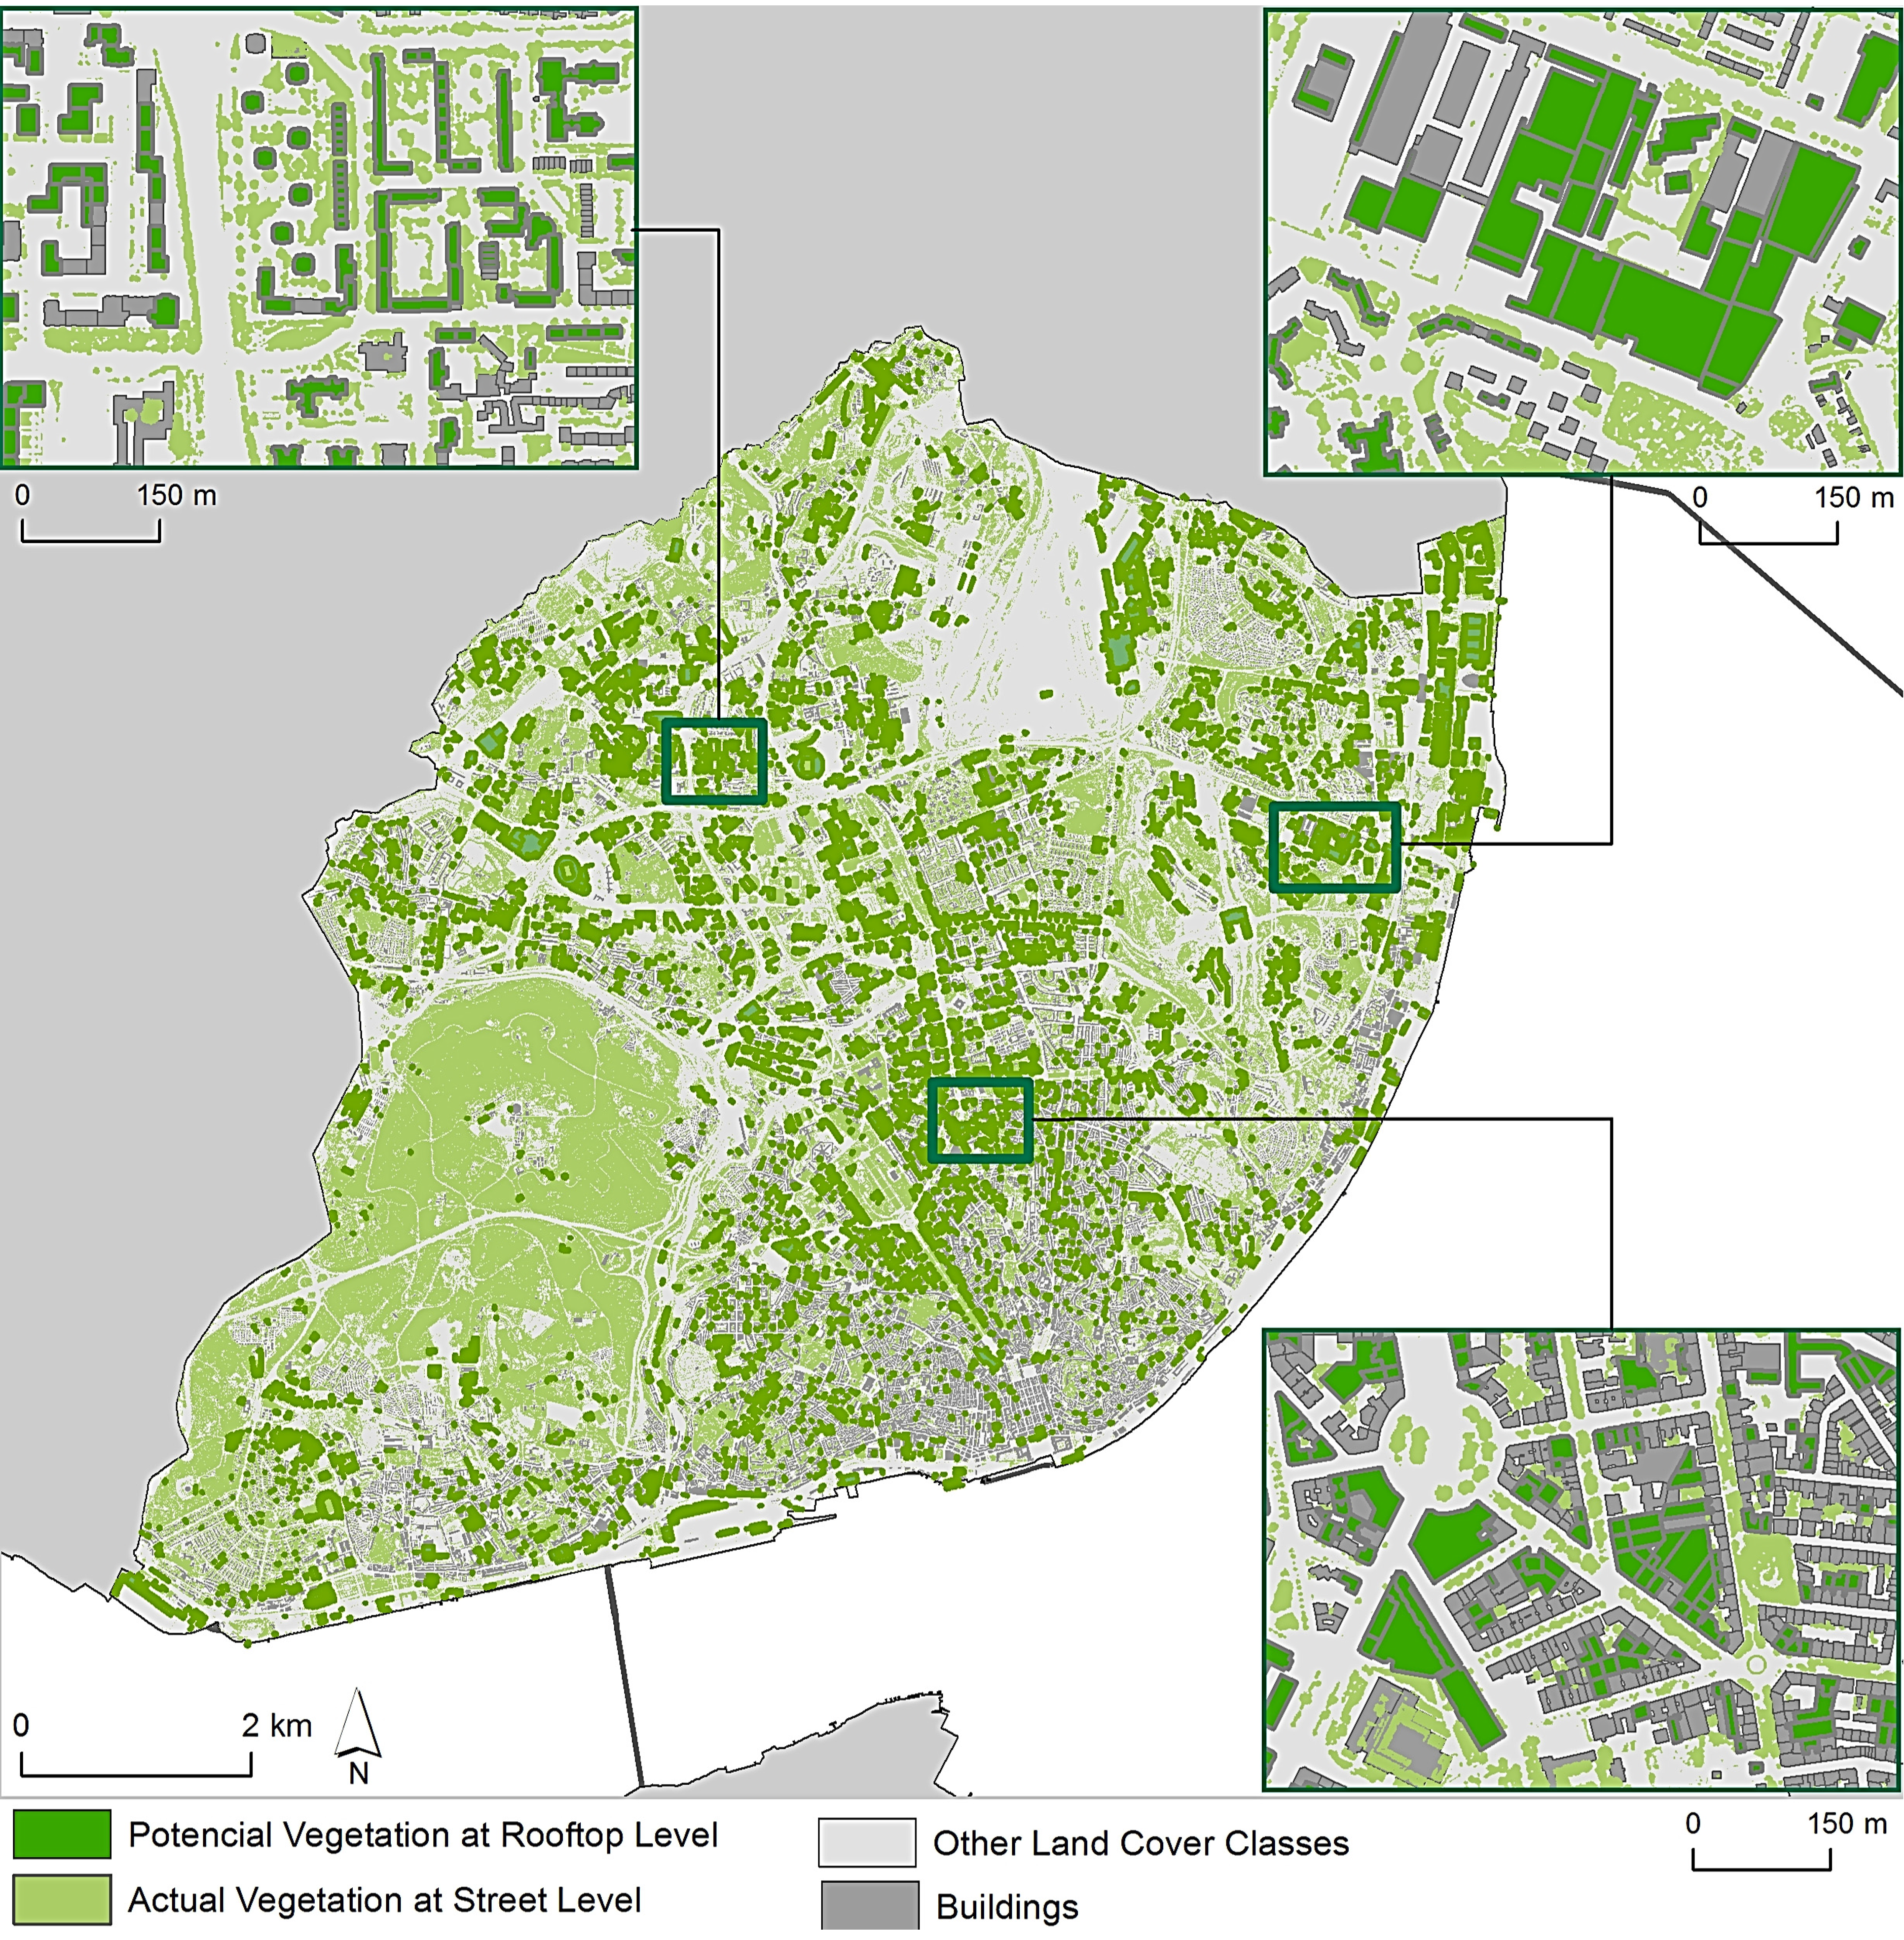
4.1. Mapping Vegetation at Ground Level
4.2. Modelling Vegetation at Rooftop Level
4.2.1. Rooftop Covering Materials
4.2.2. Rooftop Area, Slope, and Sunlight
4.2.3. Rooftops with Potential to Be Used as Green Roofs
5. Conclusions
Acknowledgments
Author Contributions
Conflicts of Interest
References
- Carpenter, M. From ‘healthful Exercise’ to ‘nature on Prescription’: The Politics of Urban Green Spaces and Walking for Health. Landsc. Urban Plan. 2013, 118, 120–127. [Google Scholar] [CrossRef]
- Ernstson, H. The Social Production of Ecosystem Services: A Framework for Studying Environmental Justice and Ecological Complexity in Urbanized Landscapes. Landsc. Urban Plan. 2013, 109, 7–17. [Google Scholar] [CrossRef]
- Chiesura, A. The Role of Urban Parks for the Sustainable City. Landsc. Urban Plan. 2004, 68, 129–138. [Google Scholar] [CrossRef]
- Alexandri, E.; Phil, J. Temperature Decreases in an Urban Canyon due to Green Walls and Green Roofs in Diverse Climates. Build. Environ. 2008, 43, 480–493. [Google Scholar] [CrossRef]
- Norton, B.A.; Coutts, A.M.; Livesley, S.J.; Harris, R.J.; Hunter, A.M.; Williams, N.S.G. Planning for Cooler Cities: A Framework to Prioritise Green Infrastructure to Mitigate High Temperatures in Urban Landscapes. Landsc. Urban Plan. 2015, 134, 127–138. [Google Scholar] [CrossRef]
- Luo, H.B.; Liu, X.; Anderson, B.C.; Zhang, K.; Li, X.; Huang, B.; Li, M.; Mo, Y.; Fan, L.Q.; Shen, Q.; et al. Carbon Sequestration Potential of Green Roofs Using Mixed-Sewage-Sludge Substrate in Chengdu World Modern Garden City. Ecol. Indic. 2015, 49, 247–259. [Google Scholar] [CrossRef]
- Peng, L.L.H.; Jim, C.Y. Economic Evaluation of Green-Roof Environmental Benefits in the Context of Climate Change: The Case of Hong Kong. Urban For. Urban Green. 2015, 14, 554–561. [Google Scholar] [CrossRef]
- Santamouris, M. Cooling the Citie—A Review of Reflective and Green Roof Mitigation Technologies to Fight Heat Island and Improve Comfort in Urban Environments. Sol. Energy 2014, 103, 682–703. [Google Scholar] [CrossRef]
- Dvorak, B.; Volder, A. Rooftop Temperature Reduction from Unirrigated Modular Green Roofs in South-Central Texas. Urban For. Urban Green. 2013, 12, 28–35. [Google Scholar] [CrossRef]
- Van Mechelen, C.; van Meerbeek, K.; Dutoit, T.; Hermy, M. Functional Diversity as a Framework for Novel Ecosystem Design: The Example of Extensive Green Roofs. Landsc. Urban Plan. 2015, 136, 165–173. [Google Scholar] [CrossRef]
- Benvenuti, S. Wildflower Green Roofs for Urban Landscaping, Ecological Sustainability and Biodiversity. Landsc. Urban Plan. 2014, 124, 151–161. [Google Scholar] [CrossRef]
- Selicato, S.; Violante, D. The impact of intelligent building technologies on the urban environment. In Computational Science and Its Applications—ICCSA 2014; Lecture Notes in Computer Science; Springer: Basel, Switzerland, 2014; Volume 8581, pp. 204–252. [Google Scholar]
- Rowe, D.B. Green Roofs as a Means of Pollution Abatement. Environ. Pollut. 2011, 159, 2100–2110. [Google Scholar] [CrossRef] [PubMed]
- Tonietto, R.; Fant, J.; Ascher, J.; Ellis, K.; Larkin, D. A Comparison of Bee Communities of Chicago Green Roofs, Parks and Prairies. Landsc. Urban Plan. 2011, 103, 102–108. [Google Scholar] [CrossRef]
- Berardi, U.; Ghaffarianhoseini, A.H.; Ghaffarianhoseini, A. State-of-the-Art Analysis of the Environmental Benefits of Green Roofs. Appl. Energy 2014, 115, 411–428. [Google Scholar] [CrossRef]
- Jaffal, I.; Ouldboukhitine, S.; Belarbi, R. A Comprehensive Study of the Impact of Green Roofs on Building Energy Performance. Renew. Energy 2012, 43, 157–164. [Google Scholar] [CrossRef]
- Saiz, S.; Kennedy, C.; Bass, B.; Pressnail, K. Comparative Life Cycle Assessment of Standard and Green Roofs. Environ. Sci. Technol. 2006, 40, 4312–4316. [Google Scholar] [CrossRef] [PubMed]
- Ansel, W.; Appl, R. An International Review of Current Practices and Future Trends: Green Roof Policies. Available online: http://www.igra-world.com/images/news_and_events/IGRA-Green-Roof-Policies.pdf (accessed on 15 June 2015).
- Carter, T.; Fowler, L. Establishing Green Roof Infrastructure through Environmental Policy Instruments. Environ. Manag. 2008, 42, 151–164. [Google Scholar] [CrossRef] [PubMed]
- Ngan, G. Green Roof Policies. Landsc. Architecture Canada Foundation, 2004. Available online: http://www.coolrooftoolkit.org/wp-content/uploads/2012/04/Green-Roof-Policy-report-Goya-Ngan.pdf (accessed on 15 June 2015).
- Madre, F.; Vergnes, A.; Machon, N.; Clergeau, P. Green Roofs as Habitats for Wild Plant Species in Urban Landscapes: First Insights from a Large-Scale Sampling. Landsc. Urban Plan. 2014, 122, 100–107. [Google Scholar] [CrossRef]
- TGRTAG–Toronto Green Roof Technical Advisory Group. Toronto Green Roof Construction Standard (TGRCS); Office of the Chief Building Official, Toronto Building: Toronto, ON, Canada, 2011; Available online: http://www.toronto.ca/greenroofs/pdf/GreenRoof-supGuidelines.pdf (accessed on 15 June 2015).
- PDC–Portland Development Commision. Green Building Policy. Program Guidelines. 2005. Available online: http://www.portlandonline.com/shared/cfm/image.cfm?id=112680 (accessed on 15 June 2015).
- IGRA–International Green Roof Association. Public Benefits. 2015. Available online: http://www.igra-world.com/benefits/public_benefits.php (accessed on 20 July 2015).
- Bates, A.J.; Sadler, J.P.; Mackay, R. Vegetation Development over Four Years on Two Green Roofs in the UK. Urban For. Urban Green. 2013, 12, 98–108. [Google Scholar] [CrossRef]
- Francis, R.A.; Lorimer, J. Urban Reconciliation Ecology: The Potential of Living Roofs and Walls. J. Environ. Manag. 2011, 92, 1429–1437. [Google Scholar] [CrossRef] [PubMed]
- Haaland, C.; van den Bosch, C.K. Challenges and Strategies for Urban Green-Space Planning in Cities Undergoing Densification: A Review. Urban For. Urban Green. 2015, 14, 760–771. [Google Scholar] [CrossRef]
- Mallinis, G.; Karteris, M.; Theodoridou, I.; Tsioukas, V.; Karteris, M. Development of a Nationwide Approach for Large Scale Estimation of Green Roof Retrofitting Areas and Roof-Top Solar Energy Potential Using VHR Natural Colour Orthoimagery and DSM Data over Thessaloniki, Greece. Remote Sens. Lett. 2014, 5, 548–557. [Google Scholar] [CrossRef]
- Wong, J.K.W.; Lau, L.S. From the ‘urban Heat Island’ to the ‘green Island’? A Preliminary Investigation into the Potential of Retrofitting Green Roofs in Mongkok District of Hong Kong. Habitat Int. 2013, 39, 25–35. [Google Scholar] [CrossRef]
- Tian, Y.H.; Jim, C.Y. Factors Influencing the Spatial Pattern of Sky Gardens in the Compact City of Hong Kong. Landsc. Urban Plan. 2011, 101, 299–309. [Google Scholar] [CrossRef]
- Santos, T.; Gomes, N.; Freire, S.; Brito, M.C.; Santos, L.; Tenedório, J.A. Applications of Solar Mapping in the Urban Environment. Appl. Geogr. 2014, 51, 48–57. [Google Scholar] [CrossRef]
- European Comission. Eurostat-Data Explorer. 2015. Available online: http://appsso.eurostat.ec.europa.eu/nui/show.do?dataset=urb_cenv&lang=en (accessed on 20 June 2015).
- European Comission. Statistics Illustrated-Eurostat. 2015. Available online: http://ec.europa.eu/eurostat/web/cities (accessed on 20 June 2015).
- Cruz, C.S.; Alves, F.L. A Strategy for Biodiversity, the Lisbon Case. Available online: https://www.cbd.int/doc/nbsap/sbsap/pt-sbsap-lisbon-en.pdf (accessed on 20 June 2015).
- Zhang, Y. A New Automatic Approach for Effectively Fusing Landsat 7 as Well as IKONOS Images. Available online: http://www2.unb.ca/gge/Resources/ImageFusion/UNB/zoomview/Fusion_poster_2002_50_cUNB.pdf (accessed on 27 January 2015).
- Rouse, J.W.; Haas, R.H.; Schell, J.A.; Deering, D.W. Monitoring Vegetation Systems in the Great Plains with ERTS. NASA Spec. Publ. 1974, 1, 309–317. [Google Scholar]
- Santos, T. Producing Geographical Information for Land Planning Using VHR Data: Local Scale Applications; LAP LAMBERT Academic Publishing: Saarbrucken, Germany, 2011. [Google Scholar]
- Li, W.; Saphores, J.M.; Gillespie, T.W. A Comparison of the Economic Benefits of Urban Green Spaces Estimated with NDVI and with High-Resolution Land Cover Data. Landsc. Urban Plan. 2015, 133, 105–117. [Google Scholar] [CrossRef]
- Opitz, D.; Blundell, S. Object Recognition and Image Segmentation: The Feature Analyst® Approach. In Object-Based Image Analysis; Springer: Berlin, Germany, 2008; pp. 153–167. Available online: http://link.springer.com/chapter/10.1007/978-3-540-77058-9_8 (accessed on 6 May 2014).
- Yorukoglu, M.; Celik, A.N. A Critical Review on the Estimation of Daily Global Solar Radiation from Sunshine Duration. Energy Convers. Manag. 2006, 47, 2441–2450. [Google Scholar] [CrossRef]
- Almorox, J.; Hontoria, C. Global Solar Radiation Estimation Using Sunshine Duration in Spain. Energy Convers. Manag. 2004, 45, 1529–1535. [Google Scholar] [CrossRef]
- Maurer, E. Green Roofs in Linz. 2006. Available online: http://www.greenroof.group.shef.ac.uk/pdf/edmundmaurer.pdf (accessed on 6 May 2016).
- Wilkinson, S.J.; Reed, R. Green Roof Retrofit Potential in the Central Business District. Prop. Manag. 2009, 27, 284–301. [Google Scholar] [CrossRef]
- Pedro, I.C.S.M. O Uso da Deteção Remota Para a Extração de Indicadores Urbanos. (Using Remote Sensing To Extraction Urban Indicators). Master’s Thesis, Lisbon New University, Lisbon, Portugal, 2014. [Google Scholar]
- Overwatch Systems, Ltd. Feature Analyst 5.1.x Reference Guide. Available online: http://www.vls-inc.com/login/downloads/Install%20Guide%20FA%205_1%20ArcGIS.pdf (accessed on 15 June 2015).
- Freire, S.; Santos, T.; Navarro, A.; Soares, F.; Silva, J.D.; Afonso, N.; Fonseca, A.; Tenedório, J. Introducing Mapping Standards in the Quality Assessment of Buildings Extracted from Very High Resolution Satellite Imagery. ISPRS J. Photogramm. Remote Sens. 2014, 90, 1–9. [Google Scholar] [CrossRef]
- Santos, T.; Freire, S.; Navarro, A.; Soares, F.; Dinis, J.; Afonso, N.; Fonseca, A.; Tenedório, J.A. Extracting Buildings in the City of Lisbon Using QuickBird Images and LIDAR Data. Available online: http://www.isprs.org/proceedings/XXXVIII/4-C7/pdf/Santos_98.pdf (accessed on 20 May 2014).
- Freire, S.; Santos, T.; Gomes, N.; Fonseca, A.; Tenedório, J.A. Extraction of buildings from quickbird imagery—What is the relevance of urban context and heterogeneity? In Proceedings of the Special Joint Symposium of ISPRS Technical Commission IV & AutoCarto in Conjunction with ASPRS/CaGIS 2010 Fall Specialty Conference, Orlando, FL, USA, 15–19 November 2013.
- Herman, R. Green Roofs in Germany: Yesterday, Today and Tomorrow. In Proceedings of the Greening Rooftops for Sustainable Communities, Chicago, IL, USA, 29–30 May 2003; pp. 41–45.
- Nguyen, H.T.; Pearce, J.M.; Harrap, R.; Barber, G. The Application of LiDAR to Assessment of Rooftop Solar Photovoltaic Deployment Potential in a Municipal District Unit. Sensors 2012, 12, 4534–4558. Available online: http://ec.europa.eu/environment/nature/ecosystems/background.htm (accessed on 9 June 2016). [Google Scholar] [CrossRef] [PubMed]
- European Environment Agency. CORINE Land Cover. 2016. Available online: http://www.eea.europa.eu/publications/COR0-landcover (accessed on 22 April 2016).
- He, C.; Convertino, M.; Feng, Z.; Zhang, S. Using LiDAR Data to Measure the 3D Green Biomass of Beijing Urban Forest in China. PLoS ONE 2013, 8, e75920. [Google Scholar] [CrossRef] [PubMed]
- Tenedório, J.A.; Rebelo, C.; Estanqueiro, R.; Henriques, C.D.; Marques, L.; Gonçalves, J.A. New Developments in Geographical Information Technology for Urban and Spatial Planning. In Technologies for Urban and Spatial Planning: Virtual Cities and Territories; Pinto, N., Tenedório, J., Antunes, A., Cladera, J., Eds.; Information Science Reference: Hershey, PA, USA, 2014; pp. 196–227. [Google Scholar]


| City | Population 2008 | Pop. Density (Pop/km2) | Green Urban Areas (m2) | Vegetation per Capita (m2/Inhab) |
|---|---|---|---|---|
| Lisbon | 489,562 | 5778 | 11,914,531 | 24 |
| Image Bands | Spectral Range (nm) | ||
|---|---|---|---|
| Acquisition date | 29 June 2010 | 1 | 400–450 (coastal) |
| Sun azimuth | 140° | 2 | 450–510 (blue) |
| Sun elevation | 71° | 3 | 510–580 (green) |
| Satellite azimuth | 238° | 4 | 585–625 (yellow) |
| Satellite elevation | 82° | 5 | 630–690 (red) |
| Off-Nadir view angle | 7.1° | 6 | 705–745 (red edge) |
| Cloud cover | 0% | 7 | 770–895 (near IR-1) |
| Collected GSD | Pan 0.47 m, MX 1.88 m | 8 | 860–900 (near IR-2) |
| Product pixel size | Pan 0.5 m, MX 2 m | Pan | 450–800 |
| Reference | |||
|---|---|---|---|
| Classification | Vegetation | Non-Vegetation | Total |
| Vegetation | 1,360,752 | 288,784 | 1,649,536 |
| Non-Vegetation | 177,130 | 3,515,424 | 3,692,554 |
| Total | 1,537,882 | 3,804,208 | 5,342,090 |
| Commission Error | Omission error | ||
| Vegetation | 18% | 12% | |
| Non-Vegetation | 5% | 8% | |
| Map | Overall Accuracy: 91% |
| Area (m2) | Buildings (Number) | Increase in Green Area (%) | |||
|---|---|---|---|---|---|
| Vegetation at Ground level | 25,835,522 | n.a. | n.a. | ||
| Vegetation at Rooftop | Flat Green Roof (≤11°) | Sunny roof (≥3 h) | 1,731,081 | 2890 | 6.7 |
| Shaded roof (<3 h) | 453,210 | 1655 | 1.8 | ||
| Shaded-sunny (>0 h) | 2,184,291 | 4545 | 8.5 | ||
| Pitched Green Roof ]11°, 20°] | Sunny roof (≥3 h) | 1,095,383 | 2467 | 4.2 | |
| Shaded roof (<3 h) | 438,954 | 2125 | 1.7 | ||
| Shaded-sunny (>0 h) | 1,534,337 | 4592 | 5.9 | ||
© 2016 by the authors; licensee MDPI, Basel, Switzerland. This article is an open access article distributed under the terms and conditions of the Creative Commons Attribution (CC-BY) license (http://creativecommons.org/licenses/by/4.0/).
Share and Cite
Santos, T.; Tenedório, J.A.; Gonçalves, J.A. Quantifying the City’s Green Area Potential Gain Using Remote Sensing Data. Sustainability 2016, 8, 1247. https://doi.org/10.3390/su8121247
Santos T, Tenedório JA, Gonçalves JA. Quantifying the City’s Green Area Potential Gain Using Remote Sensing Data. Sustainability. 2016; 8(12):1247. https://doi.org/10.3390/su8121247
Chicago/Turabian StyleSantos, Teresa, José António Tenedório, and José Alberto Gonçalves. 2016. "Quantifying the City’s Green Area Potential Gain Using Remote Sensing Data" Sustainability 8, no. 12: 1247. https://doi.org/10.3390/su8121247