1. Introduction
In the United States alone, hundreds of billions of dollars are spent every year to retrofit existing and build new physical infrastructure (e.g., transportation systems, water systems) [
1], with more to come [
2,
3]. This physical infrastructure contributes directly to sustainability outcomes such as energy and water consumption and climate changing emissions [
4]. For example, a globalization of Western infrastructure using current technologies would produce an estimated 350 Gigatons of CO
2 in materials production alone! That amount represents more than half of the remaining budget of emissions until 2050 to keep temperature rise within 2 °C [
5].
Furthermore, present day decisions about infrastructure go beyond materials. These decisions also create path dependence [
6]. In other words, these decisions dictate future performance of these systems for a long time, determining energy, water use, and climate change emissions for the life cycle of the project. Consequently, the decisions that create these path dependencies define the overall sustainability of the infrastructure project, which directly affects how the public will use infrastructure services, influencing mobility, public health, and economic development.
Thoughtful infrastructure development decisions can result in more sustainable and cost-effective solutions. Cities such as Bogota, Colombia and Curitiba, Brazil have relieved congestion and democratized transportation by repurposing existing road lanes from automobiles to above-ground “subway” systems of buses and elevated waiting areas. In Curitiba, over 2 million people, about 75% of the population, now use this system every day. Curitiba’s system was cost-effective both in terms of the initial investment (less expensive than adding highway lanes or an underground subway system) and in the long-term, as residents enjoy the lowest per capita transportation costs and best air quality in the country. Fuel consumption in the city has been slashed by roughly one third [
7]. As the Curitiba example shows, more sustainable infrastructure need not cost more. It may even cost less.
Yet, well-intentioned stakeholders frequently produce projects that fail to achieve this goal. For example, even after two decades, the presence of high occupancy vehicle lanes in Atlanta, U.S. has had little noticeable effect on congestion and driver behavior, particularly in willingness to carpool [
8,
9,
10]. Infrastructure projects that do not achieve intended goals drain financial resources and erode public willingness to invest in infrastructure.
Decision aids, in particular rating systems, are increasingly used to design and evaluate infrastructure projects. Envision, for example, is a leading rating system for sustainable infrastructure in the U.S. and is used during project planning to inform goal setting and early design considerations. The Envision rating system is designed to be applicable to a wide range of types of infrastructure projects including roads, bridges, pipelines, railways, airports, dams, levees, landfills, and water treatment systems.
The Envision rating system includes 60 credits divided into five categories: Quality of Life, Leadership, Resource Allocation, Natural World, and Climate and Risk. For each credit, designers use Envision’s guidance manual to determine an achievement level that they commit to accomplishing. The levels of achievement are ranked (in ascending order: improved, enhanced, superior, conserving, and restorative) and are associated with a point value, which increases as the level of achievement increases. A project is given a final score based on the percentage of points that was achieved from each of the credits. Our study considers an increased Envision score as an increase in the sustainability of the project. The goal of Envision is to move project teams from conventional practice, which earns zero points, to the highest achievable levels of sustainability, which Envision defines as “restorative”.
Understanding how tools like Envision influence decision-making will help avoid scenarios where unanticipated behavioral barriers limit sustainability achievement. Our research combines the use of decisions aids and psychological intervention in order to determine how to improve tools such as Envision. For example, our results from a prior study with engineering professionals (
n = 65) using Envision suggest they are, in fact, influenced by framing effects. A control group (
n = 33) was given the standard version of Envision and an experimental group (
n = 32) received a modified version of Envision with an endowed rating system, in which the engineering professionals lost points for not maintaining high consideration for sustainability. The experimental group scored 29% more points than the control group (
p < 0.01) [
11]. These findings suggest that restructuring decision aids such as Envision can increase consideration for sustainability.
Building on our previous research, the research described in this paper explores another psychological intervention that could be incorporated in Envision’s current framework with very low cost. Specifically, we will study role models, which are defined as something that is looked to by others as an example to be imitated. This definition and our study builds on behavioral science research showing that a role model can influence motivation and goal setting.
The role model literature shows the largest effects when individuals are presented with a role model that is relevant to them [
12,
13], in particular when the role model’s success seems attainable [
12]. For example, Marx and Ko (2012) studied the effect of role models in a stereotyped context. Female participants were asked to evaluate a female job candidate, which served as a role model with either a high or low level of math competence. The participants were then given a math exam. Those exposed to a similar, high competency, role model performed better on the math exam than those exposed to a similar low competency role model [
13]. When compared to individuals presented with a negative role model for a specific goal, those presented with a positive role model consistently outperform [
13,
14,
15,
16]. Our research design builds on this finding.
Our study extends the research on social influences and goal setting to engineering design decisions for physical infrastructure projects. By understanding influences in the decision process, we aspire to uncover ways to encourage engineers to choose more sustainable options. To pursue this goal, we asked engineering professionals to complete a case study using Envision. The professionals were randomly assigned to use either the unmodified Envision rating system, or a version that included examples from a high-scoring role model project and examples from a low-scoring role model project.
2. Hypothesis
We hypothesize that a role model project with a high Envision score will encourage engineering professionals to make decisions that also lead to a high Envision score. The null hypothesis is that no significant difference is measured between those with or without the high scoring role model project (for this and the following hypotheses, we define significant as meeting at least a 95% confidence interval).
Conversely, we hypothesize that a role model project with a low Envision score will lead the professionals to achieve lower scores. In this case, the null hypothesis is that no significant difference is measured between the engineering professionals with or without the low scoring role model credits.
We also hypothesize a “spill over” effect from the eight Envision credits for which we included role model examples. In other words, we expect that, even on credits without the role model examples, the professionals’ selections will be shaped by the role model examples on different credits. The null hypothesis is that there will be no measured difference between groups with and without the role model project.
Finally, we hypothesize that those presented with the role model example are more likely to begin their design decision process with the role model’s level of achievement. This is measured via the engineering professionals’ self-reporting on an ordinal scale survey question after they have completed the Envision case study.
3. Materials and Methods
Our empirical study examined engineering professionals’ decision making when using the Envision rating system. Professional engineers were recruited to participate in an Envision training session, which included an introduction to the rating system, a case study using a replica of the Envision software, and a post-task survey in which participants reflected on their decision-making.
Envision Training Sessions
We offered five, 90-min, Envision training sessions to engineering professionals. In total, there were 54 participants, which a power analysis indicated would be more than enough to yield statistically significant results to accept or reject our hypotheses.
After we introduced Envision, we asked participants to imagine themselves as a consultant for an infrastructure redevelopment case study. In this imaginary role, they made decisions about project details using the Envision rating system software. Participants could view their default score, the total possible points, and scroll the page to see each possible credit. For each credit, a hyperlink directed participants to Envision’s detailed explanations of how to meet achievement levels.
Participants were asked to review each credit, select the level of achievement they would try to achieve, and then explain how the project team could meet that level of achievement. A written explanation of at least 100 word characters in length was required for improved and 300 characters for restorative, with intermediate levels were spaced at 50 character intervals. Credits marked as not applicable also required an explanation. Our intent with these character minimums, which was confirmed in a pilot study, was to require effort to reduce the likelihood that participants would maximize points by thoughtlessly selecting the highest levels of achievement for every credit.
Upon login to the software, the engineering professionals were randomly assigned to one of two versions of the rating system. Both versions contained the same 12 Envision credits, from the categories Quality of Life, Natural World, and Climate and Risk (only 12 of the 60 Envision credits were used to reduce the time and the cognitive load requirements). Version one had no role model project, which is how Envision is currently structured, and so those assigned this version were the control group (n = 27).
Version two included an example project, the South Los Angeles Wetlands Park, to act as a role model (
n = 27). This example project was chosen because we had access to the entire Envision assessment from Psomas Engineering and because the project had areas of both exemplary and conventional sustainability performance. Version two contained three role model interventions: (1) a high example project score for eight credits; (2) a low example project score for two credits; and (3) no example score for two credits. For all participants, the example interventions were presented in the order of the current Envision rating system, rather than randomized by participant. The reason for testing each intervention is as follows:
- (1)
A high example project score should act as a positive role model for current project decision-making. Participating engineers may recognize a higher level of sustainable design is possible and work to achieve it.
- (2)
A very low example project score may have the opposite effect as the positive role model.
- (3)
The results from the credits with no example score can teach us about the amount of details required for a role model project to have an effect on decision-making.
After completing the Envision case study, the participants were directed to an online survey to self-report on details of their decision-making. The training session concluded with a group discussion about Envision, and its role in infrastructure design.
4. Results
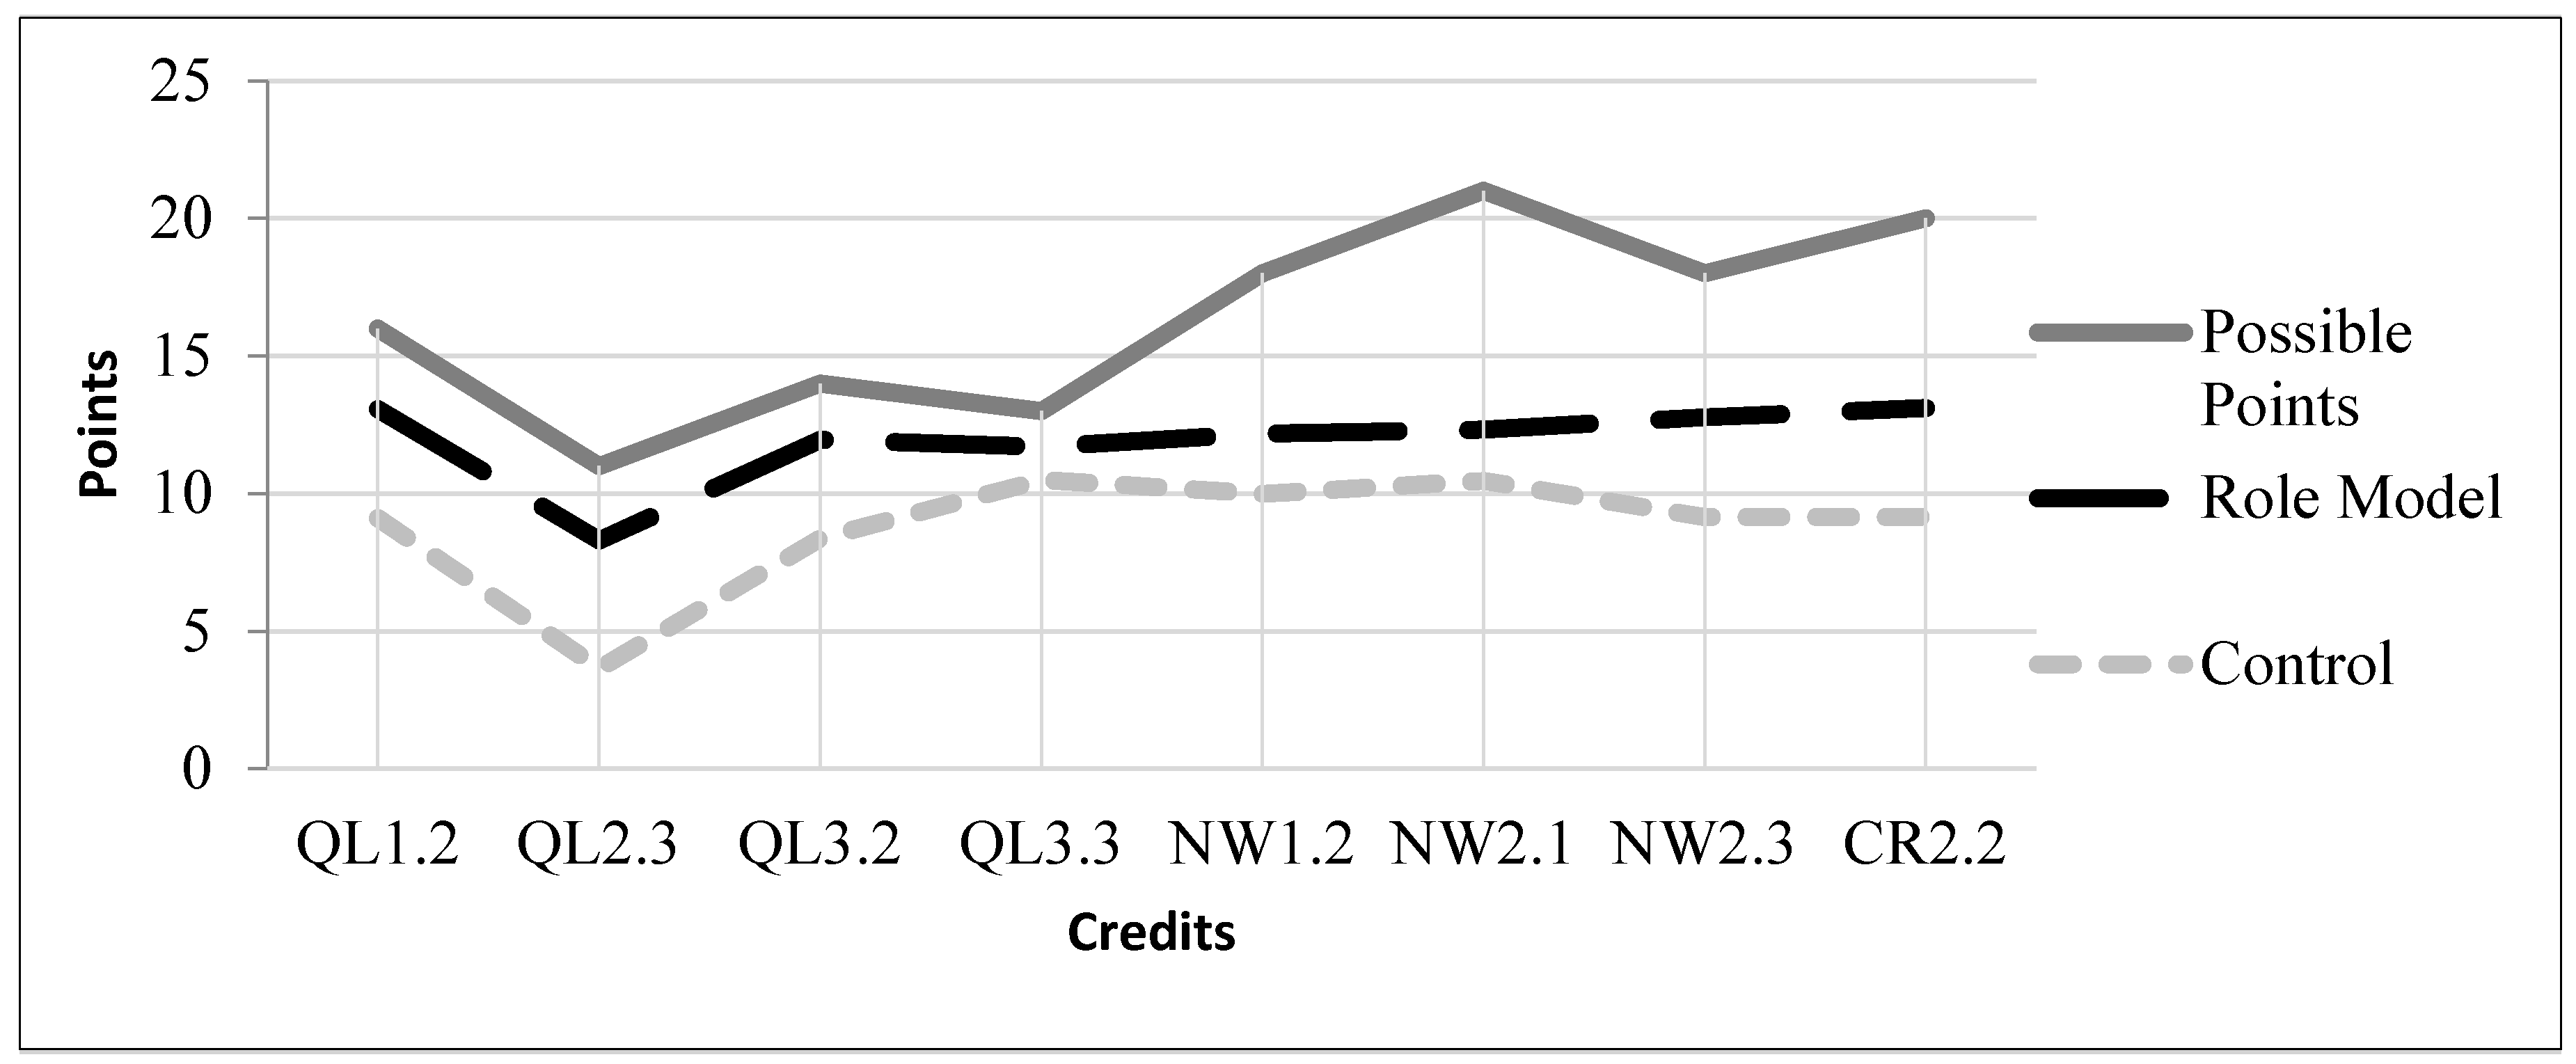
Given a positive role model project, meaning an example project with a high Envision score, engineering professionals (
n = 27) achieved significantly (
p = 0.003) more points than engineers without a role model project (
n = 26). The group of engineers given the positive role model scored, on average, 30% more points than the control group and achieved more points on all eight credits, as shown in
Figure 1. The difference for six of the eight credits meets the 95% confidence interval. We can therefore reject the null hypothesis that the role model has no influence on decision making.
Figure 1.
Participants achieve more points when presented with a positive role model project.
Figure 1.
Participants achieve more points when presented with a positive role model project.
Put another way, the group of engineers with the positive role model project achieved 74% of the possible points compared to the control group, which achieved 54%. This is equivalent to two levels of certification in Envision, from a silver certification to a platinum one, for example.
An example credit with a score of zero points is defined as a negative role model. Results for these credits (QL1.3 and NW1.5) are listed in
Table 1. Our results indicate that participants given a negative role model achieved fewer points on average than the control group, which had no role model. Again, we reject the null hypothesis because in both credits the role model group scored less than the control group. These results are less conclusive than the positive role model because only two credits with a zero score were included in the study and only one of two is within our confidence interval. The variability in low achieving credits, and in the eight high scoring examples, is expected because each credit measures a different aspect of sustainability and some are more difficult or easy to achieve.
Our third hypothesis was that the positive “spill over” effect from the general information about the role model project would motivate participants to make decisions that led to higher achievement compared to the control group even when no credit detail was provided, which was the case for credits NW3.4 and CR1.1. The results do not support this hypothesis, rather the opposite was observed. When credit level details were not provided, participants achieved 35% fewer points than the control group. As with the low achieving role model credits, we cannot reject the null hypothesis because the results indicate a negative effect may occur when withholding information about a previously mentioned role model. Possible explanations for this are provided in the discussion.
Table 1.
Participants’ level of achievement is shaped by role model examples.
Table 1.
Participants’ level of achievement is shaped by role model examples.
| Credit | Example Project | Control | Role Model | Percent Difference | p-value |
|---|
| QL1.2 | 16 | 9.12 | 13.07 | 35.65 | 0.006 |
| QL1.3 * | 0 | 5.35 | 3.22 | 49.64 | 0.03 |
| QL2.3 | 11 | 3.65 | 8.3 | 77.73 | 0.000 |
| QL3.2 | 14 | 8.38 | 11.96 | 35.15 | 0.002 |
| QL3.3 | 13 | 10.50 | 11.7 | 10.81 | 0.04 |
| NW1.2 | 18 | 10.00 | 12.19 | 19.74 | 0.09 |
| NW1.5 * | 0 | 4.96 | 4.15 | 17.81 | 0.32 |
| NW2.1 | 21 | 10.46 | 12.33 | 16.40 | 0.18 |
| NW2.3 | 18 | 9.15 | 12.78 | 33.06 | 0.01 |
| NW3.4 * | - | 9.58 | 6.37 | 40.22 | 0.03 |
| CR1.1 * | - | 9.23 | 6.74 | 31.19 | 0.07 |
| CR2.2 | 20 | 9.15 | 13.11 | 35.54 | 0.03 |
| Totals—High Score | 70.42 | 95.44 | 30.17 | 0.003 |
| Totals—Zero Score | 10.31 | 7.37 | 33.24 | 0.25 |
| Totals—No Score | 18.81 | 13.11 | 35.70 | 0.15 |
Results summarized in
Table 1 were calculated using a Mann Whitney U test for individual credits and a two-tailed student t-test for the total scores. The variance between participants is similar in the role model group (
SD = 27) and in the control group (
SD = 30).
Cumulative results for each group are normally distributed, which is a requirement to perform a t-test. Possible outliers in the results were also considered—defined as a cumulative score outside two standard deviations from the mean. None of the results fell outside this boundary.
Normal distribution was tested for all credits even though this is not a requirement for the Mann Whitney U test. We plotted frequency diagrams for all credits and visually checked for normal and non-normal distribution. For the role model group, credits NW1.5, NW2.1, NW2.3, NW3.4, and CR1.1 are normally distributed. For the control group, credits QL2.3, NW1.5, CR1.1 and CR2.2 are normally distributed. Credits with non-normal distribution were generally less variable. Participants more frequently chose one or two levels achievement rather than normal distribution across five levels of achievement. For example, 19 engineers from the role model group chose the highest restorative level of achievement for QL1.2.
To replicate the reality that not all Envision credits apply to every project, our study participants had the option to select credits they believed were not applicable to the case project. The frequency with which credits were selected as not applicable is listed in
Table 2. The level of the example project score is shown with H meaning high, L meaning low, and N meaning no example. The role model group more frequently selected credits as not applicable. The credits the role model group believed were not applicable have an asterisk in
Table 2. Generally, these were credits for which the example project either performed poorly (zero points) or for which the score was withheld.
In fact, when information about a credit was withheld from the role model group, participants were twice as likely to indicate the credit as not applicable for their project. The number of credits selected as not applicable is relatively small compared to the sample size. In both the control and role model groups, the majority of participants believed all credits were applicable to the case study project. When a high scoring example project was provided, more participants agreed the credit was also applicable to their project.
Table 2.
Frequency with which credits were selected as not applicable.
Table 2.
Frequency with which credits were selected as not applicable.
| Credit | QL | NW | CR |
|---|
| 1.2 | 1.3 * | 2.3 | 3.2 | 3.3 | 1.2 | 1.5 * | 2.1 | 2.3 | 3.4 * | 1.1* | 2.2 |
|---|
| Example Project Score | H | L | H | H | H | H | L | H | H | N | N | H |
| Control | 1 | 2 | 4 | 1 | 0 | 0 | 6 | 3 | 1 | 0 | 4 | 2 |
| Role Model | 0 | 5 | 2 | 0 | 0 | 0 | 6 | 2 | 0 | 7 | 10 | 0 |
The engineering professionals from both the control and role model groups were redirected to an online post-task survey after completing the Envision rating activity. Participants in the role model group were asked to select their level of agreement (Strongly Disagree- 0- 1- 2- 3- 4- 5- Strongly Agree) with the statement: When considering the possible levels of achievement for each credit, I began with the level of achievement from the example project and then moved up or down.” The control group question stated: When reviewing the levels of achievement, I began with the description for “improved” and then moved on to “enhanced”, “superior”, and “conserving”, in that order.” 14 of 27 of participants from the role model group agreed or strongly agreed. 11 of 26 were neutral. 20 of 26 participants from the control group agreed or strongly agreed. While the questions are not exactly the same because the control group did not have an example project to compare, we analyzed responses using a Mann Whitney U test and found statistically significant differences (p = 0.025) between the two groups.
Responses to open-ended questions also indicate different approaches to decisions. One of our questions asked: “Think back to a memorable Envision credit. What level of achievement did you pick and HOW did you decide this level of achievement was acceptable?” Responses from the role model group include: “Restorative, which I decided was acceptable based on the example project and what I though could be achieved,” and “Started with the example and then based decision on previous experience.” Seeing how another engineering team was able to incorporate aspects of sustainability into their design also appeared to influence some participants, for example, one who reported: “I chose restorative for the light minimization credit. The example showed that this had already been achieved, meaning that it was realistic/possible to gain this credit.” Such responses suggest that the positive role model project directs attention to the higher levels of achievement that are possible.
We also asked the role model group if they believed the example project motivated them to achieve a higher level of sustainability, and we asked the control group if an example high-scoring Envision project would have motivated them to achieve a higher score. The majority of participants from the role model group agrees (14/27) or strongly agrees (2/27). A similar number from the control group also agreed (12/26) and strongly agreed (4/26).
Taken together, our results indicate that a positive, high scoring role model project can sway engineering professionals to achieve a higher level of sustainable design. We measured a 30% increase in achievement among participants given an example high scoring project. A negative example likely has an analogous effect, decreasing achievement. Participants shown an example project that scored zero points scored fewer points than the control group. Withholding information also appears to negatively affect sustainability outcomes, so the more detail we can provide about high-scoring projects, the better.
These modifications shaped the decision making process itself. Participants in the role model group were more likely to start with the level of achievement of the example project. Most participants believed the role model project did (or would) help them make design decisions.
5. Discussion
Previous research suggests satisfaction from achieving various goals and levels of achievement will influence choice (e.g, [
17]). So, seeing a role model perform well may increase an observer's perceived probability of successfully reaching a similarly difficult level or goal. Rating systems like Envision provide a benchmark for design teams to measure performance, which is an important construct for signaling goals, values, and intentions of the designers [
18,
19]. Modifying these rating systems to include how other project design teams were able to accomplish high levels of sustainability can motivate designers to meet similarly high goals. As noted in the survey responses, engineering professionals make decisions in reference to others. Providing an exemplary project encourages them to start with high levels of achievement.
Withholding information can have a negative effect and role model projects that perform worse than what the current engineer is considering may reduce motivation to achieve more.
Dependency on the information is a possible explanation for why the role model group performed below the control group when credit level detail was withheld. Perhaps taking the information away forced a change in participants’ decision processes and led them to either not make a decision or choose the least effort in these situations. Another possible explanation is that the increased effort to reach a similar high score as the role model on other credits caused these participants to balance their efforts by choosing lower achievement with credits without an example.
Some studies show that a role model has the largest influence on individual’s having little experience with the task at hand [
15,
16]. Following this logic, the role model project would have less influence on the participants in the role model group who had significant experience in the construction/engineering industry. Roughly three quarters of the participants in the role model group reported 5 or more years of experience in the construction/engineering industry via the online post-task survey (the average amount of experience across both groups was 10 years). Despite this high level of experience among the group, the role model project led to on average, 30% more points than the control group and achieved more points on all eight credits. Our results show that experienced professionals can still be influenced by a role model project. Future research might ask whether the participants are experienced with sustainability technologies or rating systems to determine the affect this more specific experience has on role model project influence.
Indeed, such nuances stress the need for future multidisciplinary research in related areas. Behavioral scientists, psychologists, and neuroscientists are trained to deal with the considerations we are describing, and many more. However, these groups likely need help from domain-specific researchers (in this case infrastructure) to understand the situational context in which such decisions are made.
There are several notable limitations to our study. First, participants knew this was a training session and they were making decisions about a one-time hypothetical assignment (however, when asked if they believed an engineering team could achieve their recommendations 80% (42/53) strongly agreed, agreed or were neutral). Second, engineers were only given a short span of time to make design recommendations on 12 sustainable aspects, which forced more accelerated decision-making than in real-world design projects. Third, we are not reporting effects measured over the entire design-build process. Rather we isolated a single decision point to empirically measure the effects of an intervention. Fourth, because the training session was about Envision, participants may have been susceptible to social acceptability bias, setting higher sustainability goals than they otherwise would have in order to provide answers that align with the training content. However, any such bias would be constant across the control and experimental group, and therefore not affect our primary conclusions, which are based on differences between the groups. Finally, our results are based on individuals’ use of the Envision system to make tradeoffs between design options. We cannot claim the role model version will similarly influence a team of professionals working together. Future research should investigate the group effects, and the study presented here can serve as comparison.
Regardless of these limitations, the role model project statistically improves consideration for sustainability. And the engineering professionals generally believed their recommendations were obtainable.
6. Conclusions
Possible impacts from this research are substantial. Suppose role models led to 30% better performance on the Envision credit “Reduce Greenhouse Gas Emissions”. Applied to all U.S. infrastructure, this represents a reduction of over 4 billion tons of CO
2 (estimate based on a per-capita carbon footprint of infrastructure of 53 tons [
5] and a U.S. population of 316 million). Considering the successful cash-for-clunkers program invested roughly $3 billion dollars and saved an upward estimate of no more than 30 million tons of CO
2 [
20] adding positive role models to an infrastructure rating system appears relatively promising. And this is just for one of the 60 Envision credits. Positive role models might promise similar gains in the 59 other sustainability outcomes defined by Envision. While Envision is only used currently on a fraction of infrastructure projects, it is rapidly expanding, as are similar rating systems like LEED, in the building industry.
However, if those structuring decisions in the infrastructure development process are unaware of influences like role models, they will miss opportunities to do better, and perhaps worse. LEED, for example, may inadvertently set goals that are too low thus discouraging the ambition needed to achieve sustainability performance that is technically and economically feasible [
21]. There are comparable implications for other infrastructure decision aids such as Building Information Modeling (BIM) and similar design software programs, and building codes.
More sustainable infrastructure promises societal benefits such as decreased energy use and climate changing emissions, as well as lower costs for infrastructure owners and users. The contributions described in this paper are needed to complement what are often more costly investments in technology development.


