Article

The Present and Future Energy Performance of the First Passivhaus Project in the Gulf Region

The Liverpool School of Architecture, University of Liverpool, Leverhulme Building, Liverpool L69 7ZN, UK
*
Author to whom correspondence should be addressed.
Sustainability 2016, 8(2), 139; https://doi.org/10.3390/su8020139
Submission received: 30 December 2015 / Revised: 29 January 2016 / Accepted: 1 February 2016 / Published: 2 February 2016

Abstract

:
With voluntary and mandatory energy performance standards now becoming more common around the world, schemes to develop low energy buildings have become more apparent in developed countries. The Passivhaus standard, established 25 years ago in Germany, is one the most stringent and promising low energy building standards in Europe. It started as a construction concept applied to residential buildings, but has since spread as a voluntary ultra-low energy efficient standard to different parts of the world. Qatar, a member of the Gulf Cooperation Council (GCC) states, announced in 2013 the completion of the first Passivhaus project in the Gulf Region. The current and future performance of the Passivhaus project in Qatar was investigated in this study using current and future climate scenarios. Computer modelling was used to simulate the energy performance of the house and the thermal comfort of the occupants. In addition, on-site measurements were made to corroborate the modelling outcomes. Further, the impacts of climate change on the Passivhaus project was examined, and comparative analyses were undertaken. The findings suggested that the Passivhaus performs well under the current and the future weather data sets. Furthermore, the modelling indicates that the Qatar house is close to achieving the Passivhaus standard.

Graphical Abstract

1. Introduction

As countries develop so their demand for energy increases [1]. In recent years studies have been devoted to assessing global energy demand [2], and the three main sectors that contribute towards energy consumption which are buildings, transport and industry. The United Nation Environment Program (UNEP) identified buildings as the most significant sector in national energy consumption, with a UNEP report indicating that 30%–40% of the world’s energy is consumed within buildings [1,3]. This energy consumption trend is expected to grow even further, with buildings expected to consume 34% more energy globally by 2030. Residential buildings are responsible for around 67% of that increase [4]. Developed countries, in an attempt to control energy consumption and the subsequent greenhouse gas (GHG) emissions, have set a number of energy performance targets, schemes and strategies. The Energy Performance Building Directorate (EPBD), for instance, has issued energy efficiency measures for the built environment, as it requires, for example, EU member states to provide energy performance certification for existing buildings. Other schemes that are accepted internationally include the Building Research Establishment Environmental Assessment method (BREEAM), Leadership in Energy and Environmental Design (LEED) and Comprehensive Assessment System for Built Environment Efficiency (CASBEE) [5]. The Gulf Cooperation Council (GCC) countries (Bahrain, Kuwait, Oman, Qatar, Saudi Arabia and the United Arab Emirates) have similarly started to establish rating systems and energy assessment tools. Mandatory new build energy efficiency codes have been established in four of the six GCC member states, but these codes are only a few years old, and are still subject to further developments [6]. Qatar and the United Arab Emirates (UAE) are leading the way towards sustainability, as institutions and organizations have been established to promote research in the areas of energy and climate change [6,7]. Research in this area at this stage is vital, as more energy performance lessons have to be learned and applied within the built environment.
In Europe the Passivhaus approach has been found to be one of the most promising standards in terms of achieving low energy consumption and a comfortable indoor environment [8]. This study focuses on evaluating the validity of applying the Passivhaus concepts in the hot and arid region of the GCC and, in particular, Qatar. A key advantage of this study was that access was provided to two neighbouring, near-identical, full scale villas. One villa was constructed to current Qatari building standards whilst the second villa was built according to the Passivhaus standard. Real time monitoring data, in addition to computer simulation outcomes, were used to test the performance of the Passivhaus villa, both now and under future climate change scenarios.

1.1. The Passivhaus Standard

The Passivhaus standard was established 25 years ago as a building concept for residential buildings in Germany. The success that followed the reduced energy and high comfort levels in the first projects encouraged the spread of the standard to different parts of Europe. The Cost Efficient Passive Houses as European Standards (CEPHEUS) and Passive-On projects were carried out in different countries across Europe, including Italy, UK, Spain, Switzerland, Austria, Sweden, Portugal, Germany and France [8,9]. The purpose of the two projects was to test the feasibility and validity of the Passivhaus standard in different climates within Europe. In the CEPHEUS project evaluation of more than 100 Passivhaus buildings, mostly situated in Central and Northern Europe (Germany, Austria, Sweden and Switzerland), was carried out. The findings suggested that the market for Passivhaus should not just be limited to Central Europe, and that the ultra-low energy standard could be a feasible option in different climates [9]. Although the initial developments resided within Central and Northern Europe, the Passive-On project extended the research to include warmer countries in Europe. The Passive-On study was one of the first projects that showcased the validity of the Passivhaus standard in warmer climates. The study even forecast a number of issues related to Passivhaus criteria for warmer climates. These included the introduction of a limit for energy demand for summer cooling, a relaxed infiltration rate and an indoor comfort temperature that coincided with adaptive thermal comfort standards. The Passive-On demonstrated the feasibility of the Passivhaus standard in Southern Europe and might be responsible for the extending of the standard spread to other parts of the world [8]. The Passivhaus Institute continued the upgrading and development of the Passivhaus criteria to allow for applications in a variety of climatic regions. The software for assessing the performance of a proposed Passivhaus—the Passive House Planning Package (PHPP)—provides evidence of this development process. Further considerations and updates are included with every new version, such as the addition of cooling sheets and renewable energy calculations [10,11]. In December 2014, the Passivhaus Institute announced that the floor area of certified Passivhaus buildings had reached the one million square metre mark; this includes retrofits and new build from different locations around the world [12].
The approach of the Passivhaus standard it to set very clear performance targets for insulation values, air tightness and energy consumption (see Table 1), and once followed the outcomes have proven to be satisfactory and closely aligned with the standard’s promise of providing a low energy building with a comfortable interior.
Table 1. Passivhaus Standard Requirements.
CriteriaRequirement
Heating DemandSpecific space heating demand ≤ 15 kWh/(m2a) Or alternatively: heating load ≤ 10 W/m2
Cooling Demand (including dehumidification)Total cooling demand ≤ 15 kWh/(m2a) + 0.3 W/(m2aK).DDH Or alternatively: cooling load ≤10 W/m2 AND cooling demand ≤4/(kWh/m2aK)× ϑe + 2 × 0.3 W/(m2aK) × DDH – 75 kWh/(m2a) but not greater than: 45 kWh(m2a) + 0.3 W/(m2aK) × DDH where ϑe is the annual mean outdoor temperature in °C and DDH is the Dry Degree Hours (time integral of the difference between the dew-point temperature and the reference temperature of 13 °C throughout all periods during which this difference is positive)
Total Primary EnergyEnergy demand ≤ 120 kWh/(m2a)
Air TightnessPressure test result, n50 ≤ 0.6 h−1
Thermal ComfortThermal comfort must for all living areas year-round with not more than 10% of the hours in any given year over 25 °C

1.2. Thermal Comfort

The importance of evaluating and measuring indoor thermal comfort today is not only related to achieving thermal satisfaction, but also to moderating energy use and enhancing indoor air quality [13]. Thermal comfort can be defined as, “the condition of the mind in which satisfaction is expressed with the thermal environment”. Factors that affect thermal comfort in any given space can be classified in to three main categories: environmental, personal and other contributing factors. Table 2 displays the three categories in further detail. The two most well-known thermal comfort models are the heat balance model and the adaptive model [14].
Table 2. Factors affecting thermal comfort.
EnvironmentalPersonalContributing Factors
Air temperatureMetabolic RateFood and drink
Air movementClothingBody shape
HumidityState of healthSubcutaneous fat
RadiationAcclimatizationAge and gender
The heat balance model can be traced back to around a hundred year ago, when the concept of a human body’s heat exchange with its surroundings was first introduced. This area of study culminated in a series of studies by Fanger that led to Fanger’s heat balance model, as it is known today [15]. Fanger’s model is based on steady state laboratory experiments that involved the manipulation of thermal comfort factors. Personal factors, such as clothing and metabolic rate, might remain constant whilst environmental factors were altered to assess comfort for a specific combination of factors. Fanger’s work led to the concept of the Predicted Mean Vote (PMV) and Percentage of People Dissatisfied (PPD) thermal comfort indices [16]. Fanger’s model has been found to be better suited to controlled environments, such as mechanically conditioned commercial buildings. It tends to over-estimate thermal comfort requirements for dwellings and free running buildings. The adaptive model was introduced as a result of discrepancies found between the steady state thermal sensation vote and actual field surveys’ participant votes. Field studies were carried out by a number of researchers and it was found that in free-running buildings people were more accepting of a wider range of indoor temperatures for comfort. Adaptation was the key aspect to this higher tolerance, as people tended to adapt to any discomfort by taking certain actions, such as changing their clothing level, moving location or operating windows and blinds [13].

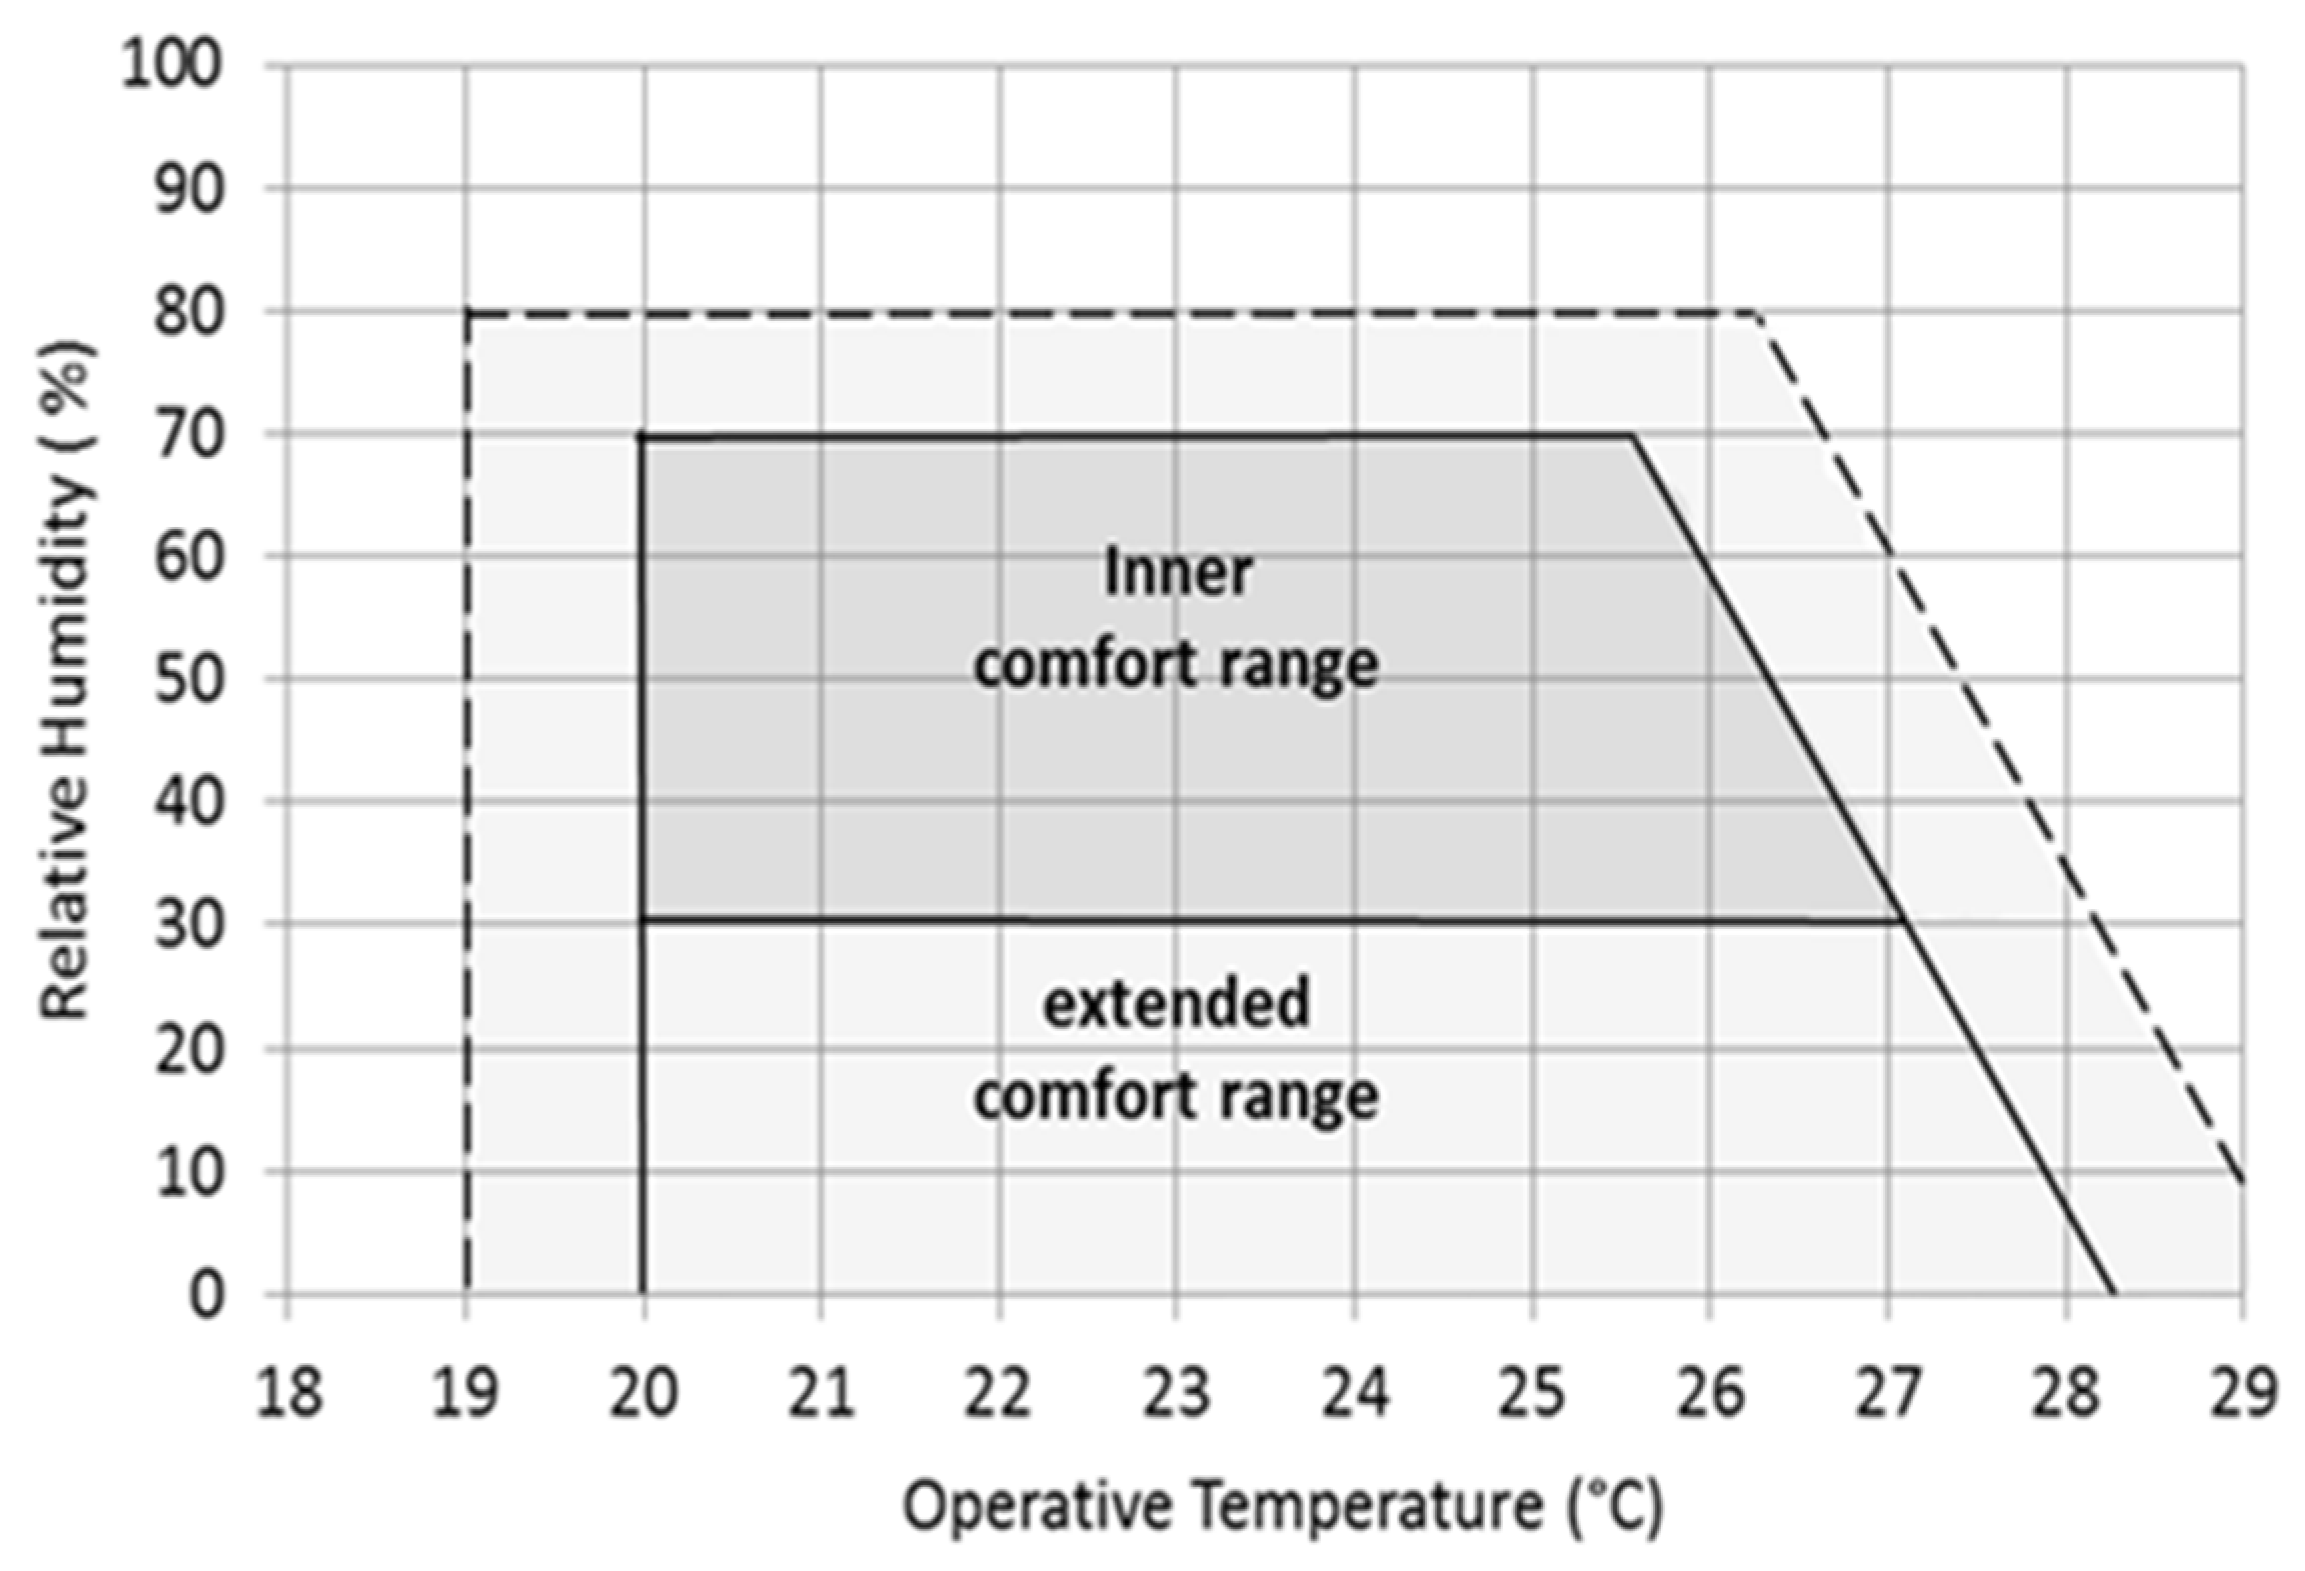
1.3. Thermal Comfort Indices and Graphs

PMV and PPD indices are the most commonly parameters used to estimate thermal sensation in the built environment. The ASHRAE and ISO thermal sensation seven point scales are used to predict the comfort vote. The scale represents the following votes; (−3) cold, (−2) cool, (−1) slightly cool, (0) neutral, (+1) slightly warm, (+2) warm and (+3) hot. A number of building simulation tools makes use of these scales to measure thermal comfort, such as IES, ESP-r, TRNSYS and IDA Ice [17]. In addition, thermal comfort has been assessed in simplified approaches as an expression of two variables—air temperature and relative humidity. Graphical representations can presents thermal comfort as a combination of acceptable temperatures and relative humidities, examples being Olgyay’s bioclimatic chart and Givoni’s building bioclimatic chart [18]. A similar graphical approach is used by the Passivhaus Institute (referred to as Schneider’s comfort chart in this article) to assess thermal comfort in occupied spaces (see Figure 1). The annual hourly operative temperatures and associated relative humidity levels are plotted against each other. A central shaded area represents the inner comfort zone, with a range of operative temperatures between 20.0 and 25.5 °C, and 70% relative humidity as the upper limit. An extended comfort zone is also included to allow for an additional increase in indoor operative temperatures [19].
Figure 1. Schneider’s comfort chart.
Sustainability 08 00139 g001

1.4. Climate Change

Growing evidence indicates that climate change will be unavoidable, based on observations and modelling of parameters such as air temperatures, sea levels and greenhouse gas emissions. Many current studies focus on the impact of climate change on different domains, such as food, water, energy, health and shelter, concluding with a number of mitigation and adaptation polices [20]. Global climate change will have environmental, economic and health impacts on Qatar and the Gulf Cooperation Council (GCC) region. Existing problems of water scarcity and food security will be exacerbated, together with impacts on human health, economic development and the environment. The importance of fossil fuels to Qatar and other GCC countries makes them economically exposed to global policies to reduce greenhouse gas emissions [7]. For the built environment, anticipated increases in air temperatures may add further demands on mechanically air-conditioned buildings, resulting in an increase in energy use. Additionally, thermal comfort levels in free-running buildings may be jeopardized by increased or decreased air temperatures [21,22].

1.5. Future Weather Files

The impact of climate change on the built environment is being addressed today through the use of building energy simulation (BES) tools [23,24]. As countries have become energy efficient, building regulations state that new builds should fulfill certain energy targets, thus the use of BES tools have become a common practice during the design stage [25]. Most recently, with the growing awareness of the potential risks from climate change, building simulation tools are used to predict and evaluate the future performance of buildings. BES tools require hourly weather data sets to perform the energy and thermal comfort analysis. The most commonly used weather file formats are the Typical Meteorological Year (TMY2) and EnergyPlus Weather (EPW) file format. Weather files can be readily downloaded via a number of websites, such as the Energy Efficiency and Renewable Energy (EERE) website [26]. Future weather data files, on the other hand, are not readily available and need to be acquired through various means, such as statistical extrapolation, stochastic weather models and regional and global climate models [27]. Hourly future weather files can be obtained through weather generator tools such as Meteonorm [28,29] or the climate change world weather file generator (CCWorldWeatherGen) [30].

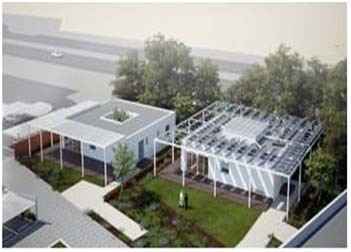
1.6. Qatar Passivhaus Project

Qatar, in its quest for innovation and sustainable living, launched the first Passivhaus project in the Gulf region in 2013. The idea of the project was prompted at a green building conference in 2012. The concept was raised during the conference between Ahmed Al Abdulla, of BARWA Real Estate, and Alex Amato, Head of Sustainability at Qatar Green Building Council (QGBC) Soon after the conference the design of the project started, and the villas were officially opened in April 2013. The project is experimental in nature; it is composed of a test and base villa, each of around 200 m2 in floor area. The test model (PHV) was built according to the Passivhaus construction standards and the base model (STV) was built according to the conventional practices in Qatar. The houses were accessible to researchers and interested bodies for research purposes [31,32].
Qatar’s Passivhaus project is located within a new development (Barwa city) situated 18 km south-west of the capital Doha—see Figure 2a,b. The 1.35 million square metre development provides a sustainable living style for a community of over 25,000 people, with all necessary amenities, such as schools, retail outlets, bank, health centre and mosques [33,34].
Figure 2. (a) Barwa city location (b) Barwa city aerial view.
Sustainability 08 00139 g002
The project is composed of two identical villas (Figure 3a), one constructed following the Passivhaus standard requirements and the other built according to business as usual construction methods in the country. The single floor villas are designed to house a small family of 4–5 members, and comprise a living/dining space, a master bedroom and two single bedrooms, and in addition other supporting facilities, such as toilets, storage spaces and a utility room (Figure 3b). The architectural features of the region were respected in the design of the villas, as a central glazed courtyard forms the heart of the design with all the living spaces accessible around it. A colonnade system fully surrounds the outer periphery of the PHV and partial periphery of the STV. The colonnaded area provides shading for the living space glazed walls and expands the interior of the houses to the outdoors. The privacy aspect of the private quarters was further respected through the implementation of movable wooden screens with geometrical motifs that could obscure the view towards the public space through the glazed central courtyard.
Figure 3. (a) The Passivhaus villa PHV (upper villa) and the Standard villa STV (lower villa); (b) typical villa layout.
Sustainability 08 00139 g003

1.7. Qatar’s Climate

Qatar, according to the Köppen-Geiger climate classification system, lies within the hot dry arid zone, where annual precipitation is below 270 mm and the mean annual temperature is above 18 °C [35]—see Figure 4. Two distinct seasons can be noted in Qatar, a long, hot summer and a short, mild winter. The mean annual temperature is around 27 °C. The hottest month is July, when the temperature can reach up to 45 °C, and the coolest month is January, when the temperature can drop as low as 10 °C. The average annual relative humidity is around 56%, with a high of 75% and a low of 34% (Figure 4). The country receives a small amount of rain, less than 100 mm annually, but experiences high levels of solar insolation (typically above 5 kWh/m2/day) [36].

2. Research Methodology

The performance of the first Passivhaus building in the Gulf region was examined in this research, with the focus on three main aspects: the thermal envelope performance, the energy use and the thermal comfort for current and future climate scenarios. The two full scale villas, the Passivhaus building, and an equivalent standard building, were built next to each other outside the Qatari capital of Doha. Models of these two buildings were created using the software IES, which is an innovative 3D sustainable analysis software used to design and model the built environment. Dynamic simulation through the IES’s module Apache-sim is based on first principles of mathematical modelling of heat transfer processes. IES has been validated and tested against a number of standards, such as ASHRAE 140, USGBC and BEST TEST [37,38]. IES was chosen over many other BES tools because of its user-friendly interface, interoperability and proven validity. The exact configuration (building materials, cooling systems, lights and appliances) of the two villas, the Passivhaus villa (PHV) and the Standard villa (STV) were replicated and modeled in IES, with a presupposed occupancy schedule. A Doha (Qatar) weather file was acquired through the climate-modelling software Meteonorm 7. Meteonorm is a comprehensive meteorological reference tool that provides weather data in different formats for almost any location around the world [28]. The weather file was further analyzed using Climate Consultant 6.0, which allows graphical representation of the weather data in addition to the examination of indoor comfort strategies. Climate Consultant is a graphic based tool developed by the University of California, Los Angeles (UCLA) energy design tools group [26,39]. Future weather files for 2080 were obtained through the Climate Change World weather generator (CCWorldWeatherGen) and were similarly analyzed using the Climate Consultant tool. CCWorldWeatherGen was developed by the Sustainable Energy Research Group (SERG) at the University of Southampton [30]. It is a Microsoft Excel-based weather generation tool that provides future weather data for any site provided a valid current weather file is available.
Real time physical data were collected from the two houses in Qatar. Three sets of energy meter readings over various time periods from the STV and PHV were made available for this research. In addition, HOBO data loggers, that recorded indoor temperature at ten minutes intervals, were placed in the occupied spaces, which included the living and bedroom spaces of both villas. On-site measurements were mainly used to validate the two IES models’ predictions, reducing the amount of uncertainty associated with the simulations, and providing further confidence to perform the climate change impact study. Statistical analysis and interpolations were used whenever needed to replace any missing real time data. Finally, comparative analyses were conducted to evaluate the performance of the PHV against the STV and against the Passivhaus standard, both for current and future weather scenarios.

3. Results

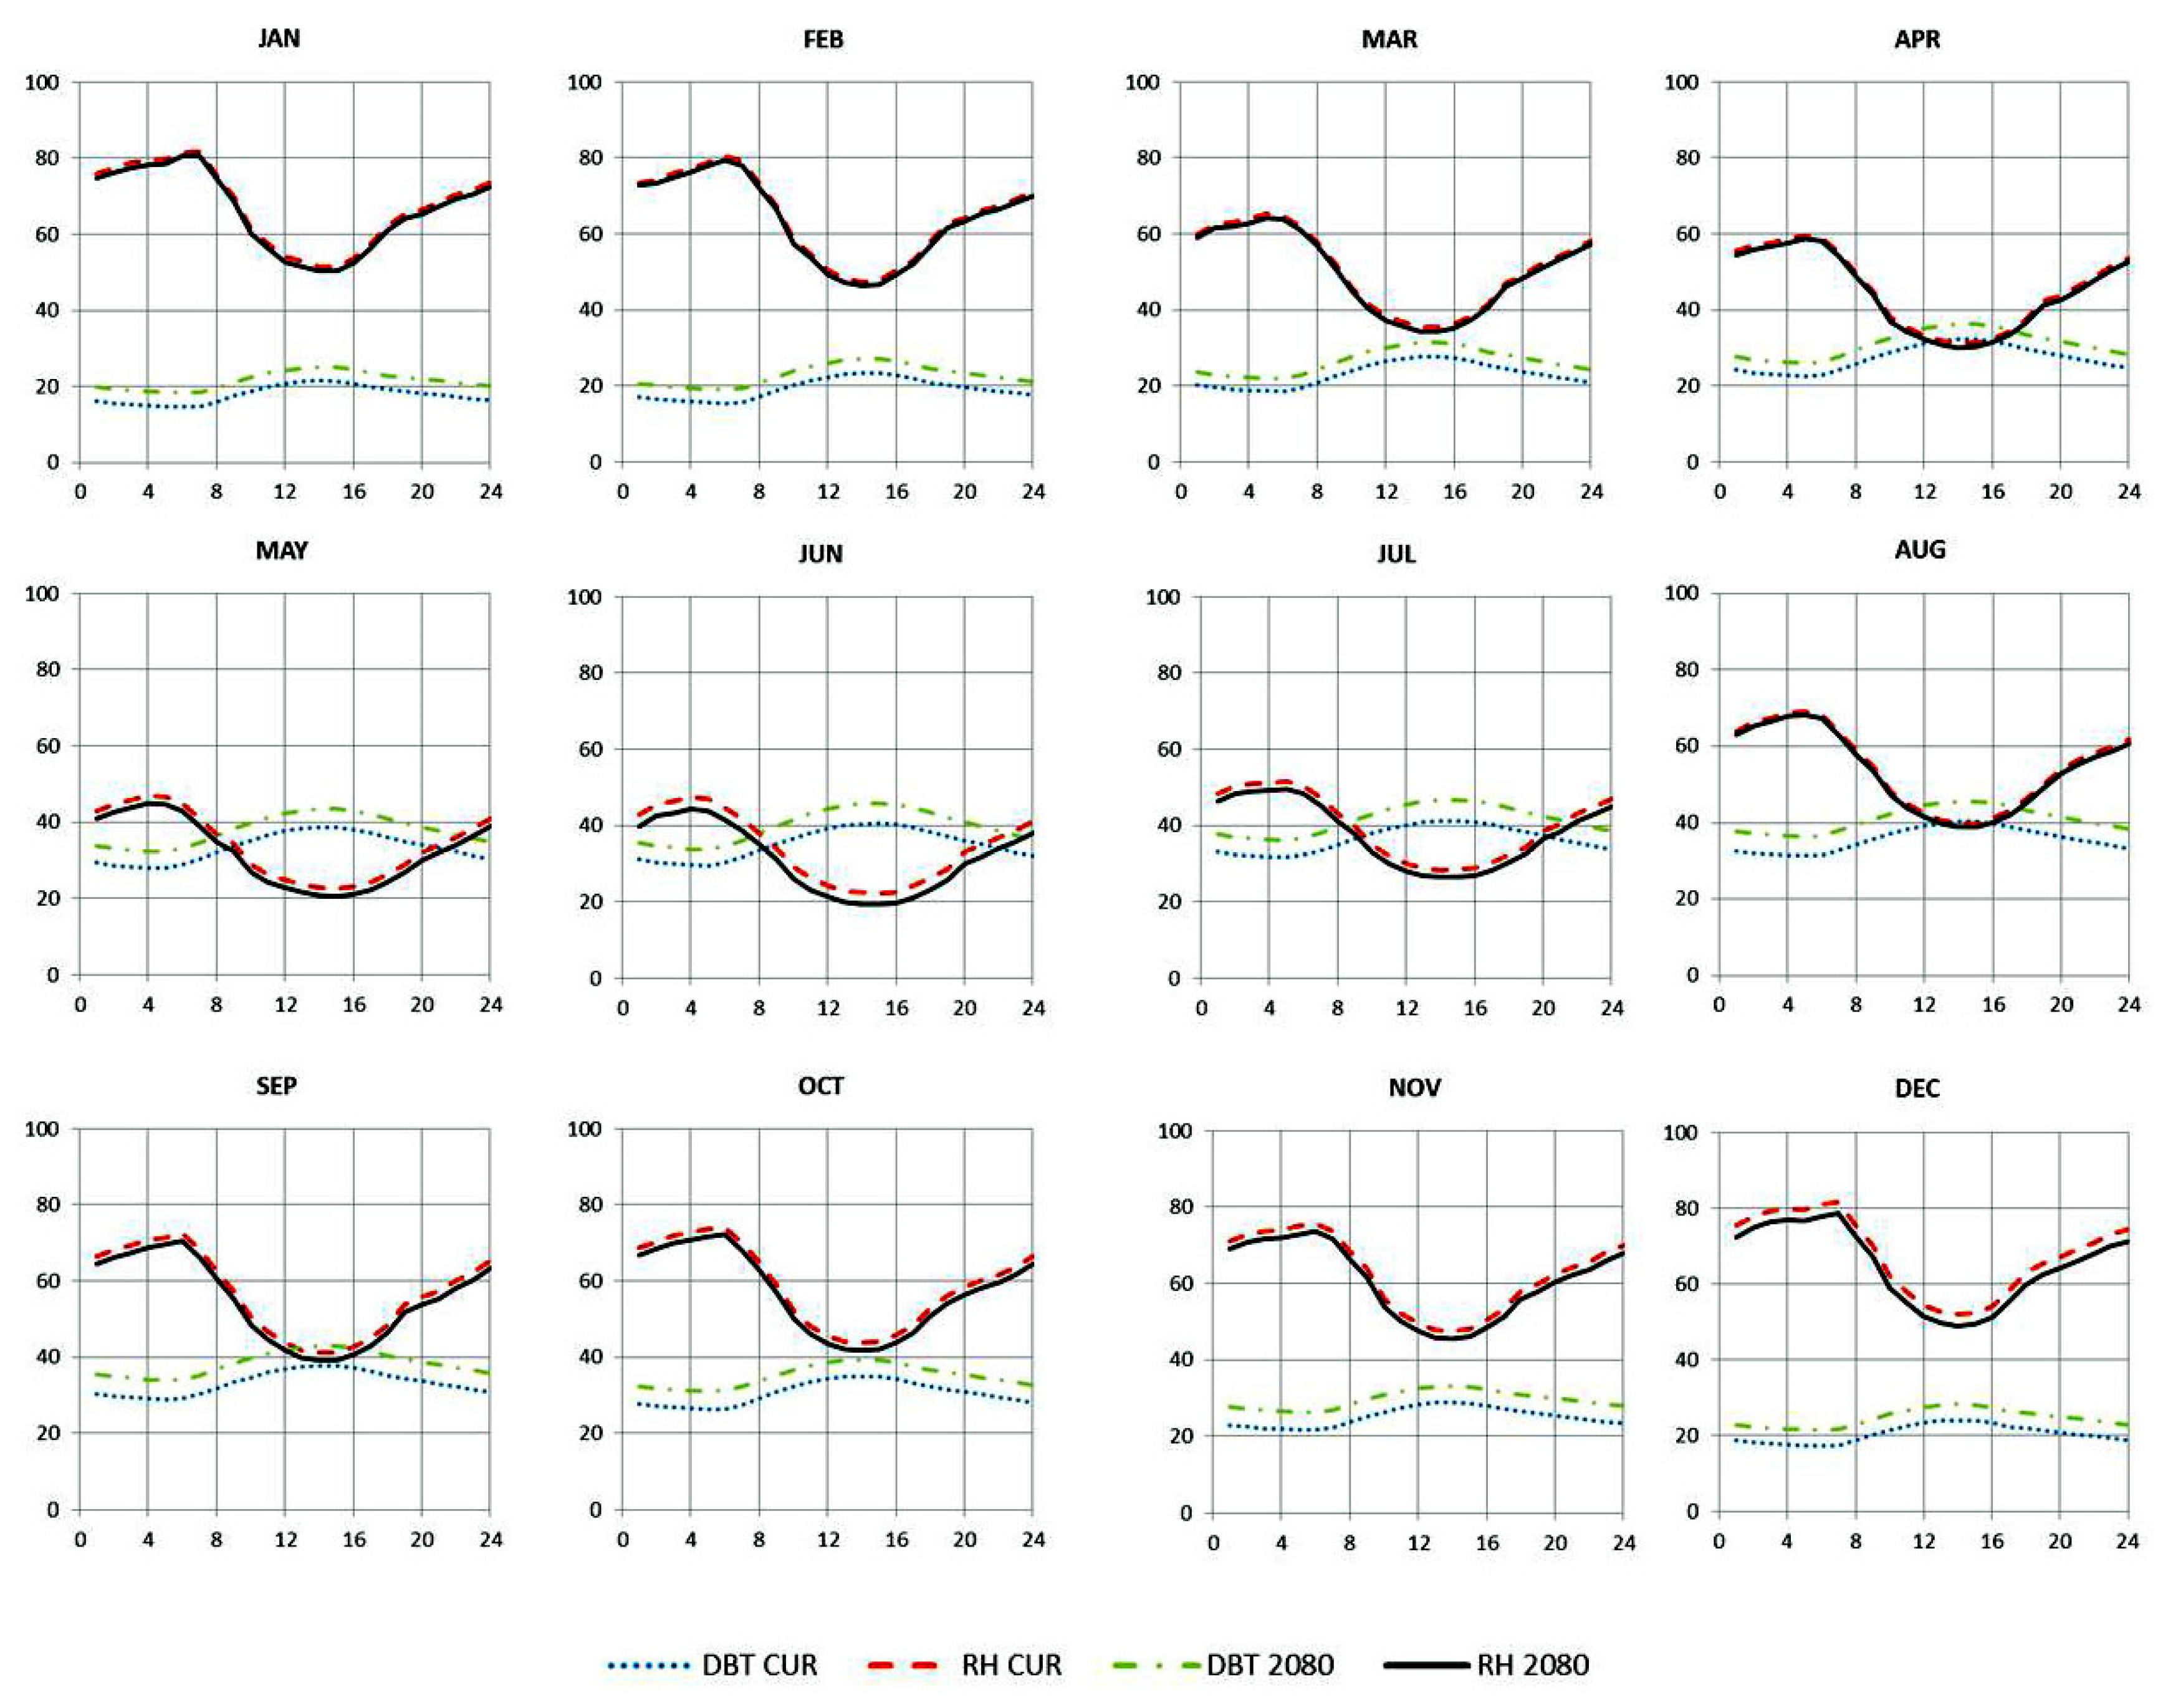
3.1. Qatar Morphed Weather Data CCWorldWeatherGen Was Used to Morph the Current Historical Weather Data Set into the Projected 2080 Forecast

CCWorldWeatherGen incorporated the use of an emissions scenario developed by the Intergovernmental Panel on Climate Change (IPCC) called A2, which is at the higher end of the emissions scenarios (but not the highest) [40]. This was used because it represents a challenging future weather environment for the Qatar Passivhaus. Figure 4 displays the 2080 dry bulb temperature and relative humidity forecast. The average annual air temperature is predicted to be around 32 °C with an annual relative humidity level of 51%. By comparing the two weather sets it can be seen that climate change impacts are more evident during the hottest months (May–September).
Figure 4. Current and future hourly dry bulb air temperature and relative humidity for Doha.
Sustainability 08 00139 g004

3.2. PHV and STV Technical Features

Although the two villas were identical in their layout, the construction materials, cooling system, lighting and appliances were not. As a consequence of constructing the PHV model according to the Passivhaus standard the PHV, compared to the STV, was upgraded in many aspects. The PHV is a fully insulated building, with minimal air leakages and thermal bridges. Table 3 summarizes the PHV and STV building materials. In addition, the PHV has been upgraded to include the following: (i) a high efficiency cooling system and heat recovery ventilation unit; (ii) solar water heating; (iii) energy efficient lighting; (iv) a 220 m2 photovoltaic array mounted on its roof; and (v) a grey water system.
Table 3. Summary of PHV and STV building materials.
ConstructionPHVSTV
Wall200 mm block work + 380 mm Polystyrene layer300 mm block work + 50 mm cavity in between
Roof200 mm Cast concrete + 380 mm Polystyrene layer200 mm Cast concrete + 100 mm Polystyrene layer
Floor250 mm Cast concrete + 200 mm Polyfoam layer250 mm Cast concrete
Glazed SurfacesTriple glazing—6 mm clear and coated glass—double 12 mm cavityDouble glazing—6 mm clear float glass—single 12 mm cavity
The PHV thermal transmittance rates were designed to meet the Passivhaus standard and even exceed them in some cases. Table 4 compares the PHV and STV U-values against the Passivhaus standard.
Table 4. PHV and STV U-values (W/m2K).
ConstructionPHVSTVPassivhaus Requirement
Walls0.0841.310.10–0.15
Roof0.0840.300.10–0.15
Floor0.110.500.10–0.15
Glazed surfaces1.112.610.85
The research outcomes were classified into three sections; the first was an investigation of the thermal envelope performance (TEP), the second related to energy use, and the third to thermal comfort. In each section the PHV vs. the STV performance is displayed for both the current and future climates. The thermal envelope performance assessment used modelling by IES to examine the indoor temperatures of the two villas while the mechanical cooling option was switched off. This assessment measured the effectiveness of the thick insulation layer that encapsulates the PHV. For the second analysis the energy use was examined first by conducting a comparative analysis between the current actual and simulated total energy usages. This was an essential task to demonstrate the accuracy of the IES models. This would also allow further confidence during the modelling of the possible future energy use forecast. Finally, thermal comfort was measured by using both the ASHRAE seven point scale and Schneider’s comfort chart. The IES VistaPro application provided PMV values for the selected living and sleeping spaces, provided that the comfort setting in the VistaPro toolbar was accessed first and edited according to the required activity and clothing level and nominal airspeed for the given project. IES was also consulted to obtain the annual hourly operative temperatures and relative humidity levels to be plotted onto Schneider’s comfort chart. Additionally, a comparative analysis was conducted to assess the reliability of IES in predicting the indoor air temperatures compared to the actual indoor air temperatures collected by the HOBO loggers.

3.3. Thermal Envelope Performance (TEP)

The TEP was assessed by examining the operative temperatures in the living/dining space (LIV) and one of the bedroom spaces (BR) in the PHV and STV while mechanical cooling was switched off. This provided an assessment of the thermal envelope’s efficiency in the PHV and the high level of insulation incorporated in to its design. The results are displayed in Figure 5 and Figure 6. Figure 5 shows the present time mean monthly operative temperatures and mean outdoor dry bulb temperature (DBT) for the standard and Passivhaus villas. Figure 6 displays the same parameters for the future weather scenario.
For both current and future climates Figure 5 and Figure 6 show that temperatures in the living room and bedroom in the standard villa, with no mechanical cooling switched on, will tend to be above the outside temperature—typically by 1 °C to 3 °C for current weather and by 3 °C to 5 °C for the 2080 scenario. The building’s envelope is offering little thermal protection from the external environment. Conversely, the highly insulated envelope of the Passivhaus villa is keeping the interior cooler than the external temperature—typically by 2 °C to 6 °C for current weather and by 2 °C to 8 °C for the 2080 scenario.
Figure 5. The STV and PHV TEP for current weather for living room (LIV) and bedroom (BR).
Sustainability 08 00139 g005
Figure 6. The STV and PHV TEP for future 2080 weather for living room (LIV) and bedroom (BR).
Sustainability 08 00139 g006

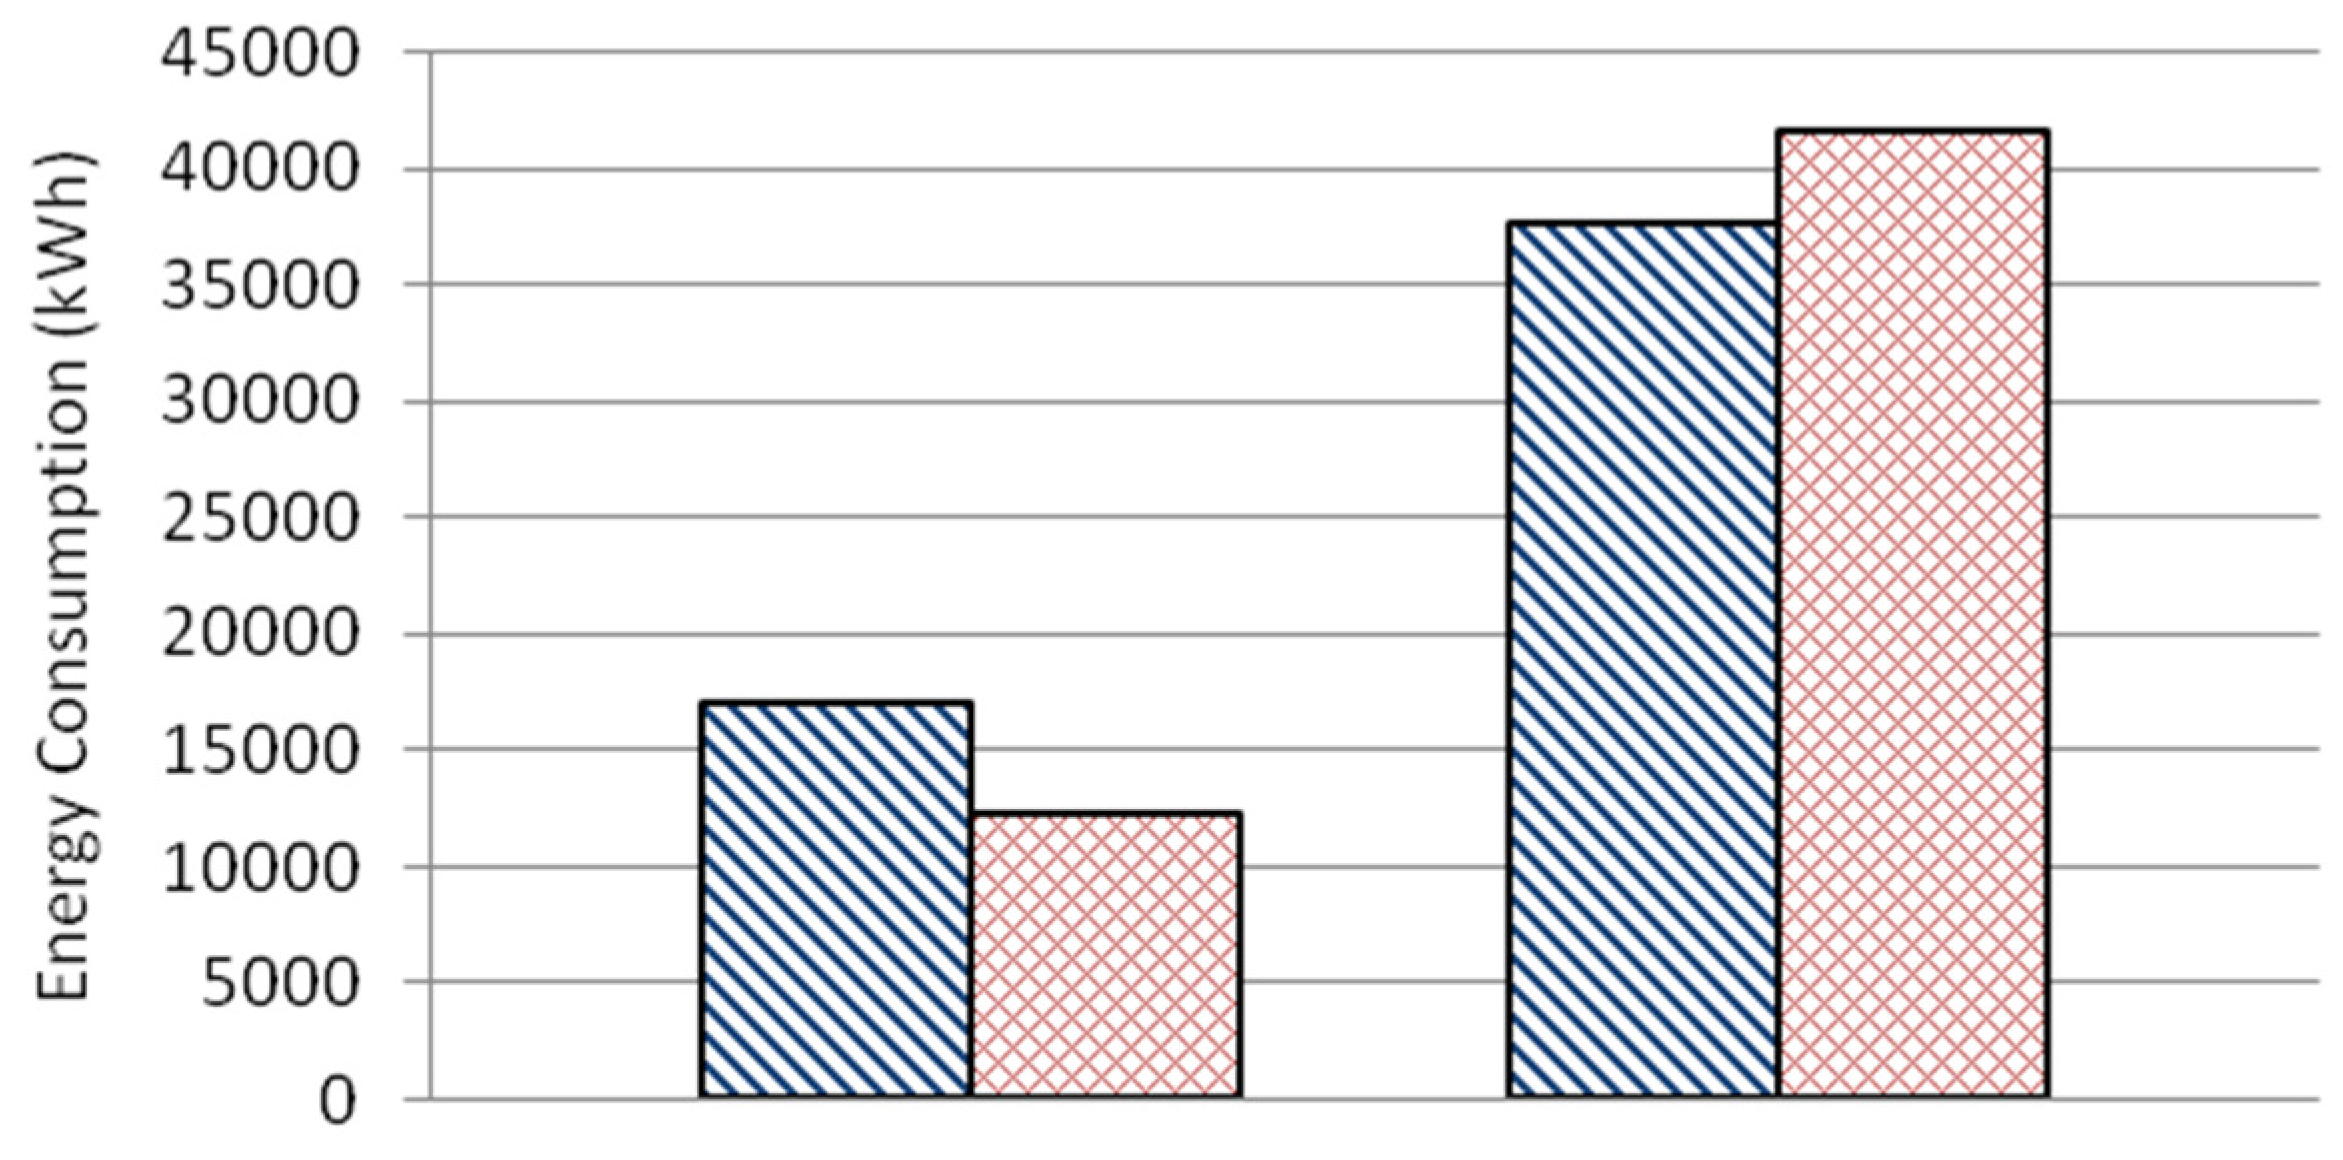
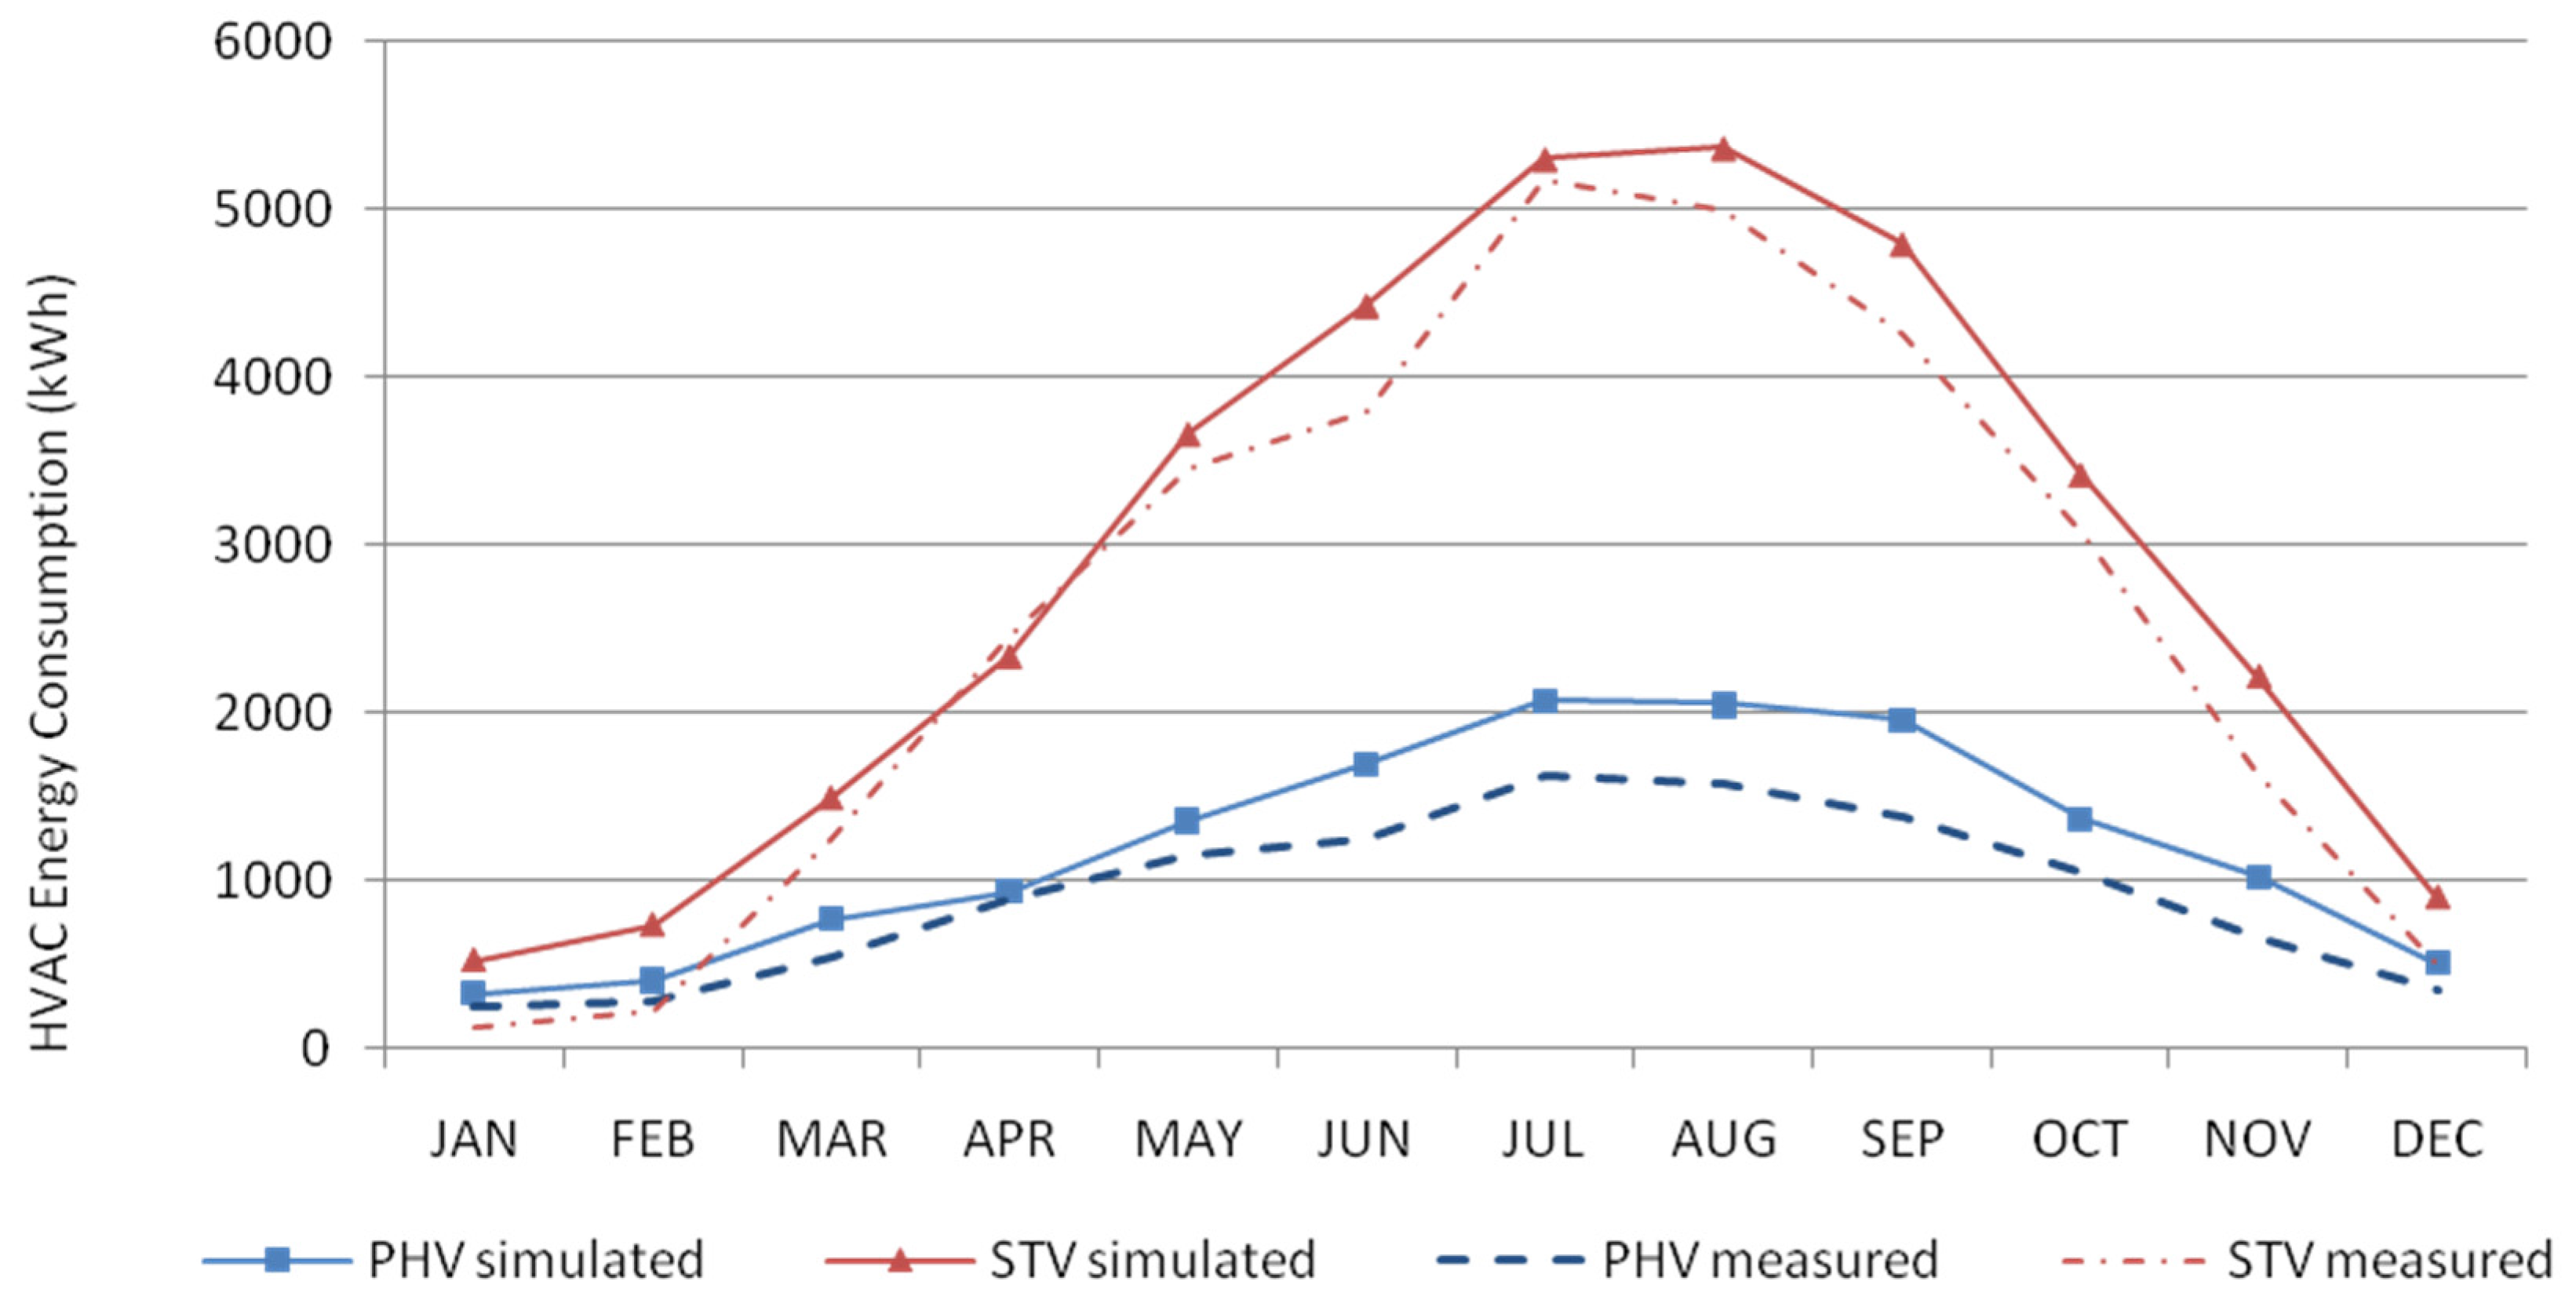
3.4. Energy Consumption

IES was used to model the current and future energy consumptions of the two villas. To validate IES outputs an initial cross-reference was conducted. Comparison analysis was performed between IES energy loads and the actual energy use obtained from the energy meters in the houses. Annual total incidental energy gains predicted by IES for lighting, equipment and people were 8.1, 12.9 and 11.2 kWh/m2/year respectively. Data from three sets of meter readings, which included lights, small power and heating, ventilating and air conditioning (HVAC), were available. There were intermittent problems with the meters and so interpolation and statistical analysis were undertaken to provide estimates of annual energy use. Figure 7 shows the measured and IES modelled total energy use in the STV and the PHV. Figure 8 illustrates the measured and IES modelled HVAC loads in both villas. Both graphs show, allowing for the disrupted nature of the meter readings, a satisfactory level of agreement between the measured and modelled values.
Figure 7. Annual total energy consumption—measured and IES simulated for current weather.
Sustainability 08 00139 g007
Figure 8. Annual heating, ventilating and air conditioning (HVAC) energy consumption—measured and IES simulated for current weather data.
Sustainability 08 00139 g008
The impact of climate change on the total annual energy use in both houses is presented in Figure 9, which also show the contribution of the PV array in offsetting the Passivhaus villa’s total annual energy use. It should be noted that the Passivhaus villa’s energy requirements are fully met from the electrical energy generated from the PV array mounted on its roof. The negative sign in Figure 9 refers to the annual energy generated from the PV array (around 400 kWh/m2). Note that, although PV efficiencies might be expected to improve over the coming decades, the PV efficiency used in this study for current and 2080 analyses was fixed to current values.
Figure 9. Modelled current and future (2080) total annual energy use in the two villas.
Sustainability 08 00139 g009
The Passivhaus standard requires that the total annual primary energy demand should not exceed 120 kWh/m2. According to simulation results and on-site measurements the full load of the Passivhaus villa PHV is met by the PV generated energy (Figure 9). The PHV’s energy consumption without utilizing the energy generated through the PV array was compared against the STV. The simulated outcomes indicated that the PHV would consume around half the energy used in the standard villa, both for the present time and in 2080 (Figure 9). The interpolation of the existing measured three meter readings indicated even better results, with the PHV using around a third of the energy used in the STV. This trend was similarly found in the most dominant load, the cooling load. Statistical analysis conducted on the on-site data indicated that the STV requires three times more energy to be cooled to a set point temperature of 23.5 °C compared to the PHV’s requirements.

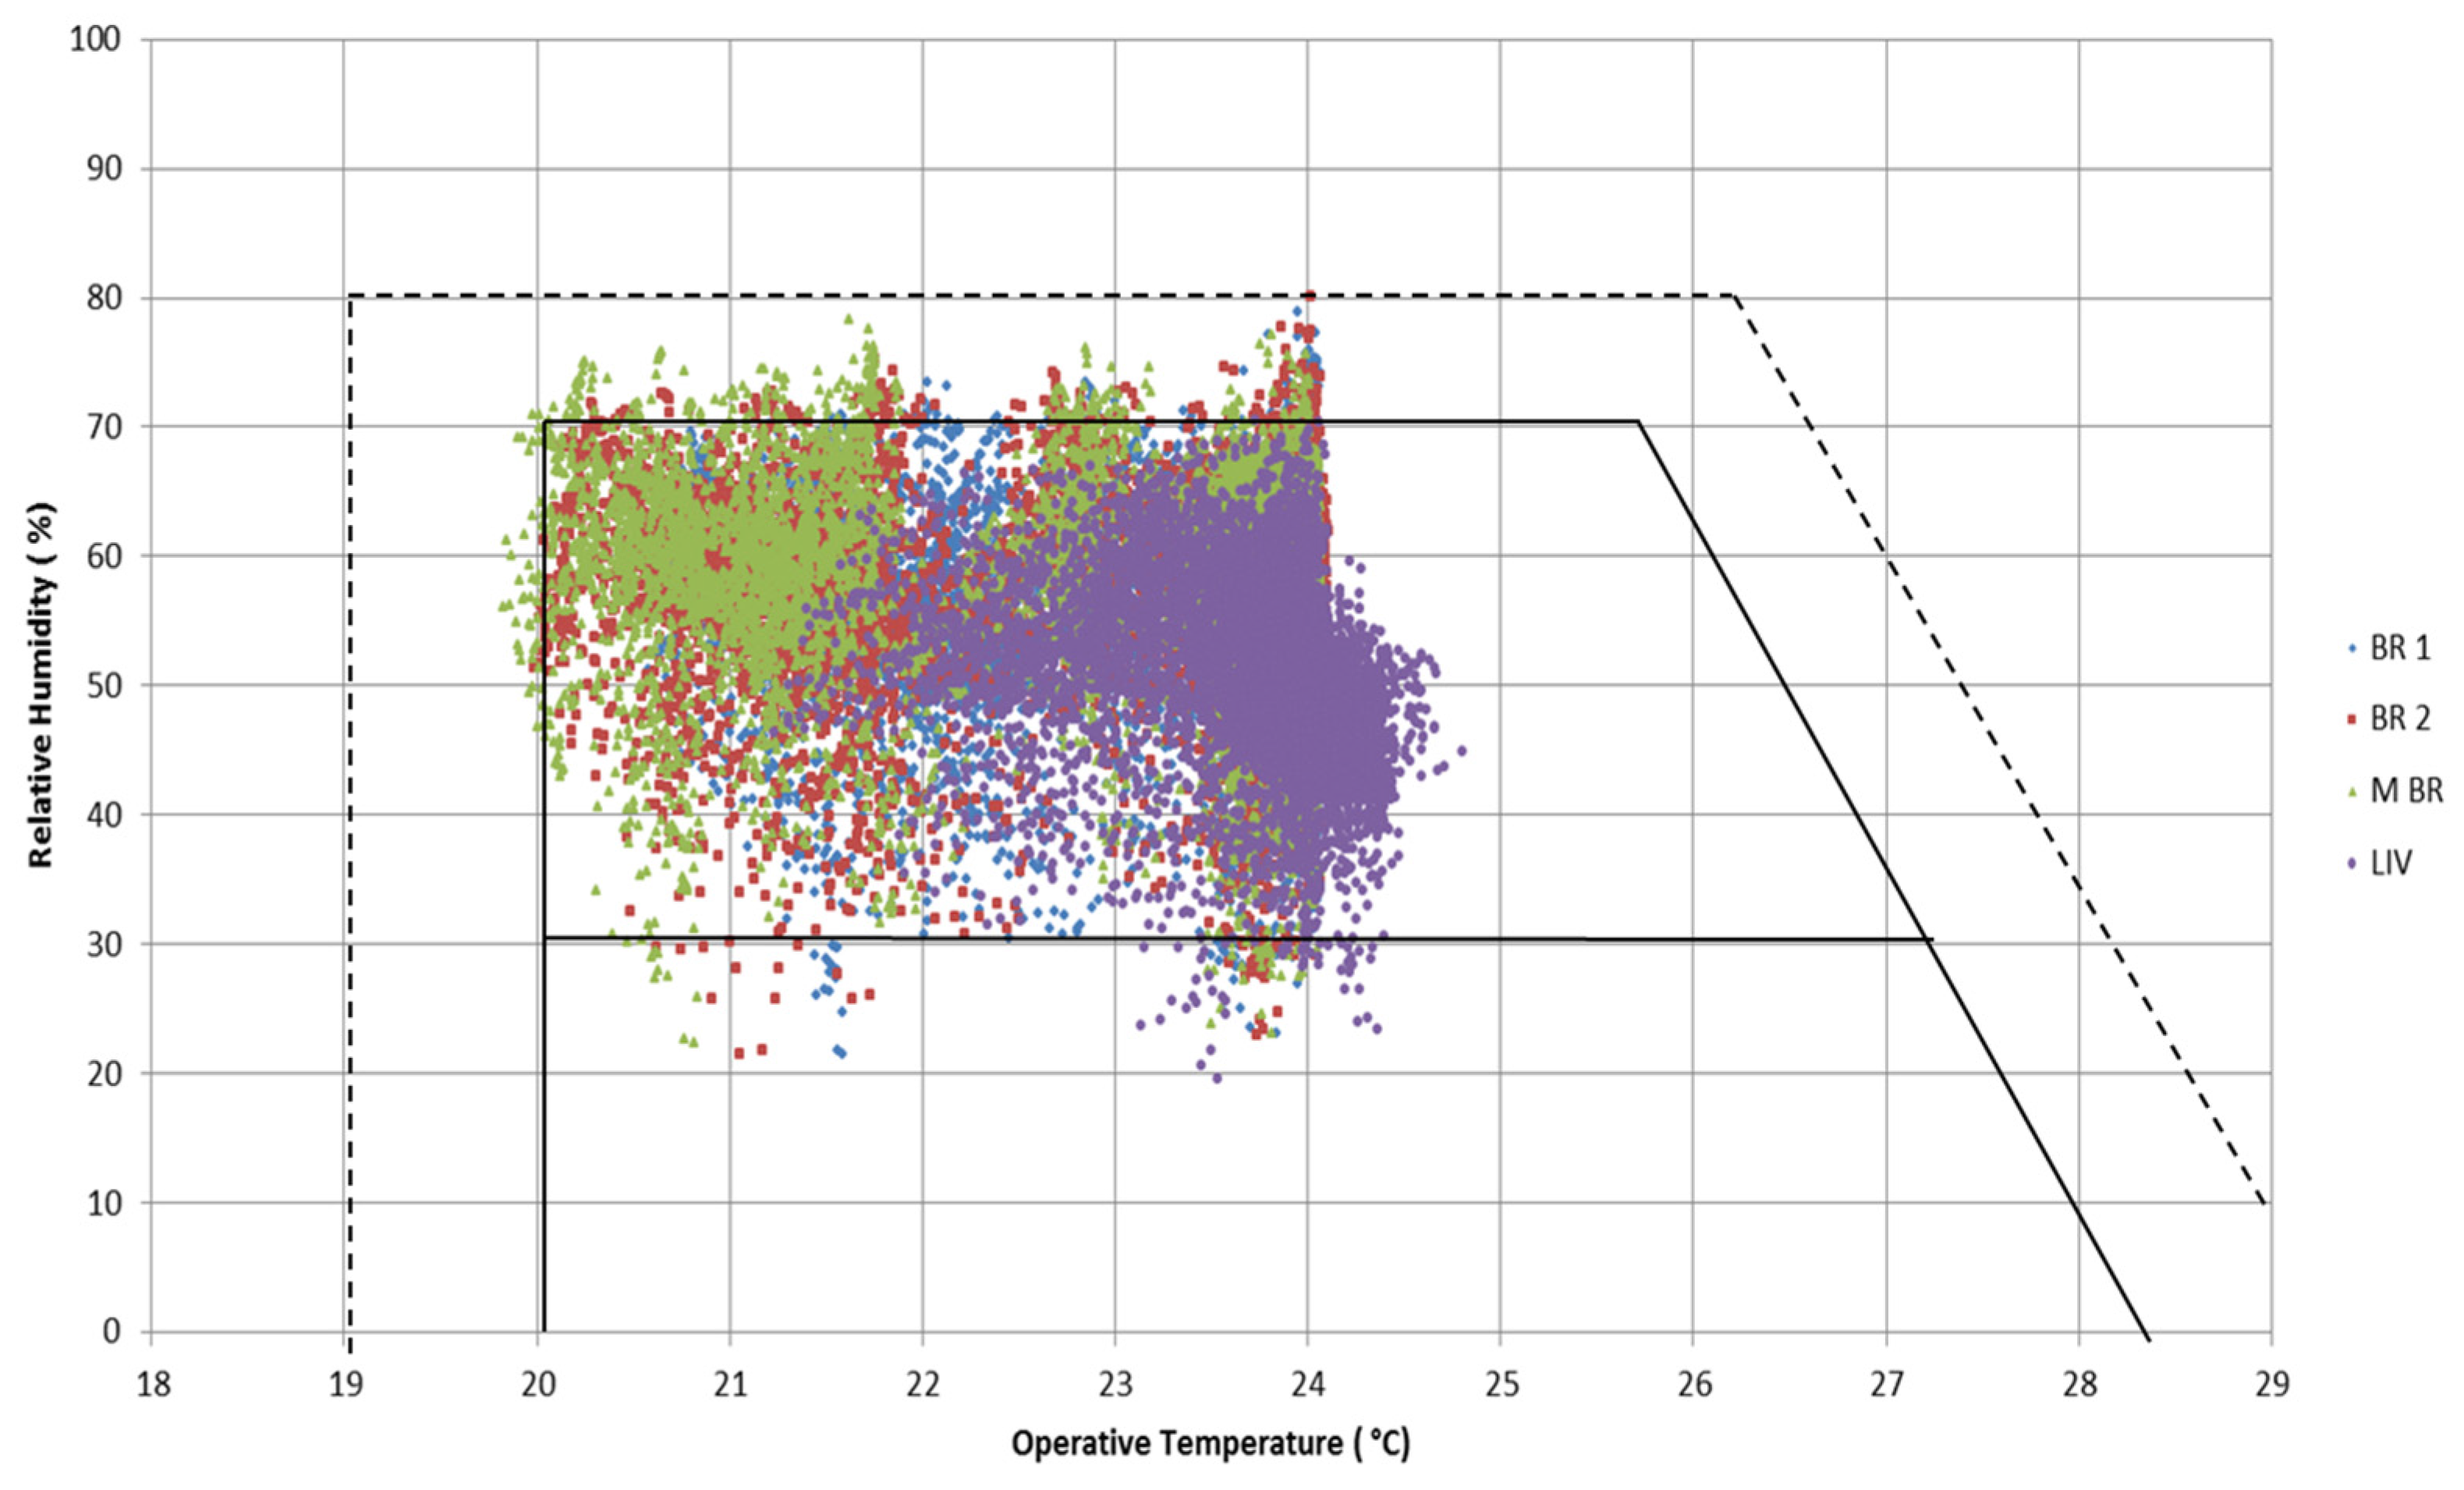
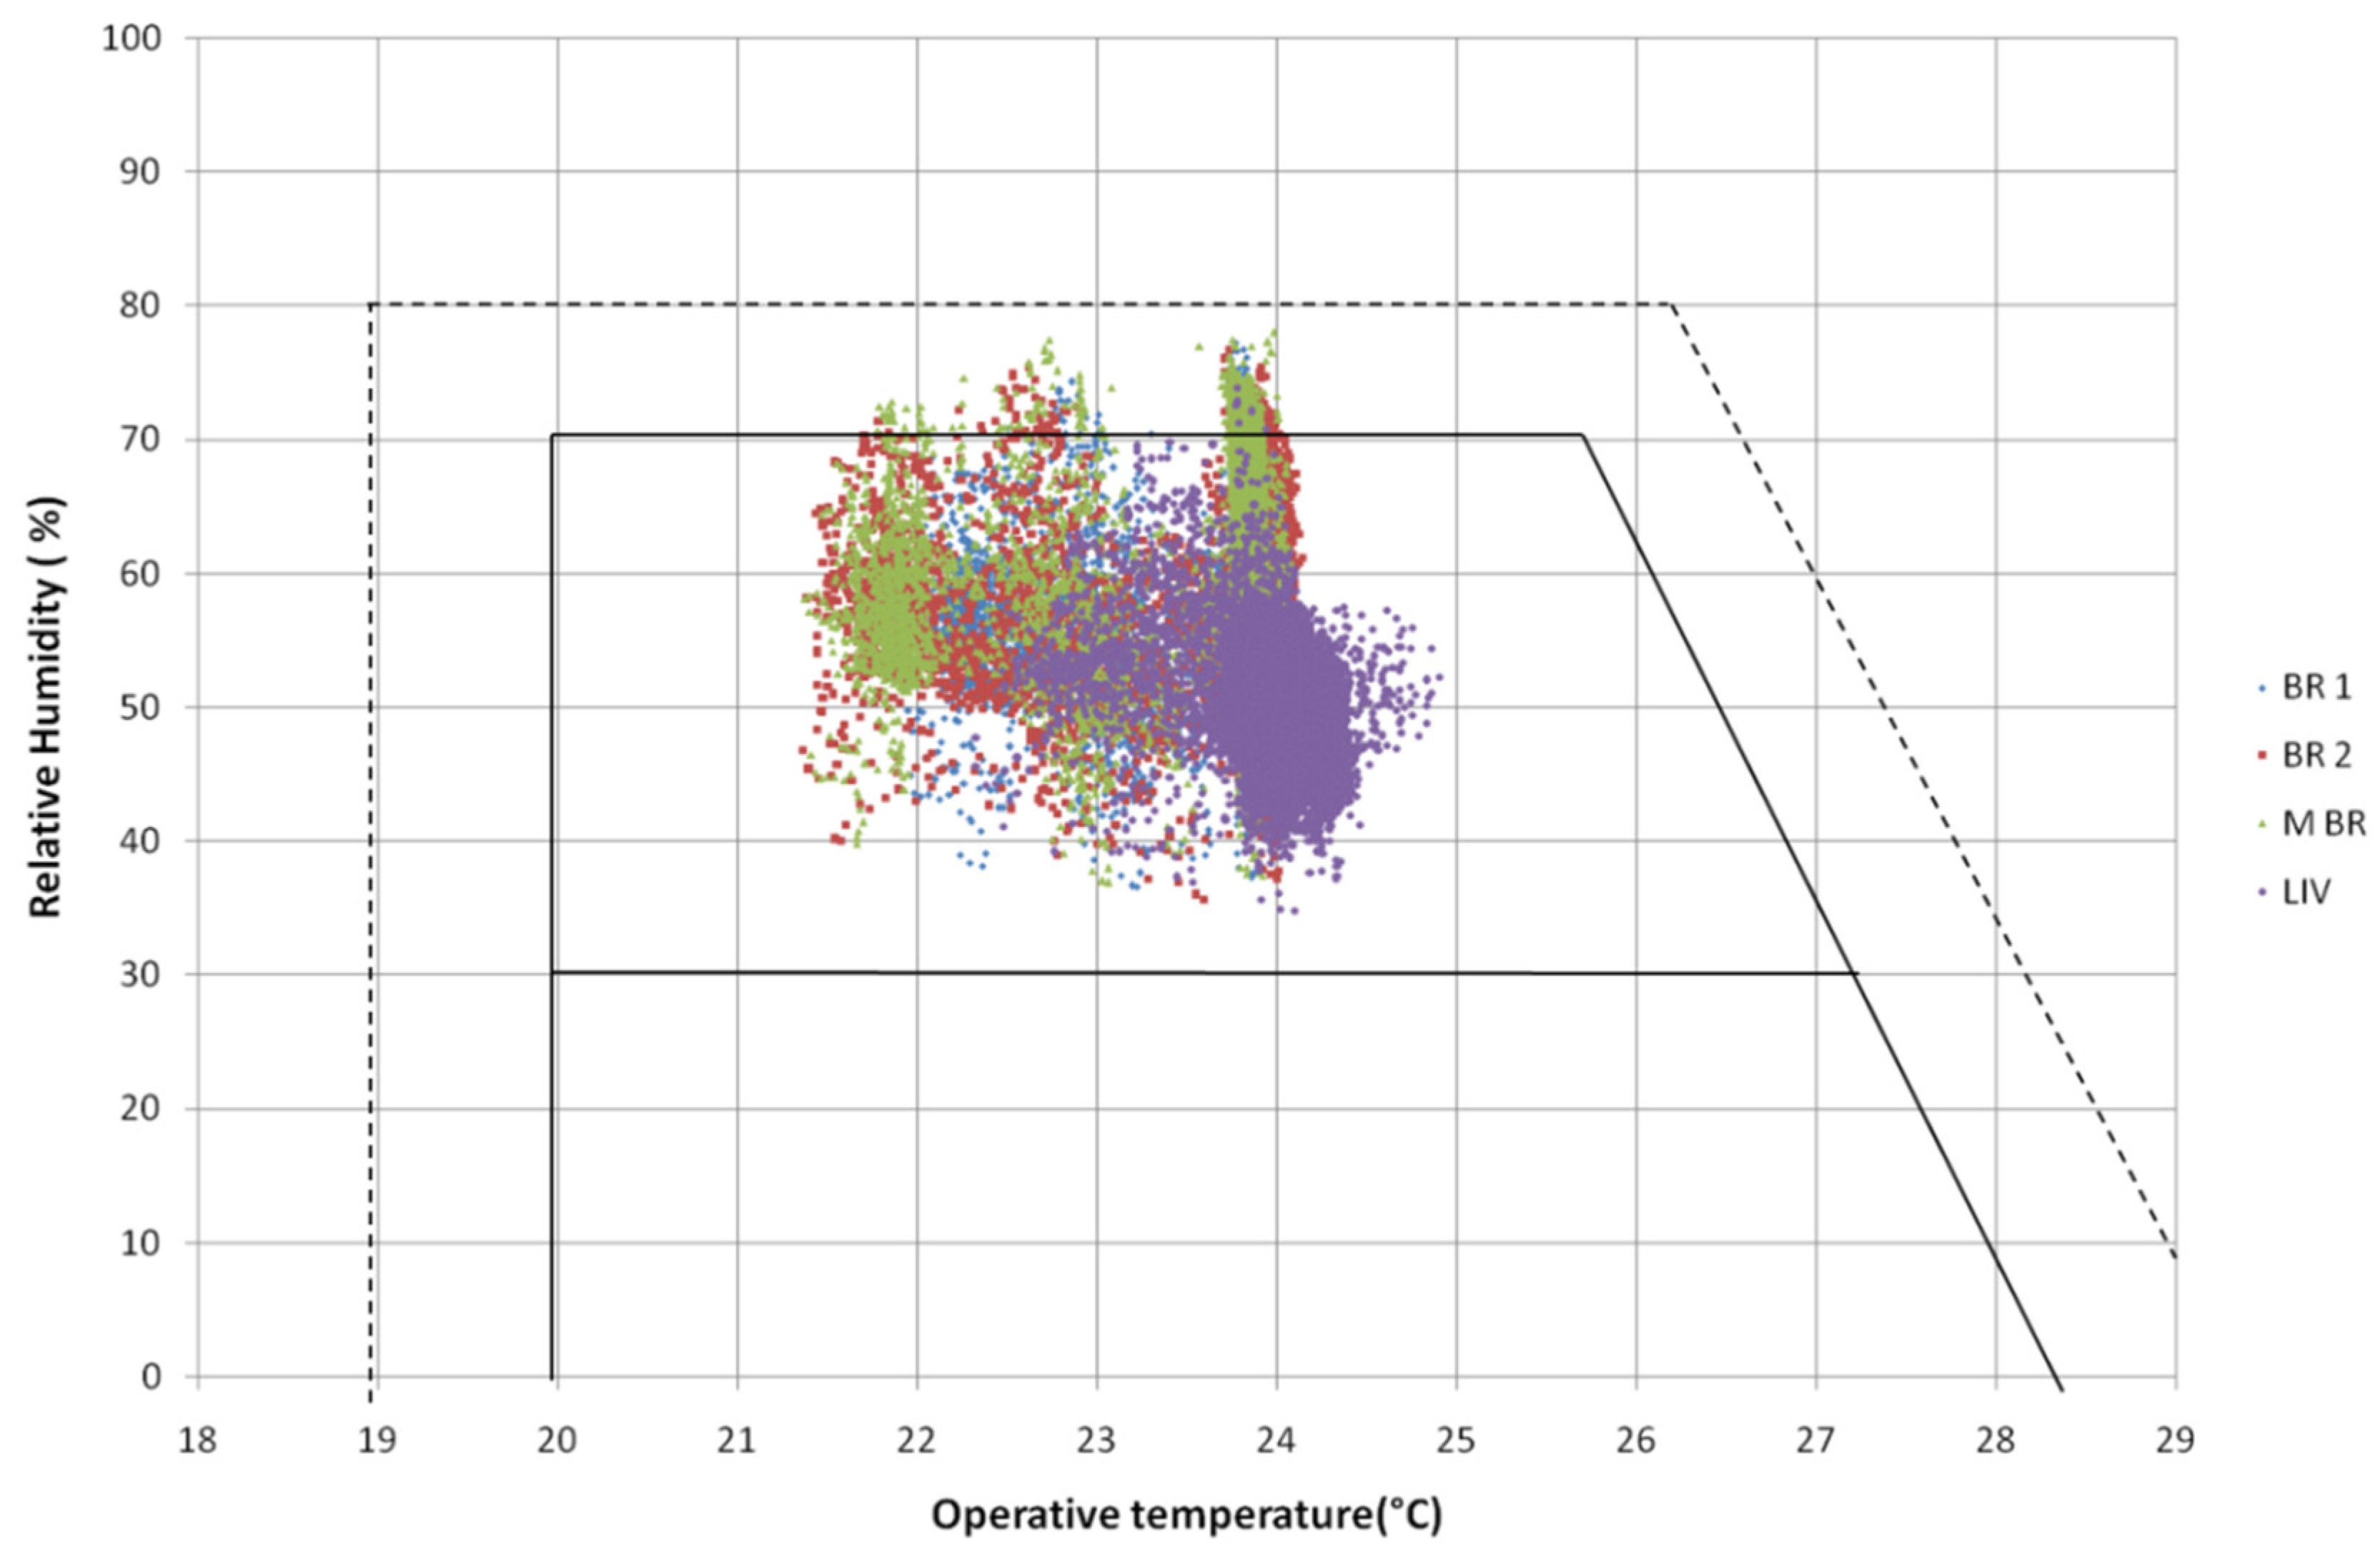
3.5. Thermal Comfort

The thermal comfort performance of the villas was only assessed through simulation, as tenants had not consistently occupied the villas, and field surveys were not possible. Air temperature is a major factor affecting thermal comfort, and the HOBO data loggers were used to monitor the indoor air temperatures of the main occupied spaces in both villas. This includes the living/dining room (LIV), the two single bedrooms (BR1 and BR2) and the master bedroom (M BR). Close agreement was found between most of the readings recorded by the loggers and the outputs predicted by IES. Two logger readings out of the eight loggers were found to be unreliable. The loggers situated in the LIV spaces in both villas failed during the monitoring period.
Figure 10a,b show the average and maximum PMV respectively for the present and future scenarios in the two villas. Figure 11, Figure 12, Figure 13 and Figure 14 show the annual hourly relative humidity v. operative temperatures plots (Schneider comfort charts) for the standard villa STV and the Passivhaus villa PHV for both current and future weather scenarios.
Figure 10. (a) Average PMV and (b) maximum PMV for current (CUR) and 2080 weather data—based on the average of PMV values for the living room and master bedroom.
Sustainability 08 00139 g010
Figure 11. The PHV relative humidity v operative temperature comfort chart for current weather for living room (LIV), master bedroom (M BR) and the two single bedrooms (BR1 and BR2).
Sustainability 08 00139 g011
Figure 12. The PHV relative humidity v operative temperature comfort chart for future weather for living room (LIV), master bedroom (M BR) and the two single bedrooms (BR1 and BR2).
Sustainability 08 00139 g012
Figure 13. The STV relative humidity v operative temperature comfort chart for current weather for living room (LIV), master bedroom (M BR) and the two single bedrooms (BR1 and BR2).
Sustainability 08 00139 g013
Figure 14. The STV relative humidity v operative temperature comfort chart for future weather for living room (LIV), master bedroom (M BR) and the two single bedrooms (BR1 and BR2).
Sustainability 08 00139 g014
Figure 10a suggests that the average monthly PMV in the present and future time for the Passivhaus are similar, particularly from April to November. Not surprisingly, the PHV is closer to the PMV score of 0 (i.e., neutral or thermal comfort) for the winter months of the current climate. The standard villa always has a higher average PMV value than the PHV in the summer months, but the average PMV STV values stay below 1 (slightly warm), which suggest conditions are acceptable. Figure 10b indicates that the maximum monthly PMV in the present and future times for the Passivhaus are virtually identical throughout the year at around a PMV of 0.75, demonstrating the ability of the Passivhaus villa to provide a continuous tight control over the risk of overheating. Conversely, the maximum monthly PMV in the present and future time for the standard villa show a large increase during the summer months, with the possibility of warm conditions and some degree of thermal discomfort being experienced. Schneider’s comfort charts in Figure 11 and Figure 12 indicate that comfort levels in the Passivhaus villa are consistently within the inner thermal comfort zone for both current and future weather data, although there is a noticeable shift towards the center of the inner comfort zone for the 2080 scenario. This is to be expected, given the increase in the external air temperatures in the 2080 scenario. Schneider’s comfort charts in Figure 13 and Figure 14 for the standard villa show the much greater variations in the annual operative temperature ranges for current and future weather data. Many values went beyond the inner and extended comfort zones. For the current weather scenario numerous operative temperatures were found to be lower than the 20.0 °C minimum limit, and in the 2080 scenario many operative temperatures went above the 25.5 °C maximum limit. According to the Passivhaus standard, the internal ambient temperature should not rise above 25 °C more than 10% of the hours in any given year.
The PHV comfort charts suggest that the operative temperature is maintained below the 25 °C limit at all times for both weather scenarios. In comparison, this was not achievable for the STV. Based on the simulation results, the present day STV operative temperatures were found to be above 25 °C for a total of 3498 h per annum or 40% of the time (a year has 8760 h). The living room (LIV) space contributed the highest percentage with 26% of the hours above 25 °C, with the bedrooms providing the remaining 14%. The 2080 climate change impact revealed that the standard villa would have a total of 8176 h (93% of the year) above 25 °C, with the living room accounting for 43% of the hours and the bedrooms for 50% of the hours. Although the STV ambient temperatures were found to be higher than the Passivhaus 25 °C limit it should be said that a limit of 25 °C may be a little low in terms of thermal comfort temperatures for a hot climate such as that of Qatar. For example, in the standard villa for the climate change scenario, a comfort temperature limit set at 27 °C would mean that only 76 h (0.9% of the year) would be beyond that limit.

4. Discussion

The results from this study are encouraging, both in terms of the observed performance of the Qatar Passivhaus and the ability of the research modelling to simulate that performance. The comparison of the envelope performances for the two villas indicates that the cooling energy load that would be required to achieve comfort will be significantly less in the Passivhaus than in the standard villa. Both collecting measured energy consumption data and modelling energy consumption were difficult, the first because of access issues with the villas following a change of ownership, and the second because of uncertainty over occupancy patterns. Having to interpolate the intermittently recorded measured energy readings, and having to derive occupancy patterns from observations during visits to the villas, may be partly responsible for the difference between measured and modelled energy values. Another contributory factor may be the need in the modelling to estimate the incidental gains in the villas.
The thermal comfort analyses utilized Fanger’s PMV model, because of the controlled nature of the villa environment, and the relatively simple approach of the Passivhaus Institute, i.e., the Schneider comfort charts. Both approaches are valid for the study, and the Schneider comfort charts provide readily understandable results in terms of the comfort benefits created in the Passivhaus villa. Both approaches demonstrate the greater vulnerability of the standard villa to the prevailing hot summer climate, both now and in the future. No attempt was made to use an adaptive approach to comfort at this stage of the study.

5. Conclusions

This research provided an opportunity to consider the suitability, for a hot arid climate, of the German ultra-low energy efficient Passivhaus standard, which has gained wide acceptance in Europe. This study has evaluated three parameters—thermal envelope performance, total and HVAC energy consumption and thermal comfort for the first Passivhaus project in the GCC region. Overall, both the measured and modelled results suggested that a Passivhaus approach to the design of dwellings in a GCC area, such as Qatar, could have significant benefits. Predicted energy usage was greatly reduced in the Passivhaus villa while, at the same time, thermal comfort levels were much better than in the standard villa. These conclusions were valid both for current and future climate scenarios, indicating the long term value of building now to a Passivhaus standard. The introduction of high levels of thermal insulation in to the Passivhaus villa envelope has been shown to be of benefit in terms of creating a more stable and comfortable internal environment. However, in order to meet the Passivhaus total energy consumption requirement it was necessary to utilize a low/zero carbon energy source (a PV array in this case).
Although not all aspects related to the Passivhaus standard and its requirements were covered in this research, the three indicators examined in this study demonstrated that close to Passivhaus standards could be realized in a hot and arid climate. This study did not consider other factors associated with Passivhaus, such as variable ventilation rates and overheating risks. These, and other parameters, will form the basis of further investigations which might lead to a holistic approach towards assessing the full performance of a Passivhaus building in a hot climate.

Acknowledgments

The authors would like to express their great gratitude to the Qatar Green Building Council (QGBC), represented by Alexander Amato and Cynthia Skelhorn, who provided raw data and unlimited access to the Qatar project. The authors would also like to acknowledge the support and help of Ahmed Al Abdulla, the CEO of BARWA Real Estate, and Simon Law of AECOM.

Author Contributions

May Khalfan and Steve Sharples jointly conceived the study; performed the data logging; analyzed the data, modelled the building performance and wrote the paper.

Conflicts of Interest

The authors declare no conflict of interest.

References

  1. Abu Bakar, N.N.; Hassan, M.Y.; Abdullah, H.; Rahman, H.A.; Abdullah, M.P.; Hussin, F.; Bandi, M. Energy efficiency index as an indicator for measuring building energy performance: A review. Renew. Sustain. Energy Rev. 2015, 44, 1–11. [Google Scholar] [CrossRef]
  2. International Energy Agency Statistics. Available online: http://www.iea.org/statistics/ (accessed on 1 October 2015).
  3. The United Nations Environmental Programme. Available online: http://www.unep.org/ (accessed on 1 October 2015).
  4. Pérez-Lombard, L.; Ortiz, J.; Pout, C. A review on buildings energy consumption information. Energy Build. 2008, 40, 394–398. [Google Scholar] [CrossRef]
  5. De Boeck, L.; Verbeke, S.; Audenaert, A.; de Mesmaeker, L. Improving the energy performance of residential buildings: A literature review. Renew. Sustain. Energy Rev. 2015, 52, 960–975. [Google Scholar] [CrossRef]
  6. Lahn, G.; Preston, F. Targets to promote energy savings in the gulf cooperation council states. Energy Strategy Rev. 2013, 2, 19–30. [Google Scholar] [CrossRef]
  7. Meltzer, J.; Hultman, N.; Langley, C. Low-carbon energy transitions in Qatar and the Gulf Cooperation Council Region, 2014. Available online: file:///F:/May%20Khalfan/Low%20carbon%20energy%20transitions%20in%20Qatar%20and%20GCC%20region%202014.pdf (accessed on 1 October 2015).
  8. The Passive-On Project. Available online: http://www.eerg.it/passive-on.org/en/cd.php (accessed on 1 October 2015).
  9. Schnieders, J.; Hermelink, A. CEPHEUS results: Measurements and occupants’ satisfaction provide evidence for passive houses being an option for sustainable building. Energy Policy 2006, 34, 151–171. [Google Scholar] [CrossRef]
  10. Passepedia the Passive House Resource. Available online: http://passipedia.org/ (accessed on 1 October 2015).
  11. The UK Passive House Organization, PHPP version out now. Available online: http://www.passivhaustrust.org.uk/news/detail/?nId=268#.VhfUJvlVhBc (accessed on 1 October 2015).
  12. International Passive House Association, Number of passive house square meter reaches one million. Available online: http://www.passivehouse-international.org/index.php?page_id=76&y=2014 (accessed on 1 October 2015).
  13. Nicol, J.F.; Humphreys, M.A. Adaptive thermal comfort and sustainable thermal standards for buildings. Energy Build. 2002, 34, 563–572. [Google Scholar] [CrossRef]
  14. Szokolay, S.V. Introduction to Architectural Science: The Basis of Sustainable Design, 2nd ed.; Elsevier/Architectural Press: Amsterdam, The Netherlands, 2008. [Google Scholar]
  15. Taleghani, M.; Tenpierik, M.; Kurvers, S.; van den Dobbelsteen, A. A review into thermal comfort in buildings. Renew. Sustain. Energy Rev. 2013, 26, 201–215. [Google Scholar] [CrossRef]
  16. Carlucci, S. Thermal Comfort Assessment of Buildings. 2013. Available online: http://search.ebscohost.com.ezproxy.liv.ac.uk/login.aspx?direct=true&db=cat00003a&AN=lvp.b2808385&site=eds-live&scope=site (accessed on 1 October 2015).
  17. Peeters, L.; de Dear, R.; Hensen, J.; D’haeseleer, W. Thermal comfort in residential buildings: Comfort values and scales for building energy simulation. Appl. Energy 2009, 86, 772–780. [Google Scholar] [CrossRef]
  18. Evans, J.M. Evaluating comfort with varying temperatures: A graphic design tool. Energy Build. 2003, 35, 87–93. [Google Scholar] [CrossRef]
  19. Schnieders, J.; Feist, W.; Rongen, L. Passive houses for different climate zones. Energy Build. 2015, 105, 71–87. [Google Scholar] [CrossRef]
  20. National Research Council of the National Academies. Monitoring Climate Change Impacts; National Academies Press: Washington, DC, USA, 2010; Available online: http://search.ebscohost.com.ezproxy.liv.ac.uk/login.aspx?direct=true&db=cat00003a&AN=lvp.b2471353&site=eds-live&scope=site (accessed on 1 October 2015).
  21. Dirks, J.A.; Gorrissen, W.J.; Hathaway, J.H.; Skorski, D.C.; Scott, M.J.; Pulsipher, T.C.; Huang, M.; Liu, Y.; Rice, J.S. Impacts of climate change on energy consumption and peak demand in buildings: A detailed regional approach. Energy 2015, 79, 20–32. [Google Scholar] [CrossRef]
  22. Li, D.H.W.; Yang, L.; Lam, J.C. Impact of climate change on energy use in the built environment in different climate zones—A review. Energy 2012, 42, 103–112. [Google Scholar] [CrossRef]
  23. Jentsch, M.F.; James, P.A.; Bahaj, A.S. Climate change adapted simulation weather data: Implications for cities in hot, arid climates of the Middle East. 2010. Available online: http://www.uni-weimar.de/Bauing/energy/Publications/WREC_XI_Jentsch_climate_change_Middle_East.pdf (accessed on 1 October 2015).
  24. Jentsch, M.F.; Bahaj, A.S.; James, P.A.B. Climate change future proofing of buildings—Generation and assessment of building simulation weather files. Energy Build. 2008, 40, 2148–2168. [Google Scholar] [CrossRef]
  25. Haase, M. Development of future weather data set based on SRES scenario. Available online: http://www.irbnet.de/daten/iconda/CIB21159.pdf (accessed on 1 October 2015).
  26. Weather data for simulation. Available online: http://apps1.eere.energy.gov/buildings/energyplus/weatherdata_simulation.cfm (accessed on 1 October 2015).
  27. Guan, L. Preparation of future weather data to study the impact of climate change on buildings. Build. Environ. 2009, 44, 793–800. [Google Scholar] [CrossRef]
  28. Meteonorm website. Available online: http://meteonorm.com/ (accessed on 1 October 2015).
  29. Remund, J.; Müller, S.; Schilter, C.; Rihm, B. The use of Meteonorm weather generator for climate change studies. 2010. Available online: https://www.researchgate.net/publication/253793832_The_use_of_Meteonorm_weather_generator_for_climate_change_studies (accessed on 1 October 2015).
  30. Climate Change World Weather File Generator for World-Wide Weather Data—CCWorldWeatherGen. Available online: http://www.energy.soton.ac.uk/ccworldweathergen (accessed on 1 October 2015).
  31. Melly, P. Doha Passivhaus sets the standard. MEED: Middle East. Econ. Dig. 2014, 58, 30–31. [Google Scholar]
  32. Hartman, H. Passivhaus Qatar: An AECOM-designed prototype villa is soon to trial in the extreme heat of the emirate. Archit. J. 2013, 237, 56–57. [Google Scholar]
  33. Barwa city development. Available online: https://www.waseef.qa/en/barwa-city/ (accessed on 1 October 2015).
  34. Barwa group. Available online: http://www.barwa.com.qa/sites/English/BusinessSegments/QatarRealEstateInvestments/BarwaCity/SitePages/Home.aspx (accessed on 1 October 2015).
  35. Peel, M.C.; Finlayson, B.L.; McMahon, T.A. Updated world map of the Koppen-Geiger climate classification. Hydrol. Earth Syst. Sci. 2007, 11, 1633–1644. [Google Scholar] [CrossRef]
  36. Qatar Meteorology Department. Available online: http://qweather.gov.qa/ClimateNormals.aspx (accessed on 1 October 2015).
  37. Crawley, D.B.; Hand, J.W.; Kummert, M.; Griffith, B.T. Contrasting the capabilities of building energy performance simulation programs. Build. Environ. 2008, 43, 661–673. [Google Scholar] [CrossRef] [Green Version]
  38. IES website. Available online: http://www.iesve.com/about (accessed on 1 October 2015).
  39. UCLA. Energy design tools. Available online: http://www.energy-design-tools.aud.ucla.edu/ (accessed on 1 October 2015).
  40. IPPC, Special Report on Emission Scenarios. 2000. Available online: http://www.grida.no/publications/other/ipcc_sr/?src=/climate/ipcc/emission/index.htm (accessed on 1 October 2015).

