Article

Life Cycle Analysis of Carbon Flow and Carbon Footprint of Harvested Wood Products of Larix principis-rupprechtii in China

1
School of Nature Conservation, Beijing Forestry University, Qinghua East Road 35, Beijing 100083, China
2
Institute of Geographic Sciences and Natural Resources Research, Chinese Academy of Sciences, 11A Datun Road, Beijing 100101, China
3
School of Environmental Science and Engineering, South University of Science and Technology of China, Shenzhen 518055, China
*
Author to whom correspondence should be addressed.
Sustainability 2016, 8(3), 247; https://doi.org/10.3390/su8030247
Submission received: 4 January 2016 / Revised: 21 February 2016 / Accepted: 25 February 2016 / Published: 8 March 2016

Abstract

:
Larix principis-rupprechtii is a native tree species in North China with a large distribution; and its harvested timbers can be used for producing wood products. This study focused on estimating and comparing carbon flows and carbon footprints of different harvested wood products (HWPs) from Larix principis-ruppechtii based on the life cycle analysis (from seedling cultivation to HWP final disposal). Based on our interviews and surveys, the system boundary in this study was divided into three processes: the forestry process, the manufacturing process, and the use and disposal process. By tracking carbon flows of HWPs along the entire life cycle, we found that, for one forest rotation period, a total of 26.81 tC/ha sequestered carbon was transferred into these HWPs, 66.2% of which were still stored in the HWP when the rotation period had ended; however, the HWP carbon storage decreased to 0.25 tC/ha (only 0.9% left) in the 100th year after forest plantation. The manufacturing process contributed more than 90% of the total HWP carbon footprint, but it was still smaller than the HWP carbon storage. In terms of the carbon storage and the carbon footprint, construction products had the largest net positive carbon balance compared to furniture and panel products. In addition, HWP are known to have a positive impact on global carbon mitigation because they can store parts of the sequestered carbon for a certain period of time and they have a substitution effect on carbon mitigation. Furthermore, there still exist great opportunities for carbon mitigation from HWPs through the use of cleaner energy and increasing the utilization efficiency of wood fuel.

1. Introduction

Forests can sequester carbon from the atmosphere and store it in their living biomass, which has been attracting increasing attention for mitigating carbon emissions [1,2,3]. Harvested wood product (HWP) can still store parts of the sequestered carbon for a certain period of time, and besides HWP can also be a substitute for other materials (like steel and concrete) and fossil fuels (like petroleum and coal) that have higher carbon emission intensities. In recent years, the use of HWP has been encouraged due to its carbon emission reduction effects [2], and thus more and more HWPs are being consumed. HWP presents a huge carbon pool, with an increasing trend from 59 MtC/year in 1990 to 74 MtC/year in 2040 [4,5,6]. Therefore, much attention has been focused on estimating the HWP carbon storage [3]. Based on national greenhouse gas inventories, the Intergovernmental Panel on Climate Change (IPCC) proposed three approaches to estimate the HWP carbon storage; after which scientists began to estimate the HWP carbon storage in their countries, including Russia, Iceland, the USA and China [7,8,9,10,11].
However, the HWP manufacturing process can result in some environmental problems and correlated carbon emissions due to material consumption. In addition, carbon stored in HWP could be released gradually (by landfill) or immediately (by combustion) after their life cycle. Currently, increasing efforts are being made to understand the environmental impacts [12], energy consumption [13,14], and carbon emissions [3,15] during the HWP manufacturing process.
In terms of the carbon storage and the carbon emission, HWP has already been an important part of global carbon cycle. Thus, it is of high importance to track the entire carbon flow during the complete life cycle of HWP. Life cycle assessment (LCA) is an important tool to evaluate environmental loads and material flows related to a process or an activity [16]. In the LCA system, the entire life cycle or life span should be considered from the raw material extraction to the final disposal of products. Present studies have already tracked carbon flows along the life cycle of HWP, but only a few studies focused on the entire carbon flows from forest plantation to the HWP final disposal [17,18,19]. Moreover, most of these studies were based on inventory data, and they lack survey data [3].
The carbon footprint can be used to estimate the total amount of carbon emissions caused directly or indirectly by a process, product or service [16]. The carbon footprint of a product is unique to its product system, and its carbon emissions occur during its complete life cycle [16]. Therefore, many researchers have estimated carbon footprints of different products or services [3,16,20], and they have defined their own system boundaries according to their study aims. The HWP carbon footprint, in this study, is defined as carbon emissions for producing this HWP due to material consumption (like fossil fuel, electricity, fertilizer and so on), and besides these carbon emissions occur in the forestry process as well as in the manufacturing process. Additionally, it is also important to clearly understand differences in the carbon footprint among different HWPs, especially for those HWPs that originate from the same forest. Moreover, since the HWP can store the sequestered carbon by forests, it is of interest to estimate the net carbon balance for HWP before it is disposed.
To better understand carbon flows and carbon footprints, this study chose five typical HWPs from the Larix principis-rupprechtii plantation forest, a widely distributed forest species in North China. Larix principis-ruppechtii adapts to low temperature well, and can even survive at the altitude of 2800 m. Larix principis-ruppechtii is a plantation species, and its timber can be used for construction, furniture, panels, poles and fuel. Therefore, it is of high necessity to understand and compare the carbon flow and the carbon footprint among different HWPs from Larix principis-ruppechtii, based on the life cycle analysis. This is the overall aim of this study. The specific objectives of this study are to: (1) establish the boundary system of HWPs for the life cycle analysis, from a cradle (the seedling cultivation) to gate (the HWP final disposal) perspective; (2) monitor, evaluate and compare the carbon flow, the carbon footprint and the net carbon balance of different HWPs along their entire life cycles, including the forestry process, the manufacturing process and the use and disposal process, by applying the approaches in the PAS 2050 and ISO (International Organization for Standardization); and (3) discuss the substitution effect on carbon mitigation by the use of HWP, as well as how to better achieve carbon mitigation using the HWP.

2. Materials and Methods

2.1. Study Area

The great distribution of Larix principis-rupprechtii exists in the Mulan Weichang State-Owned Forest, where the environment is very suitable for this species to grow. With a long time of cultivation, a suite of forest management practices have been established, and many wood product factories are also located nearby. Therefore, we chose the Mulan Weichang State-Owned Forest as our study area. We conducted our interviews and surveys with local forest managers and owners of HWP factories in 2014, to learn about forest management practices and manufacturing processes. In the Mulan Weichang State-Owned Forest, Larix principis-rupprechtii is assumed to be planted in bare land, and its harvest rotation period is 41 years, with an initial intensity of 3300 stands/ha. After the final harvest, new seedlings are planted again for the next rotation period. According to our surveys, parts of the harvested timbers are directly consumed as fuel wood and poles. The remaining harvested timbers are hauled to local HWP factories to produce construction, furniture and panel products.

2.2. Functional Unit

In this study, the functional unit for estimating the carbon flow is defined as the carbon storage in the HWP from 1 ha of Larix principis-ruppechtii plantation forest. The functional unit for estimating the HWP carbon footprint is defined as the carbon emission from producing 1 m3 of HWP. The HWP carbon storage intensity is defined as the carbon storage in the 1 m3 of HWP. Therefore, the net carbon balance of HWP can be estimated by balancing the carbon storage and the carbon footprint in 1 m3 of HWP.

2.3. System Boundary

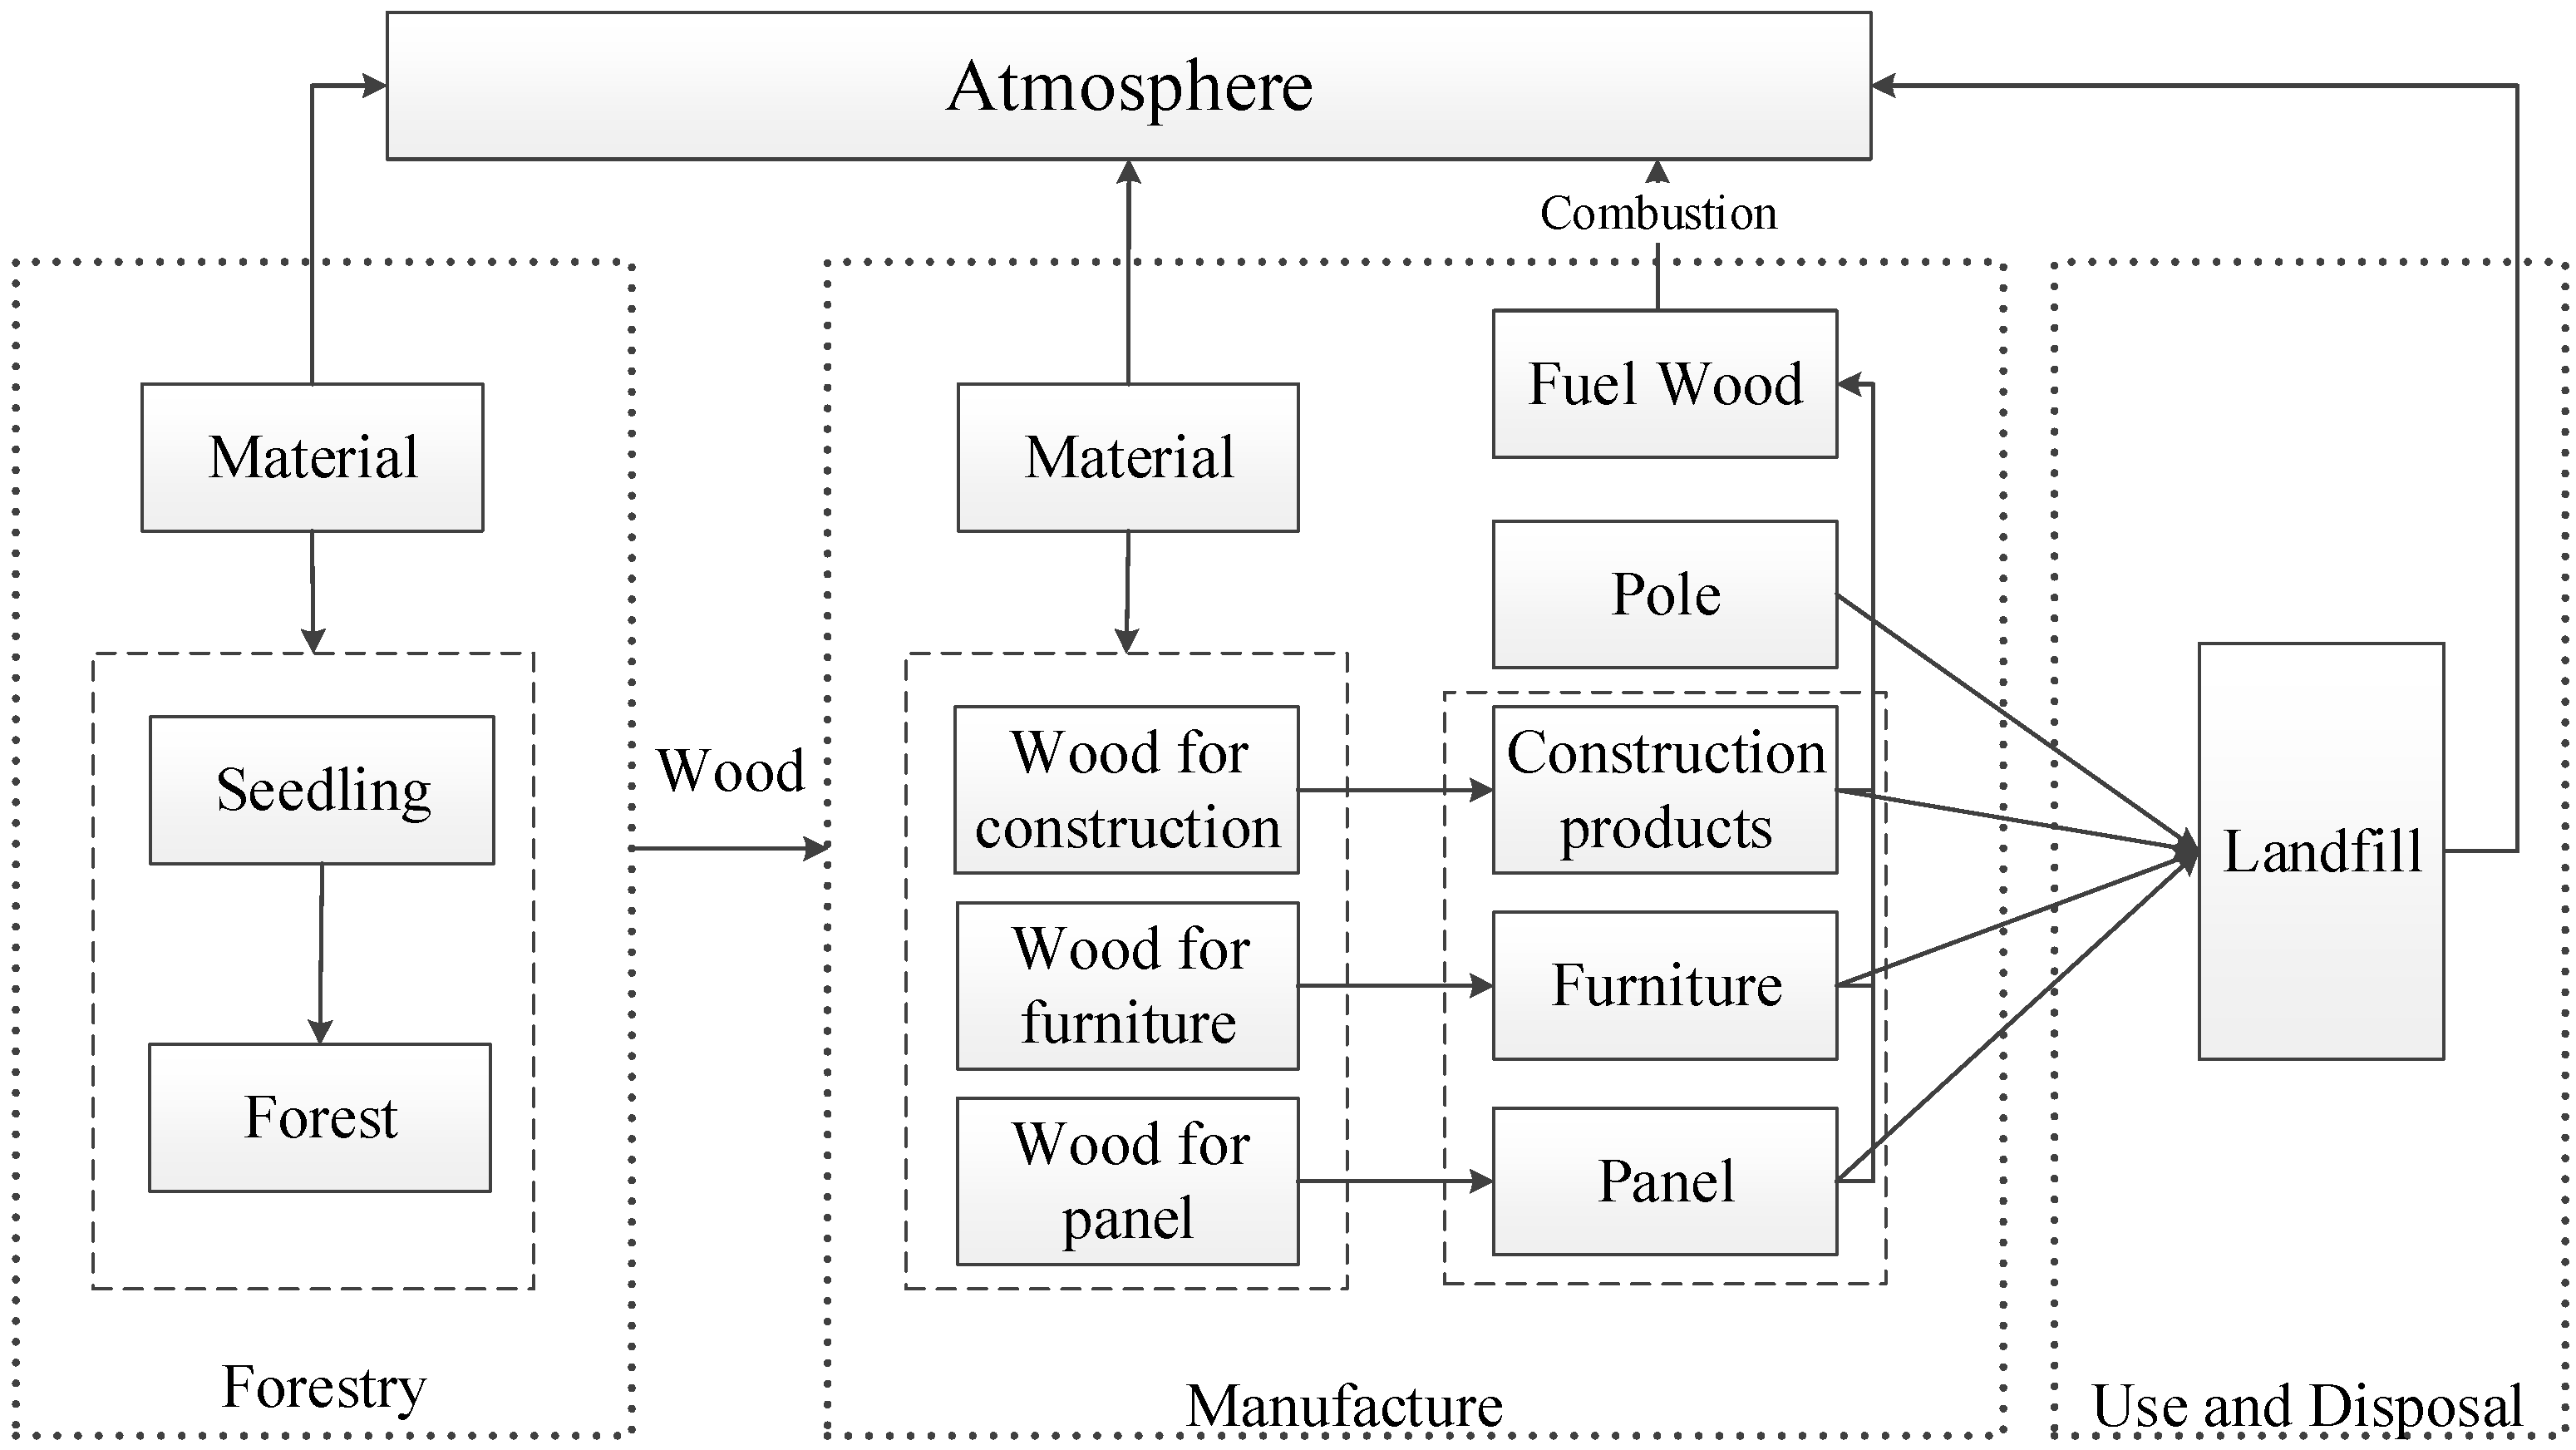
For better tracking the carbon flow and estimating the carbon footprint, the HWP carbon cycle can be divided into three processes: (1) the forestry process; (2) the manufacturing process; and (3) the use and disposal process (Figure 1). These three processes can completely illustrate the entire life cycle of HWP, from seedling cultivation to its final disposal.

2.3.1. The Forestry Process

The forestry process includes seedling cultivation, tree plantation, forest management and wood harvest. Therefore, in the forestry process, carbon is firstly sequestered by the forest, and then is transferred into timbers after harvest. The carbon footprint in the forestry process is defined as carbon emissions caused by material consumption in the forestry process, including fossil fuel, fertilizer, pesticide and so on.
Based on inventory data and Logistic Growth Model, Lun [21] established the allometric growth models for tree height and diameter at breast height (DBH) (Equations (1) and (2)). Additionally, Liu [22] built the stem biomass model with the parameters of tree height and tree DBH (Equation (3)) for each tree. With the stem carbon concentration of 0.5107 [23], we can estimate the stem carbon storage by Equation (4). All of the harvested timbers originate from forest stems, and thus carbon storage in the harvested timbers can be estimated by Equations (1)–(4),
H = 11.481 1 + 22.383 exp ( 0.229 t )
D = 22.710 1 + 6.595 exp ( 0.088 t )
V s t e m = 0.0462 ( D 2 H ) 0.8647
C s t e m = 0.0230 ( D 2 H ) 0.8647
where H and D are tree height (m) and tree DBH (cm), respectively; t refers to forest age; Vstem is stem biomass (m3); and Cstem is carbon storage in stem (tC/ha).
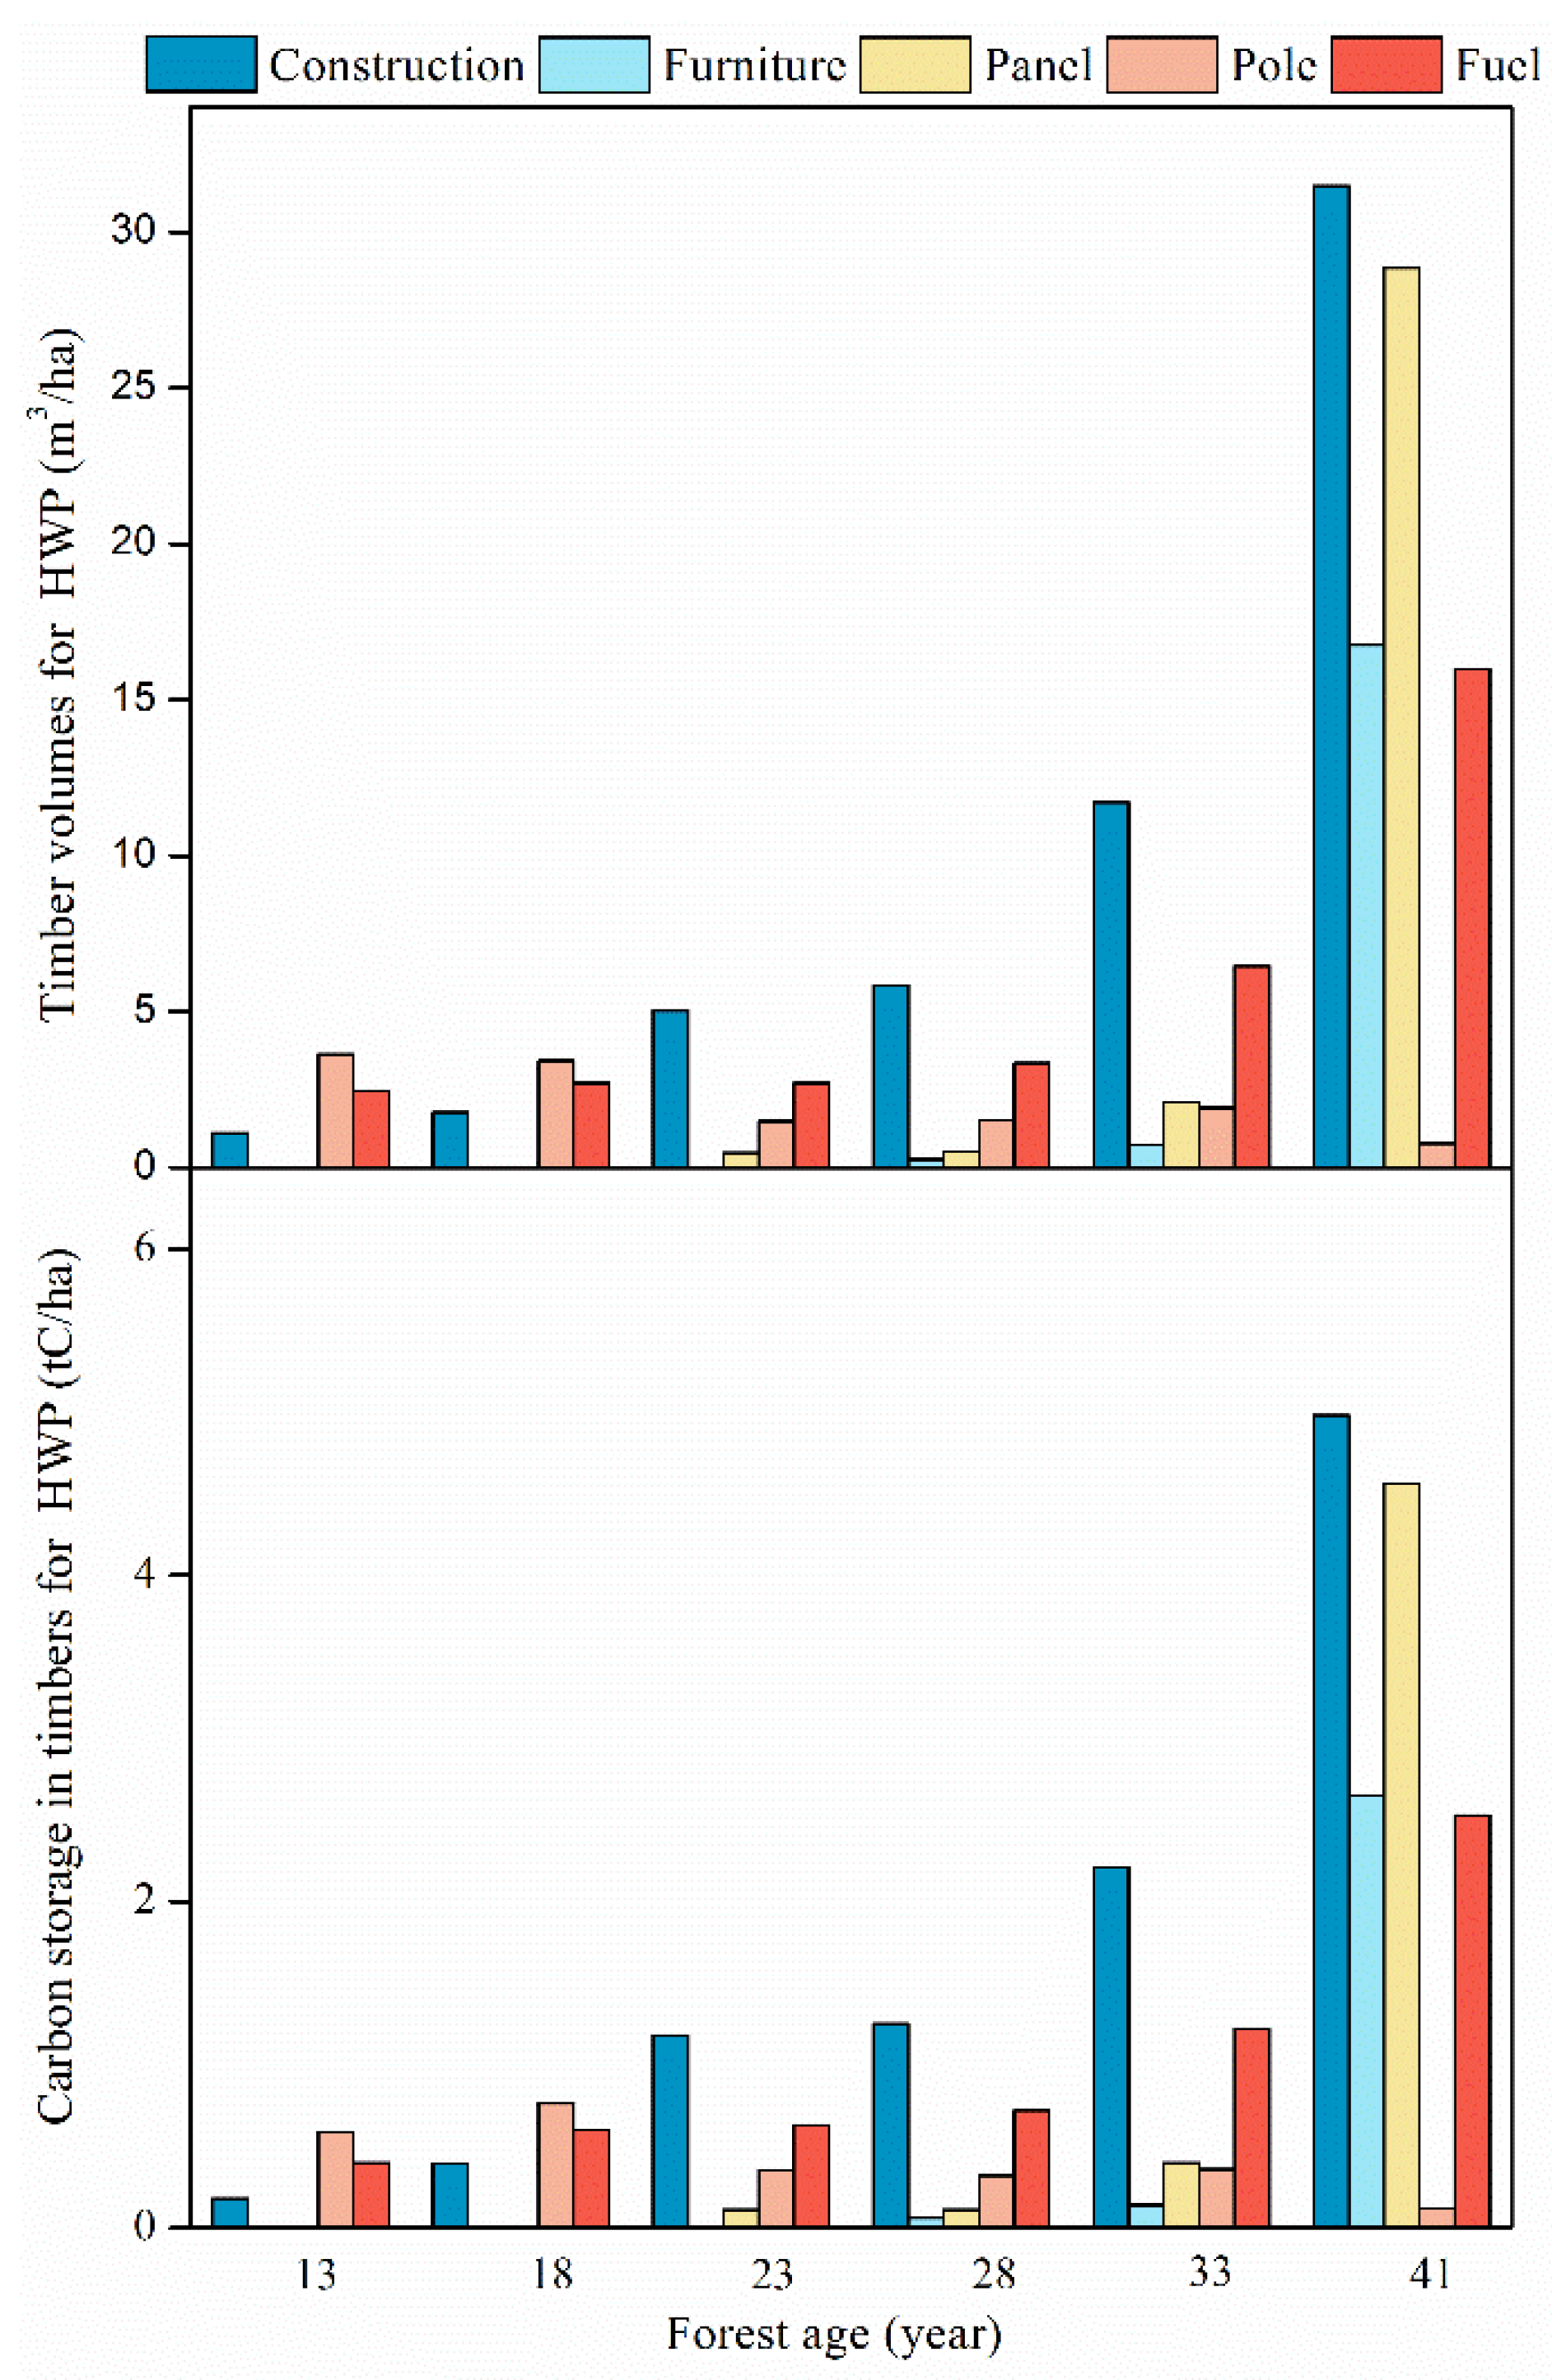
Based on data from our interviews, Table 1 summarizes forestry management practices and material consumption at different forest ages, while Table 2 illustrates the utilization ratio of harvested timber for different uses at different forest ages. Therefore, the carbon flows of harvested timbers can be tracked with all this information.
According to approaches in the PAS 2050 and ISO, two types of data are needed for the HWP carbon footprint calculation in relation to carbon emissions: material consumption and carbon emission factors [3]. Therefore, the carbon footprint in the forestry process (CFforestry) can be calculated by material consumption (Mi) and carbon emission parameters of different materials (δC-Mi) using Equation (5) (Table 3).
C F f o r e s t r y = δ C M i M i

2.3.2. The Manufacturing Process

According to our surveys, harvested timbers were used for construction, furniture, panels, poles and fuel wood. Fuel wood is directly combusted as bio-energy in the harvest year, while poles are buried underground for use (Figure 1). Therefore, there is no manufacturing process for harvested timbers for poles and fuel wood. Other harvested timbers would be processed and manufactured for producing further HWPs, including construction products, furniture products and panel products (Figure 1). Apart from produced HWPs, some byproducts (wood waste) also originate from these harvested timbers, and all of these byproducts are used as wood fuel for energy. In the HWP manufacturing process, coal and petroleum are consumed, resulting in carbon emissions, which contribute to the HWP carbon footprint in the manufacturing process. Previous studies have already estimated timber consumption, material consumption, and byproducts production during production of 1 m3 of different HWPs (See Table 4). Therefore, carbon footprints of HWPs in the manufacturing process can be calculated by material consumption and their carbon emission parameters (Equation (6)). Carbon flows in manufacturing process are reallocated to new produced HWPs and byproducts (wood waste as fuel). The carbon stored in the byproducts as fuel can be estimated by their production and their carbon concentrations, while the remaining carbon in harvested timbers is transferred into produced HWPs.
C F m a n u f a c t u r e = δ C M i M i

2.3.3. The Use and Disposal Process

Based on our interviews and surveys, it was found that fuel wood and poles have very short life spans, while other HWPs have long life spans. Moreover, different HWPs have different disposal treatment pathways. Therefore, we surveyed 128 families in the local area to estimate life spans and disposal treatment pathways for these five typical HWPs, and their results are illustrated in Table 5. In the use and disposal process, HWP is disposed after their life spans and thus their stored carbon is released after their final disposal. When the disposed HWPs are directly combusted, all of their stored carbon would be immediately released back into the atmosphere. For the landfill treatment, carbon in these disposed HWPs would be gradually released into the atmosphere. The Yasso Model in CO2FIX model can be used to estimate carbon emissions from these landfilled HWPs [29], which was also used in this study. There was no external material consumption in this process, and thus there were no carbon emissions and carbon footprint in the HWP use and disposal process.

2.4. Carbon Flows and Carbon Footprints in Their Entire Life Span

For the entire life cycle of HWP, the carbon flow referred to carbon embedded in the HWP. After the final disposal, HWP is treated by combustion or landfill, and thus their stored carbon would be released back into the atmosphere. Thus, the entire carbon flow of HWP included: (1) sequestered carbon in harvested timber; (2) carbon in produced HWP; and (3) carbon emissions from the disposed HWP. The carbon footprint of HWP referred to carbon emissions from material consumption, occurring in the forestry process and in the manufacturing process. Therefore, in this study, the total carbon footprint of HWP for its entire life cycle was the sum of carbon footprints in the forestry process and also in the manufacturing process.

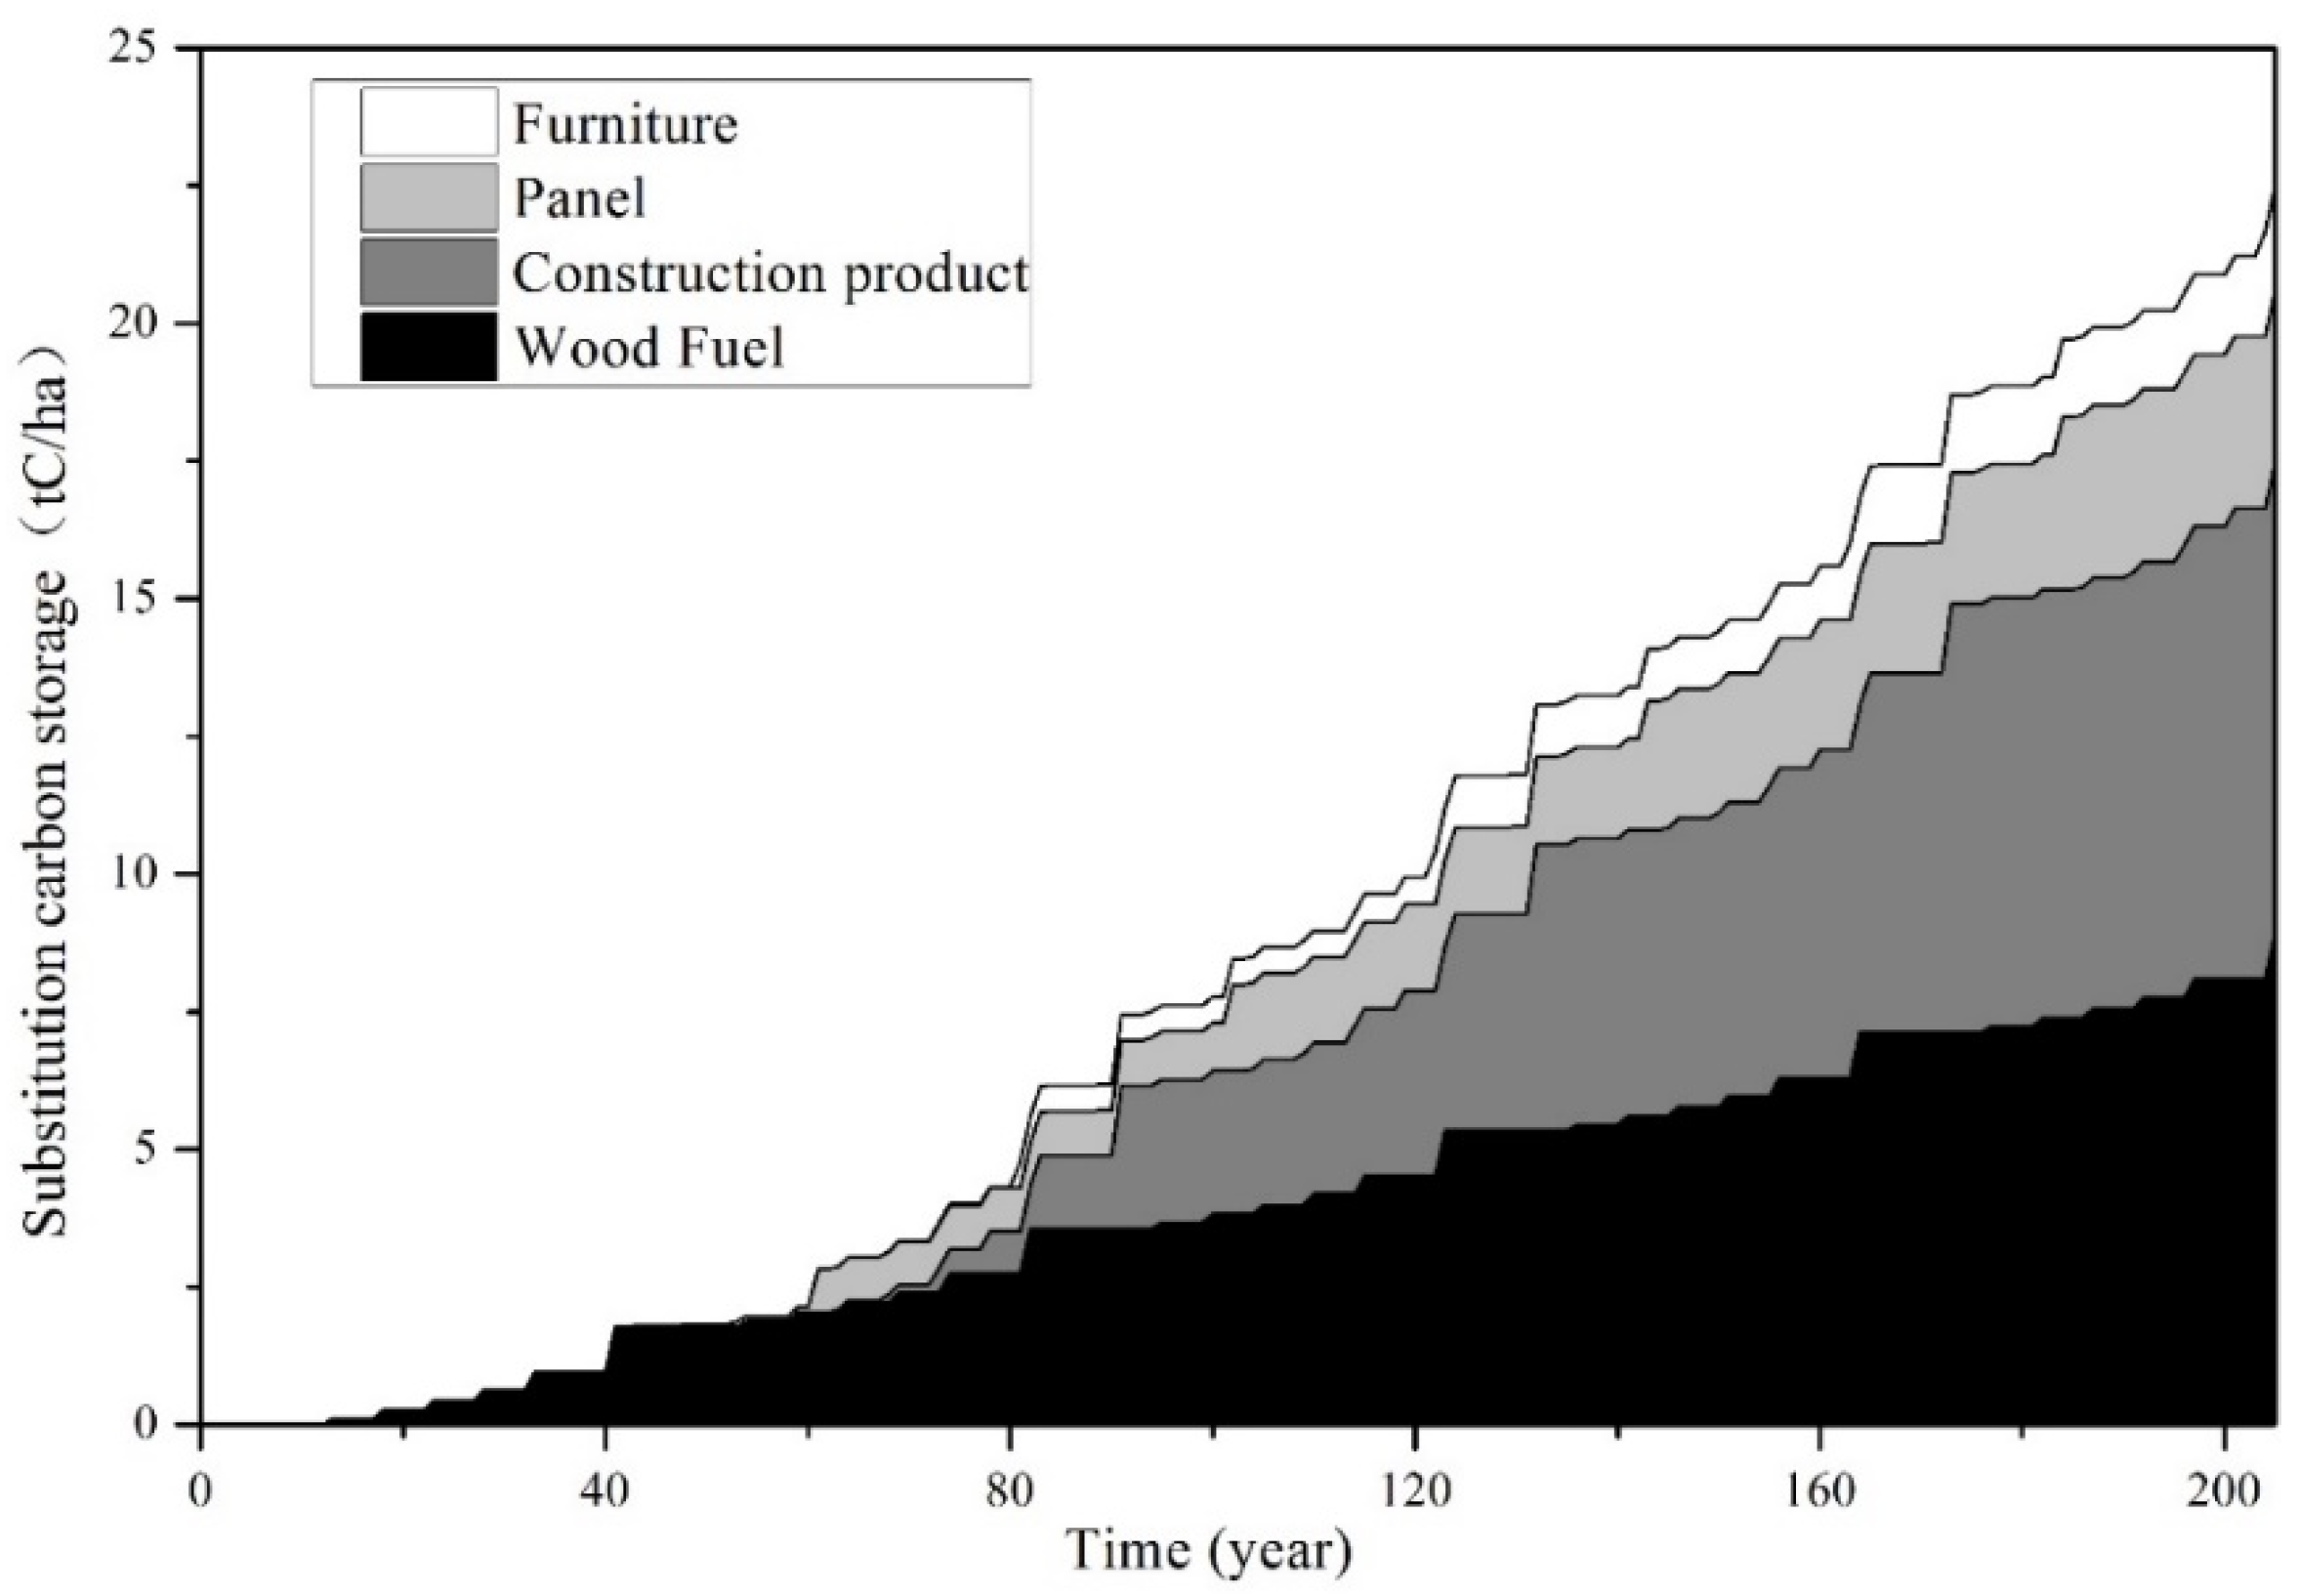
2.5. The Substitution Carbon Storage of HWP

The harvested wood products can substitute some materials (like steel and concrete) and fossil fuels (like petroleum and coal) with higher carbon emission intensities. This reduction of carbon emissions can be considered as the substitution carbon storage of HWP [29]. Here, we only focused on the carbon reduction from the substitution of wood fuel for fossil fuel.
In our study area, all of the wood fuel is used for warming, and thus it can reduce the consumption of coal. Based on previous studies [30,31,32], we assumed that the utilization efficiencies of wood fuel and coal were 10% and 30%, respectively. Therefore, the substitution carbon storage of HWP can be estimated using Equation (7),
S C = F C × C w R C × H w × η w H c × η c
where Sc is the substitution carbon storage by wood fuel (tC/ha); Fc is the carbon emission parameter of standard coal, approximately 0.755 tC/ha; Cw is carbon storage in wood fuel (tC/ha); Rc is the carbon concentration of wood fuel, approximately 0.4971; Hw and Hc are the heat values for wood fuel and standard coal, approximately 12 MJ/kg and 29.27 MJ/kg, respectively; and ηw and ηc are the utilization efficiencies of wood fuel and standard coal, 10% and 30%, respectively.

3. Results

3.1. Carbon Flow and Carbon Footprint in the Forestry Process

3.1.1. Carbon Flow in the Forestry Process

During one rotation period, a total carbon of 26.81 tC/ha, sequestered from the atmosphere, was transferred into harvested timbers, with a total volume of 152.94 m3/ha (Figure 2). With forest growing, more timbers were harvested for producing HWPs, and thus their carbon storage also increased, from 1.16 tC/ha at the 1st thinning (the 13th year of forest age) to 14.85 tC/ha at the final harvest (the 41st year of forest age). Forest growth resulted in the growth of tree height and tree diameter, and thus more harvested timbers could be used to produce HWPs. In the year of the final harvest, carbon stocks in timbers for construction, furniture and panels amounted to 4.98 tC/ha, 2.65 tC/ha and 4.56 tC/ha, respectively. During the 41-year rotation period, approximately 38.0% of harvested timbers were used for producing construction products, and their total carbon storage amounted to 10.19 tC/ha, with a volume of 56.90 m3/ha. The amounts of carbon in timbers for panels and fuel were also large, approximately 5.18 tC/ha and 6.10 tC/ha, respectively.

3.1.2. Carbon Footprint in the Forestry Process

Table 6 illustrates the HWP carbon footprints in the forestry process, as well as their composition. For the 41-year rotation period, the forestry process totally resulted in a carbon emission of 1.59 tC/ha. The harvested timber stored approximately 26.81 tC/ha of the sequestered carbon, with a volume of 152.94 m3/ha. Therefore, the carbon footprint in the forestry process was 10.40 kgC/m3. Producing 1 tC in harvested timber can result in 0.06 tC of carbon emissions in the forestry process. Moreover, seedling cultivation resulted in the smallest carbon emissions of 0.006 tC/ha, approximately 1.80 gC/seeding. Young tree management practices brought in the largest amount of carbon emissions, approximately 0.78 tC/ha, mostly due to the large application of pesticides and fertilizers. The five times of thinning released a total carbon emission of 0.26 tC/ha, including 0.03, 0.03, 0.04, 0.05 and 0.10 tC/ha from the 1st, 2nd, 3rd, 4th and 5th thinning, respectively. The final harvest resulted in a carbon emission of 0.40 tC/ha. Therefore, the carbon emission from timber harvest totaled to 0.66 tC/ha. Energy consumption resulted in the largest carbon emission of 0.79 tC/ha, approximately 50.2% of the total carbon emission in the forestry process, followed by biocide consumption.

3.2. Carbon Flow and Carbon Footprint in the Manufacturing Process

Table 7 illustrates the carbon storage and volumes of produced HWPs and byproducts after the manufacturing process. It also presented the material consumption and their correlated carbon emissions in the manufacturing process.

3.2.1. Carbon Flow in the Manufacturing Process

For the 41-year rotation period, approximately 33.08 m3/ha of construction products were manufactured, with a carbon storage of 9.99 tC/ha. Therefore, its carbon storage intensity was approximately 302.03 kgC/m3. When producing construction products, 0.20 tC/ha of carbon was stored in the 23.82 m3/ha of byproducts as fuel. Although its volume was only 5.73 m3/ha, the carbon storage of furniture products amounted to 2.43 tC/ha, resulting in a high carbon storage intensity of 423.21 kgC/m3. During the furniture manufacturing process, 12.03 m3/ha of byproducts used as fuel were produced. Therefore, to produce 1 m3 of furniture products, the wasted timber for fuel stored 73.30 kgC. In the entire rotation period, 5.03 tC/ha of carbon was stored in the produced panel products (approximately 17.77 m3/ha), with a carbon storage of 0.15 tC/ha in correlated byproducts. Therefore, the carbon storage intensity of panel products amounted to 282.87 kgC/m3. During one rotation period, a total of 0.77 tC/ha carbon was transferred into byproducts for waste fuel combustion in the manufacturing process.

3.2.2. Carbon Footprint in the Manufacturing Process

For the entire 41-year rotation period, the manufacturing process resulted in 10.56 tC/ha of carbon emissions, including 10.43 tC/ha from coal and 0.13 tC/ha from petroleum. A large amount of timbers were harvested in the year of the final harvest, and thus carbon emissions in the manufacturing process reached a maximum of 8.03 tC/ha at that time, accounting for 76.0% of the total carbon emission in the manufacturing process.
Producing construction products resulted in 4.58 tC/ha of carbon emissions, accounting for 43.4% of the total carbon emission in the manufacturing process for producing these three HWPs. With a volume of 33.08 m3/ha, the carbon footprint of construction products was 138.45 kgC/m3 in the manufacturing process, smaller than its carbon storage intensity of 303.03 kgC/m3. Manufacturing construction products resulted in the largest carbon emission during the manufacturing process, but their production efficiency of 58.1% was relatively higher, compared to the other two HWPs. Moreover, more carbon in the harvested timber was transferred into these construction products, and thus the net carbon balance of construction products was the highest in the manufacturing process, approximately 163.58 kgC/m3.
Carbon emissions from panel production were 3.79 tC/ha, including 3.77 tC/ha and 0.02 tC/ha from coal and petroleum, respectively. Therefore, the carbon footprint of panel products was 213.34 kgC/m3 in the manufacturing process, larger than the carbon footprint of construction products. Meanwhile, the carbon storage intensity of panel products was only 282.87 kgC/m3, resulting in its net carbon balance of 69.52 kgC/m3 in the manufacturing process, much smaller than that of construction products.
The carbon storage intensity of furniture was the largest, approximately 408.34 kgC/m3. However, its carbon footprint was also the largest of 381.87 kgC/m3 in the manufacturing process, and thus its net carbon balance was the smallest of 41.34 kgC/m3 in the manufacturing process, only approximately 25.3% of that of construction products. The timber utilization efficiency for producing furniture was very low, and thus 73.20 kgC of carbon would be wasted to produce 1 m3 of furniture, which could only be used for energy. Furthermore, the furniture production began in the 28th year after forest plantation because furniture production consumed much larger timbers.

3.3. Carbon Flow in the Use and Disposal Process and in the Entire Life Cycle

During one entire rotation period, a total carbon storage of 26.81 tC/ha was harvested in timbers. Harvested timbers could not be totally manufactured into HWPs, and parts of them are wasted as fuel. Thus, carbon storage in the final HWPs are as follows: construction products (9.99 tC/ha), furniture products (2.43 tC/ha), panel products (5.03 tC/ha), poles (2.50 tC/ha) and wood fuel (6.87 tC/ha, including waste as fuel). Life span and disposal treatment pathways can influence the carbon emission rate of HWPs as well as their carbon storage. Table 8 summarizes the carbon storage of different HWPs when their rotation period has ended, while Figure 3 shows the HWP carbon flow during the 100 years after forest plantation.
Wood fuel was directly combusted and thus all of their carbon was immediately released back into the atmosphere. Thus, there was no carbon storage in wood fuel. All of the disposed poles were landfilled, and thus their carbon would be gradually released. At the final harvest, only 0.30 tC/ha of carbon was left in the carbon pool of poles, and it decreased to 0.10 tC/ha in the 100th year after forest plantation. Construction products had a long life span, longer than the rotation period of 41 years, and thus all of them were still under use when the rotation period had ended, with no carbon emissions from the HWP. However, all of the disposed furniture products would be totally combusted as fuel, and thus their carbon would be fully released in the 92nd year after forest plantation. Although the life spans of furniture products and panel products were shorter than the rotation period, furniture products and panel products began disposal at the 2nd year and 16th year after the rotation period had ended. Thus, there were no carbon emissions from these two wood products when the rotation period had ended. Consequently, there was 17.75 tC/ha of carbon still stored in HWPs from the rotation period then, especially in the construction products, furniture products and panel products. In addition, a total carbon of 9.06 tC/ha has already been released from the HWPs into the atmosphere. However, with furniture and panel being disposed, their stored carbon gradually was released through combustion or landfill. In the 100th after forest plantation, carbon stocks in furniture and panel were 0.04 tC/ha and 0.11 tC/ha, respectively. Thus, HWP totally only stored 0.25 tC/ha of carbon, which was sequestered about 60–100 years ago.

3.4. The Total Carbon Footprints of Different Harvested Wood Products

The total carbon footprints of HWPs included two parts: (1) the forestry process; and (2) the manufacturing process. Therefore, Table 9 summarizes the total carbon footprints of different HWPs. Based on the above research results, carbon emissions in the forestry process for these HWPs were 0.38 tC/ha (wood fuel), 0.24 tC/ha (poles), 0.54 tC/ha (construction products), 0.15 tC/ha (furniture products) and 0.27 tC/ha (panel products). Therefore, their carbon footprints in the forestry process were 11.42 kgC/m3, 19.17 kgC/m3, 16.36 kgC/m3, 26.47 kgC/m3 and 15.39 kgC/m3, respectively. Timbers for wood fuel and poles were directly consumed, and there was no carbon footprint for manufacturing. However, other HWPs had high manufacturing carbon footprints. Therefore, the total carbon footprints of these three products were 154.81 kgC/m3 (construction products), 408.34 kgC/m3 (furniture products), and 228.73 kgC/m3 (panel products), and their forestry carbon footprints accounted for only a small proportion, approximately 10.6%, 6.7%, and 6.5%, respectively. Considering the total carbon footprint and the carbon storage intensity, there was 147.22 kgC/m3 of the net carbon balance to produce construction products for the entire life cycle. The net carbon balances of panel products and furniture products were much smaller, approximately 54.13 kgC/m3 for panel products and only 14.87 kgC/m3 for furniture products.

4. Discussion

4.1. Substitution Carbon Storage of Harvested Wood Products

As we mentioned, the harvested wood products could substitute some materials and fossil fuels, resulting in the substitution carbon storage of HWP [29], especially for wood fuel substitution on fossil fuel. Therefore, in this context, we discussed the substitution carbon storage of wood fuel for fossil fuel in our study area.
Therefore, based on the above method (Equation (7)), we estimated the substitution carbon storage of different HWPs for the first five forest rotation periods (Figure 4). The substitution carbon storage was increasing during these five rotation periods. There were no poles used for combustion, and thus poles did not have the substitution carbon storage. During the 1st rotation period, all of the construction products, furniture products and panel products had not been disposed, and thus they had no substitution carbon storage. All substitution carbon storage came from wood fuel, and it amounted to 1.78 tC/ha in the end year of the 1st rotation period. When the 5th rotation period had ended, the substitution carbon storage of wood fuel could reach 8.91 tC/ha. With time going on, other wood products began to be disposed for fuel, and thus they began to have the substitution carbon storage. Construction products presented a significantly increasing trend of the substitution carbon storage, amounting to 8.54 tC/ha when the 5th rotation period had ended, approximately 50.2% of the carbon storage in HWPs if the forest plantation continues. Meanwhile, the substitution carbon storage of panel products and furniture products were 3.13 tC/ha and 1.89 tC/ha. Consequently, the total substitution carbon storage of all HWPs from Larix principis-rupprechtii amounted to 22.47 tC/ha when the 5th rotation period had ended, slightly smaller than the carbon storage in the wood products (25.74 tC/ha). In the future, more HWPs would be disposed and thus their substitution carbon storage would increase, exceeding their direct carbon storage. Therefore, HWPs are not only an important carbon pool for lagging carbon emissions into the atmosphere, but their substitution carbon storage should also attract more attention in the future on mitigating carbon emissions.

4.2. Carbon Mitigation Potential of HWP

There are two different alternatives to mitigating global carbon emissions, including: (1) directly reducing carbon emissions; and (2) indirectly increasing carbon storage. HWPs have large carbon mitigation potential. Therefore, in this context, we discussed how to achieve more carbon mitigation from HWPs using two different approaches: (1) to replace fossil fuel using cleaner energy (natural gas) in the manufacturing process; and (2) to increase the utilization efficiency of wood fuel. The former approach can directly reduce carbon emissions, while the latter one can increase the substitution carbon storage to achieve the goal of carbon mitigation. Therefore, we establish three scenarios to discuss carbon mitigation potentials for these two approaches.

(1) To replace fossil fuel using clean energy of natural gas

  • Scenario 1: In the manufacturing process, natural gas replaces 25% of coal and petroleum.
  • Scenario 2: In the manufacturing process, natural gas replaces 50% of coal and petroleum.
  • Scenario 3: In the manufacturing process, natural gas replaces 75% of coal and petroleum.
IPCC reports noted that the parameters of carbon emissions for coal, petroleum and natural gas are 94.6 kg·CO2/GJ, 71.9 kg·CO2/GJ, and 56.1 kg·CO2/GJ. Thus, the carbon emission intensity of natural gas is only 59.3% and 78.0% of that of coal and petroleum. Therefore, the cleaner energy consumption of natural gas can effectively reduce the total carbon emissions in the manufacturing process, with mitigation potentials of 1.07 tC/ha for Scenario 1, 2.14 tC/ha for Scenario 2 and 3.20 tC/ha for Scenario 3 (Table 10). In addition, natural gas consumption also changes carbon footprints and net carbon balances for different HWPs.
With natural gas consumption, all carbon footprints from manufacturing are reduced, while their net carbon balances increase. Since the carbon footprint of construction products is relatively small, its net carbon balance does not present a significant increase by this mitigation approach. However, carbon footprints and net carbon balances of panel products and furniture products show significant changes in all scenarios of cleaner energy substitution. For the panel product, its carbon footprint has been reduced by 21.66 kgC/m3 (Scenario 1), 43.32 kgC/m3 (Scenario 2), and 64.98 kgC/m3 (Scenario 3), with a net carbon balance increase of 40%, 80%, and 120%, respectively. Furniture has the largest total carbon footprint of 381.87 kgC/m3 in the manufacturing process at present. With natural gas replacing other fossil fuels, its net carbon balance increases significantly; Scenario 3 can reach 8.8 times higher than that at present. Therefore, replacing fossil fuels with cleaner energy can effectively reduce carbon emissions in the manufacturing process, especially for those HWPs with a large carbon footprint.

(2) To increase utilization efficiency of wood fuel

  • Scenario 1: The utilization efficiency of wood fuel amounts to 20%.
  • Scenario 2: The utilization efficiency of wood fuel amounts to 25%.
  • Scenario 3: The utilization efficiency of wood fuel amounts to 30%.
At present, the utilization efficiency of wood fuel is very low in rural China, resulting in the energy loss in wood fuel. Therefore, it is currently of high importance to improve the utilization efficiency of wood fuel to face the energy crisis. In addition, wood fuel can replace fossil fuel, generating the substitution carbon storage. Therefore, increasing the utilization efficiency of wood fuel can also increase this carbon storage and thus improve its carbon mitigation effect.
With the present utilization efficiency of 10%, the HWP substitution carbon storage is 5.63 tC/ha for their entire life cycle. However, if the efficiency increases to 20%, 25% and 30%, their substitution carbon storage can amount to 11.26 tC/ha, 14.08 tC/ha and 16.89 tC/ha, respectively. Therefore, their carbon mitigation potentials are 5.63 tC/ha (Scenario 1), 8.45 tC/ha (Scenario 2), and 11.26 tC/ha (Scenario 3). Consequently, increasing the utilization efficiency of wood fuel can positively increase substitution carbon storage, contributing to the carbon mitigation. In the future, it is of high importance to improve the utilization efficiency of wood fuel.

(3) Other mitigation approaches

Apart from the above two approaches, there are still many other approaches that can also achieve the goals of carbon mitigation or slowing carbon emissions over time. These approaches include extending the life span of HWP, recycling and reusing disposed HWPs, improving the production efficiency of HWPs, and so on. These approaches cannot directly mitigate carbon emissions or indirectly increase carbon storage. However, they can provide a significant time lag between carbon sequestration from the atmosphere and carbon emissions back into the atmosphere. Therefore, all of these approaches are also very beneficial for global carbon mitigation in the future. Further studies should be performed to better understand the carbon reduction effects of these approaches.

4.3. Comparative Analysis

This study estimated the carbon flow and carbon footprint of harvested wood products in China, and many previous studies also tried to present carbon footprint of other wood products. However, it is difficult to compare these results with other results, due to different system boundaries and methods used in life cycle inventory and carbon footprints [3]. For example, the forestry process includes seedling cultivation, fertilization, planting, thinning and harvesting in our studies, while the cutting and extraction logs were only considered in the Martinez-Alonso’s study as the forestry process [3]. Therefore, the carbon footprint in the forestry process in our studies was much larger, about 10.40 kgC/m3, compared to 8.5 kgC/m3 in the Martinez-Alonso’s study [3]. Besides, forest rotation period could also have an influence on the carbon emissions in the forestry process, and thus it can have an impact on the carbon footprint in the forestry process. Gonzalez-Benecke et al. [33] estimated a total carbon cost of 0.8536 tC/ha in the forestry process with the rotation period of 22 years, lower than our estimate of 1.59 tC/ha during one rotation period of 41 years. Therefore, it could be very important for comparing different research results in the future to have the same system boundary and methods used in life cycle inventory and carbon footprints. In addition, in the case of the manufacturing process, the carbon footprint of panel products were much larger (about 213.34 kgC/m3), compared to 107–176 kgC/m3 by Wilson [13,14] in the USA, which typically had lower energy consumption and more advanced technologies, compared to that in China. Therefore, it clearly presented that to effectively improve energy efficiency and have more advanced technologies would have a very large potential of carbon mitigation in the manufacturing process in China, which should earn more attention in the future.

5. Conclusions

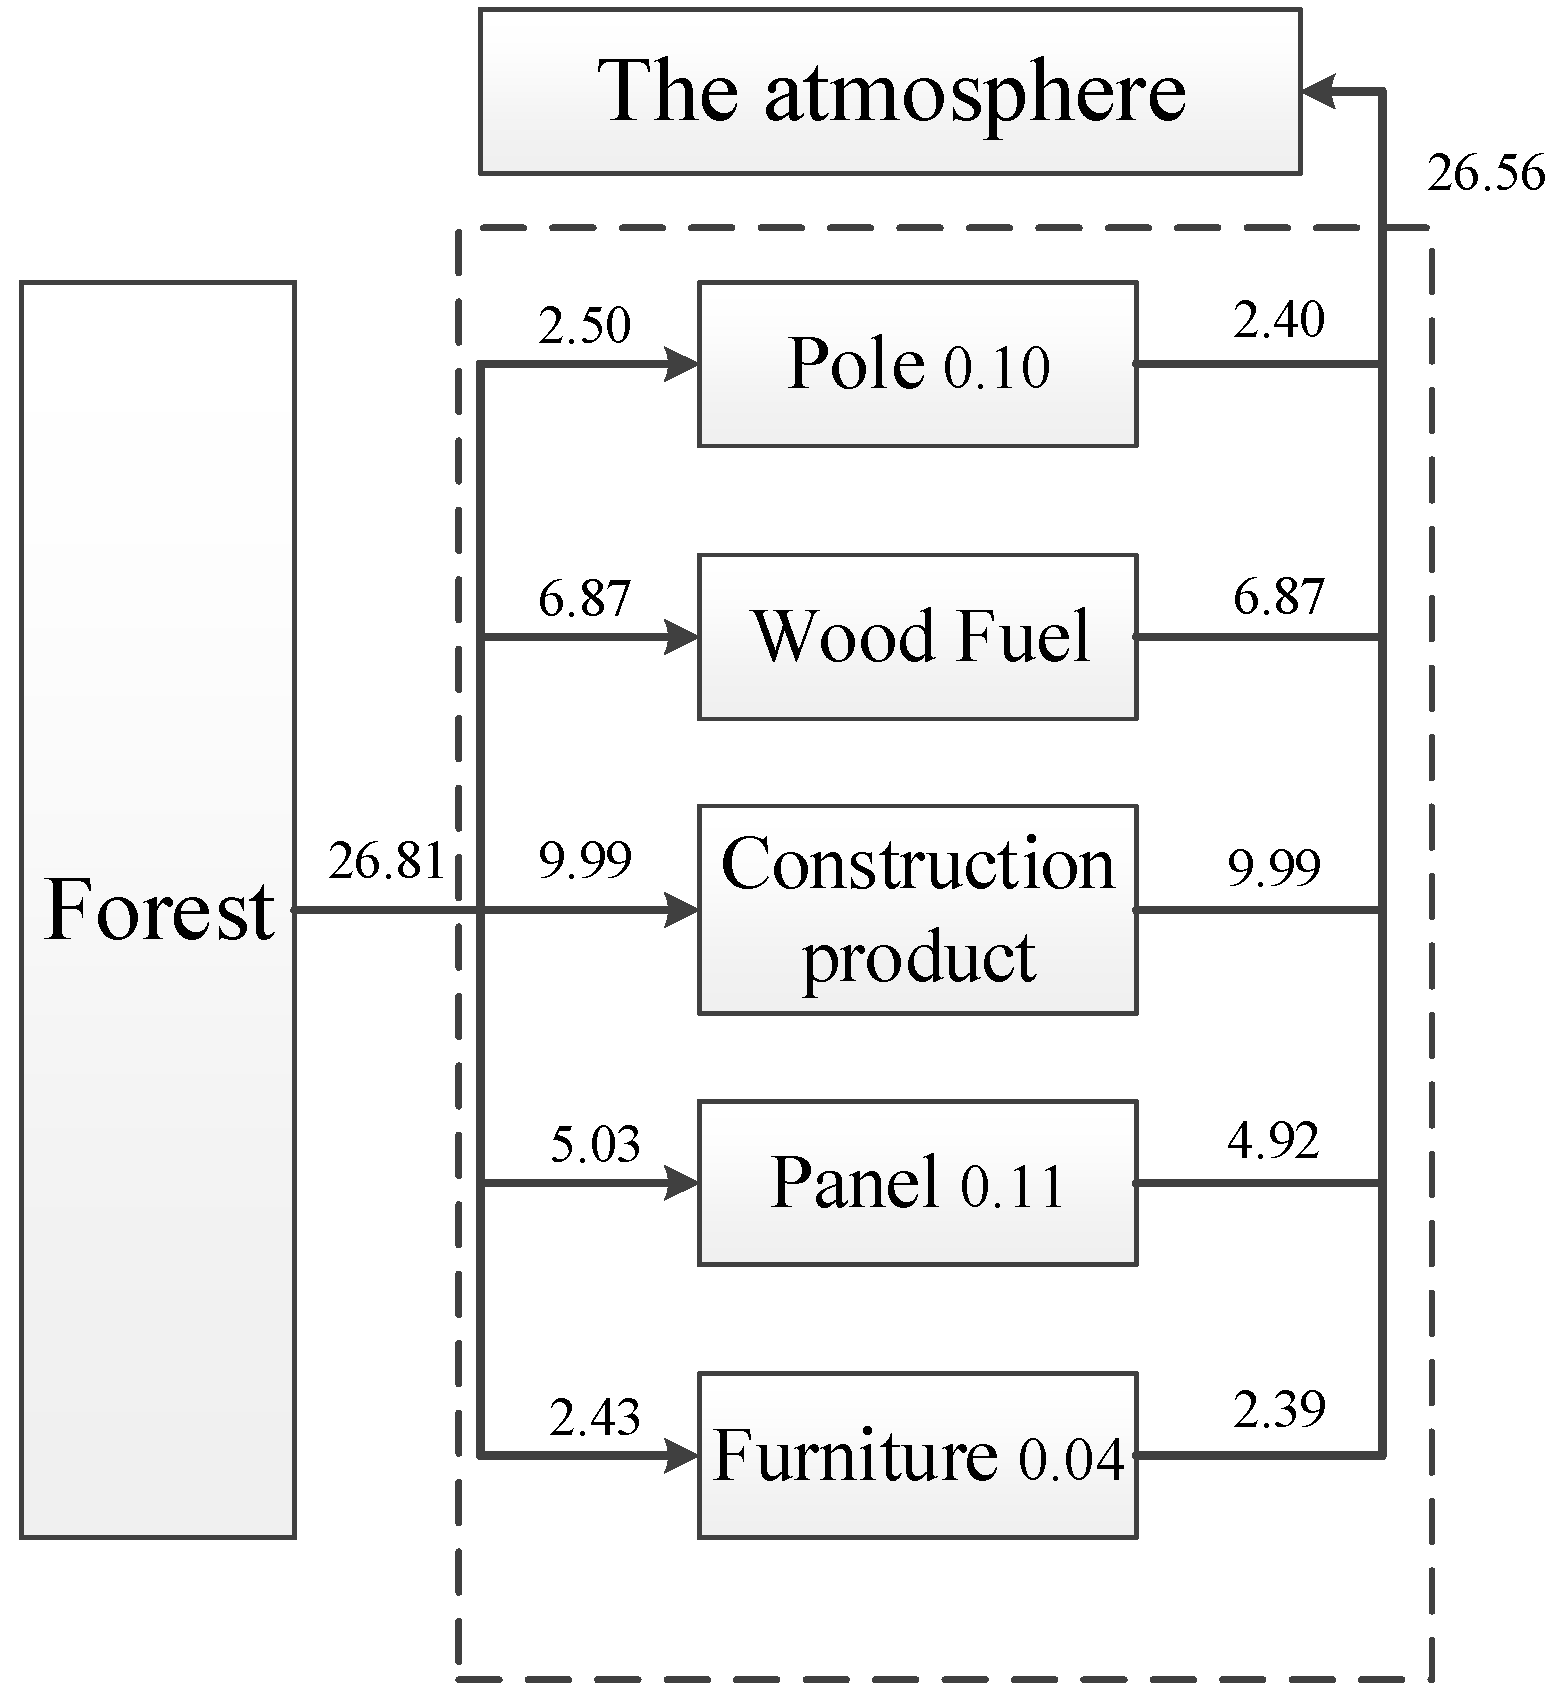
Based on our interviews and surveys, this study evaluated the cradle-to-gate carbon flows and carbon footprints of different HWPs from a forest plantation of Larix principis-rupprechtii in China. For one forest rotation period, a total of 26.81 tC/ha sequestered carbon was transferred into harvested timbers for producing HWPs, 38.0% of which was used for producing construction products. In addition, the forestry process resulted in a total carbon emission of 1.59 tC/ha, leading to a carbon footprint of 10.40 kgC/m3 for the forestry process. After the manufacturing process, this carbon was relocated into different HWPs as follows: construction products (9.99 tC/ha), furniture products (2.43 tC/ha), panel products (5.03 tC/ha), poles (2.50 tC/ha) and wood fuel (6.87 tC/ha, including waste wood as fuel). For the entire 41-year rotation period, the manufacturing process resulted in a total carbon emission of 10.56 tC/ha. When the forest rotation period had ended, there was still 17.75 tC/ha of carbon stored in HWPs. However, the HWP carbon storage decreased to 0.25 tC/ha in the 100th year after forest plantation, mostly stored in panel products and poles. Including the carbon emissions in the forestry process and in the manufacturing process, the total carbon footprints of construction products, furniture products and panel products were 154.81 kgC/m3, 408.34 kgC/m3 and 228.73 kgC/m3, respectively. The manufacturing process was the most important contributor to carbon emissions for the entire life cycle of HWPs, accounting for more than 90% of the total carbon footprint. Considering the carbon emission and the carbon storage, the net carbon balance of construction products were much larger, compared to furniture products and panel products. HWP can store parts of carbon sequestered from the atmosphere for a certain time, which was beneficial for carbon mitigation. Furthermore, all of the wood fuel and parts of disposed HWP can be combusted for energy, resulting in the reduction of fossil fuel consumption, and thus it was also considered to have a positive impact on carbon mitigation. The substitution of fossil fuel by HWP can result in the substitution carbon storage, which should attract more attention in the future. In addition, with regard to further carbon mitigation, there are many alternatives for HWP, such as replacing fossil fuel with cleaner energy and increasing the utilization efficiency of wood fuel.

Acknowledgments

This study was supported by the Beijing Natural Science Foundation Grant (8151002), the National Natural Science Foundation of China (41571022, 91325302, 91425303), the National Science and Technology Major Project (2015ZX07203-005), and the National Program for Support of Top-notch Young Professionals.

Author Contributions

Fei Lun contributed to data analysis and writing the manuscript. Fei Lun, Moucheng Liu, Dan Zhang, Wenhua Li and Junguo Liu contributed equally to this work designing the empirical analysis, organizing the manuscript and revising analysis.

Conflicts of Interest

The authors declare no conflict of interest.

Abbreviations

The following abbreviations are used in this manuscript:
HWP
Harvested Wood Product

References

  1. Lippke, B.; Wilson, J.; Meil, J.; Taylor, A. Characterizing the importance of carbon stored in wood products. Wood Fiber Sci. 2010, 42, 5–14. [Google Scholar]
  2. Kayo, C.; Noda, R.; Sasaki, T.; Takaoku, S. Carbon balance in the life cycle of wood: targeting a timber check dam. J. Wood Sci. 2015, 61, 70–80. [Google Scholar] [CrossRef]
  3. Martínez-Alonso, C.; Berdasco, L. Carbon footprint of sawn timber products of Castanea sativa Mill. in the north of Spain. J. Clean. Prod. 2015, 102, 127–135. [Google Scholar] [CrossRef]
  4. Skog, K.E.; Nicholoson, G.A. Carbon cycling through wood products: The role of wood and paper products in carbon sequestration. Forest Prod. J. 1998, 48, 75–83. [Google Scholar]
  5. Green, C.; Avitabile, V.; Farrell, E.P.; Byrne, K.A. Reporting harvested wood products in national greenhouse gas inventories: Implications for Ireland. Biomass Bioenerg. 2006, 30, 105–114. [Google Scholar] [CrossRef]
  6. Bastianoni, S.; Bosco, S.; Focardi, S.; Brebbia, C.A.; Tiezzi, E. Different accounting approaches to harvested wood products (HWP) in a local greenhouse gas inventory. Ecosyst. Sustain. Dev. 2009, 6, 13–19. [Google Scholar]
  7. IPCC. Summary for Policymakers of Climate Change 2007: The Physical Science Basis. In Contribution of Working Group I to the Fourth Assessment Report of the Intergovernmental Panel on Climate Change; Cambridge University Press: Cambridge, UK, 2007. [Google Scholar]
  8. Bai, Y. Carbon Stocks of Harvested Wood Products in China. Ph.D. Thesis, Chinese Academy of Forestry, Beijing, China, 2010. [Google Scholar]
  9. Grabar, V.A.; Gitarskii, M.L. Assessment of Carbon Sequestration in Forest Products. Russ. Meteorol. Hydrol. 2008, 33, 23–29. [Google Scholar] [CrossRef]
  10. Donlan, J.; Skog, K.K.A. Carbon storage in harvested wood products for Ireland, 1961–2009. Biomass Bioenerg. 2012, 46, 731–738. [Google Scholar] [CrossRef]
  11. Stockmann, K.D.; Anderson, N.M.; Skog, K.E.; Healey, S.P.; Loeffler, D.R.; Jones, G.; Morrison, J.F. Estimates of carbon stored in harvested wood products from the United States forest service northern region, 1906–2010. Carbon Balance Manag. 2012, 7, 1–16. [Google Scholar] [CrossRef] [PubMed]
  12. Eshun, J.F.; Potting, J.; Leemans, R. Inventory analysis of the timber industry in Ghana. Int. J. Life Cycle Assess. 2010, 15, 715–725. [Google Scholar] [CrossRef]
  13. Wilson, J.B. Life-cycle inventory of particleboard in terms of resources, emissions, energy and carbon. Wood Fiber Sci. 2010, 42, 90–106. [Google Scholar]
  14. Wilson, J.B. Life-cycle inventory of medium density fiberboard in terms of resources, emissions, energy and carbon. Wood Fiber Sci. 2010, 42, 107–124. [Google Scholar]
  15. Heath, L.S.; Meltby, V.; Miner, R.; Skog, K.E.; Smith, J.E.; Unwin, J.; Upton, B. Greenhouse Gas and carbon profile of the US forest products industry value chain. Environ. Sci. Technol. 2010, 44, 3999–4005. [Google Scholar] [CrossRef] [PubMed]
  16. Proietti, S.; Sdringola, P.; Desideri, U.; Zepparelli, F.; Brunori, A.; Ilarioni, L.; Nasini, L.; Regni, L.; Proietti, P. Carbon footprint of an olive tree grove. Appl. Energy 2014, 127, 115–124. [Google Scholar] [CrossRef]
  17. White, M.K.; Gower, S.T.; Ahl, D.E. Life cycle inventories of round wood production in northern Wisconsin: Inputs into an industrial forest carbon budget. For. Ecol. Manag. 2005, 219, 13–28. [Google Scholar] [CrossRef]
  18. May, B.; England, J.R.; Raison, R.J.; Paul, K.I. Cradle-to-gate inventory of wood production from Australian softwood plantations and native hardwood forests: Embodied energy, water use and other inputs. For. Ecol. Manag. 2012, 264, 37–50. [Google Scholar] [CrossRef]
  19. Lun, F.; Li, W.; Liu, Y. Complete forest carbon cycle and budget in China, 1999–2008. For. Ecol. Manag. 2012, 264, 81–89. [Google Scholar] [CrossRef]
  20. Wang, H.; Yang, Y.; Zhang, X.; Tian, G. Carbon footprint analysis for mechanization of maize production based on life cycle assessment: A case study in Jilin Province, China. Sustainability 2015, 7, 15772–15784. [Google Scholar] [CrossRef]
  21. Lun, F. Life Cycle Assessment of Carbon Budget in the Larix principis-rupprechtii Plantation Forest System: Taking Mulan Nation-Owned Forest for Example. Ph.D. Thesis, the University of Chinese Academy of Sciences, Beijing, China, 2014. [Google Scholar]
  22. Liu, Y. The Study of Single Biomass, Carbon Storage and Distribution of Larix principis-ruppr echtii and Populus in Hebei Province. Master’s Thesis, Agricultural University of Hebei, Baoding, China, 2012. [Google Scholar]
  23. Ma, Q.; Chen, X.; Wang, J. Carbon content rate in constructive species of main forest types in northern China. J. B. For. Univ. 2002, 24, 96–100. [Google Scholar]
  24. The Intergovernmental Panel on Climate Change (IPCC). IPCC Guidelines for National Greenhouse Gas Inventories, Prepared by the National Greenhouse Gas Inventories Programme; Eggleston, H.S., Buendia, L., Miwa, K., Ngara, T., Tanabe, K., Eds.; The Institute for Global Environmental Strategies: Hayama, Japan, 2006. [Google Scholar]
  25. State Forestry Administration of the People’s Republic of China. Energy Consumption for Wood Production in Forest Region—Part 1: Overall Energy Consumption; LY/T 1444.1-2005; Standards Press of China: Beijing, China, 2005. [Google Scholar]
  26. West, T.; Marland, G. A synthesis of carbon sequestration, carbon emissions, and net carbon flux in agriculture: Comparing tillage practices in the United States. Agric. Ecosyst. Environ. 2002, 91, 217–232. [Google Scholar] [CrossRef]
  27. Yan, P.; Yang, J. Quantitative assessment of the embodied environmental of wood products. J. Tsinghua Univ. Sci. Tech. 2008, 48, 15–18. [Google Scholar]
  28. Xue, Y.; Wang, J. Life cycle assessment of Panel furniture made from medium density fiberboard. China Wood Ind. 2009, 23, 22–25. [Google Scholar]
  29. Schelhass, M.; van Esch, P.; Groen, T.; de Jong, B.; Kanninen, M.; Liski, J.; Masera, O.; Mohren, G.; Nabuurs, G.; Palosuo, T.; et al. CO2Fix V3.1—A Modeling Framework for Quantifying Carbon Sequestration in Forest Ecosystem; Alterra: Wageningen, The Netherlands, 2004. [Google Scholar]
  30. Lun, F.; Canadell, J.G.; Xu, Z.; He, L.; Yuan, Z.; Zhang, D.; Li, W.; Liu, M. Residential energy consumption and associated carbon emission in forest rural area in China: A case study in Weichang County. J. Mt. Sci. 2014, 11, 792–804. [Google Scholar] [CrossRef]
  31. Wang, S.R.; Wang, Z.Y.; Qiu, Q.R. High efficiency energy saving shelf pre-installed kang-linked stove. Renew. Sustain. Energ. Rev. 2006, 126, 75–77. [Google Scholar]
  32. Zhou, Z.R.; Wu, W.L.; Chen, Q.; Chen, S.F. Study on sustainable development of rural household energy in northern China. Renew. Sustain. Energ. Rev. 2008, 12, 2227–2239. [Google Scholar] [CrossRef]
  33. Gonzalez-Benecke, C.; Martin, T.; Jokela, E.; Torre, R.D.L. A flexible hybrid model of life cycle carbon balance for loblolly pine (Pinus taeda L.) management systems. Forests 2011, 2, 749–776. [Google Scholar] [CrossRef]
Figure 1. The system boundary of the entire life cycle of HWPs from Larix principis-rupprechtii.
Sustainability 08 00247 g001
Figure 2. Carbon storage and volume of timbers for different HWPs at different forest age.
Sustainability 08 00247 g002
Figure 3. The carbon flows of different HWPs during the 100 years after forest planation.
Sustainability 08 00247 g003
Figure 4. The substitution carbon storage of different HWPs for five forest rotation periods.
Sustainability 08 00247 g004
Table 1. Forestry management practices in the Larix principis-rupprechtii plantation forest.
TimePracticeConsumptionHarvested Trees
Seedling CultivationThe 1st year of seedlingSite PreparationHuman: 1 person/ha; Petroleum: 150 L/ha; Pesticide: 300 kg/ha-
SowingPetroleum: 45 L/ha-
Seedling ManagementIrrigation: Electricity; Pesticide: 15 kg/ha; N fertilizer: 135 kg/ha; K and P fertilizer: 45 kg/ha; herbicide: 375 mL/ha-
The 2nd year of seedlingSeedling ManagementN fertilizer: 136 kg/ha; Herbicide: 360 mL/ha-
Forest ManagementThe 1st year of forestSite PreparationPetroleum: 150 L/ha-
Forest PlantationHuman: 30 person/ha-
Forest ManagementN fertilizer: 450 kg/ha; P fertilizer: 330 kg/ha; K fertilizer: 82.5 kg/ha-
The 1st year to the 6th year of forestForest ManagementHerbicide: 20 kg/ha for the first 3 years and 10 kg/ha for the 4th and 5th year; Human: 30 person/ha-
The 9th year of forestSinglingHuman for singling: 30 person/ha2800
The 13th year of forestThe 1st ThinningGasoline for harvesting: 0.22 kg/m3; Diesel oil for Gathering: 3.30 kg/m3; Diesel oil for haulage: 1.5 kg/m3; The distance from forest to sawmill was considered to be 10 km.688
The 18th year of forestThe 2nd Thinning456
The 23rd year of forestThe 3rd Thinning324
The 28th year of forestThe 4th Thinning227
The 33rd year of forestThe 5th Thinning316
The 41st year of forestFinal harvest789
Table 2. The utilization ratio of harvested timbers for different uses at different forest ages.
AgeConstruction ProductsFurniturePanelPoleFuel Wood
138.4%0.0%0.0%27.8%18.7%
1811.7%0.0%0.0%22.7%18.0%
2328.0%0.0%2.5%8.2%15.1%
2829.2%1.3%2.5%7.5%16.8%
3328.7%1.8%5.1%4.6%15.8%
4120.0%10.6%18.3%0.5%10.2%
Table 3. Carbon emission parameters of different materials.
MaterialParameterReference
EnergyPetroleum0.74 kgC/L[24]
Gasoline0.823 kgC/kg[24,25]
Diesel0.863 kgC/kg[24,25]
Electricity266.48 kgC/ha[26]
FertilizerN Fertilizer0.39 kgC/kg[26]
P Fertilizer and K Fertilizer0.14 kgC/kg[26]
BiocidePesticide5.18 kgC/kg[26]
Herbicide4.70 kgC/L[26]
HumanHuman0.72 kgC/person/day[21]
Table 4. The wood consumption and material consumption for producing 1 m3 of different HWPs, as well as the production and their carbon concentration of byproducts as fuel.
HWPWood Products m3Harvested Wood m3Coal [27] kgPetroleum kgWood Waste kgCarbon in Wood Waste kgC
Construction products [27]11.72180.112.8811.935.93
Panels [27]11.80281.161.2116.918.40
Furniture [28]13.10497.307.48287.5614.7%
Table 5. The life spans and disposal treatment pathways for different HWPs.
HWPLife Span (Year)Disposal Treatment Way
Combustion (%)Landfill (%)
Fuel wood1100%-
Pole3-100%
Construction products50100%-
Furniture4075%25%
Panel2060%40%
Table 6. Carbon emissions in the forestry process (tC/ha).
Forestry PracticesEnergyFertilizerBiocideHumanTotal
Seedling Cultivation0.0010.0000.0040.006
Tree Plantation0.130--0.0220.15
Young Tree Management-0.2510.3760.1300.78
Total Thinning0.255---0.26
Final Harvest0.404---0.40
Total0.7900.2510.3810.1511.59
Table 7. Carbon flows, energy consumption and carbon emissions in the manufacture process.
Construction Products
Forest AgeProductsByproductConsumptionCarbon Emission
Volume (m3/ha)Carbon Storage (tC/ha)Volume (m3/ha)Carbon Storage (tC/ha)Coal (t/ha)Petroleum (kg/ha)Coal (tC/ha)Petroleum (tC/ha)Total (tC/ha)
130.640.170.4600.121.840.090.00160.09
181.020.380.740.010.182.940.140.00250.14
232.921.162.110.020.538.420.400.010.40
283.391.232.440.020.619.770.460.010.47
336.812.174.900.041.2319.620.930.020.94
4118.34.8713.170.113.352.72.490.042.53
Total33.089.9923.820.205.9695.284.500.084.58
Furniture Products
Forest AgeProductsByproductConsumptionCarbon Emission
Volume (m3/ha)Carbon Storage (tC/ha)Volume (m3/ha)Carbon Storage (tC/ha)Coal (t/ha)Petroleum (kg/ha)Coal (tC/ha)Petroleum (tC/ha)Total (tC/ha)
280.090.050.180.010.040.640.0300.03
330.230.120.50.020.121.760.0900.09
415.412.2611.350.392.6940.52.030.032.07
Total5.732.4312.030.422.8542.92.150.042.19
Panel Products
Forest AgeProductsByproductConsumptionCarbon Emission
Volume (m3/ha)Carbon Storage (tC/ha)Volume (m3/ha)Carbon Storage (tC/ha)Coal (t/ha)Petroleum (kg/ha)Coal (tC/ha)Petroleum (tC/ha)Total (tC/ha)
230.250.100.2100.070.310.0500.05
280.280.110.2300.080.340.0600.06
331.170.390.930.010.331.410.2500.25
4116.064.4312.780.134.5219.363.410.023.43
Total17.775.0314.150.155.0021.413.770.023.79
Table 8. Carbon storage of different HWPs when the rotation period has ended (tC/ha).
Wood ProductsConstruction ProductsFurniturePanelsPolesWood FuelTotal
Carbon Input9.992.435.032.506.8726.81
Carbon Storage at the final harvest9.992.435.030.30017.75
Table 9. Carbon footprints of different HWPs for one rotation period.
Harvested Wood ProductsWood FuelPolesConstruction ProductsFurniturePanels
Productionm3/ha33.6612.7233.085.7317.77
Forestry carbon emissiontC/ha0.380.240.540.150.27
Forestry carbon footprintkgC/m311.4219.1716.3626.4715.39
Manufacture carbon emissiontC/ha--4.582.193.79
Manufacture carbon footprintkgC/m3--138.45381.87213.34
Total carbon emissiontC/ha0.380.245.122.344.06
Total carbon footprintkgC/m311.4219.17154.81408.34228.73
Table 10. Carbon storage intensity, carbon footprint and net carbon balance of different HWPs at different scenarios of cleaner energy substitution (kgC/m3).
Wood ProductsPresentScenario 1Scenario 2Scenario 3
Construction productCarbon storage intensity302.03302.03302.03302.03
Total carbon footprint154.81140.84126.86112.89
Net carbon balance147.22161.19175.17189.14
PanelCarbon storage intensity282.87282.87282.87282.87
Total carbon footprint228.73207.07185.41163.76
Net carbon balance54.1475.897.46119.11
FurnitureCarbon storage intensity423.21423.21423.21423.21
Total carbon footprint408.34369.78331.23292.67
Net carbon balance14.8753.4391.98130.54

