
How to Move China toward a Green-Energy Economy: From a Sector Perspective


Abstract
:1. Introduction
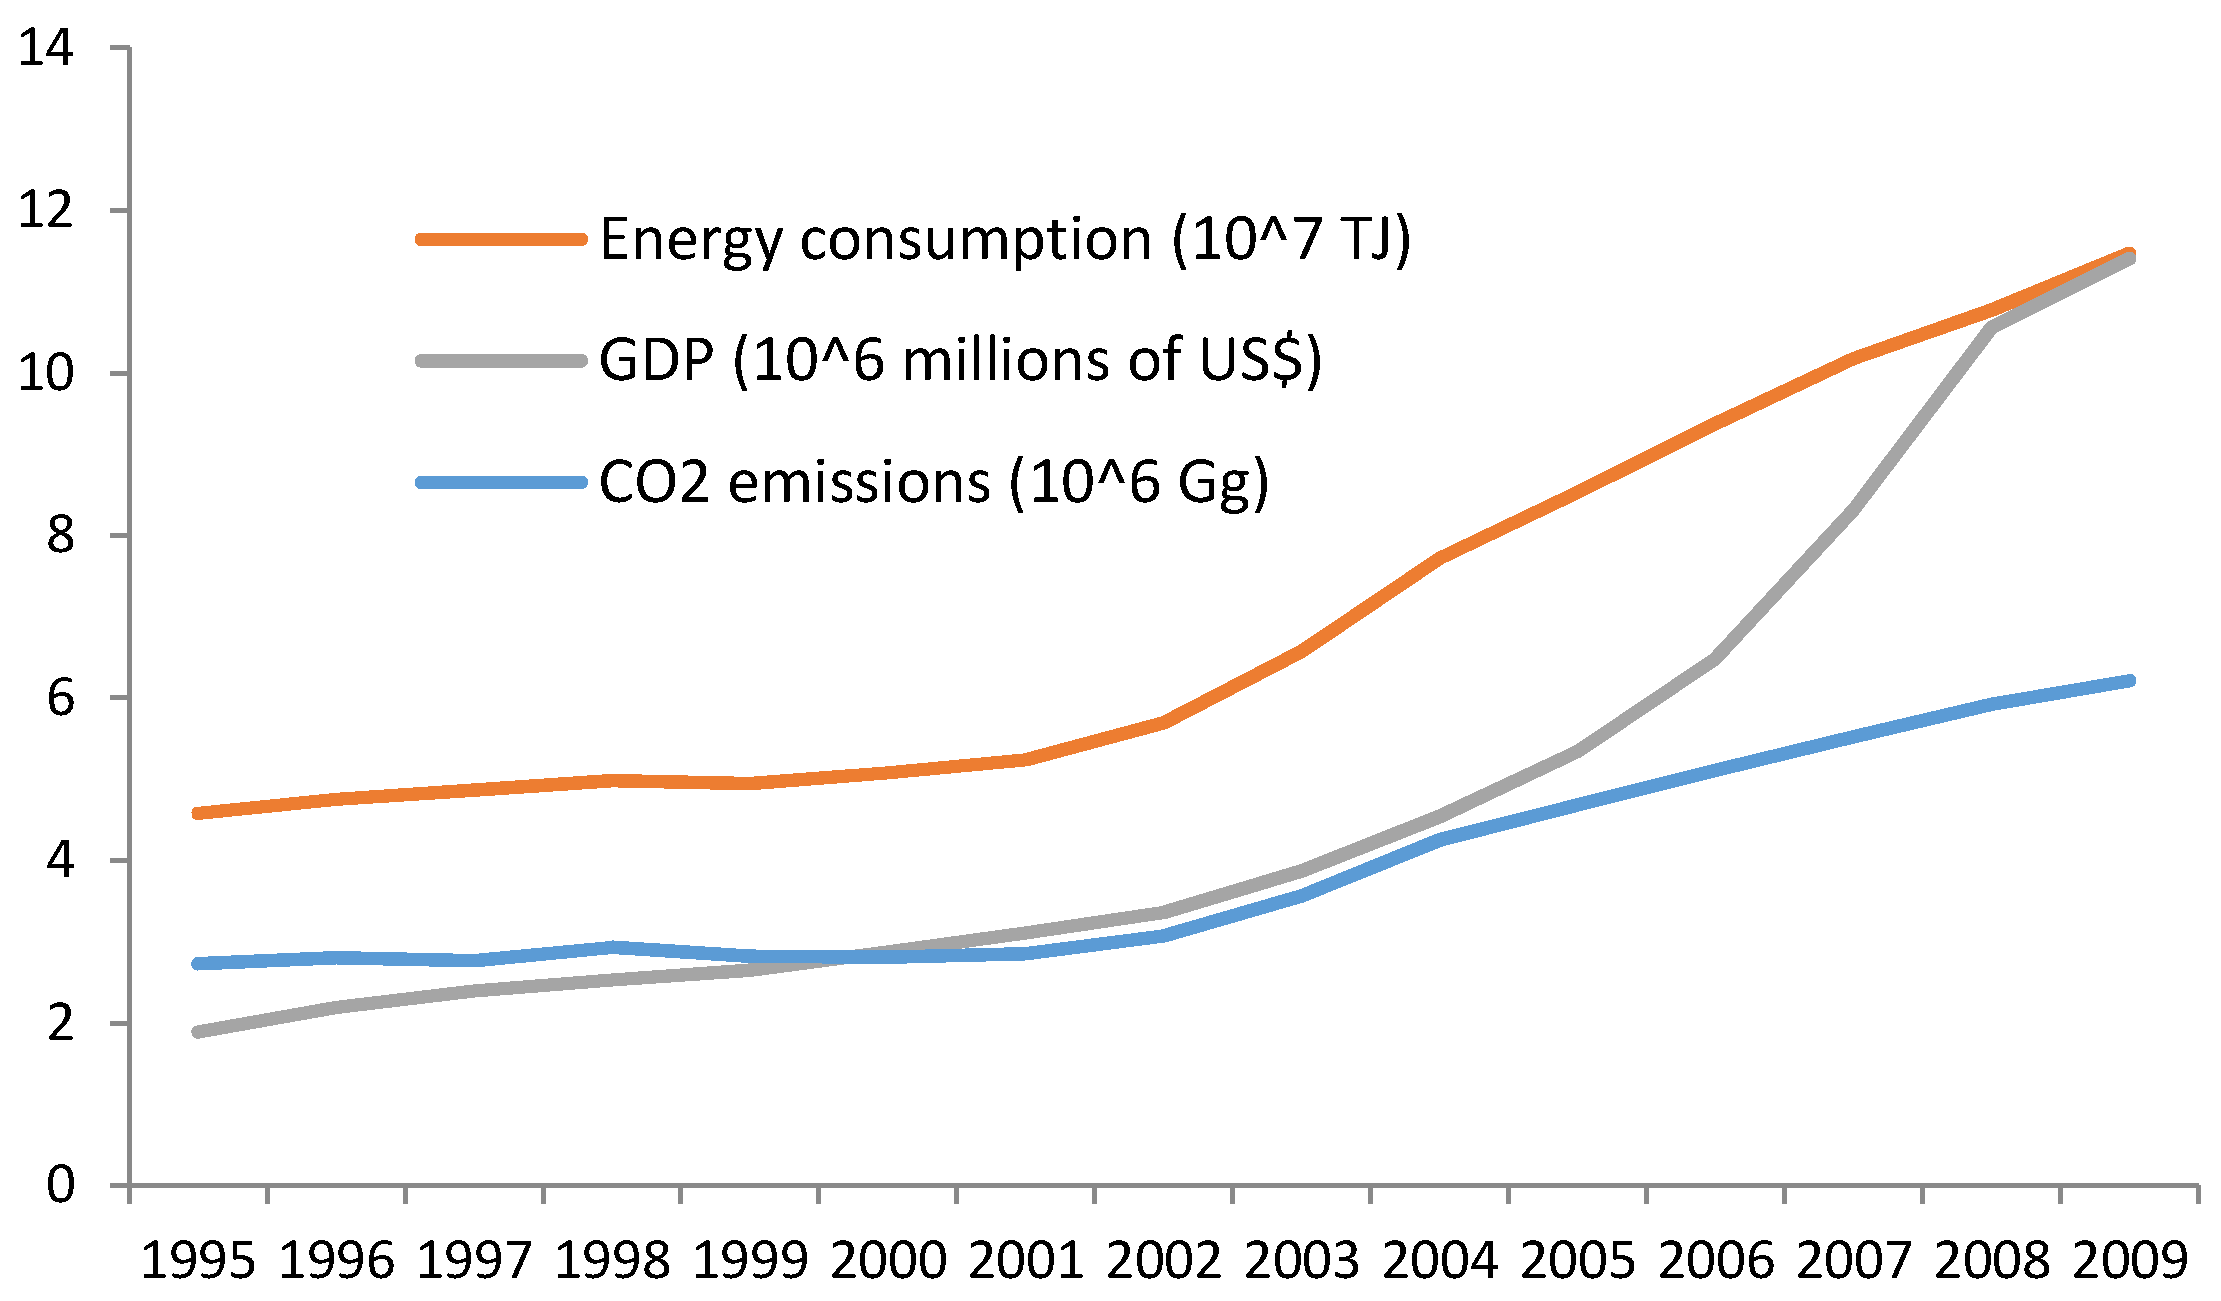
1.1. Background information
1.2. Literature Review
2. Methodologies and Data Definitions
2.1. Methodologies
2.2. Database
3. Empirical Results and Analyses
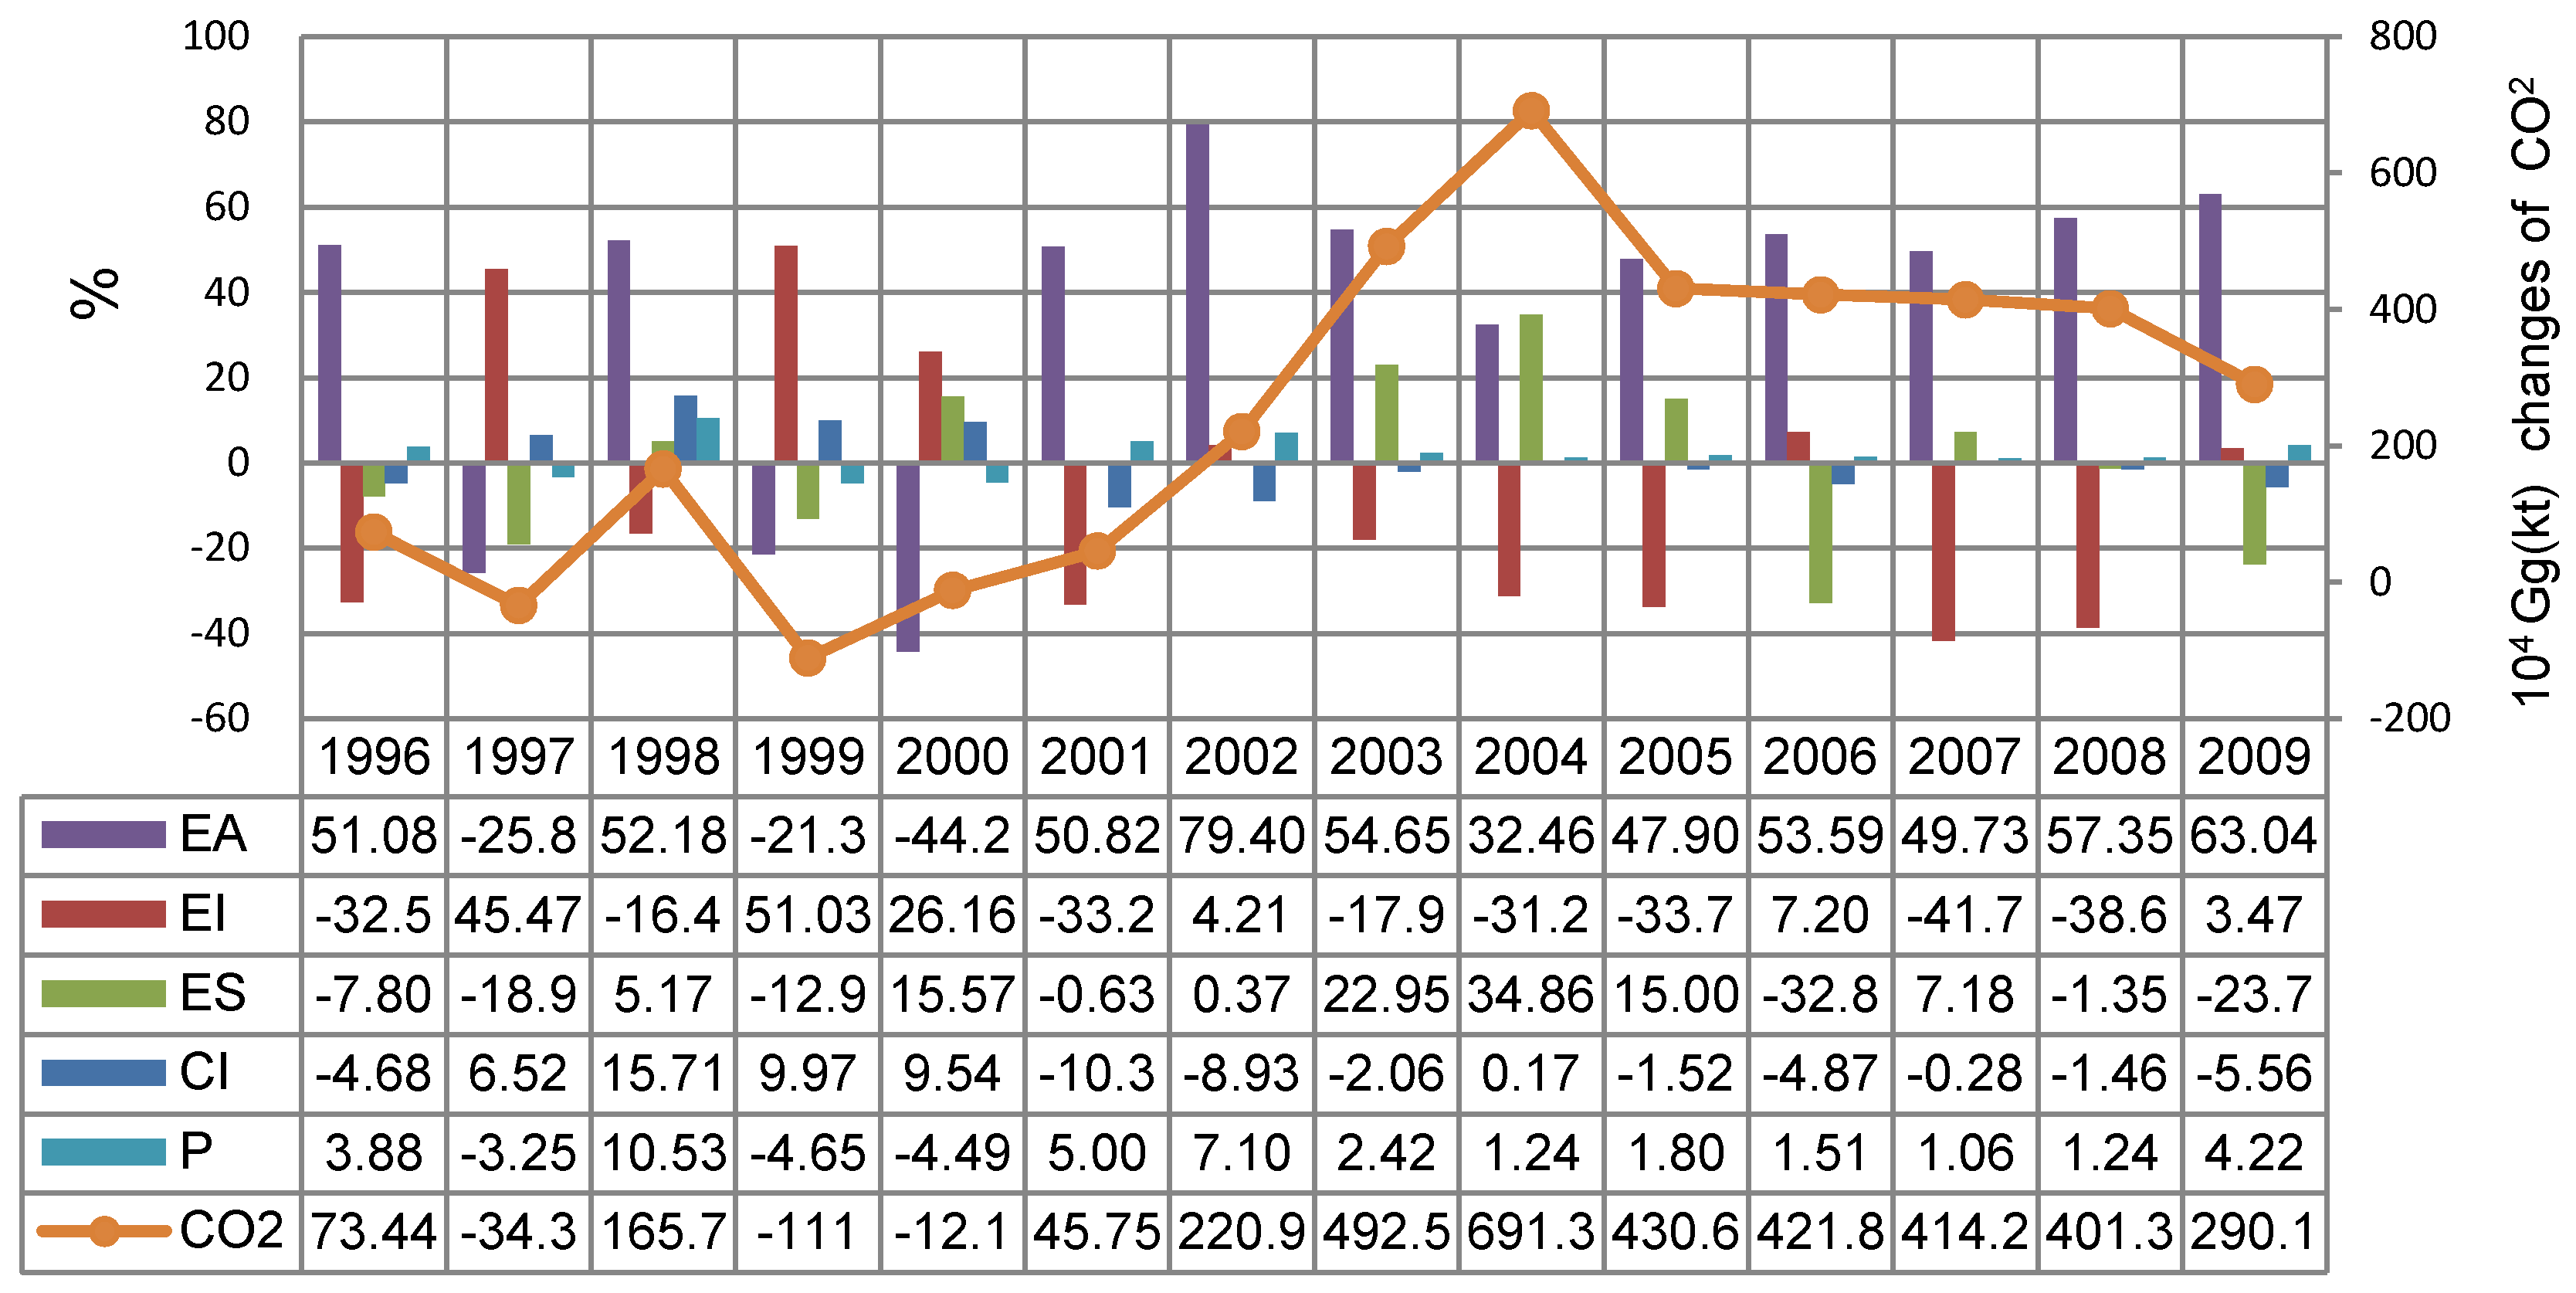
3.1. Economic Activity (EA)
3.2. The Energy Intensity Factor (EI)
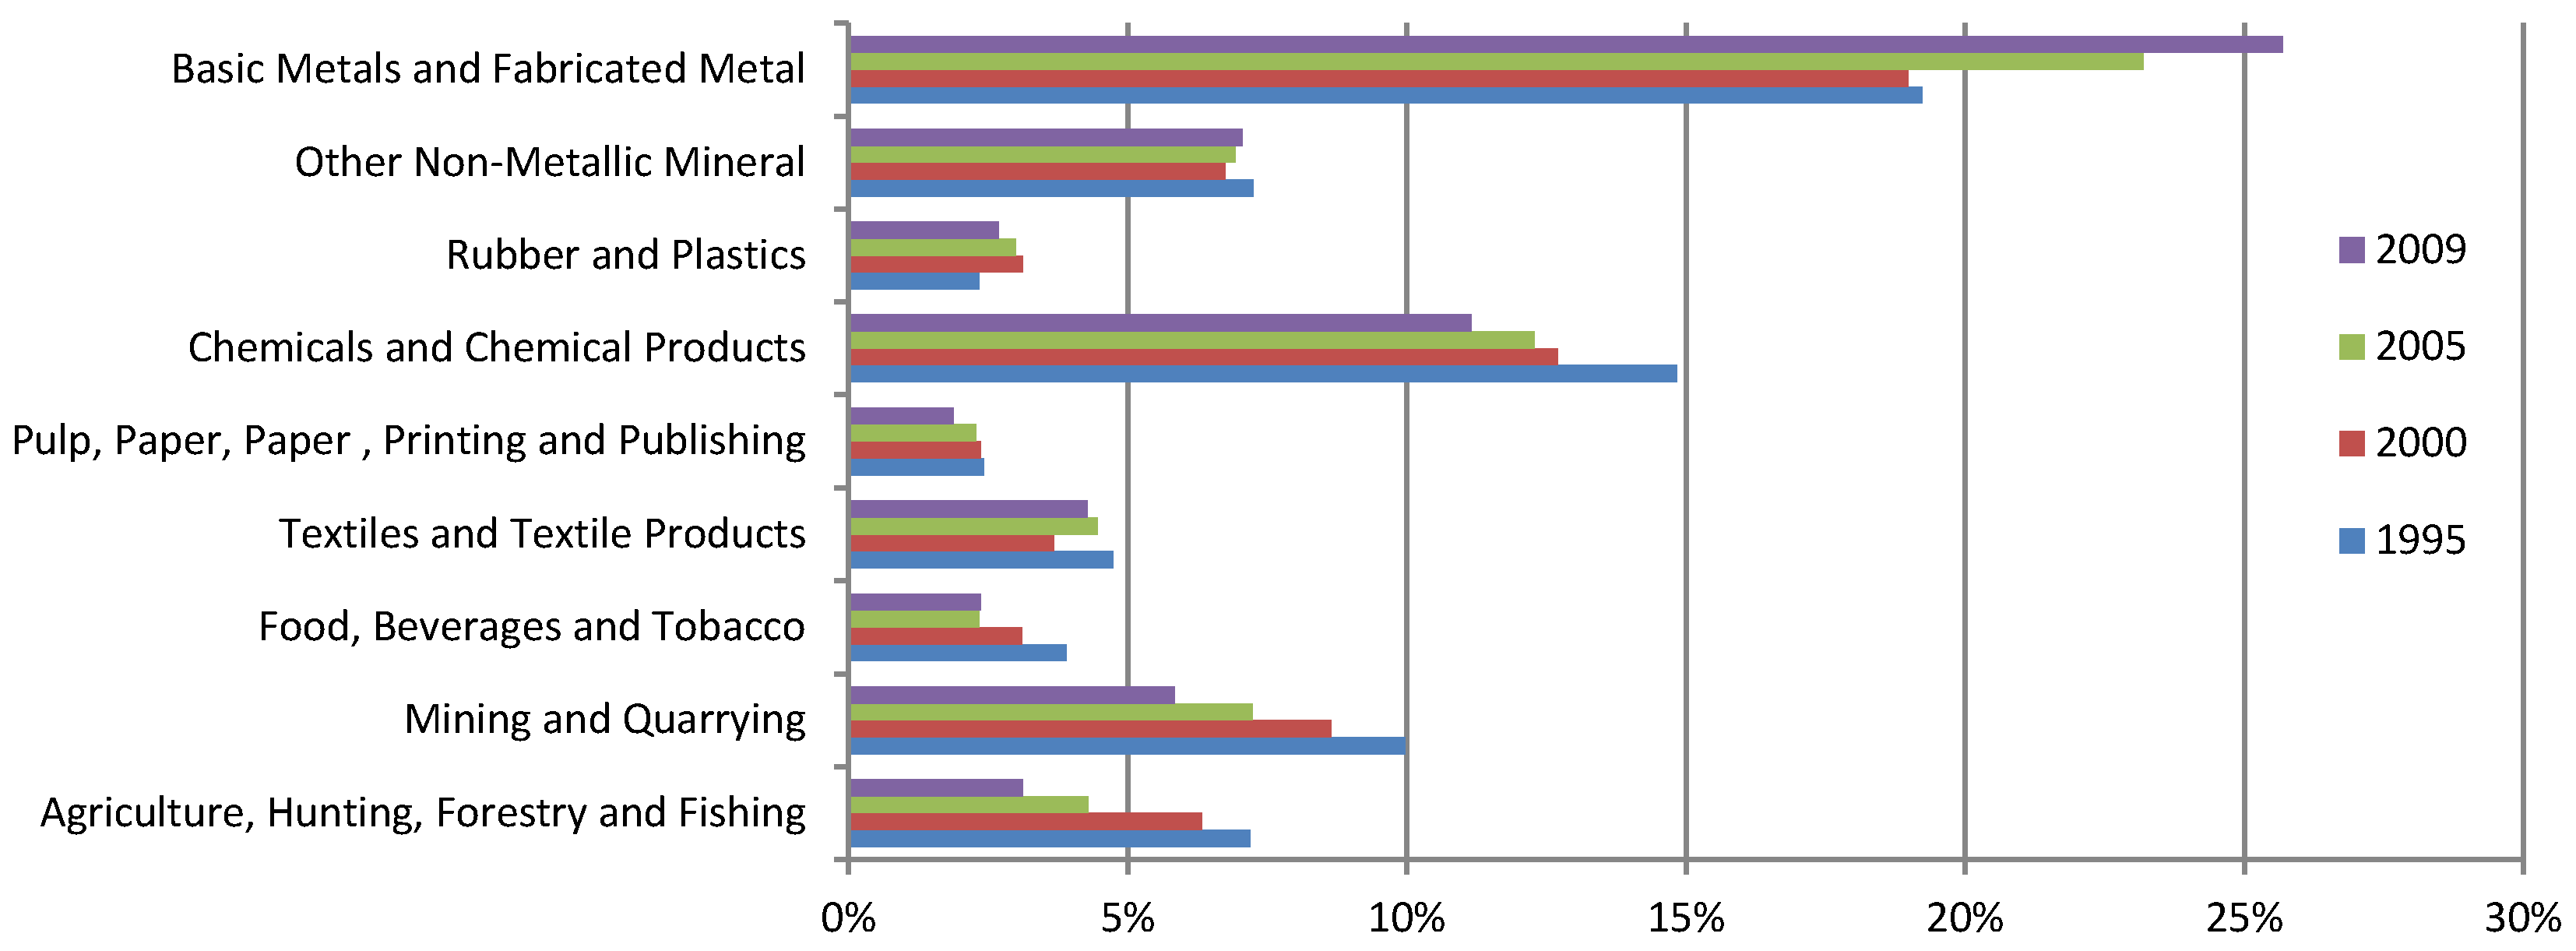
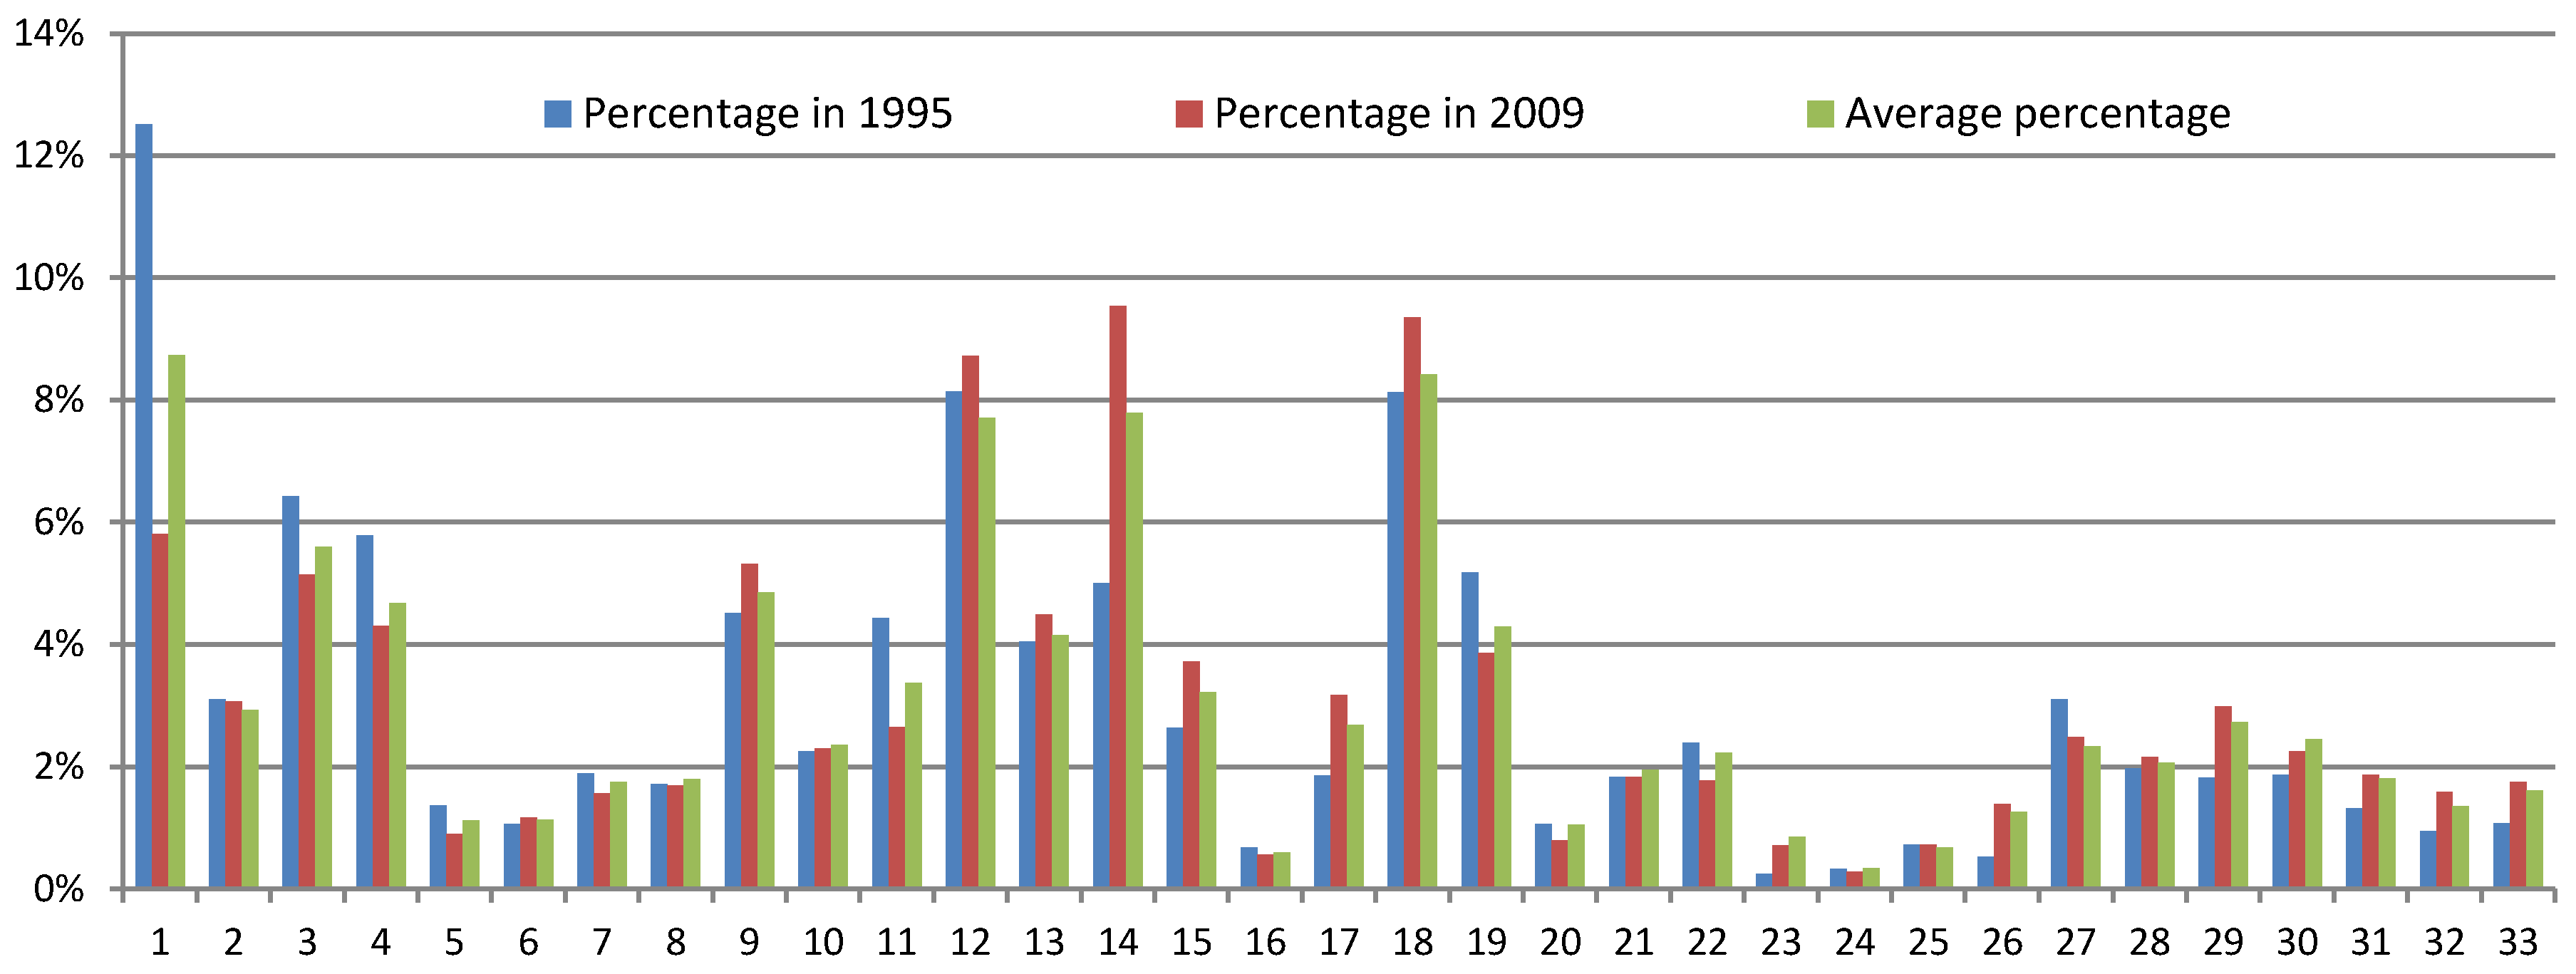
3.3. Economic Structure (ES)
3.4. The Carbon Intensity (CI) and Population (P) Factors
4. Conclusions and Policy Implications
Supplementary Files
Supplementary File 1Acknowledgments
Author Contributions
Conflicts of Interest
Appendix A

| EI | 1996 | 1997 | 1998 | 1999 | 2000 | 2001 | 2002 | 2003 | 2004 | 2005 | 2006 | 2007 | 2008 | 2009 |
|---|---|---|---|---|---|---|---|---|---|---|---|---|---|---|
| Agriculture, Hunting, Forestry and Fishing | −12,227.37 | 150.86 | −337.19 | 3170.20 | −17,252.72 | −471.12 | 640.04 | 3839.87 | −5558.18 | 6887.61 | −2752.32 | −29,615.31 | −44,826.03 | −3752.80 |
| Mining and Quarrying | −7758.92 | −8070.92 | 11,331.24 | −10,548.71 | −13,568.96 | 7442.76 | 1979.59 | −5241.79 | −26,518.50 | −19,294.30 | −21,542.21 | −15,742.84 | −8208.88 | −13,889.08 |
| Food, Beverages and Tobacco | −22,152.86 | −12,108.94 | 8836.78 | −9528.61 | −8058.58 | −939.56 | −1789.08 | −9083.76 | 1487.04 | −5083.52 | −10,162.29 | −10,853.63 | −4746.06 | −3180.46 |
| Textiles and Textile Products | −14,429.49 | −1976.59 | 309.25 | −7908.64 | −3758.92 | −1078.24 | −78.23 | −729.32 | 6656.14 | −4551.74 | −6001.04 | −5766.96 | −8473.64 | −4082.88 |
| Leather, Leather and Footwear | −1301.21 | −89.22 | 68.53 | −355.13 | −301.42 | −199.42 | −71.26 | 108.05 | 640.32 | −490.16 | −495.69 | −436.54 | −656.83 | −242.91 |
| Wood and Products of Wood and Cork | −2778.19 | −654.21 | −55.36 | −893.19 | −959.58 | −270.64 | −307.71 | 200.26 | 739.95 | −717.13 | −1973.48 | −1970.95 | −728.30 | −291.43 |
| Pulp, Paper, Paper, Printing and Publishing | −11,465.07 | −4454.56 | 1414.13 | −5047.93 | 493.89 | −1102.23 | 955.37 | −2278.86 | 306.27 | −6472.35 | −1352.07 | −8199.97 | −1906.03 | −1547.74 |
| Coke, Refined Petroleum and Nuclear Fuel | −1190.60 | −1083.90 | 422.26 | −3260.90 | −10,207.73 | −5617.75 | −2926.13 | 5087.75 | −14,289.96 | −5674.05 | 5058.63 | −15,729.60 | −22,887.97 | 6407.24 |
| Chemicals and Chemical Products | −22,649.51 | −24,515.39 | 9974.47 | −35,655.93 | −12,234.88 | −11,067.21 | −1658.79 | −16,588.33 | −26,907.42 | −25,001.44 | −22,717.68 | −50,213.97 | −41,340.00 | −11,768.84 |
| Rubber and Plastics | −5177.78 | −6177.24 | −108.74 | −1567.83 | −2992.66 | −755.44 | −1154.83 | −860.18 | 1637.70 | −2312.89 | −4380.08 | −3939.83 | −2147.24 | −1018.65 |
| Other Non−Metallic Mineral | −64,578.43 | −49,566.98 | 34,918.56 | −43,553.02 | −25,238.16 | −19,071.70 | 6671.67 | 21,061.77 | 95,681.70 | −71,947.65 | −63,735.92 | −115,586.5 | 11,575.12 | −8954.89 |
| Basic Metals and Fabricated Metal | −30,674.76 | −18,080.85 | −13,647.95 | −11,860.40 | −13,684.92 | −12,349.50 | 19,203.62 | −15,297.53 | −43,478.61 | 10,815.47 | −55,517.92 | −98,506.69 | −96,501.89 | 757.31 |
| Machinery, n.e.c. | −3228.95 | −7319.47 | −2476.18 | −6749.26 | −5623.96 | −1514.56 | −474.73 | −2507.32 | −410.57 | −2909.67 | −5134.16 | −5462.43 | −2497.56 | −443.99 |
| Electrical and Optical Equipment | −1513.87 | −3093.86 | −1668.63 | −2385.86 | −2244.56 | −785.81 | −291.23 | −1255.38 | −172.72 | −737.35 | −2795.91 | −2197.47 | −1373.28 | −437.97 |
| Transport Equipment | −1749.37 | −1826.03 | −1063.33 | −2737.10 | −1127.90 | −1004.63 | −2397.70 | −3456.76 | 2365.86 | −3874.16 | −1670.54 | −5337.91 | −1447.40 | 795.69 |
| Manufacturing, n.e.c.; Recycling | −2867.51 | −2815.70 | 350.58 | −1174.64 | −1391.89 | −571.80 | −577.24 | −620.56 | 676.94 | −945.51 | −1540.53 | −1121.17 | −389.16 | −344.91 |
| Electricity, Gas and Water Supply | −13,831.05 | −228,299.80 | −82,822.08 | −106,059.59 | 19,422.17 | −67,445.38 | 2285.30 | −129,944.87 | −57,4677.05 | −329,972.16 | 349,051.65 | −663,625.23 | −610,560.93 | 42,741.19 |
| Construction | −393.83 | 74.81 | −109.20 | −3048.57 | −654.49 | −1616.51 | 64.69 | −2039.74 | 13,867.91 | −5794.37 | −5852.95 | −10,061.86 | −20,397.28 | −492.77 |
| Wholesale Trade and Commission Trade, Except of Motor Vehicles and Motorcycles | −215.86 | −2620.59 | −1081.90 | 2509.64 | −2190.51 | −226.79 | −184.55 | −3341.40 | −1349.17 | −1320.81 | −677.91 | −1702.72 | −351.77 | −4.08 |
| Retail Trade, Except of Motor Vehicles and Motorcycles; Repair of Household Goods | 32.08 | −601.52 | −375.12 | 458.53 | −491.35 | −201.03 | −10.77 | −647.79 | −156.27 | −3223.08 | −691.40 | 1330.12 | −827.84 | −237.68 |
| Hotels and Restaurants | −645.49 | −1667.97 | −14.48 | 378.96 | −10.62 | −128.37 | −73.08 | −370.49 | 2034.61 | −424.99 | 424.14 | −1530.09 | −442.24 | 1735.95 |
| Inland Transport | −7504.25 | 4889.38 | 6802.55 | −1873.57 | −4208.90 | −4223.41 | −1026.97 | 4879.47 | −5802.14 | −902.75 | −8122.03 | −13,742.15 | −11,364.10 | −4864.65 |
| Water Transport | −3375.69 | 1300.50 | −9849.21 | −4514.47 | −2667.25 | −6373.36 | −4888.02 | 6321.10 | −6037.13 | −359.23 | −2003.87 | −1197.03 | −17,348.72 | 86.65 |
| Air Transport | −3865.42 | 1802.76 | 6619.10 | −4598.35 | −6345.11 | 4719.53 | 1296.59 | 6410.04 | 112.61 | −8609.47 | −6377.31 | −1134.63 | −11,216.48 | 29,567.10 |
| Other Supporting and Auxiliary Transport Activities; Activities of Travel Agencies | 305.48 | −208.13 | −301.68 | 659.18 | 1180.18 | 276.08 | 558.69 | 3064.34 | 1147.84 | −3741.23 | −885.37 | −5315.35 | −4950.65 | −1070.66 |
| Post and Telecommunications | −2.74 | −114.36 | −192.12 | −73.43 | 176.28 | −434.10 | −300.12 | −270.90 | −144.75 | −429.40 | −287.36 | −809.21 | −491.80 | −113.16 |
| Financial Intermediation | −625.27 | −990.83 | 177.19 | 432.57 | −110.97 | 3.80 | 6.90 | −144.29 | −35.15 | −314.59 | −225.44 | −666.46 | −436.78 | −84.57 |
| Real Estate Activities | −1713.62 | −3605.97 | −445.79 | −50.17 | −518.68 | −224.11 | −135.47 | −120.73 | −313.65 | −1071.51 | −1006.68 | −1488.43 | −430.01 | −192.89 |
| Renting of M&Eq and Other Business Activities | −746.48 | −3157.79 | 396.01 | 1142.95 | −1385.07 | −227.71 | −195.92 | −1321.58 | 954.95 | −1774.87 | −1126.54 | −2883.47 | 165.32 | −293.99 |
| Public Admin and Defence; Compulsory Social Security | −893.23 | −3086.03 | −1677.17 | 129.90 | −1708.33 | −807.86 | −682.41 | 146.76 | 1429.23 | −1013.61 | −232.90 | −2235.29 | 459.72 | −174.70 |
| Education | −1199.37 | −6958.85 | −971.18 | −1100.80 | −1819.97 | −1317.18 | −910.96 | −1154.66 | −1470.95 | −1539.46 | −915.47 | −2559.12 | 237.81 | 82.13 |
| Health and Social Work | −469.88 | −1877.46 | −313.12 | −398.98 | −700.57 | −358.59 | −416.73 | 52.03 | 229.38 | 65.13 | 487.71 | −1075.43 | 3203.39 | 472.48 |
| Other Community, Social and Personal Services | −506.41 | −3987.32 | −4615.53 | −1499.77 | −3899.82 | −2502.29 | −1793.80 | −891.07 | 475.80 | −2139.44 | −1380.04 | −5955.99 | 79.70 | −857.98 |
| Total change of CO2 emissions from EI | −241,394.93 | −390,792.20 | −40,505.32 | −257,562.93 | −124,085.93 | −130,444.14 | 11,316.72 | −146,995.85 | −576,877.99 | −494,874.66 | 123,465.01 | −1085,333.66 | −901,227.81 | 24,302.04 |
| ES | 1996 | 1997 | 1998 | 1999 | 2000 | 2001 | 2002 | 2003 | 2004 | 2005 | 2006 | 2007 | 2008 | 2009 |
|---|---|---|---|---|---|---|---|---|---|---|---|---|---|---|
| Agriculture, Hunting, Forestry and Fishing | −301.77 | −6485.30 | −3665.93 | −6649.37 | −9004.14 | −3732.51 | −4002.46 | −11,502.71 | 2368.68 | −18,103.87 | −17,430.68 | −7450.74 | −614.72 | −2851.58 |
| Mining and Quarrying | −5426.43 | −114.70 | −9618.47 | −746.82 | 8805.15 | −10,110.05 | −6900.93 | 4568.46 | 29,226.54 | 3762.19 | −1207.14 | −6177.12 | −690.46 | −6104.85 |
| Food, Beverages and Tobacco | 5042.89 | 130.51 | −4934.50 | −4103.27 | −4039.45 | −2161.97 | −2073.06 | 684.93 | −3183.31 | 1793.40 | 2472.33 | 605.52 | −253.45 | −2222.47 |
| Textiles and Textile Products | −3282.18 | −4696.14 | −348.20 | −245.53 | 170.65 | 76.33 | −769.22 | −334.36 | −3751.98 | 1224.54 | 2220.79 | −1528.28 | −192.47 | −1587.45 |
| Leather, Leather and Footwear | 252.39 | −199.81 | −133.31 | −223.92 | −117.01 | 25.39 | −79.51 | −69.87 | −609.40 | −25.76 | 138.76 | −165.75 | −13.87 | −113.24 |
| Wood and Products of Wood and Cork | 463.88 | 213.07 | −269.30 | 10.34 | 62.45 | 216.60 | −209.17 | −167.36 | −519.30 | 245.96 | 1035.37 | 215.31 | −42.47 | −374.09 |
| Pulp, Paper, Paper, Printing and Publishing | 2131.10 | −767.70 | −627.61 | −1197.69 | −1436.97 | −393.84 | −1287.23 | −37.84 | 2040.33 | 2045.35 | −4244.52 | −788.65 | −175.02 | −1617.92 |
| Coke, Refined Petroleum and Nuclear Fuel | −4976.17 | 853.28 | −5764.51 | 4171.87 | 10,680.14 | 2950.28 | 3464.15 | −7046.80 | 13,563.50 | −1817.28 | −19,193.24 | 893.66 | −352.60 | −2987.54 |
| Chemicals and Chemical Products | 11,364.18 | −6438.75 | −13,380.01 | 5761.45 | 3796.63 | −4850.13 | 824.67 | 16,358.78 | 1299.35 | 7930.59 | 4179.65 | 12,775.61 | −1023.90 | −8582.97 |
| Rubber and Plastics | 2690.82 | 808.38 | −147.15 | −1046.17 | −472.59 | −135.81 | −476.83 | 16.59 | −1190.83 | 955.39 | 1287.42 | 78.38 | −86.40 | −750.02 |
| Other Non−Metallic Mineral | 11,575.64 | 1069.86 | −30,897.18 | −24,563.30 | −24,637.99 | −22,607.65 | −29,904.84 | −14,920.80 | −20,035.99 | 10,792.82 | −25,243.46 | −7375.76 | −2531.40 | −22,203.24 |
| Basic Metals and Fabricated Metal | −5986.53 | −702.89 | −19,667.34 | −17,180.56 | −10,155.73 | −8304.74 | −16,396.08 | 41,342.76 | 32,329.76 | 11,892.38 | 52,410.21 | 19,872.02 | −2221.46 | −18,696.18 |
| Machinery, n.e.c. | −2450.72 | −982.41 | −212.63 | 484.81 | 539.19 | 816.54 | 729.31 | 1105.75 | −239.52 | 667.40 | 1419.55 | 499.66 | −133.09 | −1188.06 |
| Electrical and Optical Equipment | −62.91 | 1273.34 | 1358.06 | 851.53 | 1332.01 | 134.90 | 645.82 | 660.54 | 510.16 | 628.37 | 2038.50 | −499.64 | −65.54 | −580.08 |
| Transport Equipment | −72.89 | 17.58 | 407.24 | 142.82 | −267.15 | 993.95 | 1734.75 | 1871.25 | −1396.81 | 796.97 | −664.89 | 2106.97 | −86.90 | −778.72 |
| Manufacturing, n.e.c.; Recycling | −227.64 | −639.26 | −279.73 | 413.29 | 269.98 | 332.60 | 166.86 | −537.98 | −1705.26 | −38.76 | 1266.56 | −196.36 | −20.68 | −179.43 |
| Electricity, Gas and Water Supply | −70,940.99 | 171,796.25 | 75,464.92 | 89,733.53 | −69,840.84 | 30,792.38 | 47,045.04 | 179,612.80 | 604,711.29 | 211,714.50 | −546,102.86 | 196,837.26 | −12,042.30 | −100,214.69 |
| Construction | 117.55 | −778.62 | 1081.88 | 393.23 | 29.50 | 249.86 | 730.79 | −294.78 | −1360.97 | −333.40 | −814.75 | −1025.22 | 2228.71 | 7157.06 |
| Wholesale Trade and Commission Trade, Except of Motor Vehicles and Motorcycles | −472.77 | −123.02 | 191.48 | 119.22 | −497.86 | −8.74 | −213.28 | −889.36 | −994.56 | −3092.92 | −272.64 | 1682.82 | 370.22 | 262.87 |
| Retail Trade, Except of Motor Vehicles and Motorcycles; Repair of Household Goods | −152.01 | −41.76 | 69.00 | 41.80 | −176.26 | −3.25 | −80.34 | −387.81 | −542.31 | 4816.50 | −352.64 | −5627.57 | 358.85 | 236.92 |
| Hotels and Restaurants | −436.43 | 228.18 | 381.55 | 158.49 | 23.03 | 115.04 | 247.41 | −51.39 | −99.85 | −361.35 | −570.93 | −884.73 | 126.27 | 91.89 |
| Inland Transport | −917.78 | −1133.17 | 2215.40 | 1928.60 | 3596.51 | −269.98 | −1389.75 | −7135.58 | −1539.80 | −5413.46 | −3977.55 | −3263.26 | −5196.29 | −2654.79 |
| Water Transport | 1385.91 | 1374.50 | 15,011.62 | 12,445.21 | 13,637.45 | 10,494.14 | 8550.75 | −11,827.75 | −6156.64 | −6560.62 | −7230.07 | −15,731.01 | −5143.80 | −2624.90 |
| Air Transport | −14.07 | −67.68 | 1274.74 | 1288.28 | 1715.06 | 429.09 | 51.07 | −2504.95 | −172.29 | −7697.31 | 628.44 | −572.30 | −2537.27 | −1626.77 |
| Other Supporting and Auxiliary Transport Activities; Activities of Travel Agencies | 185.04 | 175.49 | −206.92 | −360.50 | −449.71 | −1122.62 | −1523.64 | 1300.32 | 2698.61 | 4641.53 | −1399.29 | 3328.89 | −1621.89 | −819.82 |
| Post and Telecommunications | 164.23 | 283.45 | 308.03 | 322.74 | 388.74 | 513.70 | 435.51 | 26.06 | 34.87 | −154.87 | −305.10 | −415.71 | 36.12 | 176.77 |
| Financial Intermediation | −194.97 | −58.13 | −104.91 | −89.59 | −107.44 | −99.80 | −97.74 | −207.14 | −278.87 | −181.25 | 175.00 | 473.57 | 52.81 | 333.57 |
| Real Estate Activities | −492.36 | 23.44 | 470.03 | 73.16 | 97.68 | 154.95 | 179.39 | −208.98 | −323.87 | −195.97 | −114.15 | 118.40 | −359.21 | 630.02 |
| Renting of M&Eq and Other Business Activities | 613.26 | 1247.91 | 656.87 | 559.78 | 354.67 | 522.65 | 264.92 | −36.31 | −83.52 | 116.78 | −376.44 | 63.67 | 139.81 | 770.79 |
| Public Admin and Defence; Compulsory Social Security | 386.53 | 1230.56 | 802.67 | 603.28 | 378.44 | 514.41 | 272.12 | −427.82 | −564.40 | −430.22 | −959.53 | −1668.19 | 135.85 | 768.45 |
| Education | 1182.95 | 2356.25 | 993.67 | 666.59 | 309.22 | 499.36 | 148.97 | −325.90 | −369.69 | 40.01 | −341.20 | −130.85 | 98.16 | 569.73 |
| Health and Social Work | 432.71 | 812.88 | 217.25 | 88.89 | −34.81 | 8.24 | −108.80 | 230.84 | 260.37 | 378.22 | 188.14 | 106.34 | 102.37 | 657.39 |
| Other Community, Social and Personal Services | 590.04 | 2275.59 | 2104.37 | 1645.71 | 1190.17 | 1477.51 | 1016.06 | −610.20 | −737.94 | −303.45 | −1135.62 | 609.93 | 213.00 | 1161.24 |
| Fuel Type | 1995 | 1996 | 1997 | 1998 | 1999 | 2000 | 2001 | 2002 | 2003 | 2004 | 2005 | 2006 | 2007 | 2008 | 2009 |
|---|---|---|---|---|---|---|---|---|---|---|---|---|---|---|---|
| Solid fuels | 279,204.6 | 285,996.4 | 282,023.1 | 287,344.4 | 271,638.5 | 267,573.3 | 272,000.3 | 297,963.4 | 353,855.0 | 421,589.2 | 477,183.6 | 528,646.7 | 575,569.2 | 615,027.3 | 651,588.6 |
| coal | 263,478.4 | 269,873.5 | 266,347.5 | 274,164.8 | 258,838.0 | 254,746.6 | 257,605.2 | 281,285.5 | 335,645.2 | 400,806.8 | 451,543.5 | 502,046.6 | 544,976.0 | 589,221.8 | 621,389.9 |
| coke | 15,726.2 | 16,122.9 | 15,675.6 | 13,179.6 | 12,800.6 | 12,826.7 | 14,395.1 | 16,677.9 | 18,209.7 | 20,782.4 | 25,640.1 | 26,600.2 | 30,593.2 | 25,805.5 | 30,198.7 |
| Total petroleum products | 117,375.3 | 125,083.1 | 136,981.6 | 141,323.5 | 150,373.7 | 161,868.4 | 165,706.4 | 177,021.8 | 195,546.5 | 225,656.2 | 232,064.0 | 246,808.1 | 257,893.7 | 266,576.1 | 287,164.0 |
| crude oil | 61,669.1 | 65,754.1 | 72,001.7 | 72,097.1 | 78,637.9 | 88,128.2 | 88,612.3 | 93,660.3 | 103,693.7 | 119,846.5 | 125,426.3 | 134,286.5 | 141,772.6 | 147,915.2 | 158,981.4 |
| diesel | 1963.7 | 1991.7 | 2176.0 | 3460.1 | 4213.4 | 8614.0 | 8952.1 | 9543.9 | 10,559.0 | 13,281.3 | 15,606.1 | 17,621.3 | 19,266.1 | 20,686.8 | 21,439.3 |
| gasoline | 5949.9 | 6643.5 | 6800.9 | 6321.3 | 6012.8 | 4460.8 | 4418.8 | 4377.4 | 5066.3 | 5095.1 | 4498.8 | 4496.2 | 4294.4 | 4966.0 | 4804.4 |
| fuel | 33,799.6 | 34,472.0 | 35,746.6 | 38,732.9 | 41,759.2 | 38,701.3 | 41,573.4 | 44,532.7 | 49,005.7 | 55,053.5 | 52,927.0 | 54,403.2 | 54,439.2 | 55,164.3 | 57,717.8 |
| other petroleum | 13,993.0 | 16,221.8 | 20,256.4 | 20,712.1 | 19,750.5 | 21,964.1 | 22,149.8 | 24,907.5 | 27,221.8 | 32,379.9 | 33,605.8 | 36,001.0 | 38,121.4 | 37,843.9 | 44,221.1 |
| Gas | 10,208.7 | 10,663.8 | 11,075.8 | 11,122.5 | 11,401.0 | 12,490.2 | 13,500.3 | 14,235.9 | 16,402.4 | 19,365.9 | 24,037.9 | 27,509.8 | 31,958.1 | 35,403.5 | 37,791.1 |
| natural gas | 5437.2 | 5474.4 | 6008.7 | 6052.3 | 6464.7 | 7217.5 | 7915.3 | 8383.9 | 9826.7 | 11,269.8 | 13,087.7 | 15,422.9 | 19,143.3 | 21,820.9 | 24,264.3 |
| other gas | 4771.5 | 5189.4 | 5067.1 | 5070.2 | 4936.3 | 5272.7 | 5585.0 | 5852.0 | 6575.6 | 8096.1 | 10,950.2 | 12,086.9 | 12,814.8 | 13,582.6 | 13,526.8 |
| Electricity | 29,791.8 | 31,912.1 | 33,252.1 | 34,127.3 | 35,889.9 | 39,135.7 | 42,374.2 | 47,422.3 | 55,932.2 | 65,154.4 | 73,537.5 | 84,636.1 | 97,484.9 | 101,341.8 | 108,602.1 |
| Heat production | 9298.1 | 9644.0 | 9943.7 | 10,726.4 | 11,266.0 | 12,111.4 | 12,800.9 | 13,554.1 | 14,157.6 | 14,889.1 | 17,447.9 | 18,684.5 | 19,770.0 | 19,178.0 | 19,653.0 |
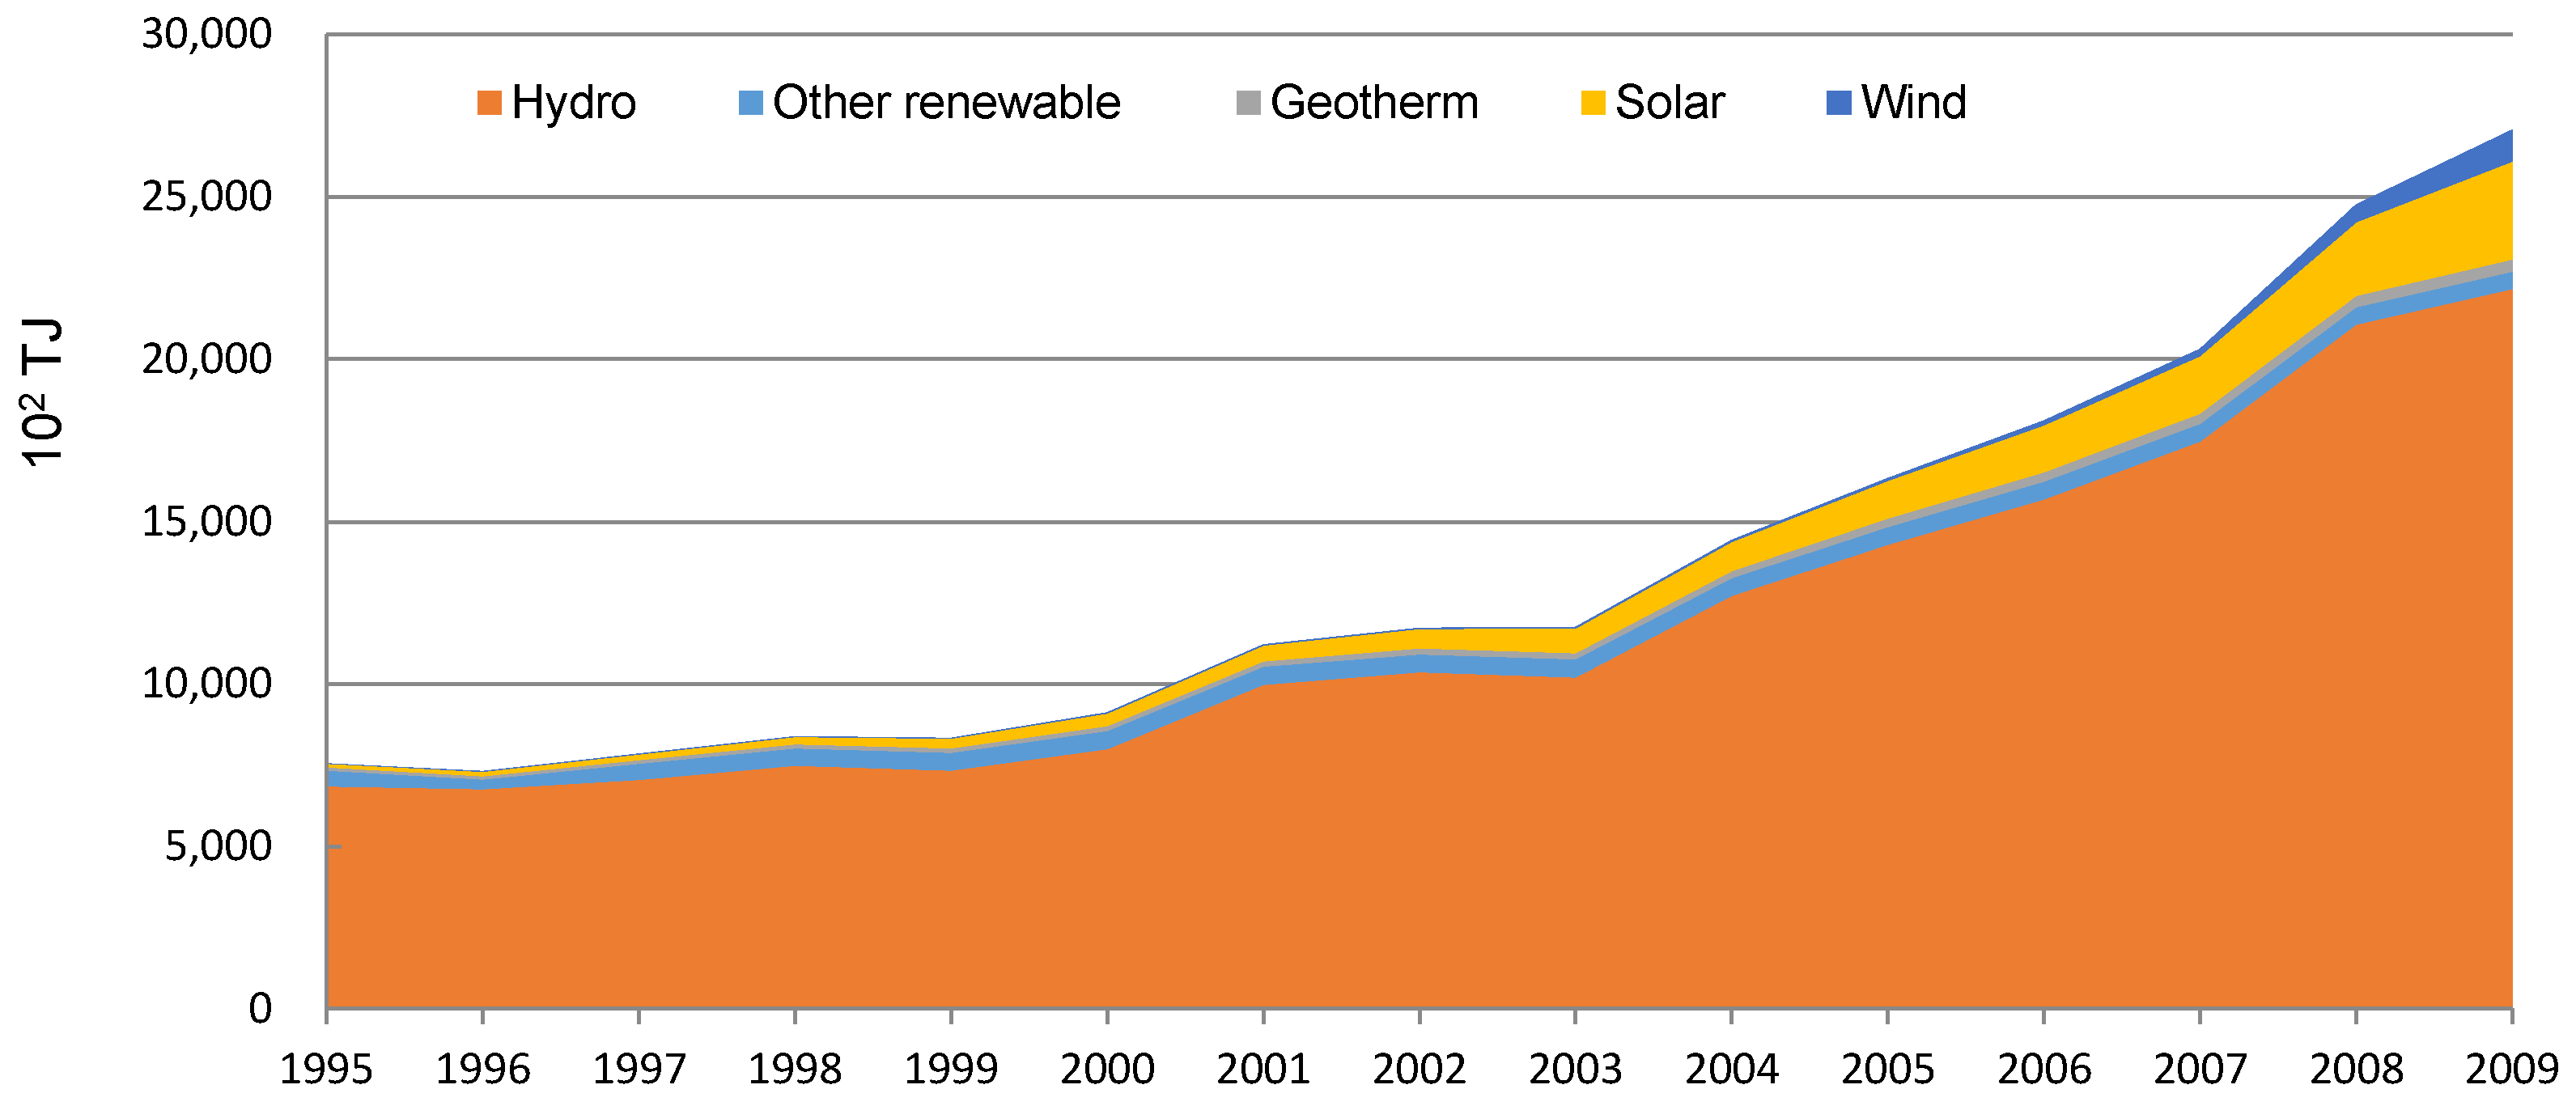
| Renewable energies | 7553.3 | 7315.4 | 7852.8 | 8395.4 | 8345.7 | 9126.4 | 11,219.4 | 11,735.4 | 11,748.9 | 14,436.5 | 16,334.5 | 18,112.0 | 20,313.1 | 24,761.3 | 27,070.3 |
| other renewable | 485.9 | 298.1 | 492.8 | 539.2 | 548.4 | 552.2 | 556.1 | 554.3 | 552.5 | 550.7 | 548.8 | 546.6 | 544.7 | 537.2 | 536.2 |
| hydro | 6862.0 | 6768.0 | 7056.7 | 7489.3 | 7338.4 | 8008.3 | 9989.3 | 10,368.9 | 10,214.4 | 12,729.9 | 14,295.2 | 15,691.1 | 17,472.6 | 21,070.5 | 22,167.0 |
| geothermal | 90.5 | 103.1 | 115.7 | 128.3 | 140.9 | 153.5 | 166.8 | 180.2 | 193.5 | 206.8 | 261.5 | 292.0 | 314.9 | 351.5 | 381.2 |
| solar | 112.6 | 142.6 | 180.1 | 225.2 | 300.2 | 390.2 | 480.2 | 600.6 | 751.2 | 901.2 | 1156.0 | 1443.1 | 1775.3 | 2269.2 | 3017.3 |
| wind | 2.3 | 3.5 | 7.4 | 13.3 | 17.8 | 22.1 | 27.0 | 31.4 | 37.4 | 48.0 | 73.0 | 139.3 | 205.6 | 532.9 | 968.6 |
| nuclear | 1400.2 | 1564.5 | 1573.2 | 1538.5 | 1631.1 | 1826.2 | 1906.4 | 2741.6 | 4729.1 | 5506.7 | 5792.5 | 5983.9 | 6779.0 | 7462.5 | 7652.4 |
| Total consumption | 454,832.0 | 472,179.2 | 482,702.4 | 494,578.1 | 490,545.8 | 504,131.6 | 519,507.9 | 564,674.5 | 652,371.6 | 766,598.0 | 846,397.9 | 930,381.2 | 1,009,768.0 | 1,069,750.5 | 1,139,521.3 |

References
- Lin, B.Q.; Moubarak, M.; Ouyang, X.L. Carbon dioxide emissions and growth of the manufacturing sector: Evidence for China. Energy 2014, 76, 830–837. [Google Scholar] [CrossRef]
- Tunç, G.İ.; Türüt-Aşık, S.; Akbostancı, E. A decomposition analysis of CO2 emissions from energy use: Turkish case. Energy Policy 2009, 37, 4689–4699. [Google Scholar] [CrossRef]
- Ozturk, I.; Acaravci, A. CO2 emissions, energy consumption and economic growth in Turkey. Renew. Sust. Energ. Rev. 2010, 14, 3220–3225. [Google Scholar] [CrossRef]
- Zhang, X.P.; Cheng, X.M. Energy consumption, carbon emissions, and economic growth in China. Ecol. Econ. 2009, 68, 2706–2712. [Google Scholar] [CrossRef]
- Kang, J.D.; Zhao, T.; Liu, N.; Zhang, X.; Xu, X.S.; Lin, T. A multi-sectoral decomposition analysis of city-level greenhouse gas emissions: Case study of Tianjin, China. Energy 2014, 68, 562–571. [Google Scholar] [CrossRef]
- Govindaraju, V.G.R.C.; Tang, C.F. The dynamic links between CO2 emissions, economic growth and coal consumption in China and India. Appl. Energy 2013, 102, 310–318. [Google Scholar] [CrossRef]
- Yu, S.W.; Zhang, J.J.; Zheng, S.H.; Sun, H. Provincial carbon intensity abatement potential estimation in China: A PSO–GA-optimized multi-factor environmental learning curve method. Energy Policy 2015, 77, 46–55. [Google Scholar] [CrossRef]
- Shahbaz, M.; Tiwari, A.K.; Nasir, M. The effects of financial development, economic growth, coal consumption and trade openness on CO2 emissions in South Africa. Energy Policy 2013, 61, 1452–1459. [Google Scholar] [CrossRef] [Green Version]
- Xu, B.; Lin, B.Q. How industrialization and urbanization process impacts on CO2 emissions in China: Evidence from nonparametric additive regression models. Energ. Econ. 2015, 48, 188–202. [Google Scholar] [CrossRef]
- Al-mulali, U.; Fereidouni, H.G.; Lee, J.Y.M.; Che, N.B.C.S. Exploring the relationship between urbanization, energy consumption, and CO2 emission in MENA countries. Renew. Sust. Energ. Rev. 2013, 23, 107–112. [Google Scholar] [CrossRef]
- Testa, R.; Foderà, M.; Trapani, A.M.D.; Tudisca, S.; Sgroi, F. Giant reed as energy crop for Southern Italy: An economic feasibility study. Renew. Sust. Energ. Rev. 2016, 58, 558–564. [Google Scholar] [CrossRef]
- Poumanyvong, P.; Kaneko, S. Does urbanization lead to less energy use and lower CO2 emissions? A cross-country analysis. Ecol. Econ. 2010, 70, 434–444. [Google Scholar] [CrossRef]
- Zhang, C.G.; Jiang, N. Panel estimation for transport sector CO2 emissions and its affecting factors: A regional analysis in China. Energy Policy 2013, 63, 918–926. [Google Scholar] [CrossRef]
- Aydin, G. The Development and Validation of Regression Models to Predict Energy-related CO2 Emissions in Turkey. Energy Source Part B 2015, 10, 176–182. [Google Scholar] [CrossRef]
- Grossman, G.M.; Krueger, A.B. Environmental Impacts of a North American Free Trade Agreement (November 1991). NBER Working Paper No. w3914. Available online: http://ssrn.com/abstract=232073 (accessed on 28 January 2016).
- Zhang, M.; Mu, H.L.; Ning, Y.D.; Song, Y.C. Decomposition of energy-related CO2 emission over 1991–2006 in China. Ecol. Econ. 2009, 68, 2122–2128. [Google Scholar] [CrossRef]
- Su, Y.; Chen, X.; Li, Y.; Liao, J.; Ye, Y.; Zhang, H.; Huang, N.; Kuang, Y. China’s 19-year city-level carbon emissions of energy consumptions, driving forces and regionalized mitigation guidelines. Renew. Sust. Energ. Rev. 2014, 35, 231–243. [Google Scholar]
- Ang, B.W.; Zhang, F.Q. A survey of index decomposition analysis in energy and environmental studies. Energy 2000, 25, 1149–1176. [Google Scholar]
- Hasanbeigi, A.; Price, L.; Fino-Chen, C.; Lu, H.; Ke, J. Retrospective and prospective decomposition analysis of Chinese manufacturing energy use and policy implications. Energy Policy 2013, 63, 562–574. [Google Scholar]
- Wang, S.; Fang, C.; Guan, X.; Pang, B.; Ma, H. Urbanisation, energy consumption, and carbon dioxide emissions in China: A panel data analysis of China’s provinces. Appl. Energy 2014, 136, 738–749. [Google Scholar]
- Xu, S.C.; He, Z.X.; Long, R.Y. Factors that influence carbon emissions due to energy consumption in China: Decomposition analysis using LMDI. Appl. Energy 2014, 127, 182–193. [Google Scholar]
- Lin, B.Q.; Mohamed, M. Renewable energy consumption-Economic growth nexus for China. Renew. Sust. Energ. Rev. 2014, 40, 111–117. [Google Scholar]
- Xie, S.C. The driving forces of China’s energy use from 1992 to 2010: An empirical study of input–output and structural decomposition analysis. Energy Policy 2014, 73, 401–415. [Google Scholar]
- Wang, C.; Chen, J.; Zou, J. Decomposition of energy-related CO2 emission in China: 1957–2000. Energy 2005, 30, 73–83. [Google Scholar]
- Zhang, M.; Li, H.; Zhou, M.; Mu, H. Decomposition analysis of energy consumption in Chinese transportation sector. Appl. Energy 2011, 88, 2279–2285. [Google Scholar]
- Freitas, L.C.D.; Kaneko, S. Decomposition of CO2 emissions change from energy consumption in Brazil: Challenges and policy implications. Energy Policy 2011, 39, 1495–1504. [Google Scholar]
- Xu, J.H.; Fleiter, T.; Eichhammer, W.; Fan, Y. Energy consumption and CO2 emissions in China’s cement industry: A perspective from LMDI decomposition analysis. Energy Policy 2012, 50, 821–832. [Google Scholar]
- Komal, R.; Abbas, F.; Komal, R.; Abbas, F. Linking financial development, economic growth and energy consumption in Pakistan. Renew. Sust. Energ. Rev. 2015, 44, 211–220. [Google Scholar]
- Zhang, Y.J.; Da, Y.B. The decomposition of energy-related carbon emission and its decoupling with economic growth in China. Renew. Sust. Energ. Rev. 2015, 41, 1255–1266. [Google Scholar]
- Granger, C.W.J. Some recent development in a concept of causality. J. Econom. 1988, 39, 199–211. [Google Scholar]
- Inglesi-Lotz, R.; Pouris, A. Energy efficiency in South Africa: A decomposition exercise. Energy 2012, 42, 113–120. [Google Scholar]
- Ang, B.W. The LMDI approach to decomposition analysis: A practical guide. Energy Policy 2005, 33, 867–871. [Google Scholar]
- Ang, B.W. Decomposition analysis for policymaking in energy: Which is the preferred method? Energy Policy 2004, 32, 1131–1139. [Google Scholar]
- Paul, S.; Bhattacharya, R.N. CO2 emission from energy use in India: A decomposition analysis. Energy Policy 2004, 32, 585–593. [Google Scholar] [CrossRef]
- Kumbaroğlu, G. A sectoral decomposition analysis of Turkish CO2 emissions over 1990–2007. Energy 2011, 36, 2419–2433. [Google Scholar] [CrossRef]
- Begum, R.A.; Sohag, K.; Abdullah, S.M.S.; Jaafar, M. CO2 emissions, energy consumption, economic and population growth in Malaysia. Renew. Sust. Energ. Rev. 2015, 41, 594–601. [Google Scholar] [CrossRef]
- Oh, I.; Wehrmeyer, W.; Mulugetta, Y. Decomposition analysis and mitigation strategies of CO2 emissions from energy consumption in South Korea. Energy Policy 2010, 38, 364–377. [Google Scholar] [CrossRef]
- Robaina Alves, M.; Moutinho, V. Decomposition analysis and Innovative Accounting Approach for energy-related CO2 emissions intensity over 1996–2009 in Portugal. Energy 2013, 57, 775–787. [Google Scholar]
- Brizga, J.; Feng, K.; Hubacek, K. Drivers of CO2 emissions in the former Soviet Union: A country level IPAT analysis from 1990 to 2010. Energy 2013, 59, 743–753. [Google Scholar] [CrossRef]
- Jiang, Z.; Lin, B.Q. China’s energy demand and its characteristics in the industrialization and urbanization process. Energy Policy 2012, 49, 608–615. [Google Scholar] [CrossRef]
- Moutinho, V.; Moreira, A.C.; Silva, P.M. The driving forces of change in energy-related CO2 emissions in Eastern, Western, Northern and Southern Europe: The LMDI approach to decomposition analysis. Renew. Sust. Energ. Rev. 2015, 50, 1485–1499. [Google Scholar] [CrossRef]
- Hatzigeorgiou, E.; Polatidis, H.; Haralambopoulos, D. Energy CO2 Emissions for 1990–2020: A Decomposition Analysis for EU25 and Greece. Energy Source Part A 2010, 32, 1908–1917. [Google Scholar] [CrossRef]
- Chong, C.H.; Ma, L.; Li, Z.; Ni, W.; Song, S. Logarithmic mean Divisia index (LMDI) decomposition of coal consumption in China based on the energy allocation diagram of coal flows. Energy 2015, 85, 366–378. [Google Scholar] [CrossRef]
- Sheinbaum, C.; Ruíz, B.J.; Ozawa, L. Energy consumption and related CO2 emissions in five Latin American countries: Changes from 1990 to 2006 and perspectives. Energy 2011, 36, 3629–3638. [Google Scholar] [CrossRef]
- Sheinbaum-Pardo, C.; Mora-Pérez, S.; Robles-Morales, G. Decomposition of energy consumption and CO2 emissions in Mexican manufacturing industries: Trends between 1990 and 2008. Energy. Sustain. Dev. 2012, 16, 57–67. [Google Scholar] [CrossRef]
- Andreoni, V.; Galmarini, S. Decoupling economic growth from carbon dioxide emissions: A decomposition analysis of Italian energy consumption. Energy 2012, 44, 682–691. [Google Scholar] [CrossRef]
- González, P.F.; Moreno, B. Analyzing driving forces behind changes in energy vulnerability of Spanish electricity generation through a Divisia index-based method. Energ. Convers. Mang. 2015, 92, 459–468. [Google Scholar] [CrossRef]
- Mahony, T.O.; Zhou, P.; Sweeney, J. The driving forces of change in energy-related CO2 emissions in Ireland: A multi-sectoral decomposition from 1990 to 2007. Energy Policy 2012, 44, 256–267. [Google Scholar] [CrossRef]
- Mahony, T.O.; Zhou, P.; Sweeney, J. Integrated scenarios of energy-related CO2 emissions in Ireland: A multi-sectoral analysis to 2020. Ecol. Econ. 2013, 93, 358–397. [Google Scholar] [CrossRef]
- Yuan, L.B. A Structural Decomposition Analysis of CO2 Emission in China. Adv. Mater. Res. 2011, 361–363, 1756–1760. [Google Scholar] [CrossRef]
- Song, M.; Wang, S.; Yu, H.; Yang, L.; Wu, J. To reduce energy consumption and to maintain rapid economic growth: Analysis of the condition in China based on expended IPAT model. Renew. Sust. Energ. Rev. 2011, 15, 5129–5134. [Google Scholar] [CrossRef]
- Guo, B.; Geng, Y.; Franke, B.; Han, H.; Liu, Y.; Chiu, A. Uncovering China’s transport CO2 emission patterns at the regional level. Energy Policy 2014, 74, 134–146. [Google Scholar] [CrossRef]
- Hazuki, I. The effect of ICT development on economic growth and energy consumption in Japan. Telemat. Inform. 2015, 32, 79–88. [Google Scholar]
- Liu, N.; Ma, Z.; Kang, J. Changes in carbon intensity in China’s industrial sector: Decomposition and attribution analysis. Energy Policy 2015, 87, 28–38. [Google Scholar] [CrossRef]
- Fan, J.L.; Liao, H.; Liang, Q.M.; Tatano, H.; Liu, C.F.; Wei, Y.M. Residential carbon emission evolutions in urban–rural divided China: An end-use and behavior analysis. Appl. Energy 2013, 101, 323–332. [Google Scholar] [CrossRef]
- Ouyang, X.; Lin, B.Q. An analysis of the driving forces of energy-related carbon dioxide emissions in China’s industrial sector. Renew. Sust. Energ. Rev. 2015, 45, 838–849. [Google Scholar] [CrossRef]
- Muhammad, S.; Sahbi, F.; Ilhan, O. Do coal consumption and industrial development increase environmental degradation in China and India? Environ. Sci. Pollut. Res. 2015, 22, 3895–3907. [Google Scholar]
- Dietz, T.; Rosa, E.A. Effects of population and affluence on CO2 emissions. Proc. Natl. Acad. Sci. USA 1997, 94, 175–179. [Google Scholar] [CrossRef] [PubMed]
- Hassan, H.; Katircioğlu, S.T.; Saeidpour, L. Economic growth, CO2 emissions, and energy consumption in the five ASEAN countries. Int. J. Electr. Power Energy Syst. 2015, 64, 785–791. [Google Scholar]
- Liu, Z.; Liang, S.; Geng, Y.; Xue, B.; Xi, F.; Pan, Y.; Zhang, T.; Fujita, T. Features, trajectories and driving forces for energy-related GHG emissions from Chinese mega cites: The case of Beijing, Tianjin, Shanghai and Chongqing. Energy 2012, 37, 245–254. [Google Scholar] [CrossRef]
- Hubacek, K.; Feng, K.; Chen, B. Changing Lifestyles towards a Low Carbon Economy: An IPAT Analysis for China. Energies 2011, 5, 22–31. [Google Scholar] [CrossRef]
- Chen, L.; Yang, Z.; Chen, B. Scenario Analysis and Path Selection of Low-Carbon Transformation in China Based on a Modified IPAT Model. PLoS ONE 2013, 8, e77699–e77699. [Google Scholar] [CrossRef] [PubMed]
- Ang, B.W.; Choi, K.H. Decomposition of Aggregate Energy and Gas Emission Intensities for Industry: A Refined Divisia Index Method. Energy J. 1997, 18, 59–74. [Google Scholar] [CrossRef]
- Timmer, M.; Erumban, A.A.; Gouma, R.; Los, B.; Temurshoev, U.; Vries, G.J.D. The World Input-Output Database (WIOD): Contents, Sources and Methods. Iide Discussion Papers. 2012. Available online: https://ideas.repec.org/p/lnz/wpaper/20120401.html (accessed on 28 January 2016).
- National Bureau of Statistics of China. China Statistical Yearbook; China Statistical Press: Beijing, China, 1997–2011.
- National Bureau of Statistics of China. China Energy Statistical Yearbook; China Statistical Press: Beijing, China, 1997–2011.
- BP Statistical Review of World Energy. Statistical Review-Data workbook. 2015. Available online: http://www.bp.com/en/global/corporate/energy-economics/statistical-review-of-world-energy.html (accessed on 28 January 2016).
- Ministry of Finance of the People’ Republic of China. Interim Measures for the Administration of Special Funds for the Industrialization of Wind Power Equipment. 2008. Available online: http://www.mof.gov.cn/zhengwuxinxi/zhengcefabu/2008zcfb/200808/t20080822_66469.htm (accessed on 28 January 2016). [Google Scholar]
- National Development and Reform Commission. A Notice on Improving the Electricity Price Policy of Wind Power Generation. 2009. Available online: http://www.sdpc.gov.cn/zcfb/zcfbtz/200907/t20090727_292827.html (accessed on 28 January 2016). [Google Scholar]


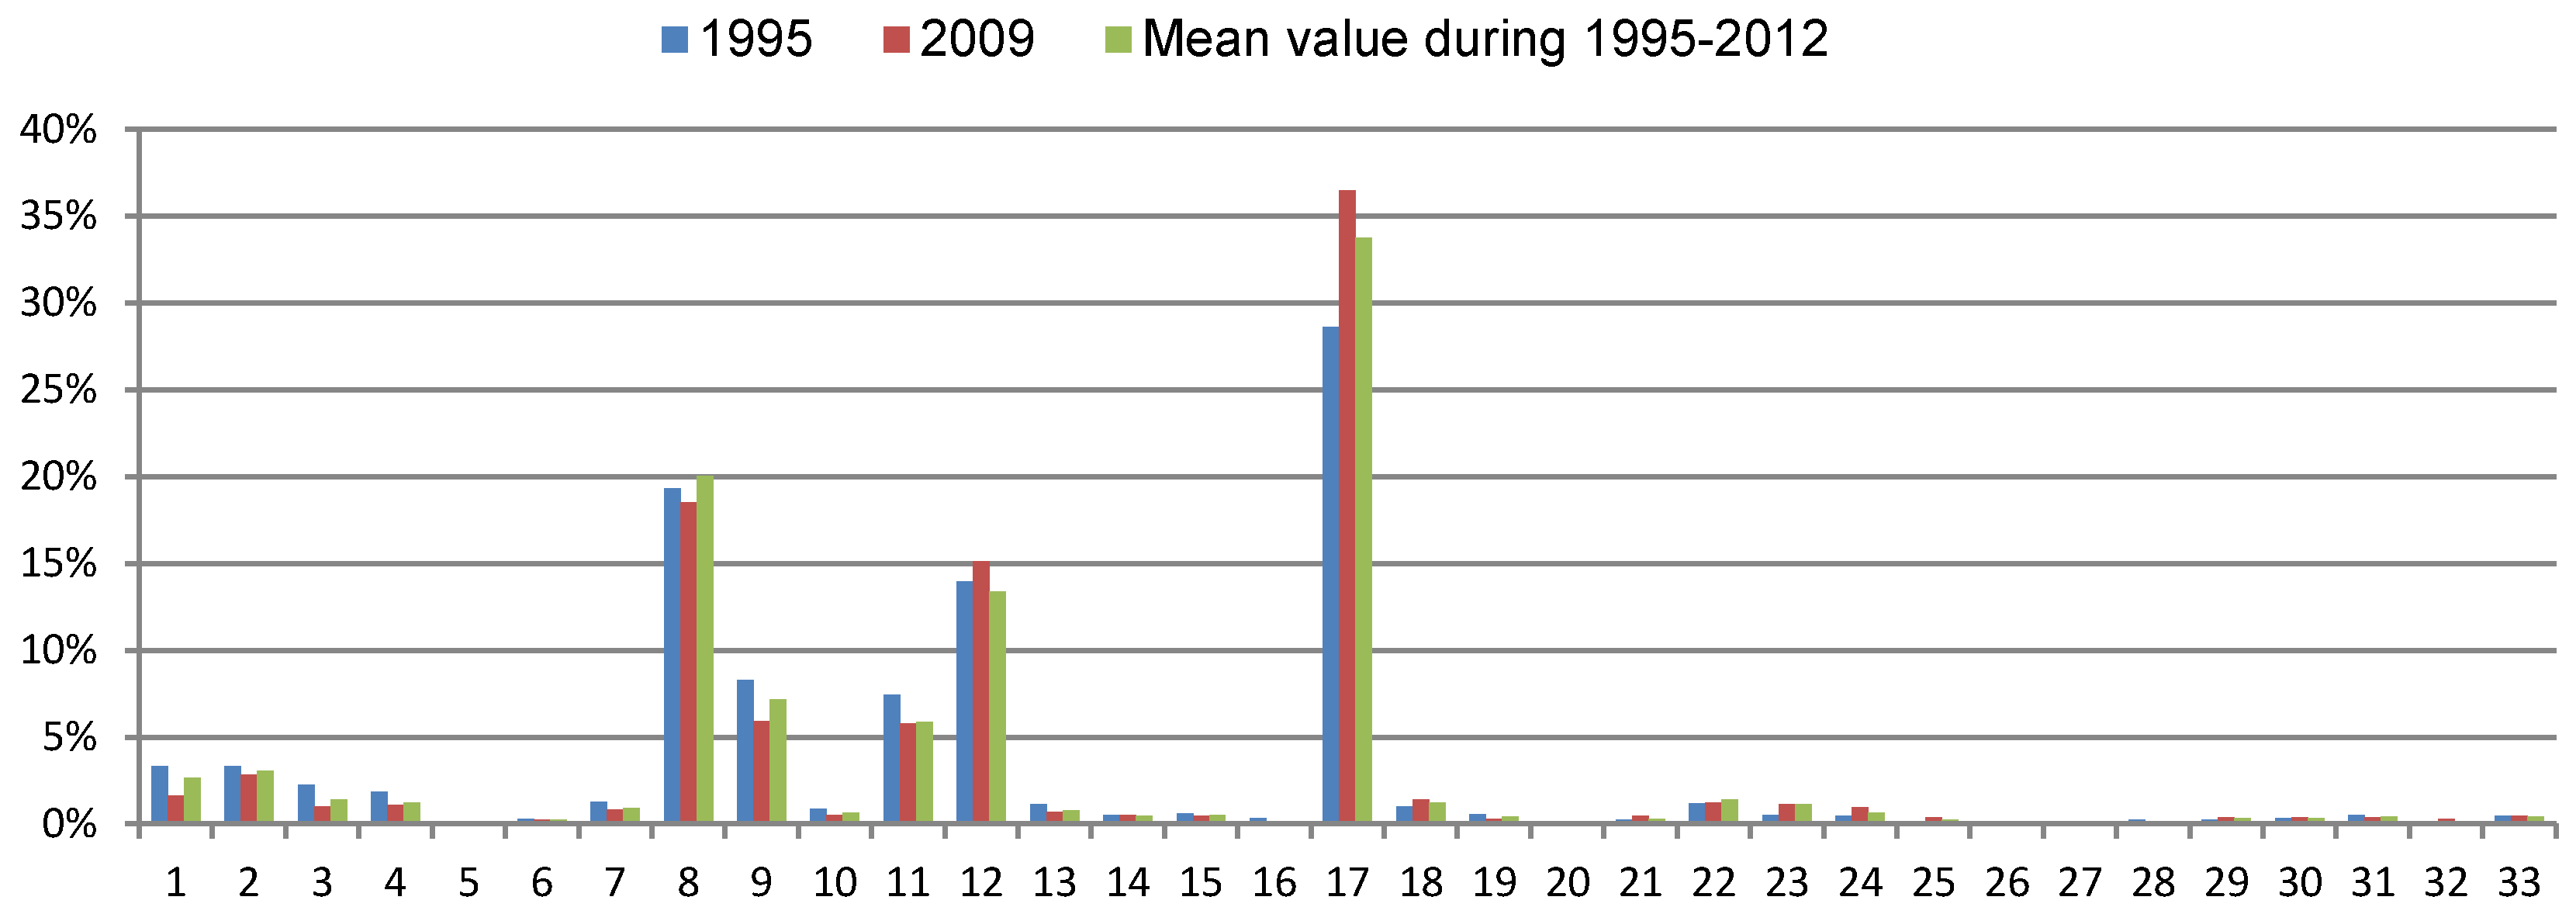
| Code | Production Sector |
|---|---|
| 1 | Agriculture, Hunting, Forestry and Fishing |
| 2 | Mining and Quarrying |
| 3 | Food, Beverages and Tobacco |
| 4 | Textiles and Textile Products |
| 5 | Leather, Leather and Footwear |
| 6 | Wood and Products of Wood and Cork |
| 7 | Pulp, Paper, Paper, Printing and Publishing |
| 8 | Coke, Refined Petroleum and Nuclear Fuel |
| 9 | Chemicals and Chemical Products |
| 10 | Rubber and Plastics |
| 11 | Other Non-Metallic Mineral |
| 12 | Basic Metals and Fabricated Metal |
| 13 | Machinery, nowhere else classified (n.e.c.) |
| 14 | Electrical and Optical Equipment |
| 15 | Transport Equipment |
| 16 | Manufacturing, n.e.c.; Recycling |
| 17 | Electricity, Gas and Water Supply |
| 18 | Construction |
| 19 | Wholesale Trade and Commission Trade, Except of Motor, Vehicles and Motorcycles |
| 20 | Retail Trade, Except of Motor Vehicles and Motorcycles; Repair of Household Goods |
| 21 | Hotels and Restaurants |
| 22 | Inland Transport |
| 23 | Water Transport |
| 24 | Air Transport |
| 25 | Other Supporting and Auxiliary Transport Activities; Activities of Travel Agencies |
| 26 | Post and Telecommunications |
| 27 | Financial Intermediation |
| 28 | Real Estate Activities |
| 29 | Renting of M&Eq and Other Business Activities |
| 30 | Public Admin and Defense; Compulsory Social Security |
| 31 | Education |
| 32 | Health and Social Work |
| 33 | Other Community, Social and Personal Services |
© 2016 by the authors; licensee MDPI, Basel, Switzerland. This article is an open access article distributed under the terms and conditions of the Creative Commons by Attribution (CC-BY) license (http://creativecommons.org/licenses/by/4.0/).
Share and Cite
Dong, J.-f.; Wang, Q.; Deng, C.; Wang, X.-m.; Zhang, X.-l. How to Move China toward a Green-Energy Economy: From a Sector Perspective. Sustainability 2016, 8, 337. https://doi.org/10.3390/su8040337
Dong J-f, Wang Q, Deng C, Wang X-m, Zhang X-l. How to Move China toward a Green-Energy Economy: From a Sector Perspective. Sustainability. 2016; 8(4):337. https://doi.org/10.3390/su8040337
Chicago/Turabian StyleDong, Jie-fang, Qiang Wang, Chun Deng, Xing-min Wang, and Xiao-lei Zhang. 2016. "How to Move China toward a Green-Energy Economy: From a Sector Perspective" Sustainability 8, no. 4: 337. https://doi.org/10.3390/su8040337