Article

Extent of Cropland and Related Soil Erosion Risk in Rwanda

1
State Key Laboratory of Desert and Oasis Ecology, Xinjiang Institute of Ecology and Geography, Chinese Academy of Sciences, Urumqi 830011, China
2
University of Chinese Academy of Sciences, Beijing 100049, China
3
Faculty of Environmental Sciences, University of Lay Adventists of Kigali (UNILAK), P.O. 6392, Kigali, Rwanda
4
School of Resources Environment Science and Engineering, Hubei University of Science and Technology, Xianning 430000, China
5
State Key Laboratory of Water Environment Simulation, School of Environment, Beijing Normal University, Beijing 100875, China
*
Author to whom correspondence should be addressed.
Sustainability 2016, 8(7), 609; https://doi.org/10.3390/su8070609
Submission received: 28 April 2016 / Revised: 10 June 2016 / Accepted: 21 June 2016 / Published: 28 June 2016

Abstract

:
Land conversion to cropland is one of the major causes of severe soil erosion in Africa. This study assesses the current cropland extent and the related soil erosion risk in Rwanda, a country that experienced the most rapid population growth and cropland expansion in Africa over the last decade. The land cover land use (LCLU) map of Rwanda in 2015 was developed using Landsat-8 imagery. Based on the obtained LCLU map and the spatial datasets of precipitation, soil properties and elevation, the soil erosion rate of Rwanda was assessed at 30-m spatial resolution, using the Revised Universal Soil Loss Equation (RUSLE) model. According to the results, the mean soil erosion rate was 250 t·ha−1·a−1 over the entire country, with a total soil loss rate of approximately 595 million tons per year. The mean soil erosion rate over cropland, which occupied 56% of the national land area, was estimated at 421 t·ha−1·a−1 and was responsible for about 95% of the national soil loss. About 24% of the croplands in Rwanda had a soil erosion rate larger than 300 t·ha−1·a−1, indicating their unsuitability for cultivation. With a mean soil erosion rate of 1642 t·ha−1·a−1, these unsuitable croplands were responsible for 90% of the national soil loss. Most of the unsuitable croplands are distributed in the Congo Nile Ridge, Volcanic Range mountain areas in the west and the Buberuka highlands in the north, regions characterized by steep slopes (>30%) and strong rainfall. Soil conservation practices, such as the terracing cultivation method, are paramount to preserve the soil. According to our assessment, terracing alone could reduce the mean cropland soil erosion rate and the national soil loss by 79% and 75%, respectively. After terracing, only a small proportion of 7.6% of the current croplands would still be exposed to extreme soil erosion with a rate >300 t·ha−1·a−1. These irremediable cropland areas should be returned to mountain forest to foster environmental sustainability or further sustainable alternative erosion control techniques may be applied, such as applying Vetiver Eco-engineering Technology due to its economical soil erosion control and stabilization of steep slopes and the construction of erosion control dams to absorb and break down excess runoff from unusually intense storms in various parts of the watersheds.

1. Introduction

Soil erosion is one of the most serious environmental problems the world is facing today [1]. In 2003, the global mean of annual soil erosion by water was estimated at 1150 t/km2 [1]. Soil erosion by water is by far the most important type of soil degradation, affecting about 1100 million ha worldwide (56% of the total area affected by human-induced soil degradation) [1]. Almost 80% of the terrain affected by water erosion has a light to moderate degree of degradation. Among the major continents, Africa ranks second in the severity of soil erosion after Asia [1]; deforestation and inappropriate cultivation practices are among the major causes of soil erosion. In Africa, the deforestation rate increased rapidly from 1100 km2·a−1 in the 1990s to 5400 km2·a−1 in the early 2000s [2]. In most of Sub-Saharan Africa, more than 50% of the population heavily relies on local agriculture for food [3], where poor land management usually leads to extreme soil erosion [4]. Today, soil erosion is the major cause of land degradation in Sub-Saharan Africa with serious impacts on agricultural productivity [5]. Numerous studies have highlighted that land conversion to agricultural land use stands as a catalyst for accelerated soil erosion rates [6,7,8,9,10]; and if these agriculture-related erosion rates remain far beyond the rates of soil production, the global society will eventually be compelled to either adopt agricultural methods that sustain the soil or face increasing competition over a shrinking agricultural land base [6].
With a population density of 470.6 per km2 and an annual population growth rate of 2.7%, Rwanda is one of the most densely-populated countries in Africa (in comparison, the mean population densities of the world and Eastern Africa are 56.5 per km2 and 59.2 per km2, respectively) as of 1 July 2015 [11]. The Rwandan economy is primarily based on rudimentary agriculture where about 83.4% of the population is dependent on subsistence agriculture [12]. The rapid population increase caused a shortage of land resources, leading to an average of a 1.6% annual decrease in forest area from 1960–2000 [13]. To cope with the demographic pressure, the government launched a large-scale national cropland conversion campaign that aimed to expand the irrigated cropland by 100,000 ha by 2020, among which 35,000 ha will be hillside irrigation, and 90% of the cropland is located on slopes of 5%–55% [14]. With a hilly and mountainous relief, a fragile soil [15] and a high average rainfall intensity of 1156 mm·a−1 that concentrates in the wet season, the lands of Rwanda are highly susceptible to soil erosion [16,17]. According to a global assessment, Rwanda was among the 22 countries most seriously affected by soil degradation [18]. Previous studies suggested that severe soil erosion in Rwanda, like in other East African countries, could be associated with unsustainable agricultural land management increased by high population densities [19,20,21]. However, the magnitude and the spatial pattern of the agriculturally-induced soil erosion are still unclear at the national scale. This study aimed to assess the current cropland extent and the related soil erosion risks and to identify the lands that are unsuitable for cultivation in terms of soil conservation in Rwanda. Furthermore, the potential effects of the terracing cultivation method were evaluated as a conservation support practice to control soil erosion from croplands in Rwanda.

2. Materials and Methods

2.1. Study Area

This study encompassed the entire territory of Rwanda (Figure 1), a land-locked country with a surface area of about 26,338 km2, located in the Great Lakes Region of East-central Africa (1°–3° S, 28°–31° E), exactly midway between Cape Town and Cairo in Egypt. The country shares borders with Uganda to the north, Burundi to the south, Tanzania to the east and the Democratic Republic of the Congo (DRC) to the west [22]. With a population of 12.1 million in 2014, it is one of the most densely-populated countries in Africa [23], and future population has been projected to be 15.655 million in 2025 and 22.046 million in 2050 [24]. Rwanda has a steep topography, lying at an altitude ranging between 915 m and 4486 m (Figure 1), with a tropical temperate climate. The average annual temperature ranges between 16 °C and 20 °C [15], and the average rainfall intensity is 1156 mm·a−1.
Rwanda has a strongly heterogeneous landscape, with very different terrain features among the 30 administrative districts (Figure 1). High mountains up to 4.5 km above sea level sit in the west and northwest part of the country, including the Congo Nile Ridge, the Volcanic Range and the Buberuka highlands. Plains are found in the east part of the country, including the eastern savannah, the eastern plateau, the central plateau and the Bugesera-Mayaga. A large wetland reservation in the Akagera National Park is found in the northeast of the country.
Rwandan soils are naturally fragile, a physico-chemical alteration of basic schistose, quartzite, gneissic, granite and volcanic rocks [15]. Agriculture is almost entirely rainfed and practiced mainly on hill slopes. It is impossible to make fallow because of the land resource scarcity [14].

2.2. Datasets and Methodology

2.2.1. Land Cover and Land Use Map of Rwanda

The LCLU map for Rwanda in 2015 was established from the multispectral Landsat-8 images of 30-m resolution (Table 1) downloaded from the U.S. Geological Survey (USGS) Global Visualization Viewer (GloVis) [25].
The western part of Rwanda is rarely cloud-free [26]. The radiometric normalization was performed on these images for atmospheric correction using the Environment for Visualizing Images (ENVI) software Version 5.1 (Exelis Visual Information Solutions, Inc., a subsidiary of Harris Corporation, Boulder, CO, USA). The complete mosaic cloud-free image was obtained using the method of the cloud-shadow mask and the gap filling of masked areas with the data from the other recent images [26] acquired within the same year. The LCLU map of Rwanda was obtained using the maximum likelihood classification (MLC) algorithm developed in the ENVI software. The MLC algorithm is one of the well-known parametric classifier for supervised classification [27]. This classification method assumes that the statistics for each class in each band are normally distributed and calculates the probability that a given pixel belongs to a specific class. The calculation of the distinctive functions for each pixel in the image (Equation (1)) is used to perform MLC in the ENVI software [28].
g i ( x ) = 1 n p ( ω i ) 1 2   1 n   | i | 1 2 ( x m i ) T i 1 ( x m i )
where, i = class, x = n-dimensional data (n is the number of bands), p ( ω i ) = the probability that class ω i occurs in the image and the same is assumed for all classes, | i | = the determinant of the covariance matrix of the data in class ω i , i 1 = its inverse matrix and m i = the mean vector. The classification accuracy is validated if the overall classification accuracy is at least 85% [29,30,31] and 70% per-class accuracy [29]. Thereafter, based on the rule of thumb, 60 points were randomly sampled for each land cover class using the image that was used to create the classified image [32] and compared to Google Earth and other previous land cover maps [33] to verify land cover classification accuracy [34]. The results are expressed in an error matrix, which shows the overall and class accuracies and the number of ground truth points within each class. Kappa coefficient is a good indicator of accuracy that measures the overall agreement between reference data and the classified thematic map [26,35]. The results of performing a Kappa analysis is a Khat statistic (an estimate of Kappa) (Equation (2)) [36,37].
K ^ = N i = 1 r x i i i = 1 r ( x i +   × x + i ) N 2 i = 1 r ( x i + × x + i )
where, r is the number of rows in the matrix, xii is the number of observations in row i and column i, xi+ and x+i are the marginal totals of row i and column i, respectively, and N is the total number of observations.

2.2.2. The RUSLE Model

RUSLE was modified from the Universal Soil Loss Equation (USLE) by the United States Department of Agriculture (USDA) to identify situations where the rates of inter-rill and rill erosion are serious under various effects, such as land use, relief, soil and climate, and guide the development of conservation plans to control erosion [38]. Numerous studies have used the RUSLE model to estimate soil erosion loss and to plan erosion control for different land cover categories, such as croplands, rangelands and disturbed forest lands [21,39,40,41,42]. The RUSLE model was chosen to be used for this study because it is well-studied and it has been widely applied at different scales. For instance, compared to the other soil erosion risk methods, such Co-ordinated Information on the Environment (CORINE), the Netherlands National Institute for Public Health and the Environment (Dutch: Rijksinstituut voor Volksgezondheid en Milieu (RIVM), the Global Assessment of Soil Degradation (GLASOD) and Hot Spots approaches, it probably gives the most detailed information about the Europe-wide distribution of soil erosion risk [4].
Erosion models often use secondary data available in a geographic information system as an alternative approach because the measurement of soil erosion is expensive and time consuming [21]. The estimation of soil erosion based on RUSLE (Equation (3)) counts five elements as input variables (rainfall, soil property, topography, crop management and conservation practices) [38].
A = R × K × LS × C × P
where A is the average annual soil loss per unit area (t·ha−1·a−1); R is the rainfall-runoff erosivity factor (MJ·mm·ha−1·h−1·a−1); K is the soil erodibility factor (t·h·MJ−1·mm−1); LS is the slope length (L) and the slope steepness (S) factor (dimensionless); C is the cover and management factor (dimensionless); P is the support and conservation practice factor (dimensionless).

Rainfall Erosivity (R) Factor

The rainfall erosivity has a high impact on soil erosion [43] and contributes to about 80% of soil loss [44]. It can be expressed by the Fournier index (Fm) [18], which reflects the combined effect of rainfall amount and distribution as follows:
F m = 12 i = 1 12 p i 2 P a n n
where pi = monthly precipitation i; Pann = total annual precipitation.
The Fm index (Equation (4)) has been calculated from 5 arc-minute grid-cells for the years 1980–2000. Results of three Fournier index calculations for individual years were used to analyze the average value and to transform it into the R factor (Equation (5)).
R = [ ( 4.17 × F ) 152 ]
where F is Fournier’s index, whereas, in tropical areas, the R factor (Equation (6)) was alternatively estimated based on rainfall.
R = [ 38.46 + ( 3.48 × P ) ]
P represents the average annual rainfalls.

Soil Erodibility (K) Factor

The K factor (Equation (7)) is a quantitative value that is experimentally determined taking into consideration the soil texture and structure, the organic matter content and the permeability [45].
K = 2.1 × 10 6 × M 1.14 × ( 12 O M ) + 0.0325 × ( P 2 ) + 0.025 × ( S 3 )
where M = (% silt + % very fine sand) (100% clay); OM = the percentage of organic matter; P = permeability class; and S = structure class.

Slope Length and Steepness (LS) Factor

The slope length (L) factor represents the effect of slope length on erosion, and the slope steepness (S) factor reflects the influence of slope gradient on erosion [45]. The effects of slope steepness have a greater impact on soil loss than slope length. The steeper the slope, the greater is the erosion. The LS factor is calculated by Equation (8) [46].
LS = [ Q a M 22.13 ] y × ( 0.065 + 0.045 × S g + 0.0065 × S g 2 )
where LS = topographical factor; Q a = flow accumulation grid; S g = grid slope in percentage; M = grid size (xy), y = a constant dependent on the value of the slope gradient: 0.5 for slopes greater than 4.5%, 0.4 for slopes 3%–4.5% degrees, 0.3 for slopes 1%–3% degrees and 0.2 for slopes less than 1%.

Cover Management (C) Factor

The C factor reflects the effects of cropping and management practices on soil erosion rates in agricultural lands and the effects of vegetation canopy and ground covers on reducing the soil erosion in forested regions [38]. Following Kim et al. (2005) and Ganasri and H. Ramesh (2015) [46,47], we set the C factor to 0, 0.003, 0.09 and 0.63 for the wetland, forest, settlement and grassland and cropland, respectively.

Support Practice (P) Factor

The P factor represents the significant impacts of various conservation practices on soil erosion [48]. The P factor is dependent on the slope and the cultivation method, such as terracing (Table 2) [49]. According to the study of Nachtergaele et al., 2011 [18], the P factor was set to 0.75 for the croplands in Rwanda, which reflects the rudimentary agriculture system with minimal conservative practice in the country.

2.2.3. Model Application

The study area was delineated using the administrative boundaries’ shapefile from the Rwanda Natural Resources Authority (RNRA) [50]. The data were processed using the ArcGIS software version 10.2 (Environment Systems Research Institute (Esri) Inc., Redlands, CA, USA), except the LCLU (Figure 2) map produced using ENVI software Version 5.1 (Exelis Visual Information Solutions, Inc., a subsidiary of Harris Corporation, Boulder, CO, USA). Using the nearest-neighbor resampling method, all of the datasets were resampled to the same spatial resolution of 30 m and reprojected to the World Geodetic System (WGS) 1984 / Universal Traverse Mercator (UTM) zone 35 south (Figure 3). The data used for the estimation of soil erosion loss by water comprise five parameters of the RUSLE model, notably the rainfall erosivity (R) factor, the soil erodibility (K) factor, slope length and steepness (LS), the support practice (P) factor and the cover management (C) factor, as listed in Table 3 and shown in Figure 2.
The results from the RUSLE parameterization (Figure 2) revealed that the increased Rainfall erosivity ranges from 4577–6088 MJ·mm·ha−1·h−1·a−1 from the eastern to the western region of Rwanda, respectively (Figure 2a); the soil erodibility ranges from 0–0.24 t·h·MJ−1·mm−1 (Figure 2b); the slope steepness and slope length factor ranges from 0–322 and is high in the western region (Figure 2c).
Furthermore, the datasets of 20 years of rainfall intensity (1993–2012) acquired from the Earth System Research Laboratory [52] were processed and used throughout the discussions on the spatial rainfall distribution in Rwanda.

3. Results

3.1. Assessment of Land Cover and Land Use in Rwanda

This study produced a 30-m resolution 2015 LCLU map for Rwanda (Figure 3). According to our evaluation, the overall accuracy of the LCLU classification was 94.70%, with a kappa coefficient of 93.66%. The cropland LCLU type had a relatively high omission error of 13%, while the grassland had a relatively high commission error of 14% (Table 4). Due to the spectral similarity of the crops and the grasses, it was difficult to separate them from the Landsat image. Therefore, our LCLU map might have slightly underestimated the cropland areas and overestimated the grassland area, but the overall accuracies (ranging from 86%–98%) for the two LCLU types are acceptable.
Our results showed that cropland occupied 53% of the country’s area, followed by forest (21%) and grassland (16%) (Figure 4, inner circle). It is noteworthy that 22% of the forests were located in two natural forest reserves, the Nyungwe National Park in the southwest and the Volcanoes Park in the northwest, while the vast mountain areas, especially the Congo Nile Ridge in the west, were exposed to extensive agricultural disturbances (Figure 3). For example, the eastern slope of the Congo Nile Ridge, including the Huye, Nyanza, Ruhango and Kamonyi districts, had very high cropland coverage (81%–90%).

3.2. The Soil Erosion in Rwanda

According to our study, Rwanda had a mean soil erosion rate of 250 t·ha−1·a−1, which resulted in an annual soil loss of 595 million tons (Table 5). As it can be observed from Figure 5, 78% of the total land had soil erosion rates ranging from 0–100 t·ha−1·a−1 with a mean erosion rate of 5 t·ha−1·a−1 and contributed to the total annual soil loss by only 1.5%; 4% of the land comprised erosion rates varying between 100–200 t·ha−1·a−1 with a mean erosion rate of 148 t·ha−1·a−1 and contributed to the total annual soil loss by 2.4%; 3% of the land had erosion ranging from 200–300 t·ha−1·a−1 with a mean erosion rate of 251 t·ha−1·a−1 and added to the total annual soil loss by 2.9% while 15% of the total national land was exposed to an estimated erosion rate of ≥300 t·ha−1·a−1, substantially contributing to the total annual soil loss countrywide (93.2%) of the total annual soil loss countrywide (Figure 5). Croplands, with a mean erosion rate (421 t·ha−1·a−1) much higher than other LCLU types (69 t·ha−1·a−1, 46 t·ha−1·a−1 and 3 t·ha−1·a−1 for grassland, settlements and forests, respectively), contributed to 95% of the national soil loss (Figure 4, outer circle). The forests that cover 21% of the national land area only accounted for 0.2% of the national soil loss. Gakenke Ngororero and Muhanga districts, which are located between the west mountain ranges (the Congo Ridge and the Volcanic Range) and the Buberuka highlands, had the highest soil erosion, ranging from 533 t·ha−1·a−1–678 t·ha−1·a−1, among the 30 administrative districts in Rwanda (Table 5). The top eleven districts with the highest soil erosion accounted for 52% of the national soil loss, but only occupying 29% of Rwanda’s area. Nine of them also ranked in the top eleven among the 30 districts for their cropland soil erosion rates (Table 5). Although Huye district had a relatively low cropland soil erosion rate (357 t·ha−1·a−1), it had the second highest cropland coverage (83%) in the country. Therefore, Huye ranked tenth in the soil erosion rate in Rwanda. These findings indicate that severe soil erosion in Rwanda was mainly caused by inappropriate cropland management, including the unsuitable location of croplands and inadequate soil conservation practices in agriculture.
It is noteworthy that nine of the top eleven high-erosion districts were located in the west mountain area, where both slope angle and precipitation were high (Figure 1; Figure 2a,c; Table 5). Cropland cultivation in such an area increases the risk of soil erosion. According to Kim et al. [33], an area is potentially unsuitable for cropland if the erosion rate under cultivation (C factor = 0.63) is higher than 300 t·ha−1·a−1, the threshold of extreme soil erosion. Based on this standard, we identified the lands unsuitable for cropland cultivation in Rwanda (Figure 6a) and assessed the croplands that are currently causing extreme soil erosion (Figure 6b). We found that 23% of the land area in Rwanda is unsuitable for cropland cultivation, and 24% of the croplands (326,869 ha) in Rwanda are currently (in 2015) located in the unsuitable areas, leading to an extreme soil erosion of 1642 t·ha−1·a−1. These inappropriately-located croplands occupied less than 14% of the land area, but were responsible for 90% of the soil erosion in Rwanda.
Most of the unsuitable croplands were distributed along the Congo Nile Ridge-Volcanic Range mountain areas in the west and the Buberuka highlands in the north. The Congo Nile Ridge-Volcanic Range mountain areas had a steep slope (32% versus the countrywide slope of 23%) and strong mean rainfall (1379 mm·a−1 versus the countrywide mean rainfall of 1156 mm·a−1); the Buberuka highlands are characterized by extremely rough terrain with a mean slope of 36% (Figure 2f) and mean rainfall of 1161 mm·a−1. Our analysis indicated that the soil erosion rate increased exponentially with the slope of the cropland in Rwanda (Figure 7). When the slope is steeper than 30%, the mean erosion rate of cropland quickly exceeds 500 t·ha−1·a−1.

4. Discussion

As has been extensively reported, a galloping demography poses serious threats to environmental sustainability in Rwanda [14]. The combination of the previous statistics of LCLU for three periods, namely 1990, 2000 and 2010 [
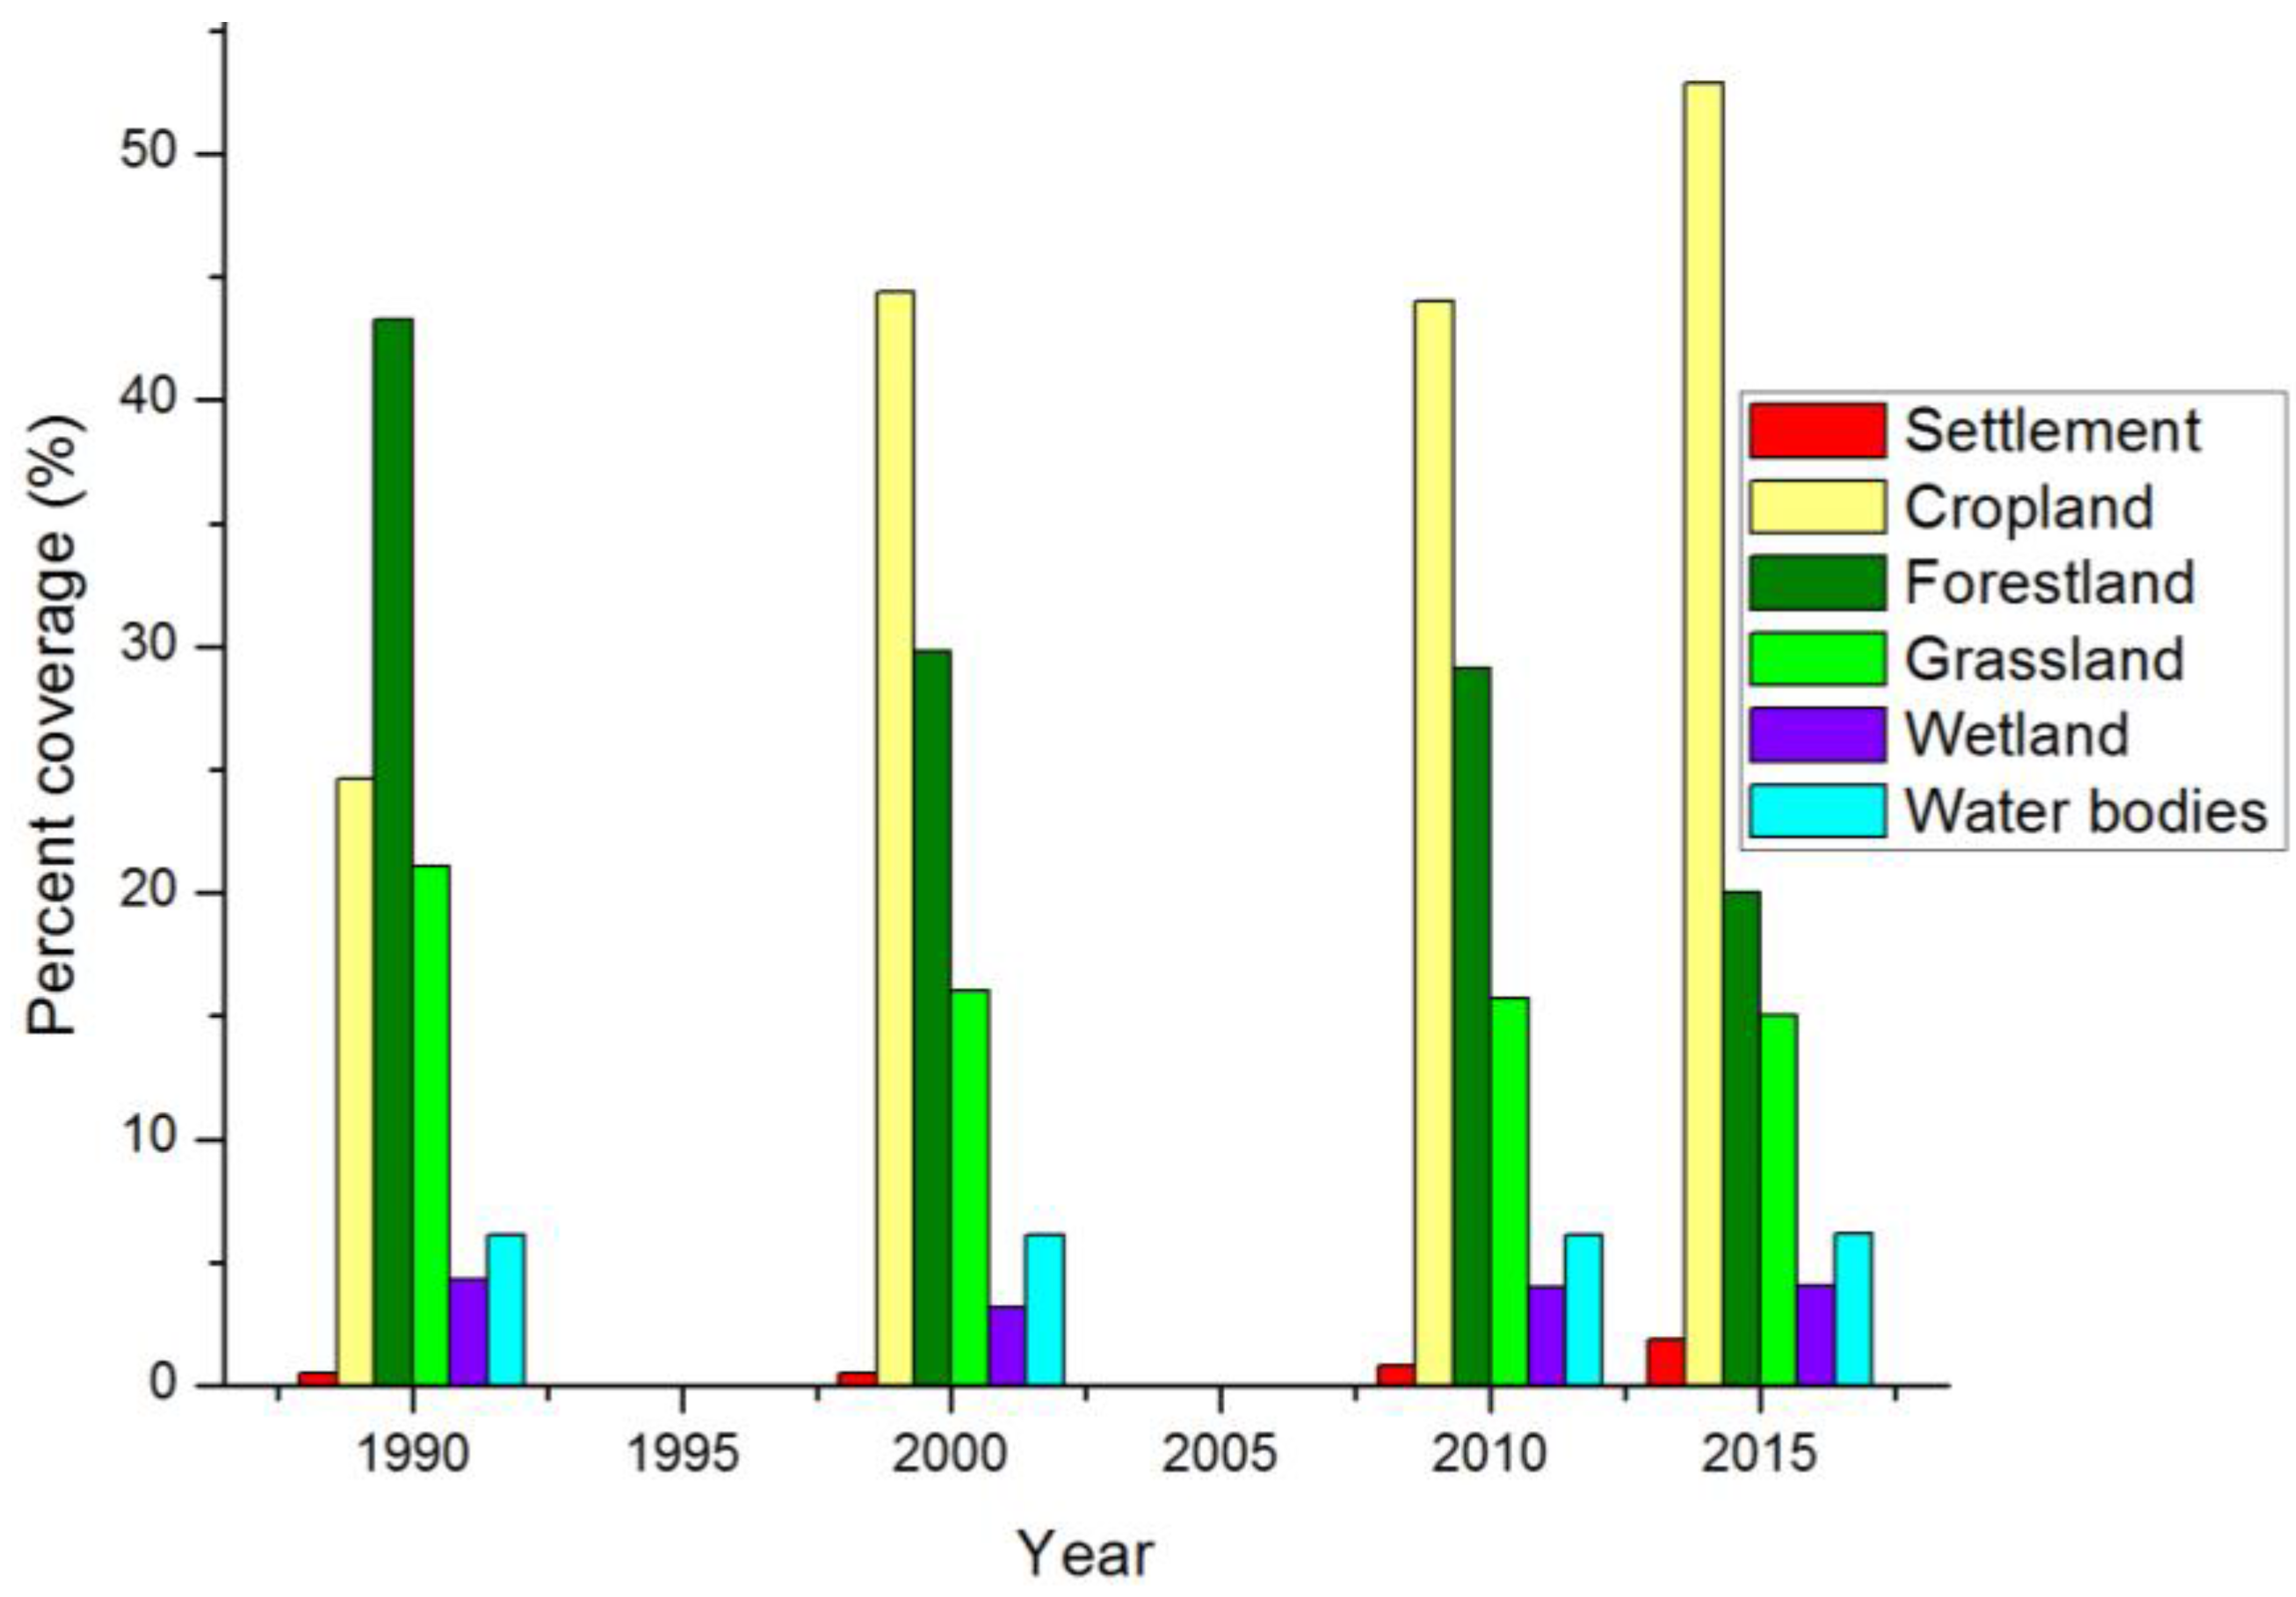
33], and the LCLU statistics obtained from the present study revealed that LCLU in Rwanda has been greatly changing in response to the demographic pressure during the past 25 years (
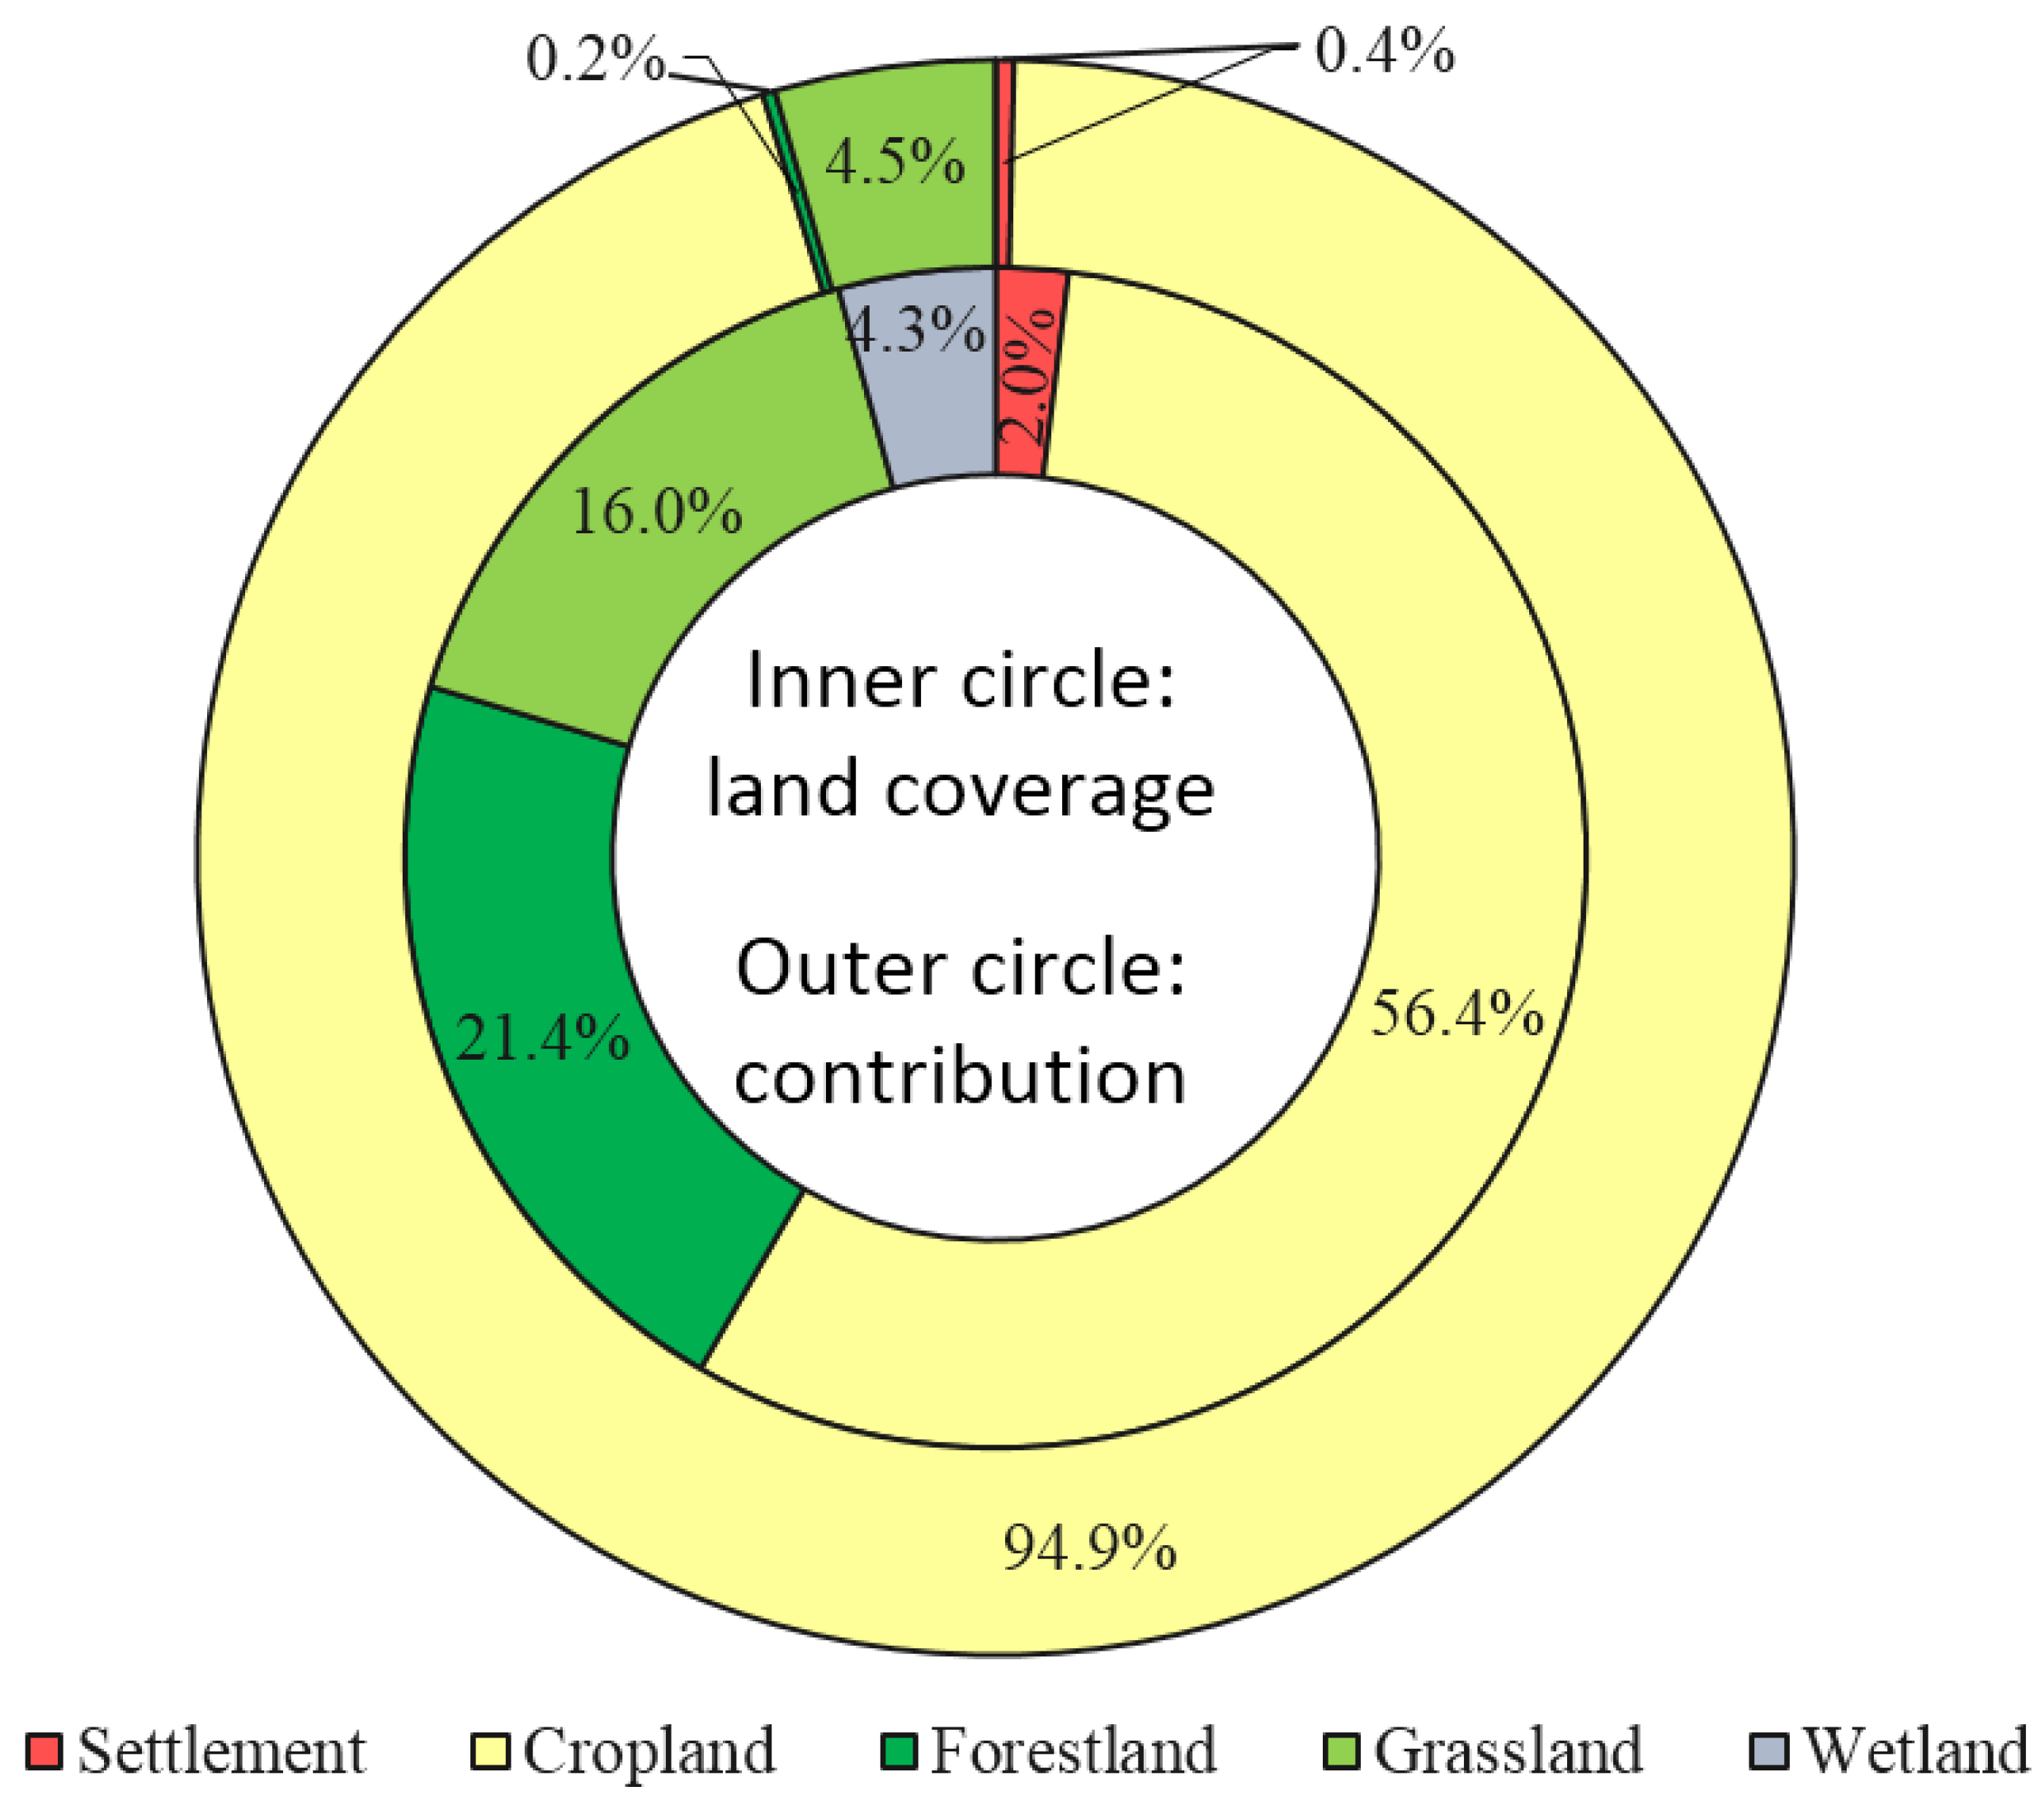
Figure 8). Just 25 years ago, forest covered about 44% of Rwanda, and the cropland only occupied 28% of the territory. Today, more than 56% of the country’s land areas have been converted to croplands to meet the food demands, at the expanse of massive deforestation. Especially, our results indicated a sharp increase of cropland area in the recent five years (2010–2015).
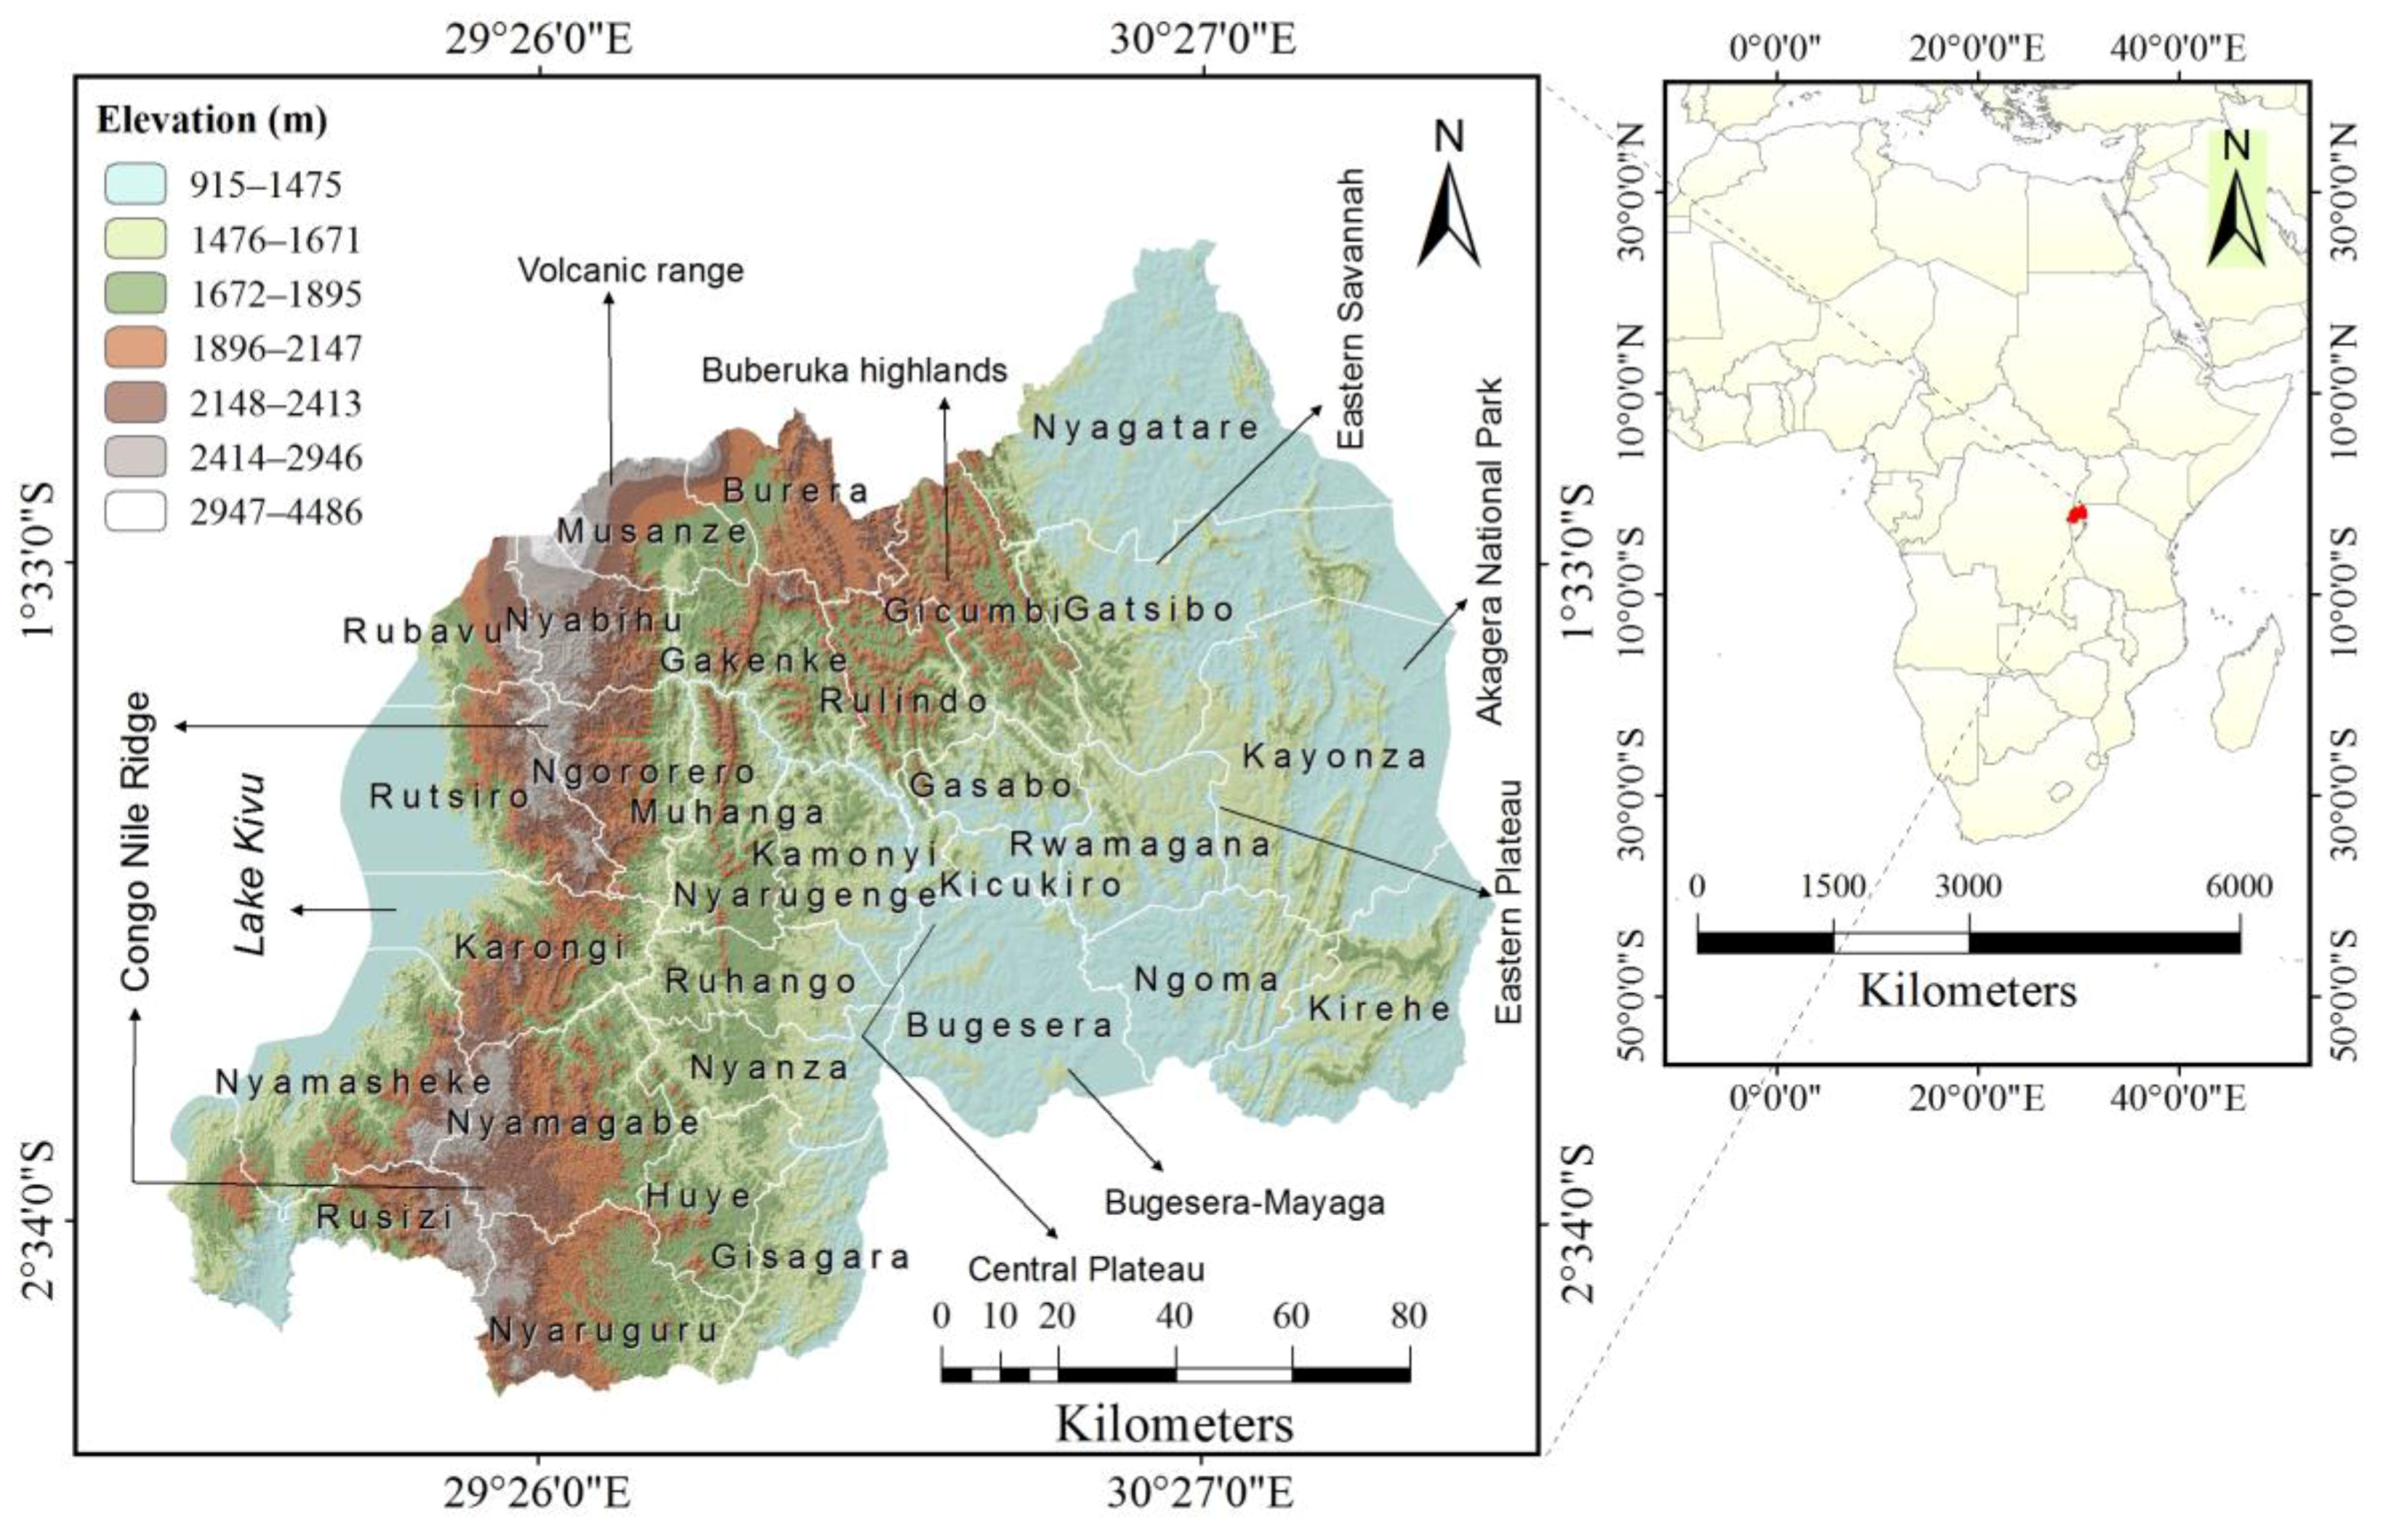
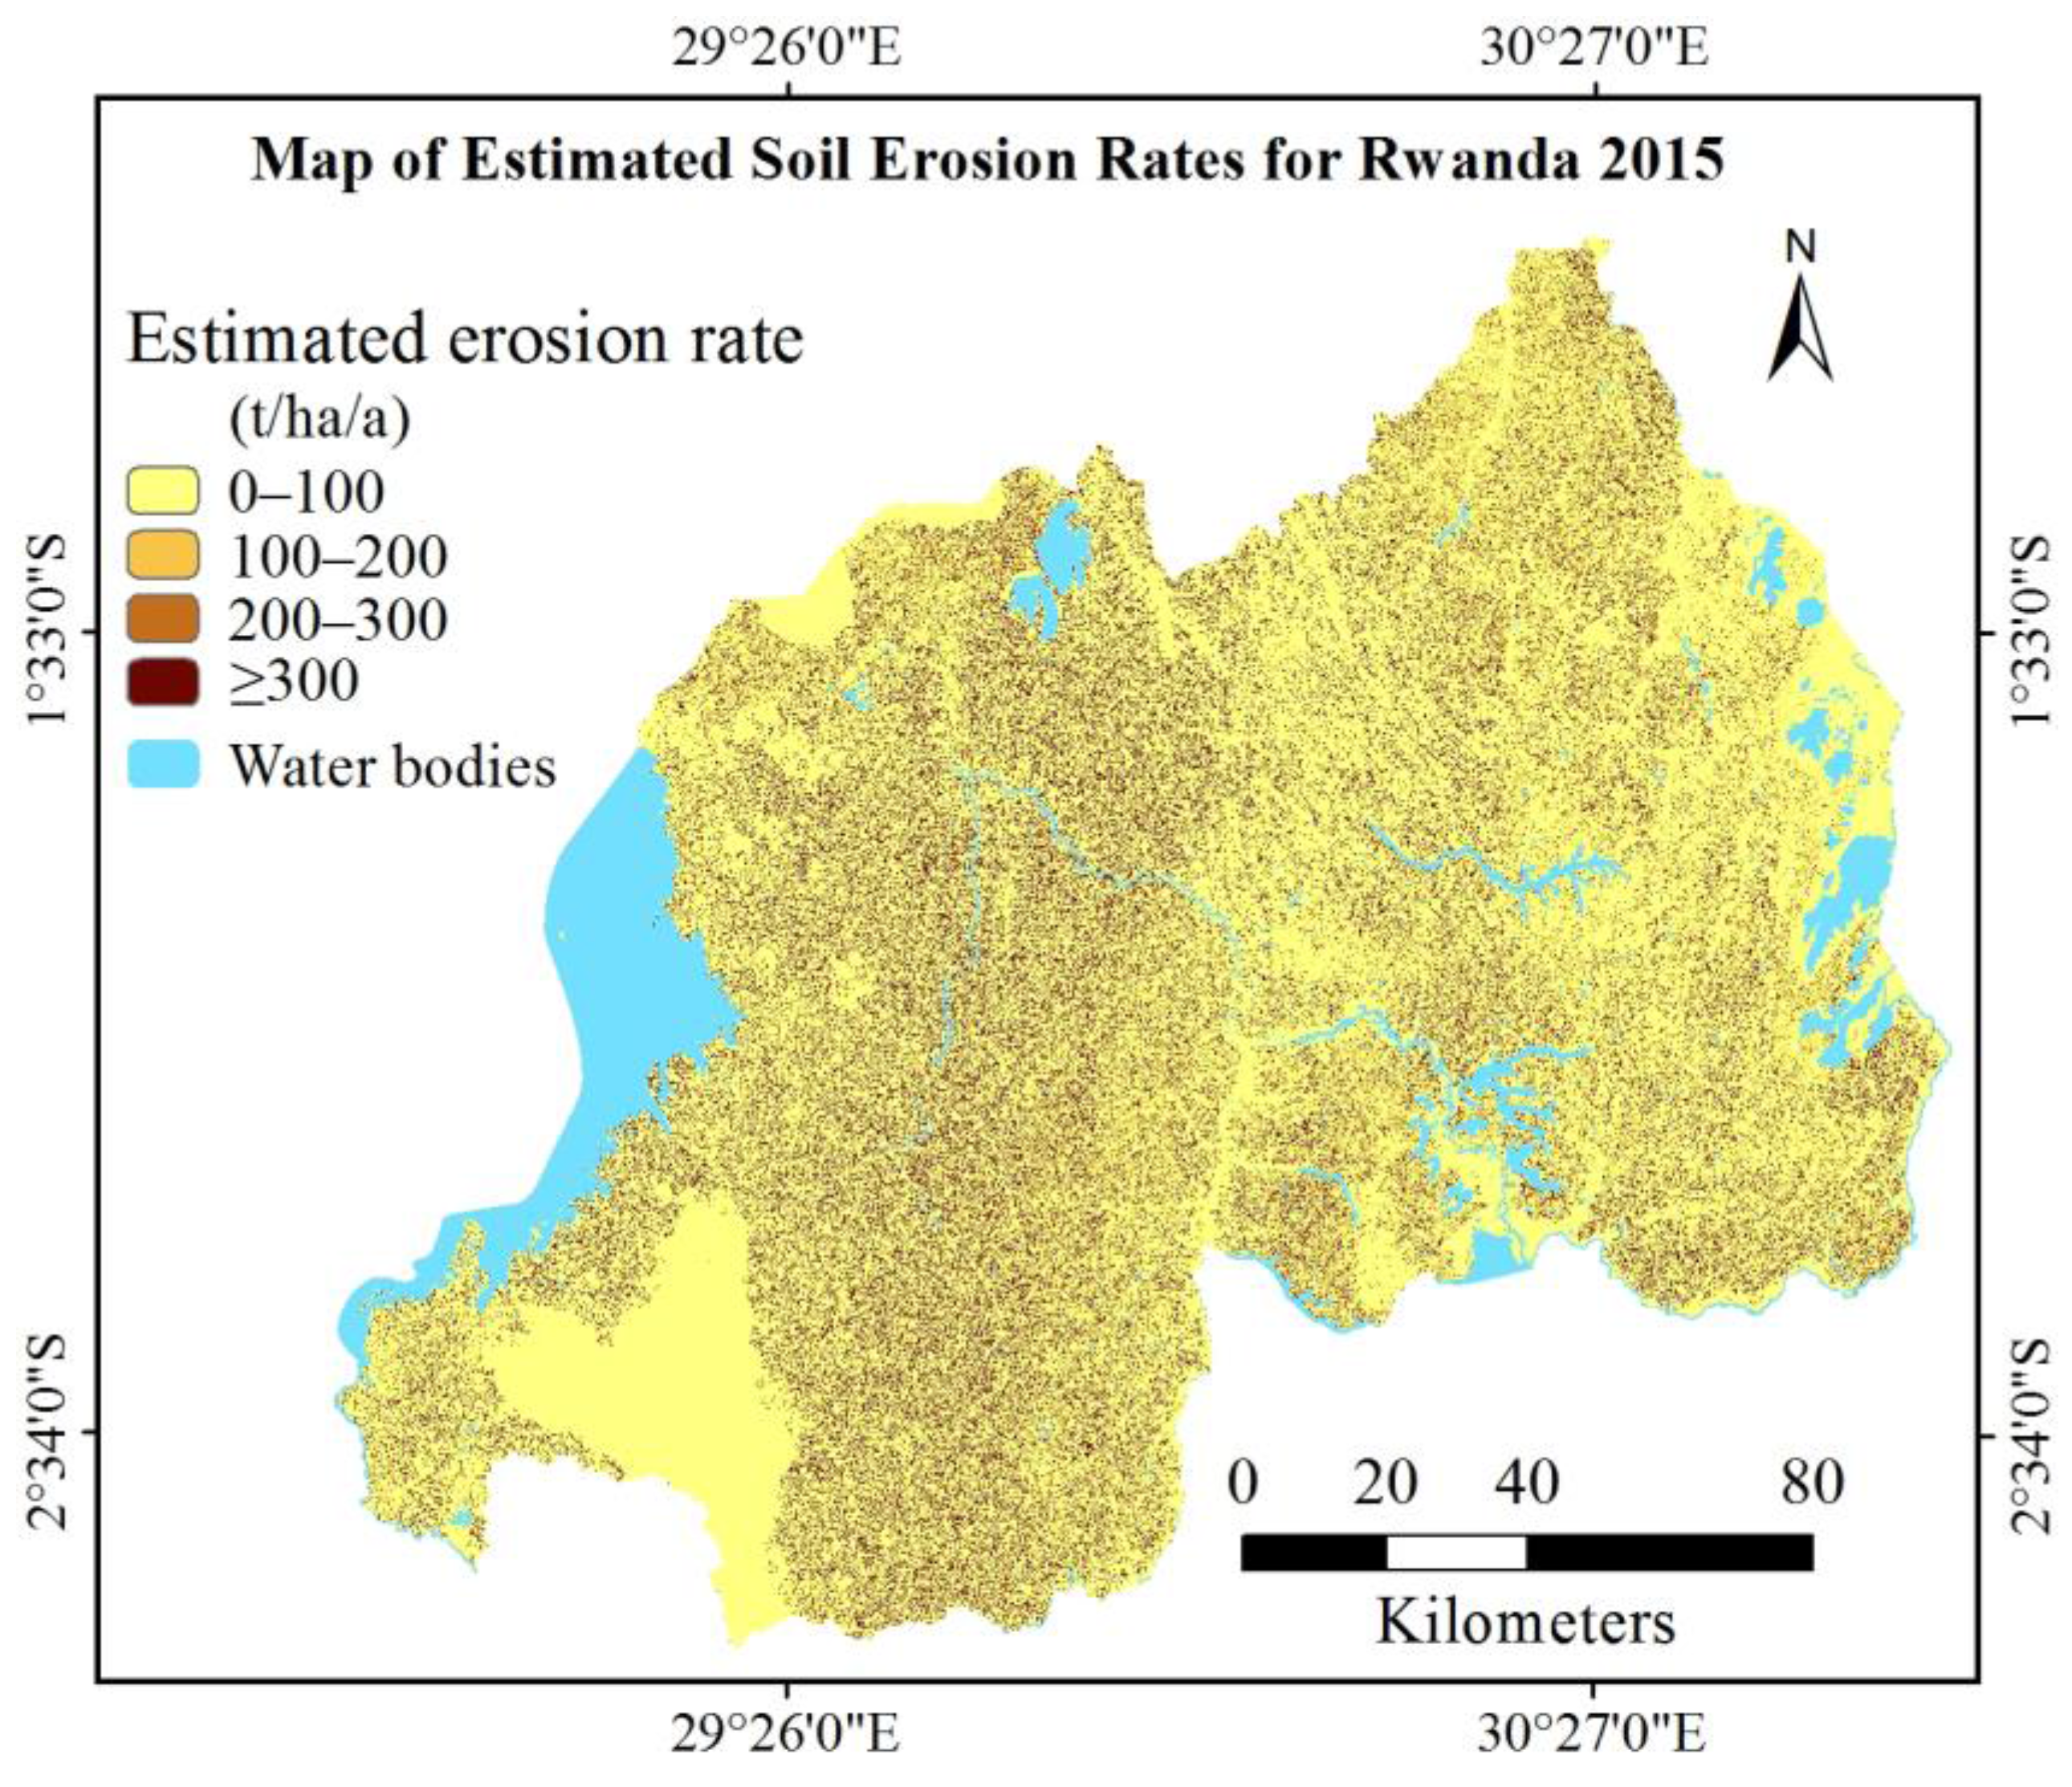
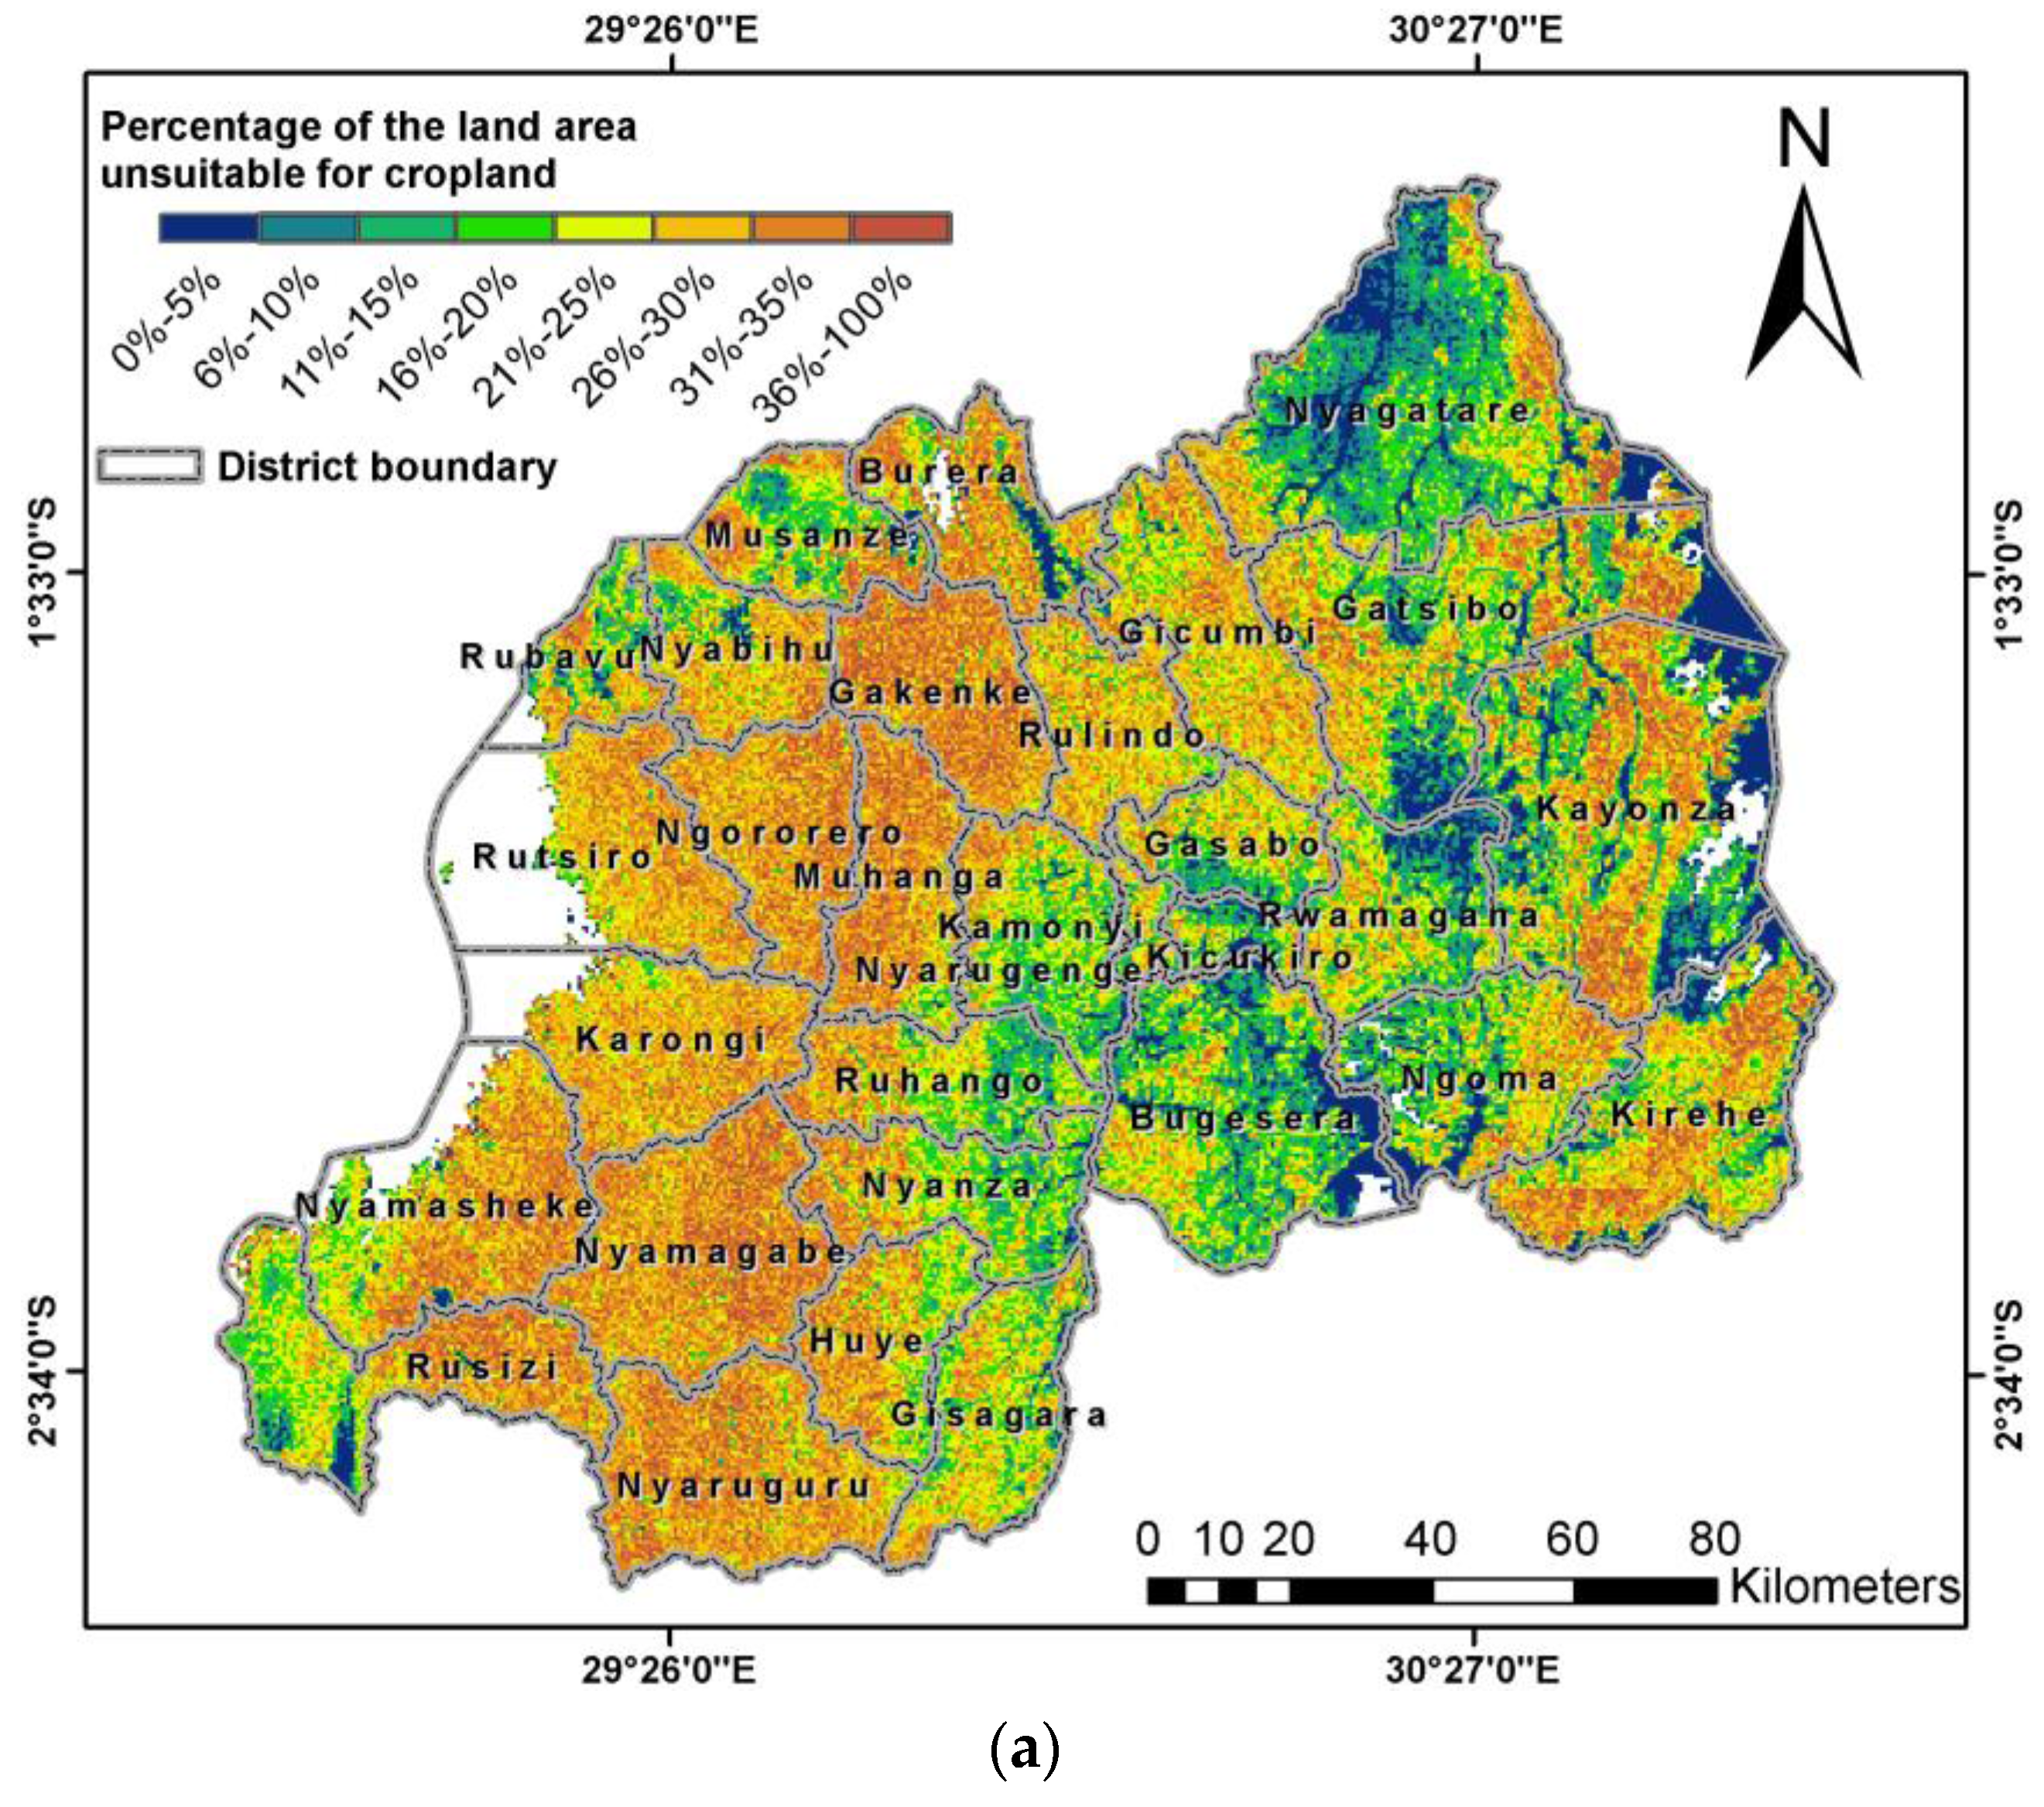
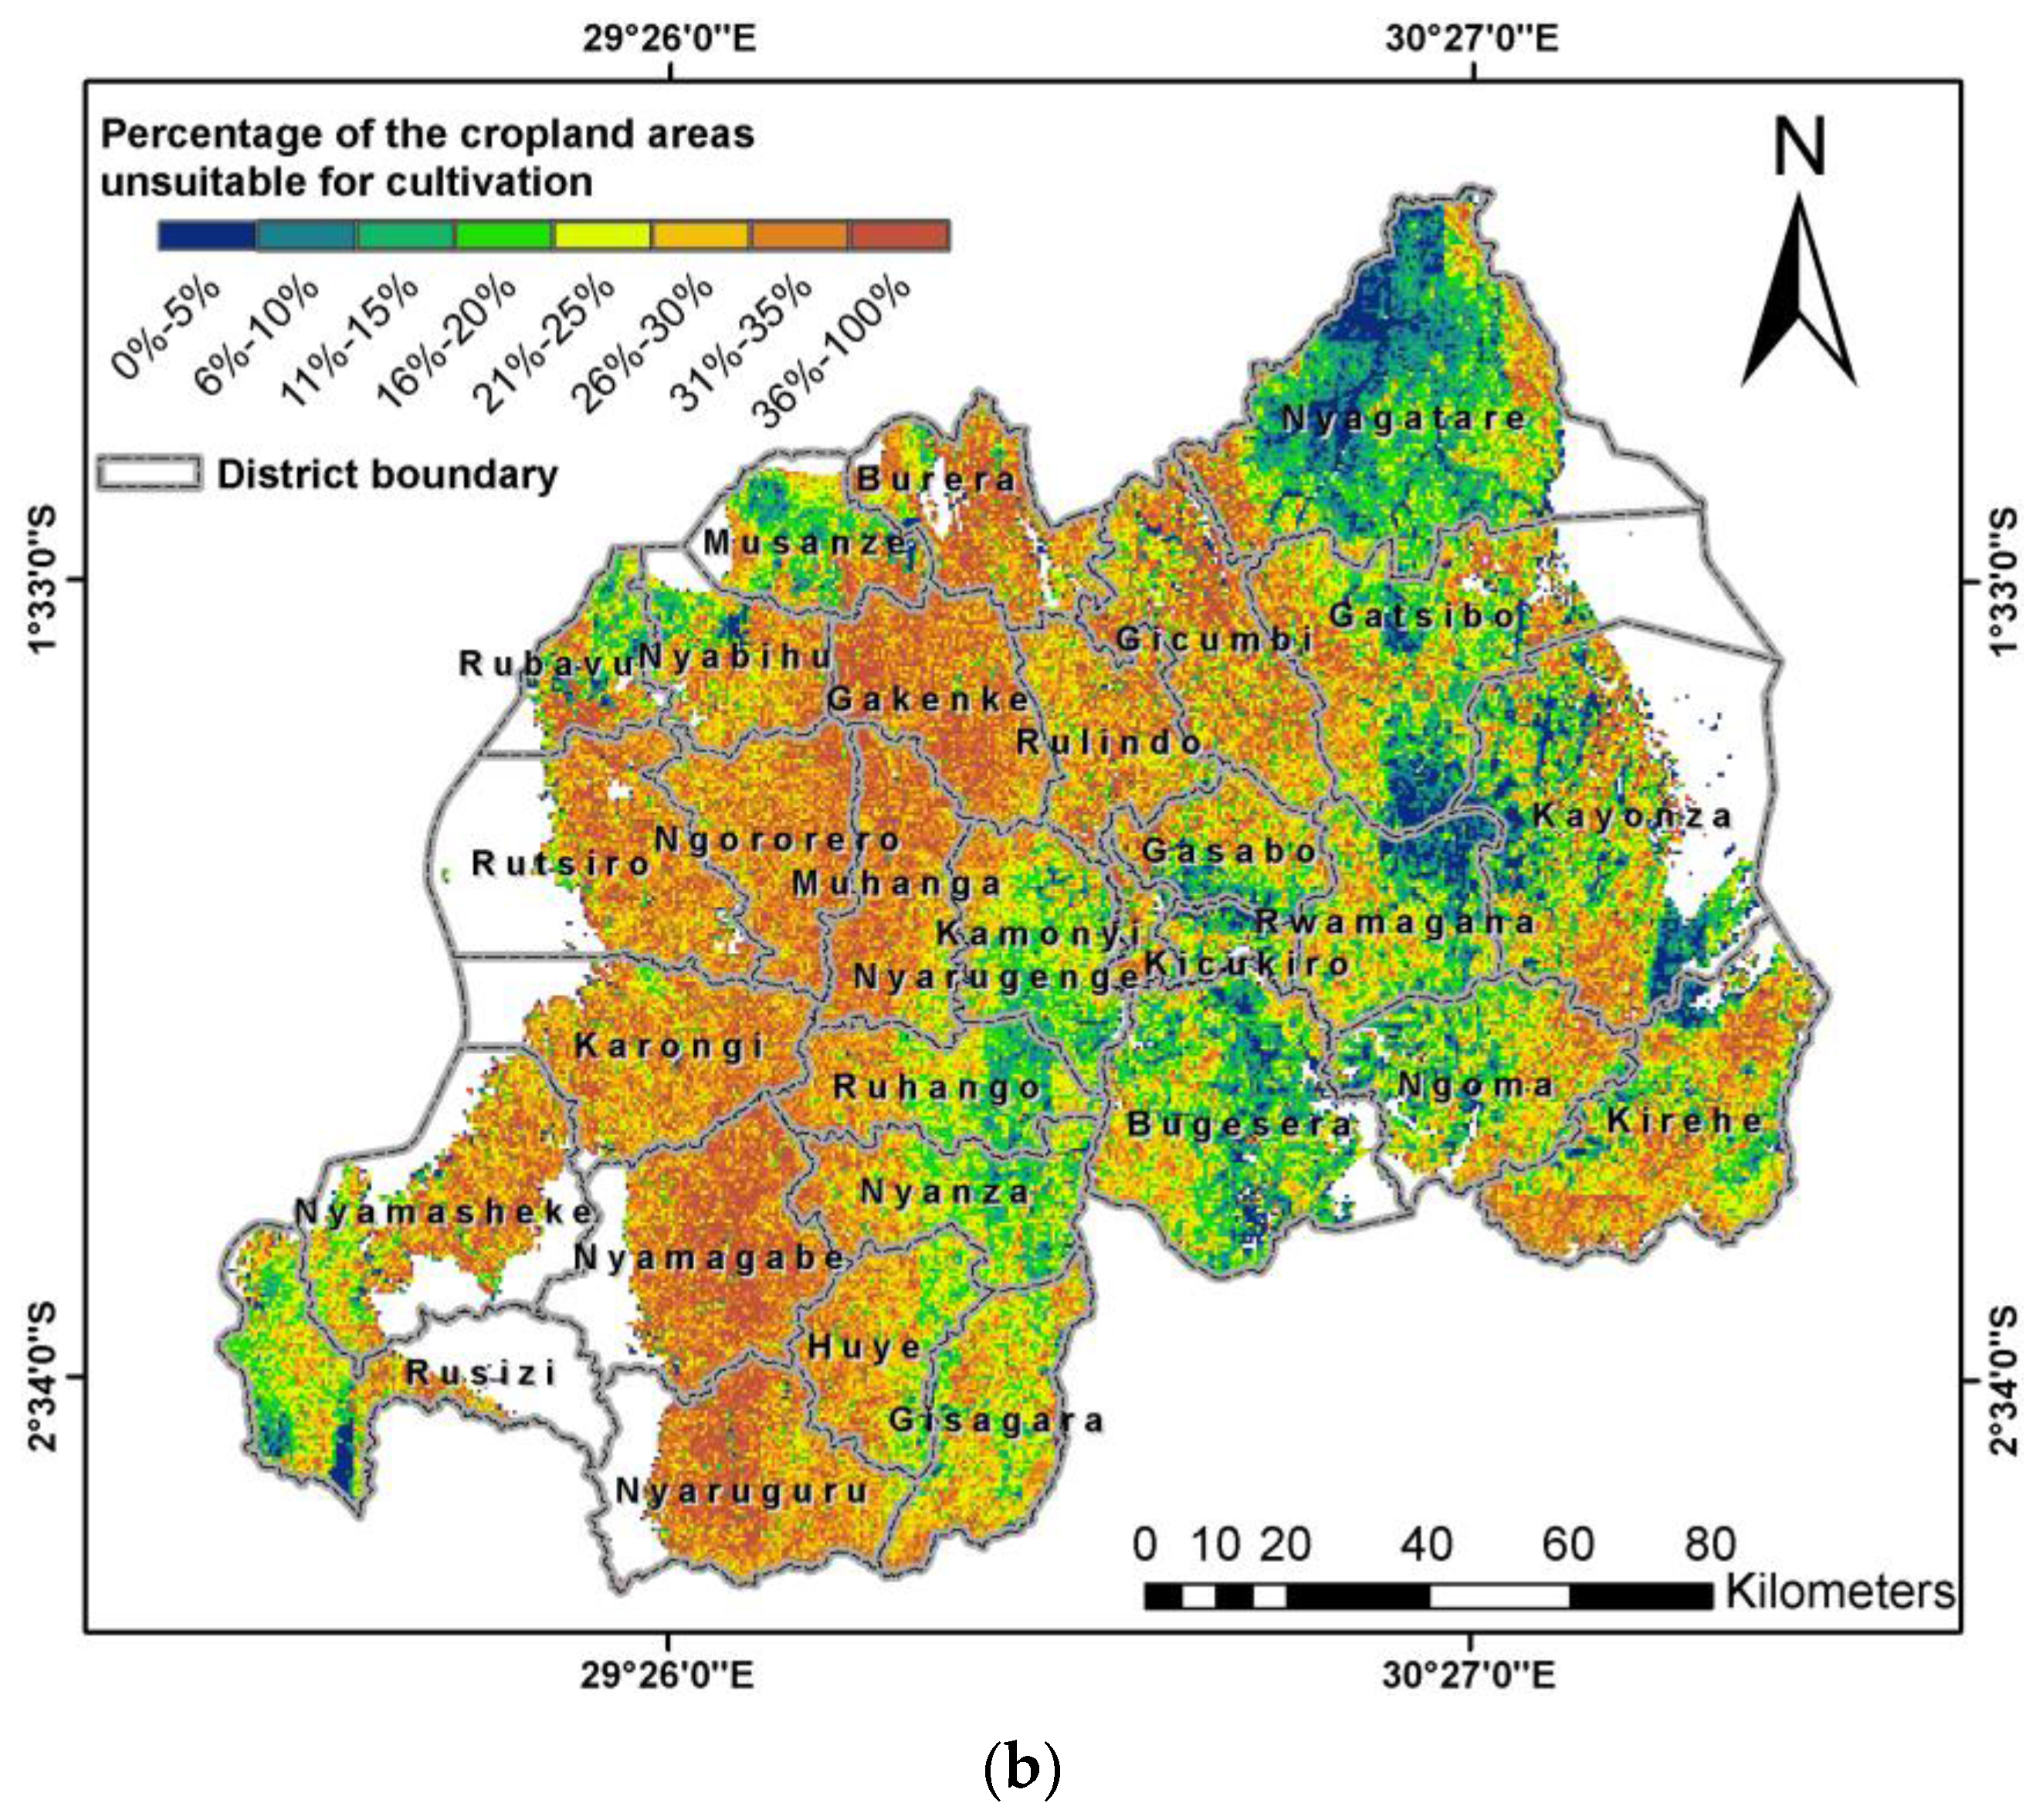
As the land resource became scarce, many of the croplands were established in the mountain areas that were unsuitable for cultivation, leading to extreme soil erosion that threatened the environment, such as soil and water resources, and the agriculture sustainability of Rwanda (Figure 6b). Our modeling results confirmed previous findings that intensive farming on steep slopes of the Buberuka highlands has led to heavy soil loss in the north of Rwanda [53]. In addition, we found that the west mountain ranges that stretch from the Congo Nile Ridge in the south to the Volcanic Range in the north also faced severe soil erosion due to unsuitable cropland cultivation. A field study in the Guacerique, Honduras, a watershed with similar mountainous terrain (elevation = 1420 m) and climate (precipitation = 1400 mm·a−1), showed that traditional agricultural practices on the mountain slopes led to a soil erosion rate exceeding 300 t·ha−1·a−1 [54]. The findings of this study are in agreement with the findings of previous research that estimated the erosion rate at around 300 t·ha−1·a−1 for other areas in the tropics [47,54]. Moreover, the extreme soil erosion rate of 1642 t·ha−1·a−1 observed in this study falls within the range of high erosion occurring in areas with very fragile soils, steep slopes and high rainfall intensity, as previously discussed by Ganasri et al. while estimating the soil erosion in Nethravathi basin located in the middle region of the Western Ghats, western India where the soil erosion rate was ranging from 0–1,907,287 t·ha−1·a−1 [46]. This study also highlighted that croplands on steeper terrains are exposed to mean erosion rates much higher (421 t·ha−1·a−1) than the other LCLU types, as previously indicated by various research [4,18,46,47,55]. Soil erosion is responsible for water pollution in Rwanda, for example the high turbidity (737 ± 571 Nephelometric Turbidity Units) of the Nyabarongo River of Rwanda where 62% of its pollution comes from the agricultural land use in its catchment [56]. Soil erosion also reduced soil fertility and caused declining cropland productivity in Rwanda [53]. In the world, soil erosion causes an estimated production loss of 10% for cereals, 5% for soybeans, 5% for pulses and 12% of roots and tubers [57]. The consequence is an increasing demand for more land conversion to cropland to maintain food production, leading to an unsustainable loop that will quickly deplete the land resources of Rwanda.
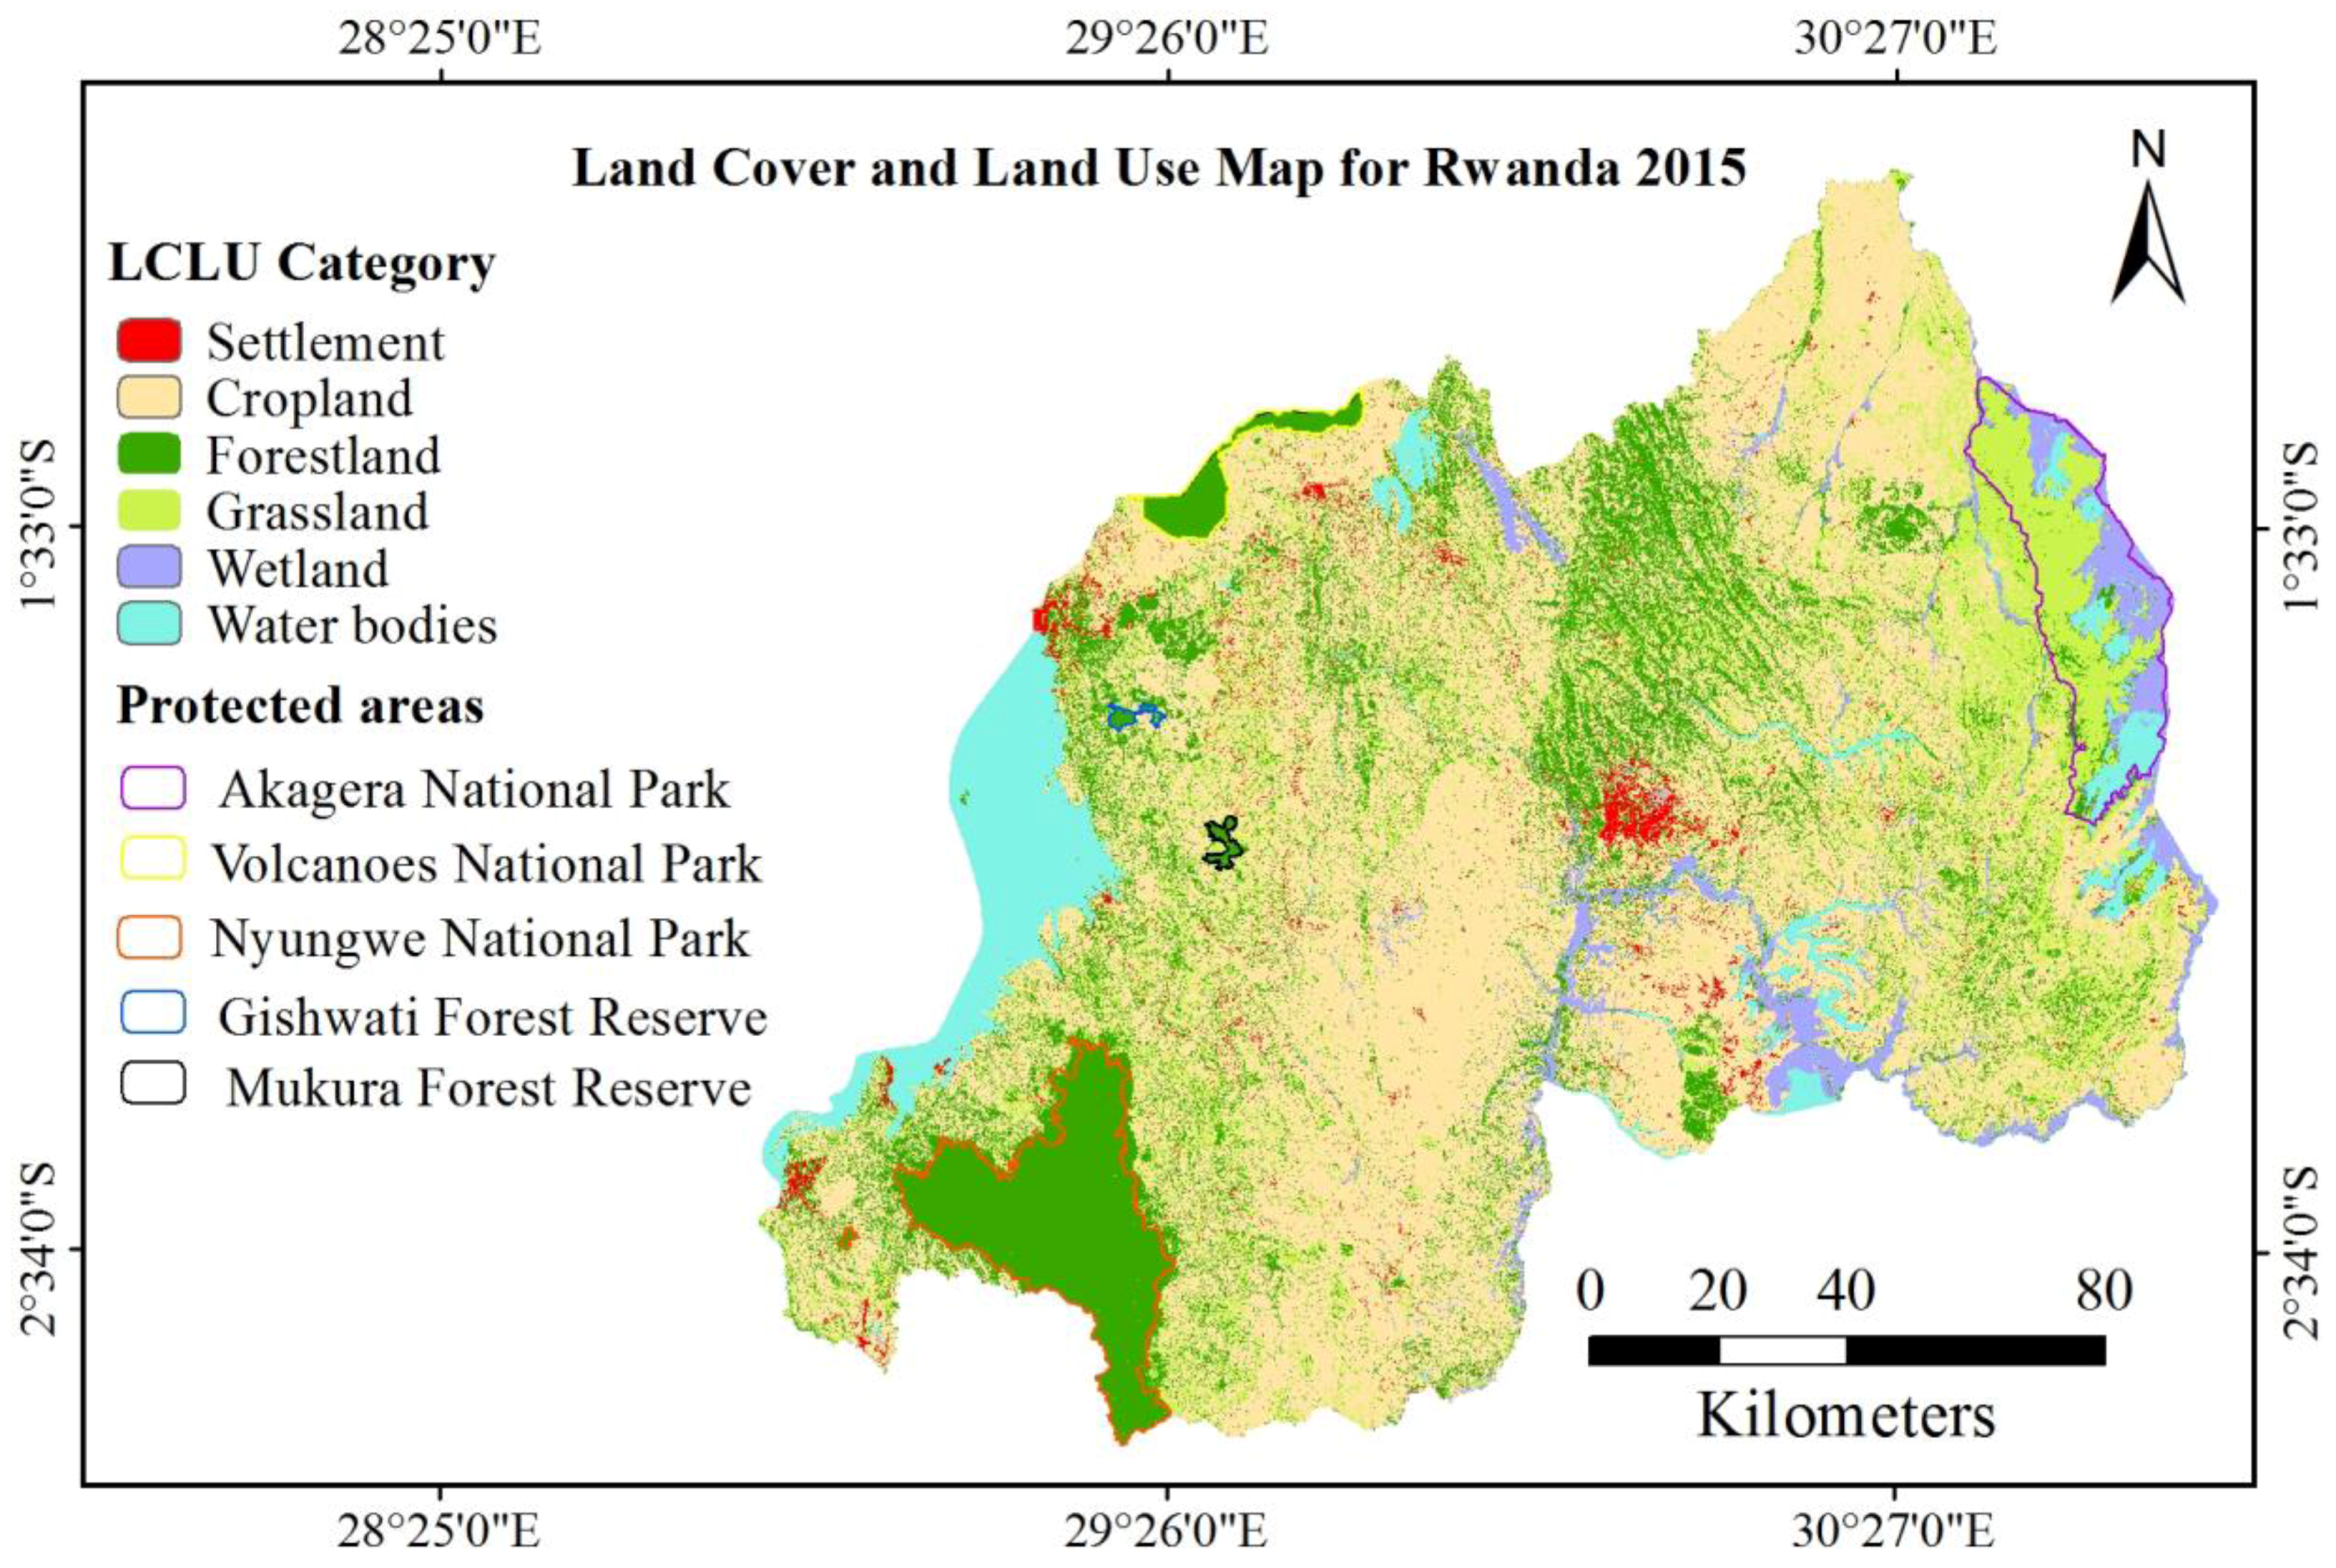
Therefore, it is ultimately urgent to take actions to curb the severe soil erosion caused by the inappropriate cropland management in Rwanda. Returning the unsuitable cropland (as identified in Figure 6b) to forest might effectively reduce soil erosion or else, other practical mechanisms should be assessed. Our soil erosion map clearly shows that the four forest reservations—the Nyungwe National Park, the Gishwati Forest Reserve, the Mukura Forest Reserve and the Volcanoes National Park (Figure 3)—had very low soil erosion, in contrast to the high erosion rate of the rest of the areas in the west of Rwanda (Figure 5). Our study, like the previous studies (e.g., [38,58]), indicated that a slope greater than 30% is associated with severe erosion and can be used as a threshold in determining the site of reforestation. According to our analysis, 26% of the total Rwandan croplands located on a slope >30% accounted for 60% of the total soil erosion in Rwanda. However, our assessment indicated that under the current agricultural management practice, the unsuitable cropland accounted for 24% of the cultivated area. Abandoning such a large fraction of cropland will create big challenges for the Rwanda government to meet the food demand from a galloping demography. One of the solutions would be the adoption of terraces. Properly-designed terraces and outlet channels collect surface runoff and convey it off the field at non-erosive velocities [38]. Several studies suggested that bench (radical) terraces could effectively curb soil erosion risk in mountain areas [59,60].
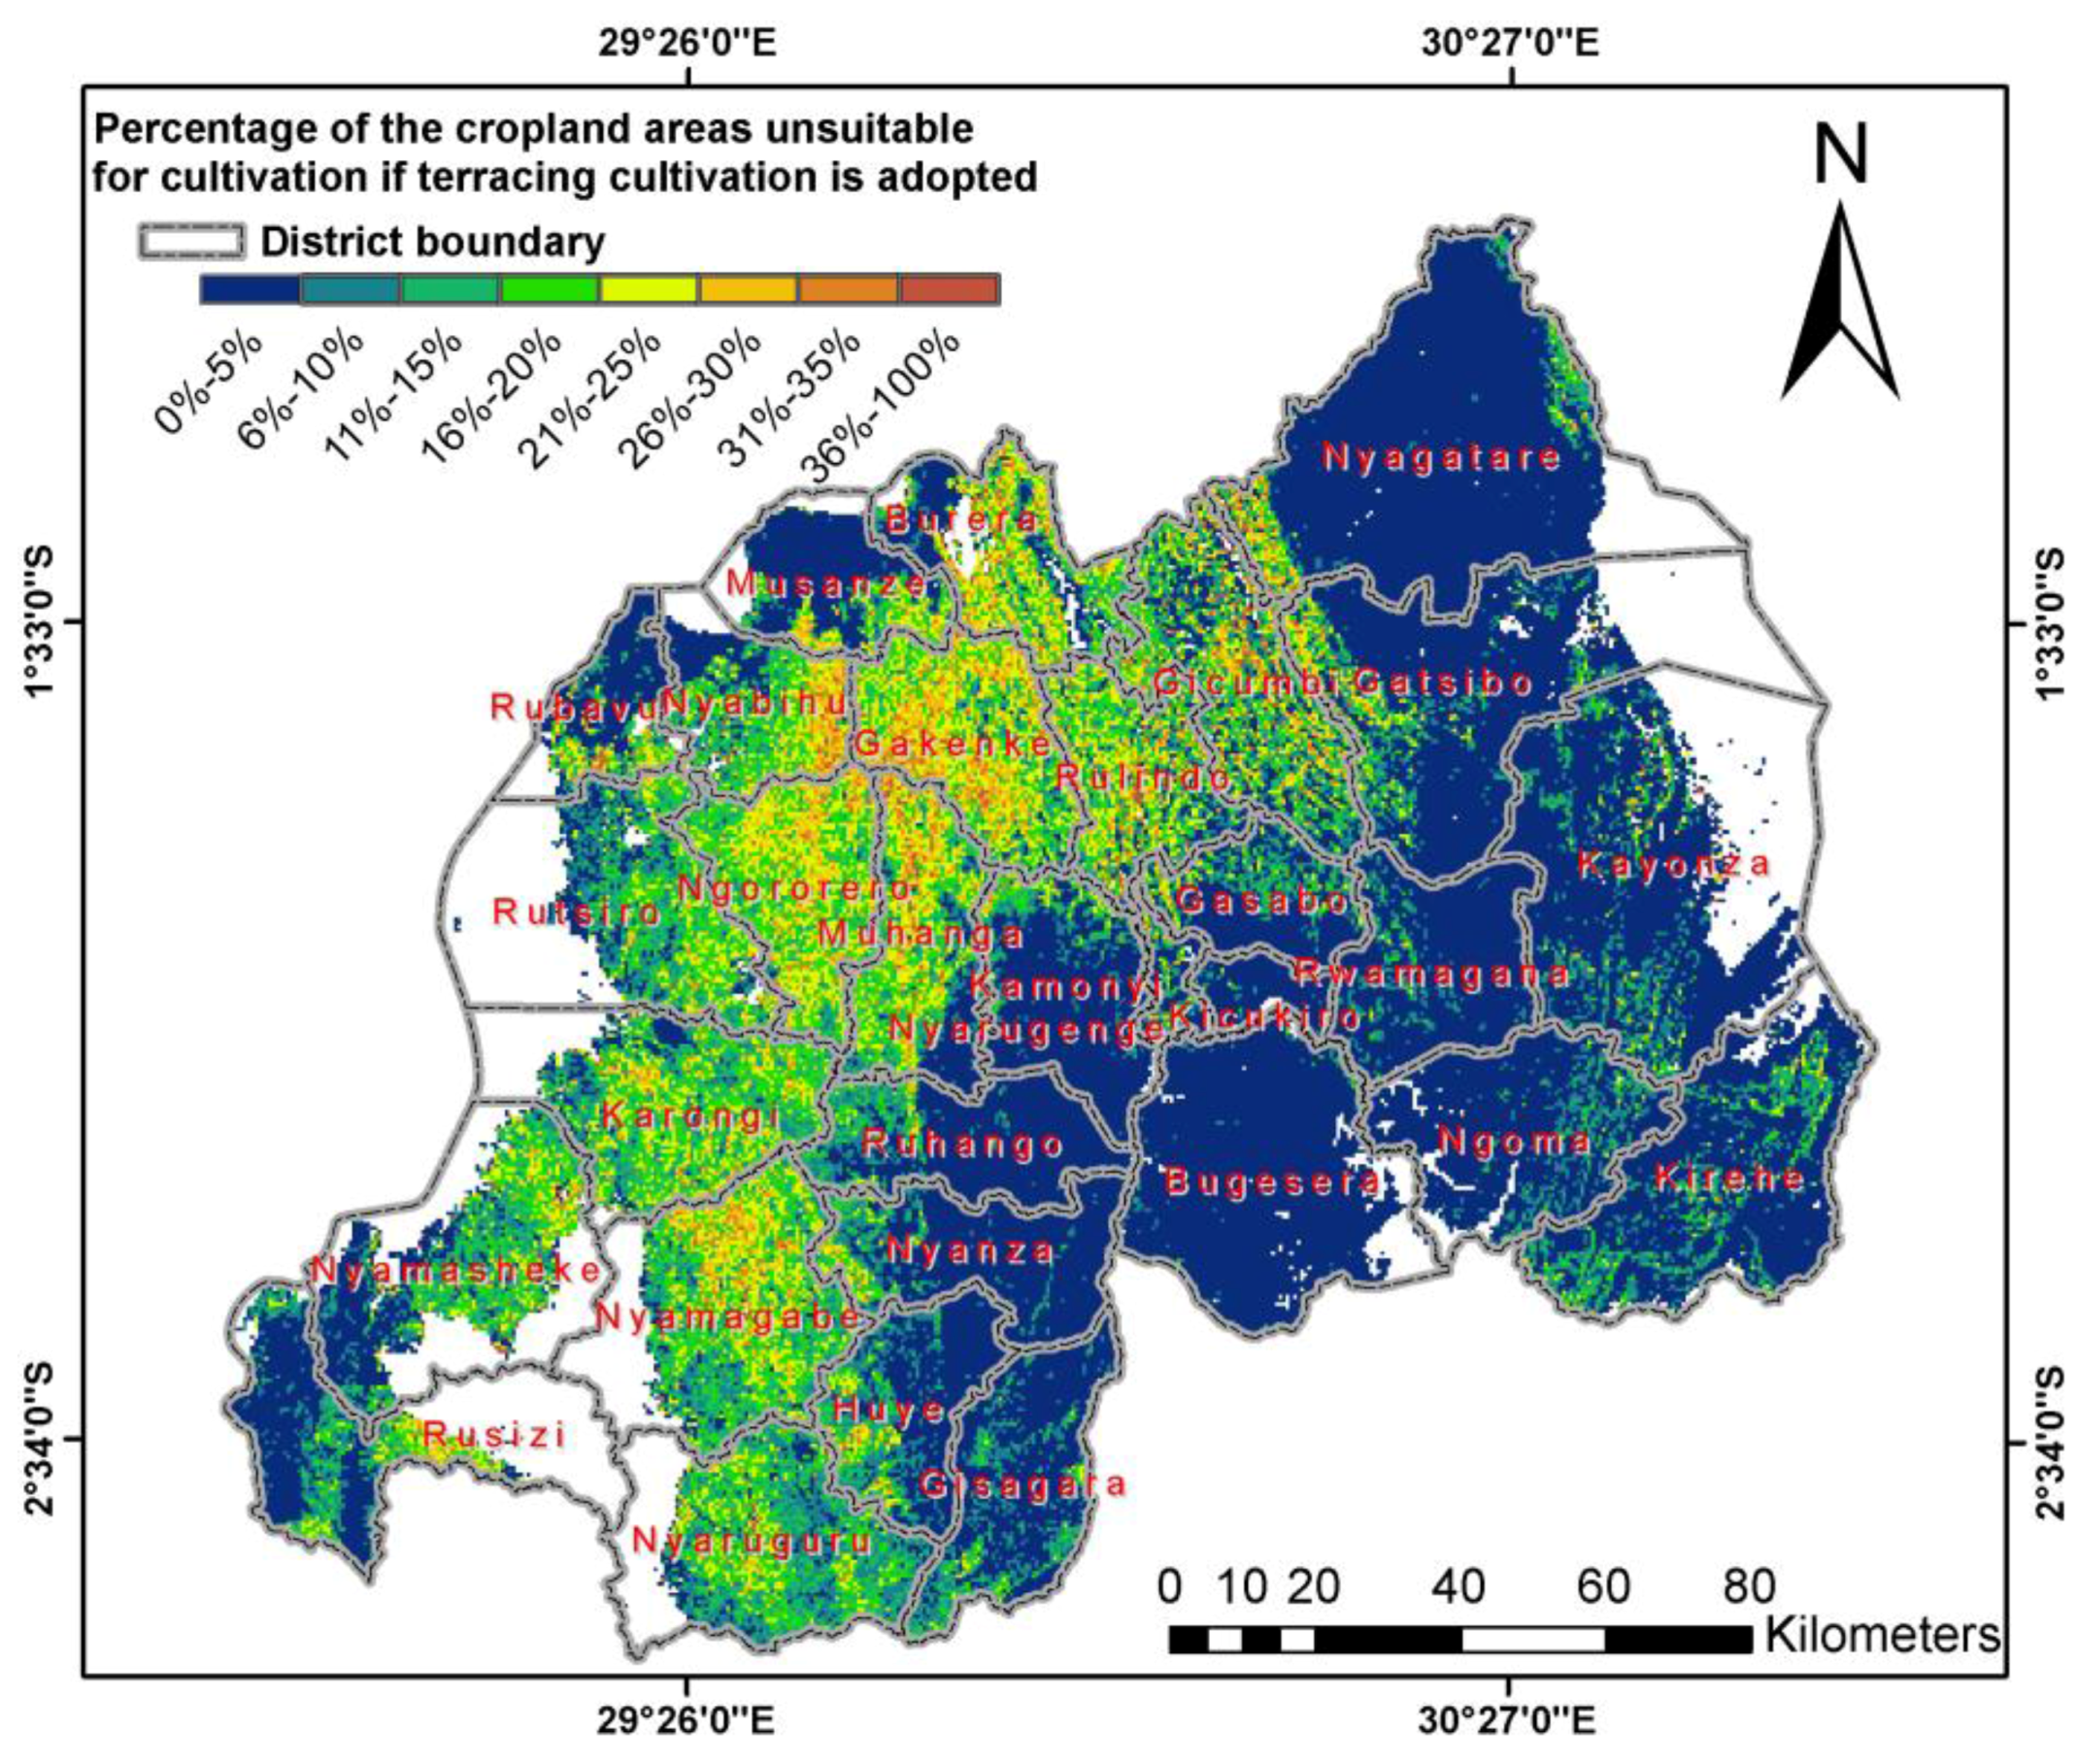
Using the RUSLE model, we re-assessed the soil erosion rate in Rwanda under the terracing practice scenario (Table 2) and found that the mean cropland erosion rate in Rwanda could be reduced by 79%, leading to a drastic decrease of national soil loss by 75%. Furthermore, the terracing could reduce the percentage of cropland area with an extreme erosion rate (i.e., >300 t·ha−1·a−1) from 24% down to 7.6% (Figure 9). The remained unsuitable croplands would only occupy 4% of the national land area, and it will be very viable to return them to forest.
It should be made aware that many of the people cultivating these marginal croplands under extreme soil erosion are from the underprivileged stratum of the society. Directly depriving their land would exacerbate the poverty issues. If economically viable, the government and/or NGOs can buy the lands from these people and return them to tropical rainforest. The old landowners can be hired as forest managers to guarantee a quick reforestation to reduce soil loss as much possible. Otherwise, the government and/or NGO should take the responsibilities to help the farmers to develop soil conservative cultivation practices, such as, for example, applying Vetiver Eco-engineering Technology due to its economical soil erosion control, stabilization of steep slopes [61] and the construction of erosion control dams to absorb and break down excess runoff from unusually intense storms in various parts of the watersheds [62,63,64].
Rwandan farmers are aware of the benefits of bench terraces, in the sense that they are productive, i.e., having a positive effect on production (85.3%), effective for soil erosion control (90.6%) and that they increase soil fertility (56.2%) [65]. Greater costs of conservation than expected benefits on food production, uncertainties of land fragmentation, land tenure and misguided efforts of earlier interventions in soil conservation, however, remain a hindrance to both the maintenance of existing terraces and the creation of new ones [12,66]. Bench terraces require interventions of the government and/or non-government organizations (NGOs), because they are not profitable when market prices are applied [67]. For example, bench terracing investment costs were estimated at RWF 800,000 ha−1 in Rwanda; the net present value (NPV) is negative (loss of RWF47,384); and the internal rate of return (IRR) (11%) is lower than the discount rate of 13%, during a period of 20 years [66]. However, the benefits from soil erosion control are not limited to sustaining cropland productivity, but also include important social/ecological services, such as protecting water quality and preventing flooding. When the aggregated economic costs (in both provisional land services and non-provisional ecosystem services) of soil loss and degradation are taken into account, it usually makes sound economic sense to invest in programs that are effective in the control of widespread erosion. For instance, the total investment for U.S. erosion control was estimated at around $8.4 billion per year. Given that erosion causes about $44 billion in damages each year, it would seem that the investment is a small price to pay: For every $1 invested, $5.24 would be saved. This small investment would reduce U.S. agricultural soil loss by about 4 × 10⁹ tons and help protect their water and soil resources, as well as current and future food supply [68]. Since the social costs of soil erosion (i.e., losses in non-provisional ecosystem services) and offsite externalities could be higher than the costs of applying terracing, it makes sense for public policy to support the application of terracing [67]. If appropriate economic incentives, such as maintaining high relative prices for crop products, high subsidies for fertilizers and the availability of rural credit at affordable rates, the farmers can adopt land management practices and farming systems (i.e., agroforestry, terracing, etc.) that promote considerably soil erosion control [67].
It should be recognized that our modeling results only estimated the soil erosion risk of Rwanda rather than actual soil loss, which is very costly and can only be measured at the plot scale. Previous studies indicated variables, but acceptable accuracy of RUSLE in similar situations [46,47,69,
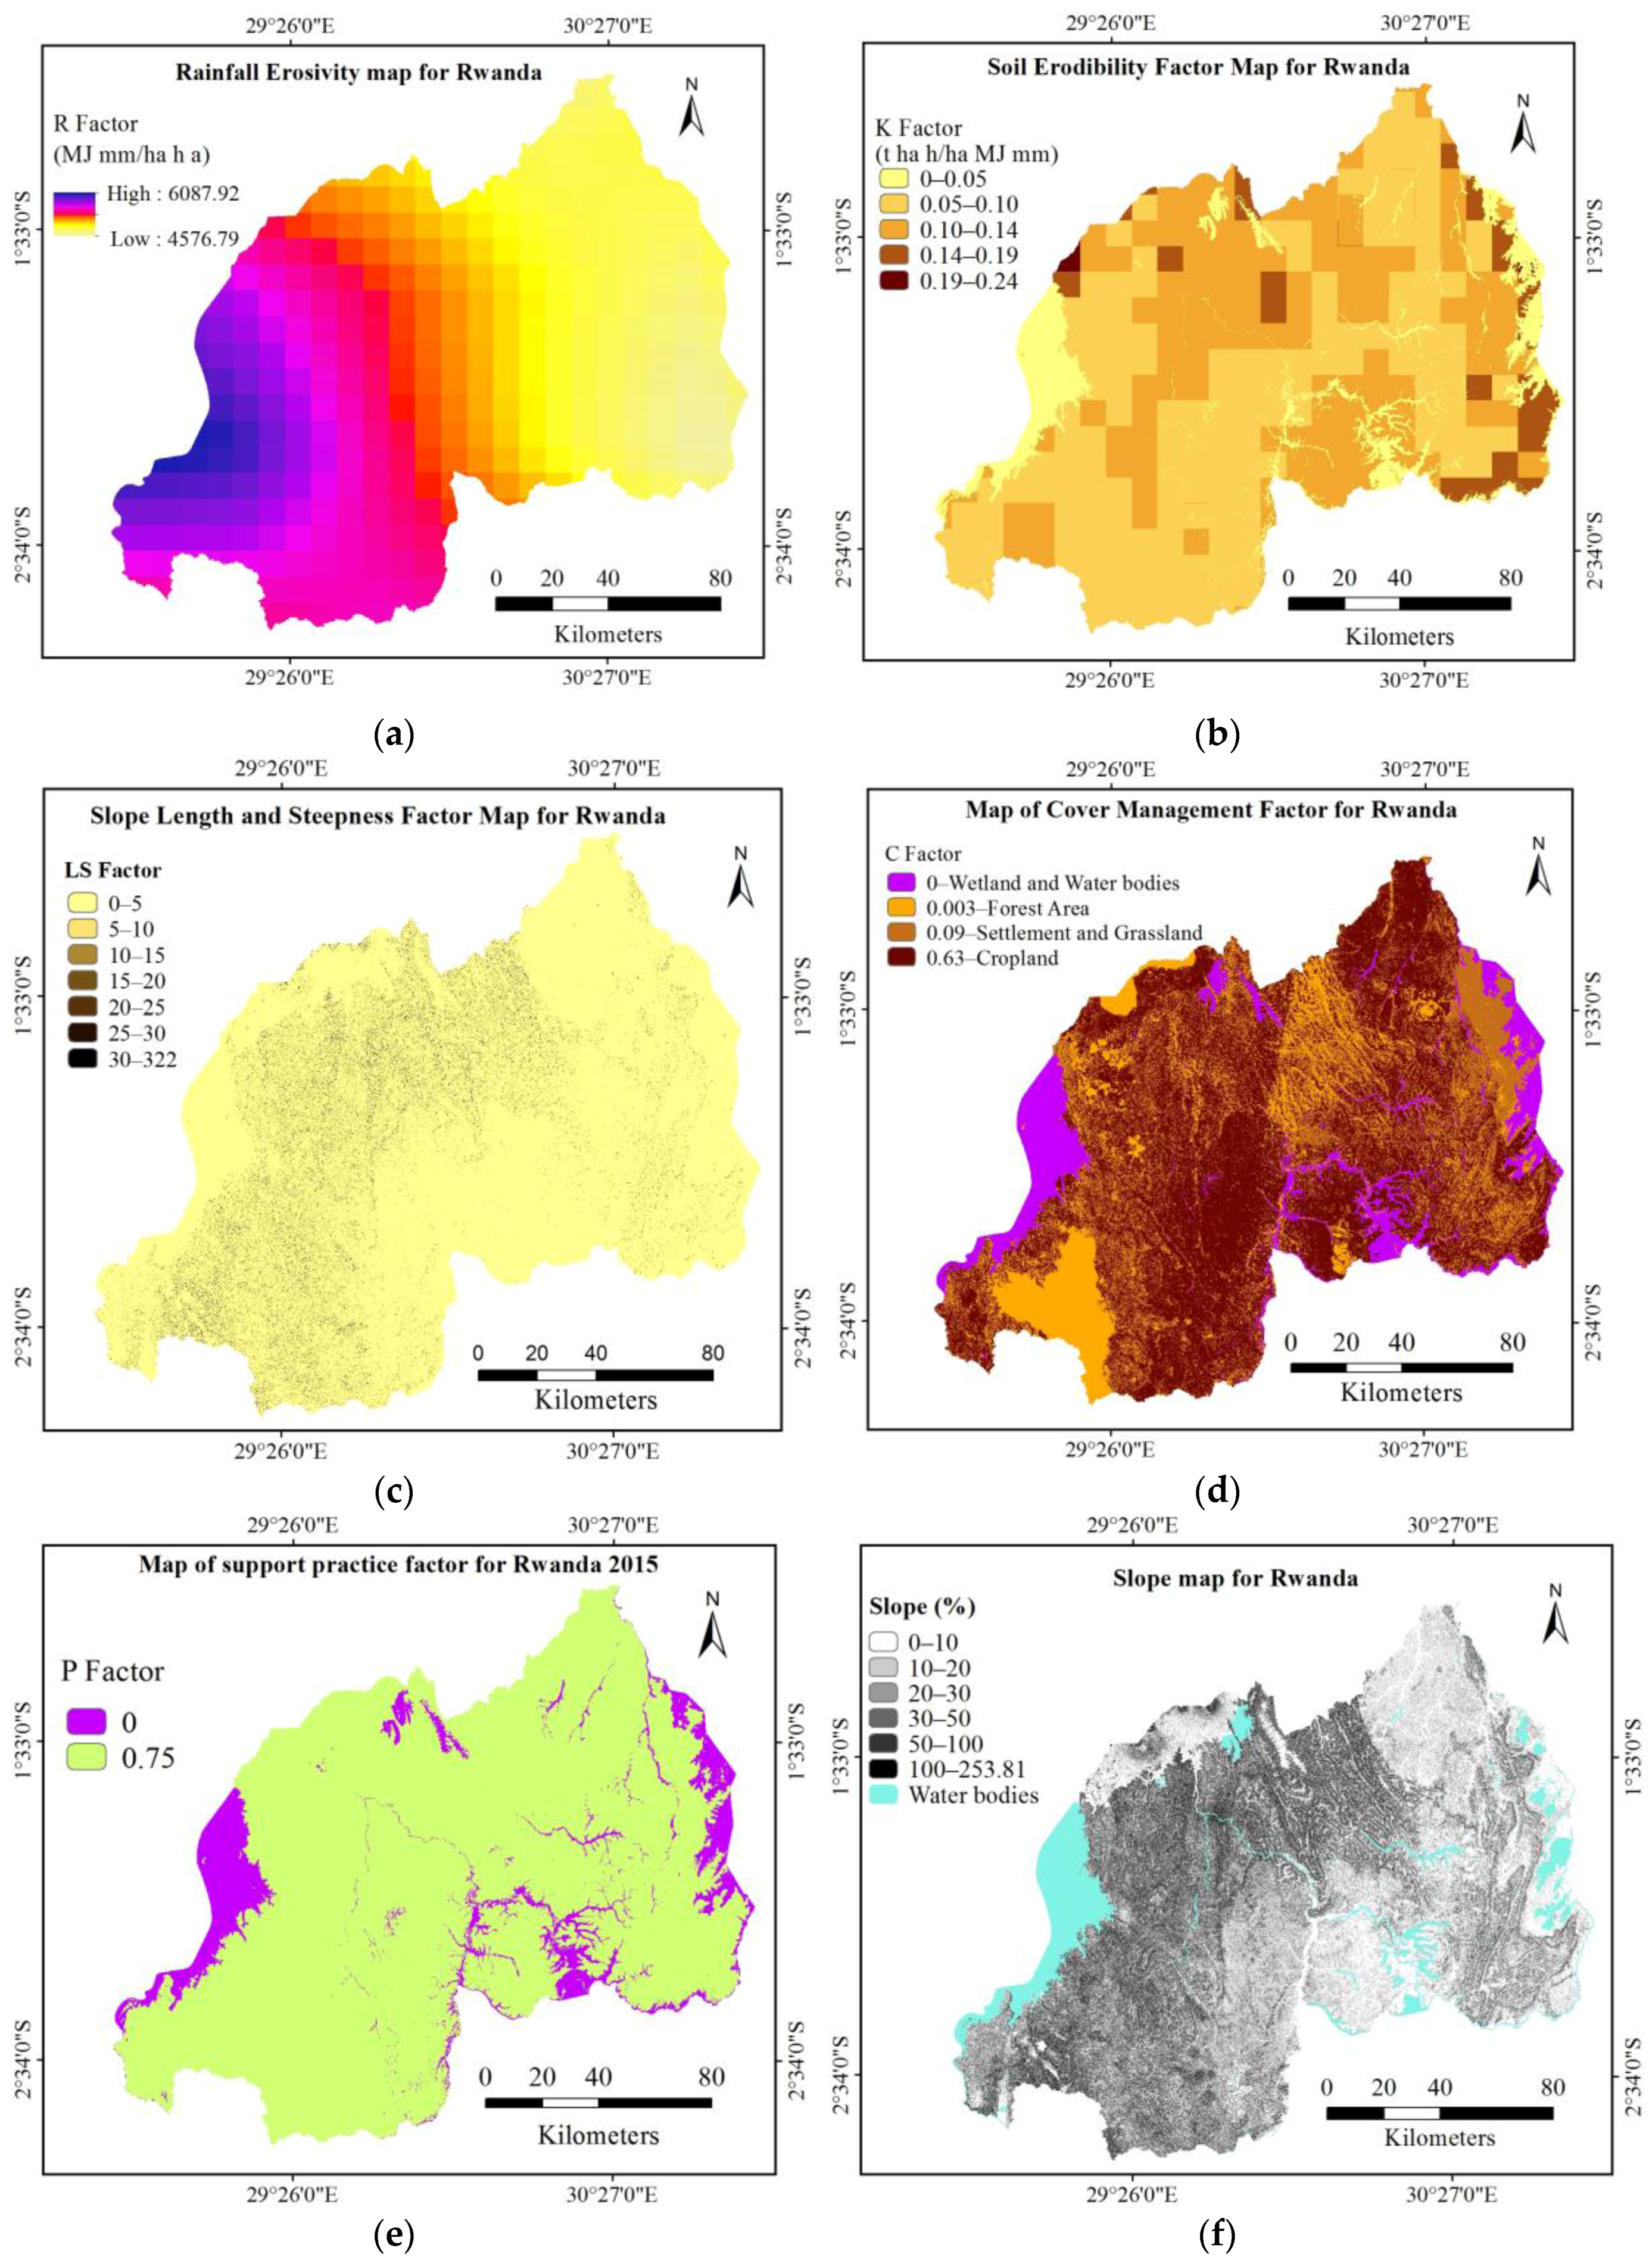
70]. Furthermore, due to the local climate conditions and the deficit in field observations of actual soil erosion rates, it was difficult to optimize the parameters for the RUSLE model. For example, the C factor was usually calculated with Equation (9).
C = exp ( a ( N D V I b N D V I )
Previous studies indicated that seasonal variations of the Normalized Difference Vegetation Index (NDVI) could strongly influence the estimated soil erosion rate [18,71]. However, the heavy cloudiness problem in the tropical rainforests and mountain areas of the country [18,26] made it nearly impossible to retrieve the dynamic of NDVI and land cover change with satellite data for a whole year. Using the NDVI values from the dry season, when the cloudiness problem is less serious, would risk a biased C factor. Moreover, with the lack of field-observed soil erosion data, we were unable to estimate the empirical parameters (a and b) in the above Equation (9) for our study area. Therefore, the present study established the C factor map by attributing the C factor value according to LCLU categories (Figure 2d) following the guide of Kim et al., 2005 [47]. The approach has been approved by a number of similar studies, particularly in locations with limited data availability [41,46].
The outcomes of this work could be useful for projects related to the soil protection strategy of Rwanda, one of the most densely-populated countries of the world. Based on the latest land cover map, we found large areas of lands under severe soil erosion risks in the west mountain ranges (the Congo Ridge and the Volcanic Range), particularly in the Gakenke, Ngororero and Muhanga districts. The soil erosion risk maps developed in this study (Figure 6) are useful for identifying hotspots of soil erosion in the country. Furthermore, our study indicated the terracing could substantially reduce the soil erosion in Rwanda.

5. Conclusions

Rwanda has suffered from extreme soil erosion accelerated by abundant rainfall and agricultural expansion on steep slope terrain. This study showed that the current suitable cropland areas occupy a percentage of 76% of the total cultivated land with a mean soil erosion of 27 t·ha−1·a−1, contributing to the total annual soil loss by 4.87%. The unsuitable cropland was evaluated at 24% of the total area under agriculture with a mean soil erosion of 1642 t·ha−1·a−1, which contributes to an annual soil loss by 95% countrywide. Cropland expansion was found to be the major soil erosion causal agent, where on the total land area of 2,380,460.39 ha, a total of 595 million tons of soil is annually lost in Rwanda, of which 95% is lost from agricultural activities. Twenty six percent of the total cropland located on a slope >30% comprised 63% of the total soil lost from the cropland areas. This expresses how cropland expansions on steeper slopes are the main soil erosion accelerators in Rwanda. This study suggests the terracing cultivation method, which would significantly increase the cropland suitability from 76%–96% and decrease significantly the mean cropland erosion rate from 421 down to 89 t·ha−1·a−1.

Acknowledgments

We want to thank the anonymous reviewers and the Editor whose constructive comments and suggestions have helped improve the quality of this manuscript. This study was supported by the National Natural Scientific Foundation of China (#U1503301 and NSFC-UNEP# 41361140361).

Author Contributions

Chi Zhang designed and supervised this study. Fidele Karamage, Hua Shao and Xia Fang processed the RUSLE parameters and wrote the manuscript. Alphonse Kayiranga, Felix Ndayisaba, Lamek Nahayo and Enan Muhire Nyesheja computed the statistical analysis. Guangjin Tian contributed to the discussion of the uncertainty issues. Then, all authors contributed in the discussions and refined the final version of this manuscript.

Conflicts of Interest

The authors declare no conflict of interest.

Abbreviations

The following abbreviations are used in this manuscript:
ftfoot
hahectare
hhour
MJmegajoule
mmmillimeter
tton [38]
ayear
kmkilometer
RWFRwandan Franc
$U.S. dollar

References

  1. Oldeman, L. The global extent of soil degradation. Soil Resil. Sustain. Land Use 1994, 9, 99–118. [Google Scholar]
  2. Lindquist, E.J.; D’annunzio, R.; Gerrand, A.; Macdicken, K.; Achard, F.; Beuchle, R.; Brink, A.; Eva, H.D.; Mayaux, P.; San-Miguel-Ayanz, J.; et al. Global Forest Land-Use Change 1990–2005; Fao Forestry Paper No. 169; Food and Agriculture Organization of the United Nations and European Commission Joint Research Centre: Rome, Italy, 2012. [Google Scholar]
  3. Van Straaten, P. Rocks for Crops: Agrominerals of Sub-Saharan Africa; ICRAF: Nairobi, Kenya, 2002; Volume 407, p. 338. [Google Scholar]
  4. Grimm, M.; Jones, R.; Montanarella, L. Soil Erosion Risk in Europe. 2001. Available online: http://citeseerx.ist.psu.edu/viewdoc/download?doi=10.1.1.397.2450&rep=rep1&type=pdf (accessed on 27 June 2016).
  5. Tamene, L.; Le, Q.B. Estimating soil erosion in sub-Saharan Africa based on landscape similarity mapping and using the revised universal soil loss equation (RUSLE). Nutr. Cycl. Agroecosyst. 2015, 102, 17–31. [Google Scholar] [CrossRef]
  6. Montgomery, D.R. Soil erosion and agricultural sustainability. Proc. Natl. Acad. Sci. USA 2007, 104, 13268–13272. [Google Scholar] [CrossRef] [PubMed]
  7. Alkharabsheh, M.M.; Alexandridis, T.; Bilas, G.; Misopolinos, N.; Silleos, N. Impact of land cover change on soil erosion hazard in northern Jordan using remote sensing and GIS. Proced. Environ. Sci. 2013, 19, 912–921. [Google Scholar] [CrossRef]
  8. Cebecauer, T.; Hofierka, J. The consequences of land-cover changes on soil erosion distribution in Slovakia. Geomorphology 2008, 98, 187–198. [Google Scholar] [CrossRef]
  9. Szilassi, P.; Jordan, G.; Van Rompaey, A.; Csillag, G. Impacts of historical land use changes on erosion and agricultural soil properties in the Kali Basin at Lake Balaton, Hungary. Catena 2006, 68, 96–108. [Google Scholar] [CrossRef]
  10. Bakker, M.M.; Govers, G.; Kosmas, C.; Vanacker, V.; Van Oost, K.; Rounsevell, M. Soil erosion as a driver of land-use change. Agric. Ecosyst. Environ. 2005, 105, 467–481. [Google Scholar] [CrossRef]
  11. United Nation. World Population Prospects: The 2015 Revision. Population Division. 2015. Available online: http://esa.un.org/unpd/wpp/ (accessed on 25 October 2015).
  12. De la Paix, M.J.; Lanhai, L.; Jiwen, G.; de Dieu, H.J.; Gabriel, H.; Jean, N.; Innocent, B. Radical terraces in Rwanda. East Afr. J. Sci. Technol. 2012, 1, 53–58. [Google Scholar]
  13. Habiyaremye, G.; Jiwen, G.; de la Paix Mupenzi, J.; Balogun, W.O. Demographic pressure impacts on forests in Rwanda. Afr. J. Agric. Res. 2011, 6, 4533–4538. [Google Scholar]
  14. EDPRS. Economic Development and Poverty Reduction Strategy II, 2013–2018: Shaping Our Development. Available online: http://www.minecofin.gov.rw/index.php?id=149 (accessed on 20 October 2015).
  15. Twagiramungu, F. Environmental Profile of Rwanda; Consultancy Report; European Commission: Kigali, Rwanda, 2006; p. 78. [Google Scholar]
  16. UNEP. Rwanda State of Environment and Outlook: Our Environment for Economic Development. Available online: http://www.unep.org/publications/contents/pub_details_search.asp?ID=4089 (accessed on 20 October 2015).
  17. Murekatete, E. Controls of Denitrification in Agricultural Soils, Wetlands, and Fish Ponds in the Migina Catchment, Rwanda; Unesco-IHE: Delft, The Netherlands, 2013. [Google Scholar]
  18. Nachtergaele, F.O.; Petri, M.; Biancalani, R.; van Lynden, G.; van Velthuizen, H.; Bloise, M. GLADIS Global Land Degradation Information System—Beta version: Report and methods information document. September 2011. Available online: http://www.fao.org/nr/lada/index.php?option=com_content&view=article&id=161&Itemid=113&lang=en (accessed on 15 October 2015).
  19. Lewis, L.A.; Clay, D.C.; Dejaegher, Y.M. Soil loss, agriculture, and conservation in Rwanda: Toward sound strategies for soil management. J. Soil Water Conserv. 1988, 43, 418–421. [Google Scholar]
  20. Clay, D.C.; Lewis, L.A. Land use, soil loss, and sustainable agriculture in Rwanda. In Case Studies in Human Ecology; Springer: New York, NY, USA, 1996; pp. 271–287. [Google Scholar]
  21. Claessens, L.; Van Breugel, P.; Notenbaert, A.; Herrero, M.; Van De Steeg, J. Mapping potential soil erosion in East Africa using the Universal Soil Loss Equation and secondary data. IAHS Publ. 2008, 325, 398–407. [Google Scholar]
  22. Oppong, J.R. Rwanda-Juvenile Literatue. I. Title. II. Series; Infobase Publishing: New York, NY, USA, 2009. [Google Scholar]
  23. AFDB. African Statistical Yearbook 2015. Available online: http://www.afdb.org/en/knowledge/publications/african-statistical-yearbook/ (accessed on 18 June 2015).
  24. Meigh, J.; McKenzie, A.; Sene, K. A grid-based approach to water scarcity estimates for eastern and southern Africa. Water Resour. Manag. 1999, 13, 85–115. [Google Scholar] [CrossRef]
  25. USGS, Earth Resources Observation and Science Center (EROS). U.S. Geological Survey global visualization viewer. Available online: http://glovis.usgs.gov/index.shtml (accessed on 20 September 2015).
  26. Basnet, B.; Vodacek, A. Tracking land use/land cover dynamics in cloud prone areas using moderate resolution satellite data: A case study in central Africa. Remote Sens. 2015, 7, 6683–6709. [Google Scholar] [CrossRef]
  27. Otukei, J.R.; Blaschke, T. Land cover change assessment using decision trees, support vector machines and maximum likelihood classification algorithms. Int. J. Appl. Earth Observ. Geoinform. 2010, 12, S27–S31. [Google Scholar] [CrossRef]
  28. Richards, J.; Jia, X. Remote Sensing Digital Image Analysis; Springer: New York, NY, USA, 1999. [Google Scholar]
  29. Thomlinson, J.R.; Bolstad, P.V.; Cohen, W.B. Coordinating methodologies for scaling landcover classifications from site-specific to global: Steps toward validating global map products. Remote Sens. Environ. 1999, 70, 16–28. [Google Scholar] [CrossRef]
  30. Anderson, J.R. A Land Use and Land Cover classIfication System for Use with Remote Sensor Data; US Government Printing Office: Washington, DC, USA, 1976; Volume 964.
  31. Manandhar, R.; Odeh, I.O.; Ancev, T. Improving the accuracy of land use and land cover classification of Landsat data using post-classification enhancement. Remote Sens. 2009, 1, 330–344. [Google Scholar] [CrossRef]
  32. Mather, P.M. Computer Processing of Remotely-Sensed Images, 3rd ed.; Wiley: Chichester, UK, 2004. [Google Scholar]
  33. RCMRD. Land Cover Viewer: Eastern & Southern Africa. Available online: http://apps.rcmrd.org/landcoverviewer/ (accessed on 20 October 2015).
  34. Long, J.B.; Giri, C. Mapping the Philippines’ mangrove forests using Landsat imagery. Sensors 2011, 11, 2972–2981. [Google Scholar] [CrossRef] [PubMed]
  35. Huang, C.; Goward, S.N.; Masek, J.G.; Thomas, N.; Zhu, Z.; Vogelmann, J.E. An automated approach for reconstructing recent forest disturbance history using dense Landsat time series stacks. Remote Sens. Environ. 2010, 114, 183–198. [Google Scholar] [CrossRef]
  36. Congalton, R.G. A review of assessing the accuracy of classifications of remotely sensed data. Remote Sens. Environ. 1991, 37, 35–46. [Google Scholar] [CrossRef]
  37. Bishop, Y.; Fienberg, S.; Holland, P. Discrete Multivariate Analysis: Theory and Practice; Massachusetts Institute of Technology Press: Cambridge, MA, USA, 1975. [Google Scholar]
  38. Renard, K.G.; Foster, G.; Weesies, G.; McCool, D.; Yoder, D. Predicting Soil Erosion by Water: A Guide to Conservation Planning with the Revised Universal Soil Loss Equation (RUSLE); United States Department of Agriculture: Washington, DC, USA, 1997; Volume 703.
  39. Angima, S.; Stott, D.; O’neill, M.; Ong, C.; Weesies, G. Soil erosion prediction using RUSLE for central Kenyan highland conditions. Agric. Ecosyst. Environ. 2003, 97, 295–308. [Google Scholar] [CrossRef]
  40. Lu, D.; Li, G.; Valladares, G.; Batistella, M. Mapping soil erosion risk in Rondonia, Brazilian Amazonia: Using RUSLE, remote sensing and GIS. Land Degrad. Dev. 2004, 15, 499–512. [Google Scholar] [CrossRef] [Green Version]
  41. Nam, P.T.; Yang, D.; Kanae, S.; OKI, T.; Musiake, K. Global soil loss estimate using RUSLE model: The use of global spatial datasets on estimating erosive parameters. Geol. Data Process. 2003, 14, 49–53. [Google Scholar] [CrossRef]
  42. Fathizad, H.; Karimi, H.; Alibakhshi, S.M. The estimation of erosion and sediment by using the RUSLE model and RS and GIS techniques (Case study: Arid and semi-arid regions of Doviraj, Ilam province, Iran). Int. J. Agric. Crop Sci. 2014, 7, 303–314. [Google Scholar]
  43. Yu, B.; Rosewell, C. A robust estimators of the R-reaction for the universal soil loss equation. Trans. ASAE 1996, 39, 559–561. [Google Scholar] [CrossRef]
  44. Renard, K.G.; Freimund, J.R. Using monthly precipitation data to estimate the R-factor in the revised USLE. J. Hydrol. 1994, 157, 287–306. [Google Scholar] [CrossRef]
  45. Wischmeier, W.H.; Smith, D.D. Predicting rainfall erosion losses—A guide to conservation planning. In Predicting Rainfall Erosion Losses—A Guide to Conservation Planning; USDA, Science and Education Administration: Hyattsville, MD, USA, 1978; p. 62. [Google Scholar]
  46. Ganasri, B.; Ramesh, H. Assessment of soil erosion by RUSLE model using remote sensing and GIS—A case study of Nethravathi Basin. Geosci. Front. 2015. [Google Scholar] [CrossRef]
  47. Kim, J.B.; Saunders, P.; Finn, J.T. Rapid Assessment of Soil Erosion in the Rio Lempa Basin, Central America, Using the Universal Soil Loss Equation and Geographic Information Systems. Environ. Manag. 2005, 36, 872–885. [Google Scholar] [CrossRef] [PubMed]
  48. Biswas, S.S.; Pani, P. Estimation of soil erosion using RUSLE and GIS techniques: A case study of Barakar River basin, Jharkhand, India. Model. Earth Syst. Environ. 2015, 1, 1–13. [Google Scholar] [CrossRef]
  49. Shin, G. The Analysis of Soil Erosion Analysis in Watershed Using GIS. Ph.D. Thesis, Department of Civil Engineering, Gang-Won National University, Chuncheon, Korea, 1999. [Google Scholar]
  50. RNRA. Rwanda Natural Resources Authority. National Land Use Planning Portal. Administrative Boundaries. Available online: https://rwandalanduse.rnra.rw/index.php?id=38 (accessed on 15 August 2015).
  51. Nachtergaele, F.O.; Petri, M.; Biancalani, R.; van Lynden, G.; van Velthuizen, H.; Bloise, M. Global Land Degradation Information System (GLADIS). An Information Database for Land Degradation Assessment at Global Level. Available online: http://www.fao.org/nr/lada/gladis/gladis_db/ (accessed on 15 October 2015).
  52. NOAA-ESRL Physical Sciences Division, Boulder, Colorado. Global Precipitation Climatology Centre (GPCC): GPCC Global Precipitation Climatology Centre Monthly Precipitation Dataset from 1901-Present Is Calculated from Global Station Data. Available online: http://www.esrl.noaa.gov/psd/ (accessed on 10 January 2015).
  53. Kagabo, D.; Stroosnijder, L.; Visser, S.; Moore, D. Soil erosion, soil fertility and crop yield on slow-forming terraces in the highlands of Buberuka, Rwanda. Soil Tillage Res. 2013, 128, 23–29. [Google Scholar] [CrossRef]
  54. Carcamo, J.A.; Alwang, J.; Norton, G.W. On-site economic evaluation of soil conservation practices in Honduras. Agric. Econ. 1994, 11, 257–269. [Google Scholar] [CrossRef]
  55. Briggs, D.; Giordano, A.; Cornaert, M.; Peter, D.; Maes, J. Corine Soil Erosion Risk and Important Land Resources in the Southern Regions of the European Community. 1992. Available online: http://www.eea.europa.eu/publications/COR0-soil (accessed on 27 June 2016).
  56. Sylvie, N. An Assessment of Farmers’ willingness to Pay for the Protection of Nyabarongo River System, Rwanda. Master’s Thesis, University of Nairobi, Nairobi, Kenya, November 2012. [Google Scholar]
  57. Lal, R. Soil degradation by erosion. Land Degrad. Dev. 2001, 12, 519–539. [Google Scholar] [CrossRef]
  58. Akıncı, H.; Özalp, A.Y.; Turgut, B. Agricultural land use suitability analysis using GIS and AHP technique. Comput. Electron. Agric. 2013, 97, 71–82. [Google Scholar] [CrossRef]
  59. Bizoza, A.R. Institutions and the adoption of technologies: Bench terraces in Rwanda. In Challenges and Opportunities for Agricultural Intensification of the Humid Highland Systems of Sub-Saharan Africa; Springer International Publishing: Cham, Switzerland, 2014; pp. 335–354. [Google Scholar]
  60. Mupenzi, J.; Jiwen, G.; Habiyaremye, G.; Mkukakayumba, U. Impact of radical terraces on environment: A case of Kaniga sector in Gicumbi District/Rwanda. Int. J. Sustain. Sci. Stud. 2009, 1, 67–72. [Google Scholar]
  61. Ke, C.; Feng, Z.; Wu, X.; Tu, F. Design principles and engineering samples of applying vetiver ecoengineering technology for steep slope and riverbank stabilization. In Proceedings of the 3rd International Conference on Vetiver, Guangzhou, China, 6–9 October 2003; China Agricultural Press: Beijing, China, 2003; pp. 365–374. [Google Scholar]
  62. Kelley, H.W. Keeping the Land Alive: Soil Erosion—Its Causes and Cures; Food & Agriculture Organization: Rome, Italy, 1983. [Google Scholar]
  63. Zhao, G.; Mu, X.; Wen, Z.; Wang, F.; Gao, P. Soil erosion, conservation, and eco-environment changes in the loess plateau of China. Land Degrad. Dev. 2013, 24, 499–510. [Google Scholar] [CrossRef]
  64. Syvitski, J.P.; Vörösmarty, C.J.; Kettner, A.J.; Green, P. Impact of humans on the flux of terrestrial sediment to the global coastal ocean. Science 2005, 308, 376–380. [Google Scholar] [CrossRef] [PubMed]
  65. Bizoza, A.R.; Havugimana, J.M. Land use consolidation in Rwanda: A case study of Nyanza district, Southern province. Int. J. Sustain. Land Use Urban Plan. (IJSLUP) 2013, 1, 64–75. [Google Scholar]
  66. Bizoza, A.; De Graaff, J. Financial cost–benefit analysis of bench terraces in Rwanda. Land Degrad. Dev. 2012, 23, 103–115. [Google Scholar] [CrossRef]
  67. Barbier, E.B. The farm-level economics of soil conservation: The uplands of Java. Land Econ. 1990, 66, 199–211. [Google Scholar] [CrossRef]
  68. Pimentel, D.; Harvey, C.; Resosudarmo, P.; Sinclair, K. Environmental and economic costs of soil erosion and conservation benefits. Science 1995, 267, 1117. [Google Scholar] [CrossRef] [PubMed]
  69. Terranova, O.; Antronico, L.; Coscarelli, R.; Iaquinta, P. Soil erosion risk scenarios in the Mediterranean environment using RUSLE and GIS: An application model for Calabria (southern Italy). Geomorphology 2009, 112, 228–245. [Google Scholar] [CrossRef]
  70. Farhan, Y.; Nawaiseh, S. Spatial assessment of soil erosion risk using RUSLE and GIS techniques. Environ. Earth Sci. 2015, 74, 4649–4669. [Google Scholar] [CrossRef]
  71. Alexandridis, T.K.; Sotiropoulou, A.M.; Bilas, G.; Karapetsas, N.; Silleos, N.G. The effects of seasonality in estimating the c-factor of soil erosion studies. Land Degrad. Dev. 2015, 26, 596–603. [Google Scholar] [CrossRef]
Figure 1. A shaded relief map shows the elevation of Rwanda, its location, district administrative subdivisions and points out the major terrain features with arrows.
Sustainability 08 00609 g001
Figure 2. Spatial distributions of different controlling factors on the soil erosion in Rwanda, according to the RUSLE model (ae) and the slope map for the country (f).
Sustainability 08 00609 g002
Figure 3. The LCLU map for Rwanda based on Landsat-8 images in 2015.
Sustainability 08 00609 g003
Figure 4. The fractional land coverage (%) of different LCLU types (inner circle) and their relative contributions to the national soil loss in Rwanda (outer circle). The soil erosion rate of the wetland was zero and is not shown in the chart.
Sustainability 08 00609 g004
Figure 5. The soil erosion map of Rwanda based on the LCLU map of 2015.
Sustainability 08 00609 g005
Figure 6. The percentage of the land area that is unsuitable for cropland cultivation in Rwanda (a) and the percentage of current cropland that caused extreme soil erosion (>300 t·ha−1·a−1) (b).
Sustainability 08 00609 g006aSustainability 08 00609 g006b
Figure 7. Impacts of slopes on the cropland erosion in Rwanda.
Sustainability 08 00609 g007
Figure 8. Dynamics of land use and land cover in Rwanda from 1990–2015.
Sustainability 08 00609 g008
Figure 9. The percentage of unsuitable cropland areas that should be returned to forest if terracing cultivation is adopted in Rwanda.
Sustainability 08 00609 g009
Table 1. Landsat 8 Operational Land Imager (OLI) and Thermal Infrared Sensor (TIRS), Level 1 orthorectified products (L1T) used for the establishment of the LCLU map for Rwanda 2015.
PathRowAcquisition DateCloud Cover
1736120 August 20157%
1736220 August 20152%
1726112 July 20150%
1726212 July 20150%
Table 2. Conservation support practice (P) factor values for terracing.
Slope (%)0–77–11.311.3–17.617.6–26.8>26.8
P factor0.10.120.160.180.2
Table 3. Datasets used to generate RUSLE parameters.
Data TypeDescription and Source
R and K factorsGlobal rasters in TIF format from the Global Land Degradation Information System (GLADIS) database of the Food Agriculture Organization (FAO) [51].
LS FactorDerived from the Advanced Spaceborne Thermal Emission and Reflection Radiometer (ASTER) Global Digital Elevation Model (GDEM) Version 2 (30-m resolution) from the USGS Global Visualization Viewer (GloVis) [25].
C FactorObtained by assigning the C factor values recommended by Kim et al., 2005 [47], to the LCLU map 2015 of Rwanda (Figure 3).
P FactorAccording to the study of Nachtergaele et al., 2011 [18], the value was set to 0 for wetland and 0.75 for all other land types.
Table 4. Producer and user accuracy from the error matrix of the LCLU map of Rwanda in 2015.
ClassesProducer’s AccuracyOmission ErrorUser’s AccuracyCommission Error
Settlement100%0%95%5%
Cropland87%13%98%2%
Forestland92%8%90%10%
Grassland96%4%86%14%
Wetland95%5%98%2%
Water100%0%100%0%
Table 5. The area, mean soil erosion rate, mean cropland soil erosion rate, annual soil loss, relative contribution to the national soil erosion and cropland coverage of the 30 administrative districts in Rwanda, in descending order according to their mean soil erosion rate. The top 11 districts in cropland soil erosion rates are: Gakenke, Ngororero, Muhanga, Rulindo, Karongi, Burera, Nyabihu, Nyamagabe, Rutsiro, Nyaruguru and Gicumbi.
DistrictsArea (103 ha)Soil Erosion Rate (t·ha−1·a−1)Annual Soil Loss (Million t)Contribution to National Soil ErosionCropland Erosion Rate (t·ha−1·a−1)Cropland CoverageFraction of Unsuitable Cropland
Gakenke70678488.0%99965%6.5%
Ngororero68610416.9%87167%6.1%
Muhanga64533345.8%72072%6.0%
Rulindo57500284.8%93352%2.7%
Karongi79417335.5%67958%5.3%
Burera59413244.1%74054%2.9%
Nyabihu54400213.6%70055%2.1%
Nyamagabe109370406.8%74847%7.6%
Rutsiro66310203.5%54255%4.2%
Huye58307183.0%35783%5.5%
Nyaruguru101300305.1%55751%7.8%
Gicumbi83267223.7%68736%1.8%
Musanze51244122.1%40359%1.6%
Ruhango63240152.5%26390%4.6%
Nyanza67210142.4%25481%3.8%
Gisagara68205142.3%28371%2.8%
Nyamasheke94203193.2%50638%3%
Kamonyi66202132.2%24381%3.3%
Rubavu3417661.0%33548%0.8%
Kirehe115175203.4%30353%4%
Gasabo4317271.2%32950%0.7%
Rusizi91152142.3%37739%1.9%
Nyarugenge1314020.3%38034%0.2%
Rwamagana6513891.5%20265%1.5%
Ngoma81135111.8%21858%1.6%
Gatsibo155134213.5%26944%3%
Nyagatare191126244.1%17568%3.3%
Bugesera121105132.1%15865%3.3%
Kicukiro1710020.3%18850%0.3%
Kayonza17894172.8%22233%1.8%
Rwanda2380250595100.0%42156%24.4%

