Article

Resource Usage Strategies and Trade-Offs between Cropland Demand, Fossil Fuel Consumption, and Greenhouse Gas Emissions—Building Insulation as an Example

1
Leibniz Institute for Agricultural Engineering Potsdam–Bornim, Max–Eyth–Allee 100, 14469 Potsdam, Germany
2
Faculty of Life Sciences, Humboldt–Universität zu Berlin, Invalidenstr. 42, 10115 Berlin, Germany
*
Author to whom correspondence should be addressed.
Sustainability 2016, 8(7), 613; https://doi.org/10.3390/su8070613
Submission received: 30 May 2016 / Revised: 24 June 2016 / Accepted: 27 June 2016 / Published: 29 June 2016
(This article belongs to the Section Environmental Sustainability and Applications)

Abstract

:
Bioresources are used in different production systems as materials as well as energy carriers. The same is true for fossil fuel resources. This study explored whether preferential resource usages exist, using a building insulation system as an example, with regard to the following sustainability criteria: climate impact, land, and fossil fuel demand. We considered the complete life cycle in a life cycle assessment-based approach. The criteria were compared for two strategies: one used natural fibers as material and generated production energies from fossil fuels; the other generated production energies from bioenergy carriers and transformed fossil resources into the insulation material. Both strategies finally yielded the same insulation effect. Hence, the energy demand for heating the building was ignored. None of the strategies operated best in all three criteria: While cropland demand was lower in the bioenergy than in the biomaterial system, its fossil fuel demand was higher. Net contribution to climate change was in the same range for both strategies if we considered no indirect changes in land use. Provided that effective recycling concepts for fossil-derived insulations are in place, using bioresources for energy generation was identified as a promising way to mitigate climate change along with efficient resource use.

1. Introduction

1.1. Need for Resource Usage Strategies

Bioresources are increasingly substituted for limited fossil resources, such as crude oil or natural gas, for energy generation as well as for the provision of industrial raw materials such as plastics [1] or industrial fiber [2]. One of the main drivers for this substitution—besides limited availability and the resulting need for sustainable depletion—is the climate impact of their use. However, fossil resources are still essential as raw materials in the chemical industry, even though globally only 10% of them are used as such [3]. To meet growing bioresource demand, cropland is required which is also a limited resource [4]. Land under crop cultivation was explicitly termed a planetary boundary that needs careful management [5]. Therefore, the trade-offs of different usage strategies for these limited resources should be carefully assessed [6].

1.2. Material Alternatives for Building Insulations

In general, insulation materials can be derived from several sources: from renewable bioresources (such as plant fibers grown on cropland), from inorganic resources (like mineral fibers produced from rocks), as well as from fossil resources (like synthetic materials, for example polystyrene). Mineral and synthetic insulation products dominate the insulation market [7] (e.g., 96% in Germany), with expanded polystyrene (EPS) being the second-most common (32%) after mineral rock wool (51%). Materials from bioresources represent 4%, of which approx. 10% are from hemp (Cannabis sativa L.) and flax (Linum usitatissimum L.) [8].

1.3. Assessments of the Environmental Impacts of Building Insulations

System analysis often uses Life Cycle Assessment (LCA) based approaches to analyze different environmental impacts and to address environmental sustainability issues. For adding an insulation to a building, Erlandsson et al. [9] used such an approach: They found that the additional environmental effects from insulation production and installation, for example GHG emissions, were more than balanced by the emission savings achieved by the insulation throughout its entire service life. Subsequent comparative studies between insulation materials confirmed that the differences between them, stemming from their production processes, were of minor significance due to the overwhelming impact of the life cycle stage “use in building” [10]. The latter created energy savings of about 100 times the energy used for production and disposal [10]. Accordingly, insulating buildings is an appropriate way to mitigate climate change. However, we believe that it should be assessed which insulation material generates as low environmental impacts as possible if limitations regarding available land and fossil resources are considered.
Since 2008, environmental product declarations, for instance from BBSR [11], provide values for environmental impact categories that are common in LCA: for example climate change, acidification, or ozone depletion. They also include the total energy demand (fossil/renewable); end-of-life credits are sometimes accounted for as well. Usually, the resource demand for land is not included as a separate impact category. Impacts are typically expressed “per mass” or “per volume” of the respective insulation material. However, several authors have stressed that comparisons between different bioresource products should use the necessary cultivation area as a comparison basis instead of a mass-based one (for example for bio-based polymers [12], or biofuels [13,14]). If fossil-based products are to be compared with bio-based ones, or in complex product/service systems, other functional units can be more appropriate [15]. Nevertheless, land use needs to be considered in the evaluation.

1.4. Objectives

Our main objective is to analyze usage strategies for the limited bioresource cropland and its derived products and the limited resource fossil fuels, as well as the trade-offs. As a result, we will attempt to identify the most beneficial combination of the resource use with regard to GHG mitigation. To achieve this, we assessed two alternative strategies with an LCA-based approach:
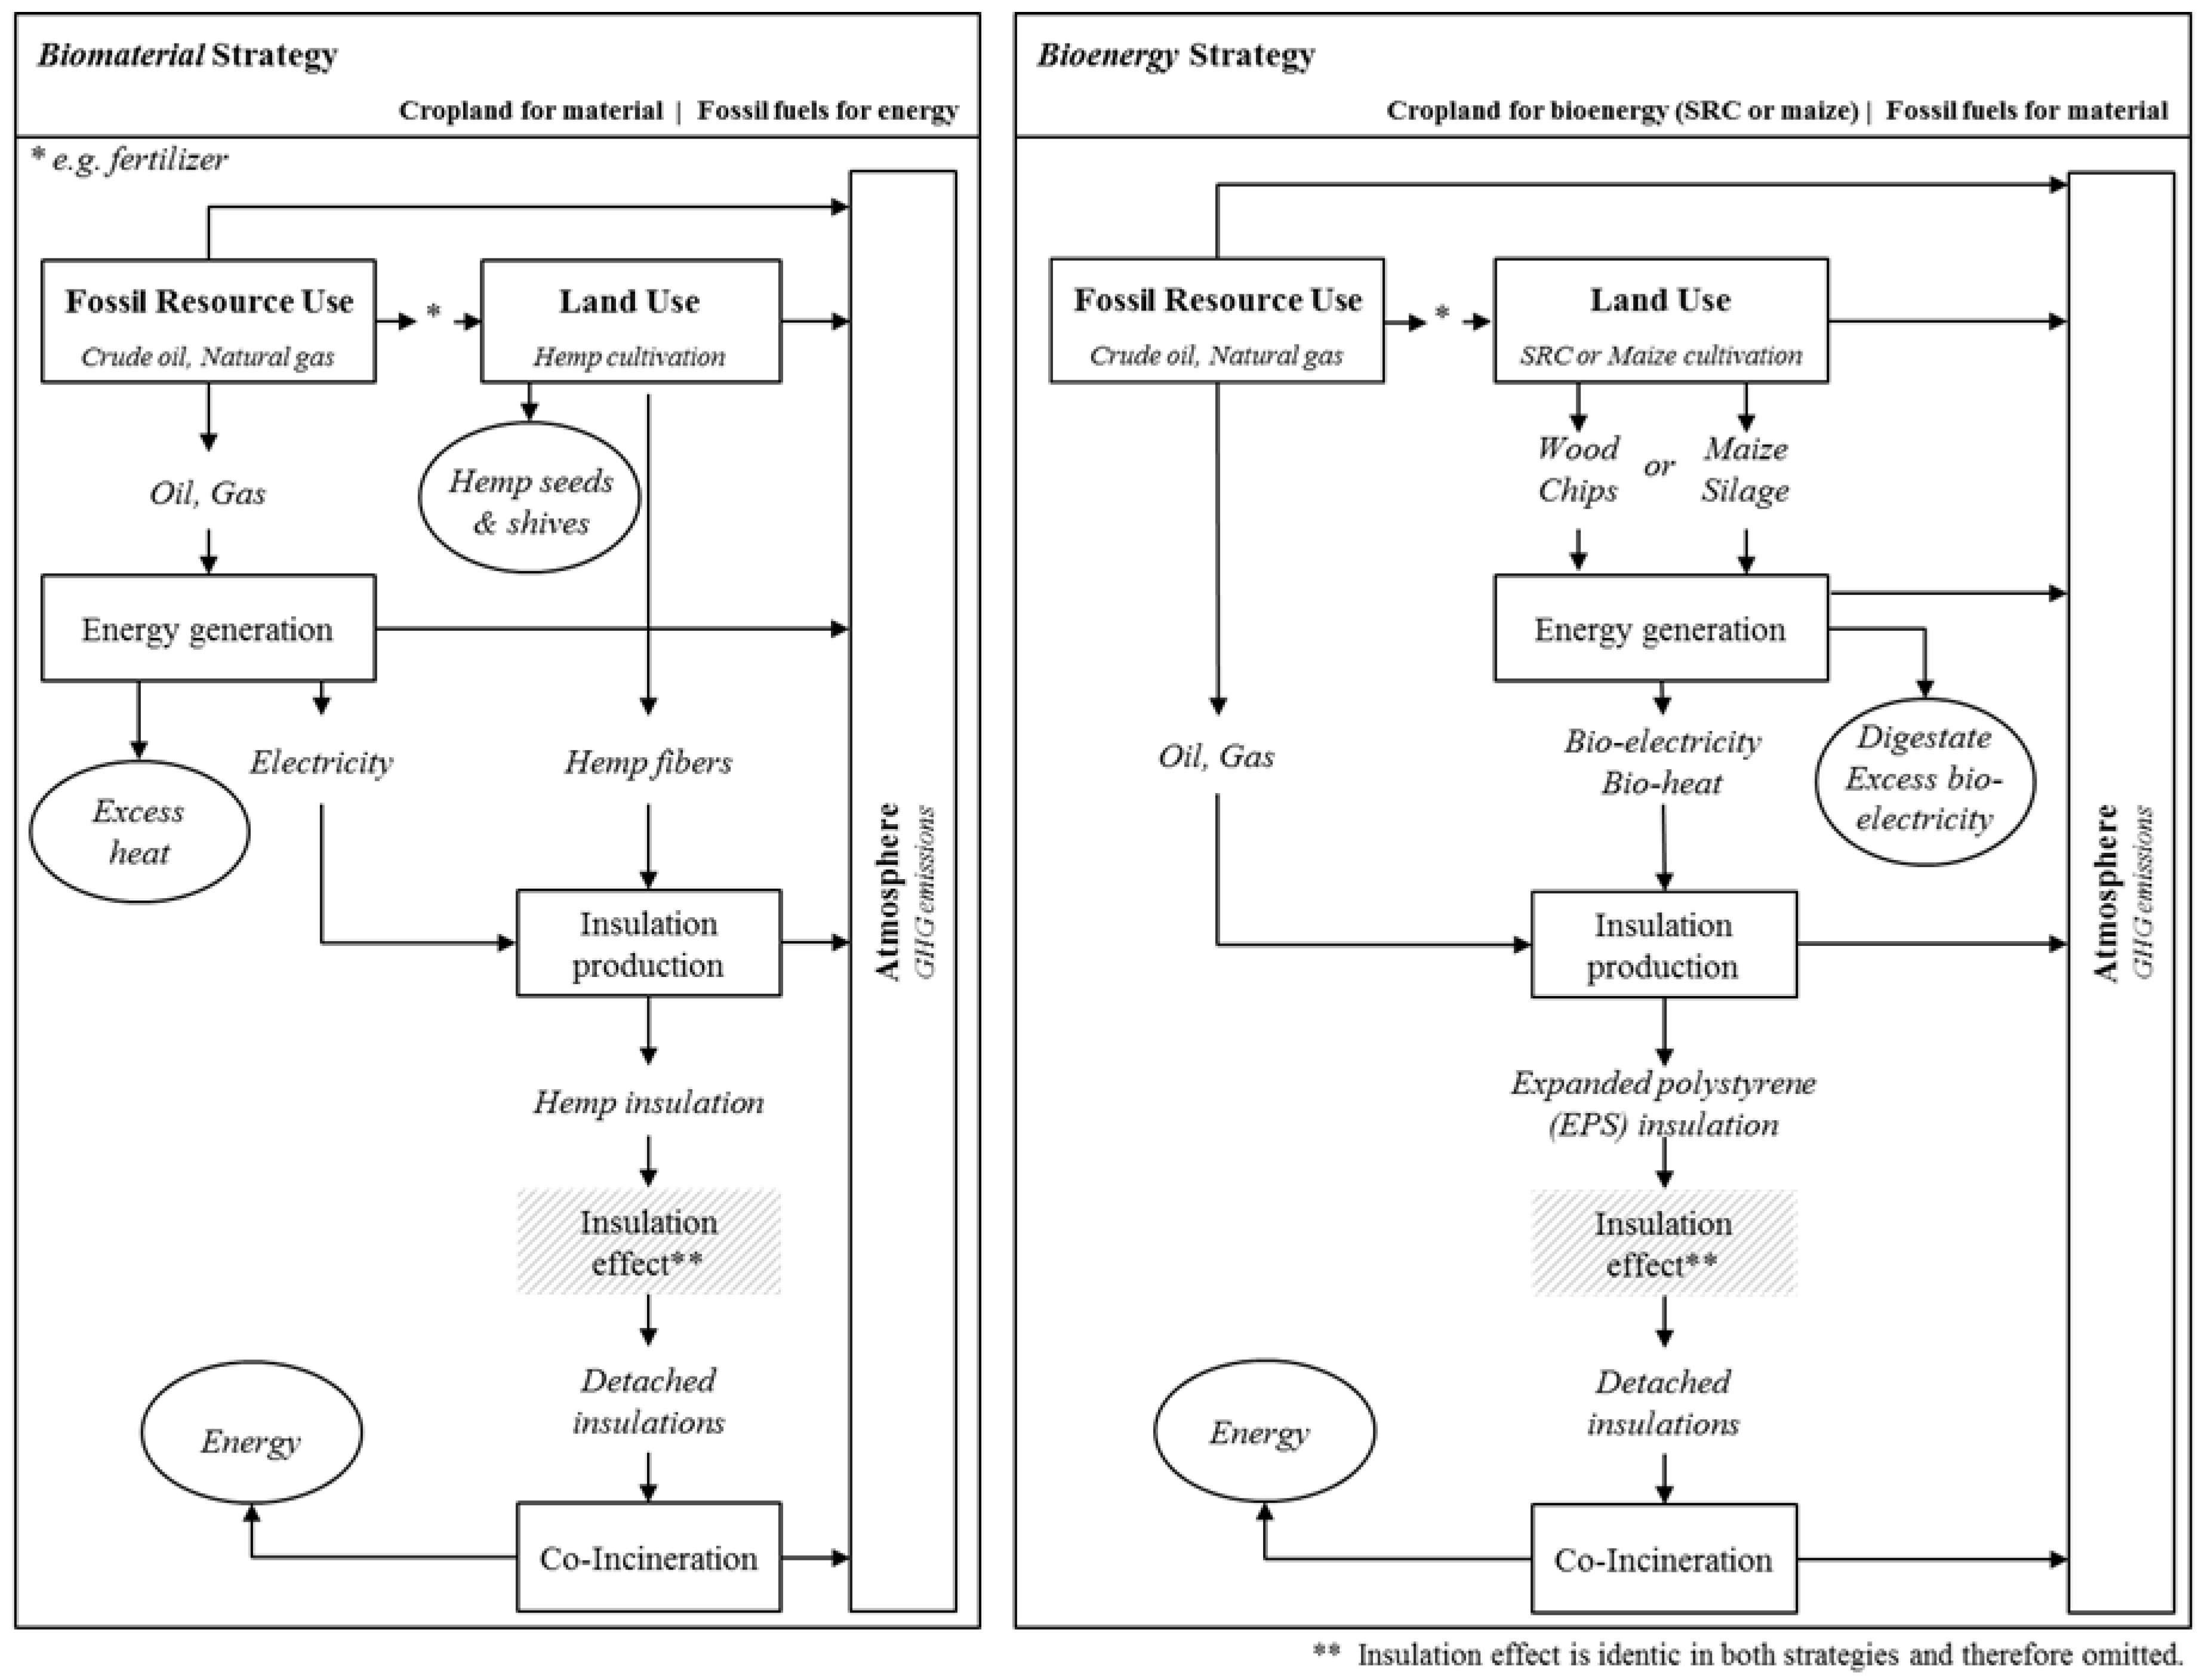
  • Biomaterial strategy: Cropland is used to grow fiber plants as bioresources, which are further processed to an insulation material with fossil energy derived from crude oil and natural gas; or
  • Bioenergy strategy: Cropland is used to grow energy crops (short rotation coppice or maize (Zea mays L.) as bioresources and the bioenergy is then used for the production of fossil fuel-based synthetic insulation materials.

2. Materials and Methods

2.1. Methodological Approach: Life Cycle Assessment

2.1.1. General Method

LCA is a method to describe the environmental impacts of products or services, taking their whole life cycle into account. The impacts are expressed for an equivalent functional unit (FU) so that systems perform equally. Methodological LCA standards exist [16,17]. Social and economic sustainability are not yet fully implemented in the methodology (social Life Cycle Assessment, SLCA; Life Cycle Costing, LCC) [18,19]. One important methodological choice is how to deal with the multi-functionality of systems. This analysis followed a substitution approach to account for co-product generation of the two resource usage strategies (Scheme 1). This can be regarded as a variant of system expansion [20] (pp. 77–79). No explicit economic models were used to investigate market effects in the two bioresource strategies, but we contacted experts for their opinion on the substitution options. The limitations of this approach, such as an inherent uncertainty of effects of changes and a risk of unfair results, were discussed in Ekvall et al. [21], and with a focus on bio-based materials in Pawelzik et al. [22].

2.1.2. System Boundaries

Two complex systems were modeled to represent the two resource usage and mitigation strategies using building insulation (Scheme 2). They included the complete life cycle of building insulation from raw material extraction through insulation production to their end of life. The time at the building (“usage phase”) was excluded from this analysis due to the following reasons: (i) The construction characteristics of the insulation materials are the same; (ii) the period during which they are attached to a building can be assumed to be 40 to 50 years for both [23]. During this period, they provided the same insulation effect, which can be represented by specific heat transfer coefficients (see also definition of functional unit in Section 2.1.3). We assumed that detached insulation materials at their end of life would be co-incinerated instead of re-used, as re-use has not yet been widely adopted due to time-consuming, costly processes.
For our biomaterial strategy, we chose to represent it with a system that used the bioresource fiber hemp (Cannabis sativa L.) as a material for the insulation. Hemp-based materials for building applications have increasingly raised interest, as suggested by a growing number of publications [24]. Oil- and gas-fired co-generation plants provided the fossil energy. This choice of energy technology made it comparable: It arose from the type of fossil fuel resources, which were processed for the synthetic insulation in the alternative system. Hemp seeds, shives, and excess heat arose as co-products.
In our bioenergy strategy, the synthetic insulation material EPS was produced from the fossil resources crude oil and natural gas. The cropland provided bioenergy feedstock as bioresources: either wood chips from poplar (Populus spp.) in short-rotation coppice (SRC), which could be gasified (bioenergy option SRC), or silage from maize (Zea mays L.), which could be digested to biogas (bioenergy option maize). These bioenergy technologies represent two common pathways [25] (p. 5). Excess electricity and—if maize silage is used as feedstock—biogas digestate arose as co-products in the bioenergy strategy.

2.1.3. Functional Unit

We defined the FU as one square meter of insulation material (A = 1 m2) with the specific heat transfer coefficient U = 0.2 W·m−2·K−1 [26]. We assumed that the insulation materials are installed on an existing building wall and covered by plaster. Accordingly, inner and outer thermal resistances are equal for both materials. As a consequence, using the Equation (1):
L = λ/U
where L is the insulation layer thickness (m) and λ is the material-specific thermal conductivity (W·m−1·K−1), and also using the Equation (2):
m = ρ × L × A
where ρ is the raw density (kg·m−3), the necessary mass m (kg) of each square meter of functionally equivalent insulation material was derived. This approach is equivalent to the one used by Schmidt et al. [27]. This FU choice allows us to cope with the multi-functionality of the systems and allows us to compare bio- and fossil-based products. By relating the systems to the same output, the criteria become comparable for the two resource usage strategies.

2.1.4. Criteria for Assessment

For the FU, we calculated the environmental impacts of both strategies over the complete life cycles of the insulations. We used the two resource-use criteria cropland and fossil fuel demand, which are life cycle inventory indicators, and the emission-based criterion GHG emissions, which is a life cycle impact assessment indicator. We did not further weight or aggregate the three criteria, like how it is done in multi-criteria approaches, such as for example [28]. Instead, we treated them as equally important.
We calculated the direct cropland demand to grow the biomass as well as the cropland required within background processes as m2·FU−1. The data was taken from ecoinvent and others (see Table 1, Table 2, Table 3 and Table 4) from the land use category “arable land” (CORINE definition level 21, [29]).
We aggregated the fossil fuel demand to MJ per FU for both strategies using lower heating values (crude oil: 43.2 MJ·kg−1, natural gas: 47.3 MJ·kg−1) [30,31]. We took the data for crude oil and natural gas demands from life cycle inventories in the respective datasets (Table 1, Table 2, Table 3 and Table 4). This choice of fossil fuels resources came from the composition of the fossil-based insulation (see Section 2.3.1).
Finally, we aggregated GHG emissions contributing to climate change, such as carbon dioxide (CO2), methane and nitrous oxide, to CO2 equivalents per FU (kg CO2e·FU−1). We used characterization factors for a time horizon of 100 years from IPCC (CO2: 1, methane: 25, nitrous oxide: 298) [32].

2.2. Biomaterial Strategy

2.2.1. European Hemp Market Conditions

Hemp (Cannabis sativa L.) has been used in Europe as an industrial crop for many years. The majority was cultivated in France in stable amounts (EU–27: 10,600 ha in 2010) [33,34]. For the time being, no large-scale structural effects on the hemp market were expected, which is a postulate for using the substitution approach for co-product accounting in LCA: Enough production capacities for hemp processing exist to meet a growing demand [33]. Furthermore, markets already exist for the co-products hemp seed as birdfeed and shives as animal bedding, as well as the respective alternative products in these sectors.

2.2.2. Hemp Cultivation and Processing to Insulation

In the biomaterial strategy, we considered the supply chain from the cultivation of hemp, to the provision of fossil fuels, to transport processes up to the provision of heat and electricity, and finally to the end-of-life stage. We took the data for fiber hemp cultivation representing European conditions from [35], and others (Table 1).
After harvesting, the hemp bales were processed to long fibers and co-products. The long fibers were finally bonded to insulation mats, consisting of a mixture of hemp (83%) and polyester fibers (12%), and were impregnated with sodium hydroxide (5%) as a flame retardant [36]. We assumed that the necessary electricity for insulation processing was generated from fossil fuels in an oil-fired and a gas-fired cogeneration plant. We used product-specific data for a hemp mat, for which a CO2 balance study was available [36].
Following Equations (1) and (2), 1 m2 of the insulation material hemp mat with U = 0.2 W·m−2·K−1 and a thermal conductivity λ = 0.04 W·m−1·K−1 weighed 6 kg and had a layer thickness of L = 0.20 m.

2.2.3. Land Use Change Effects
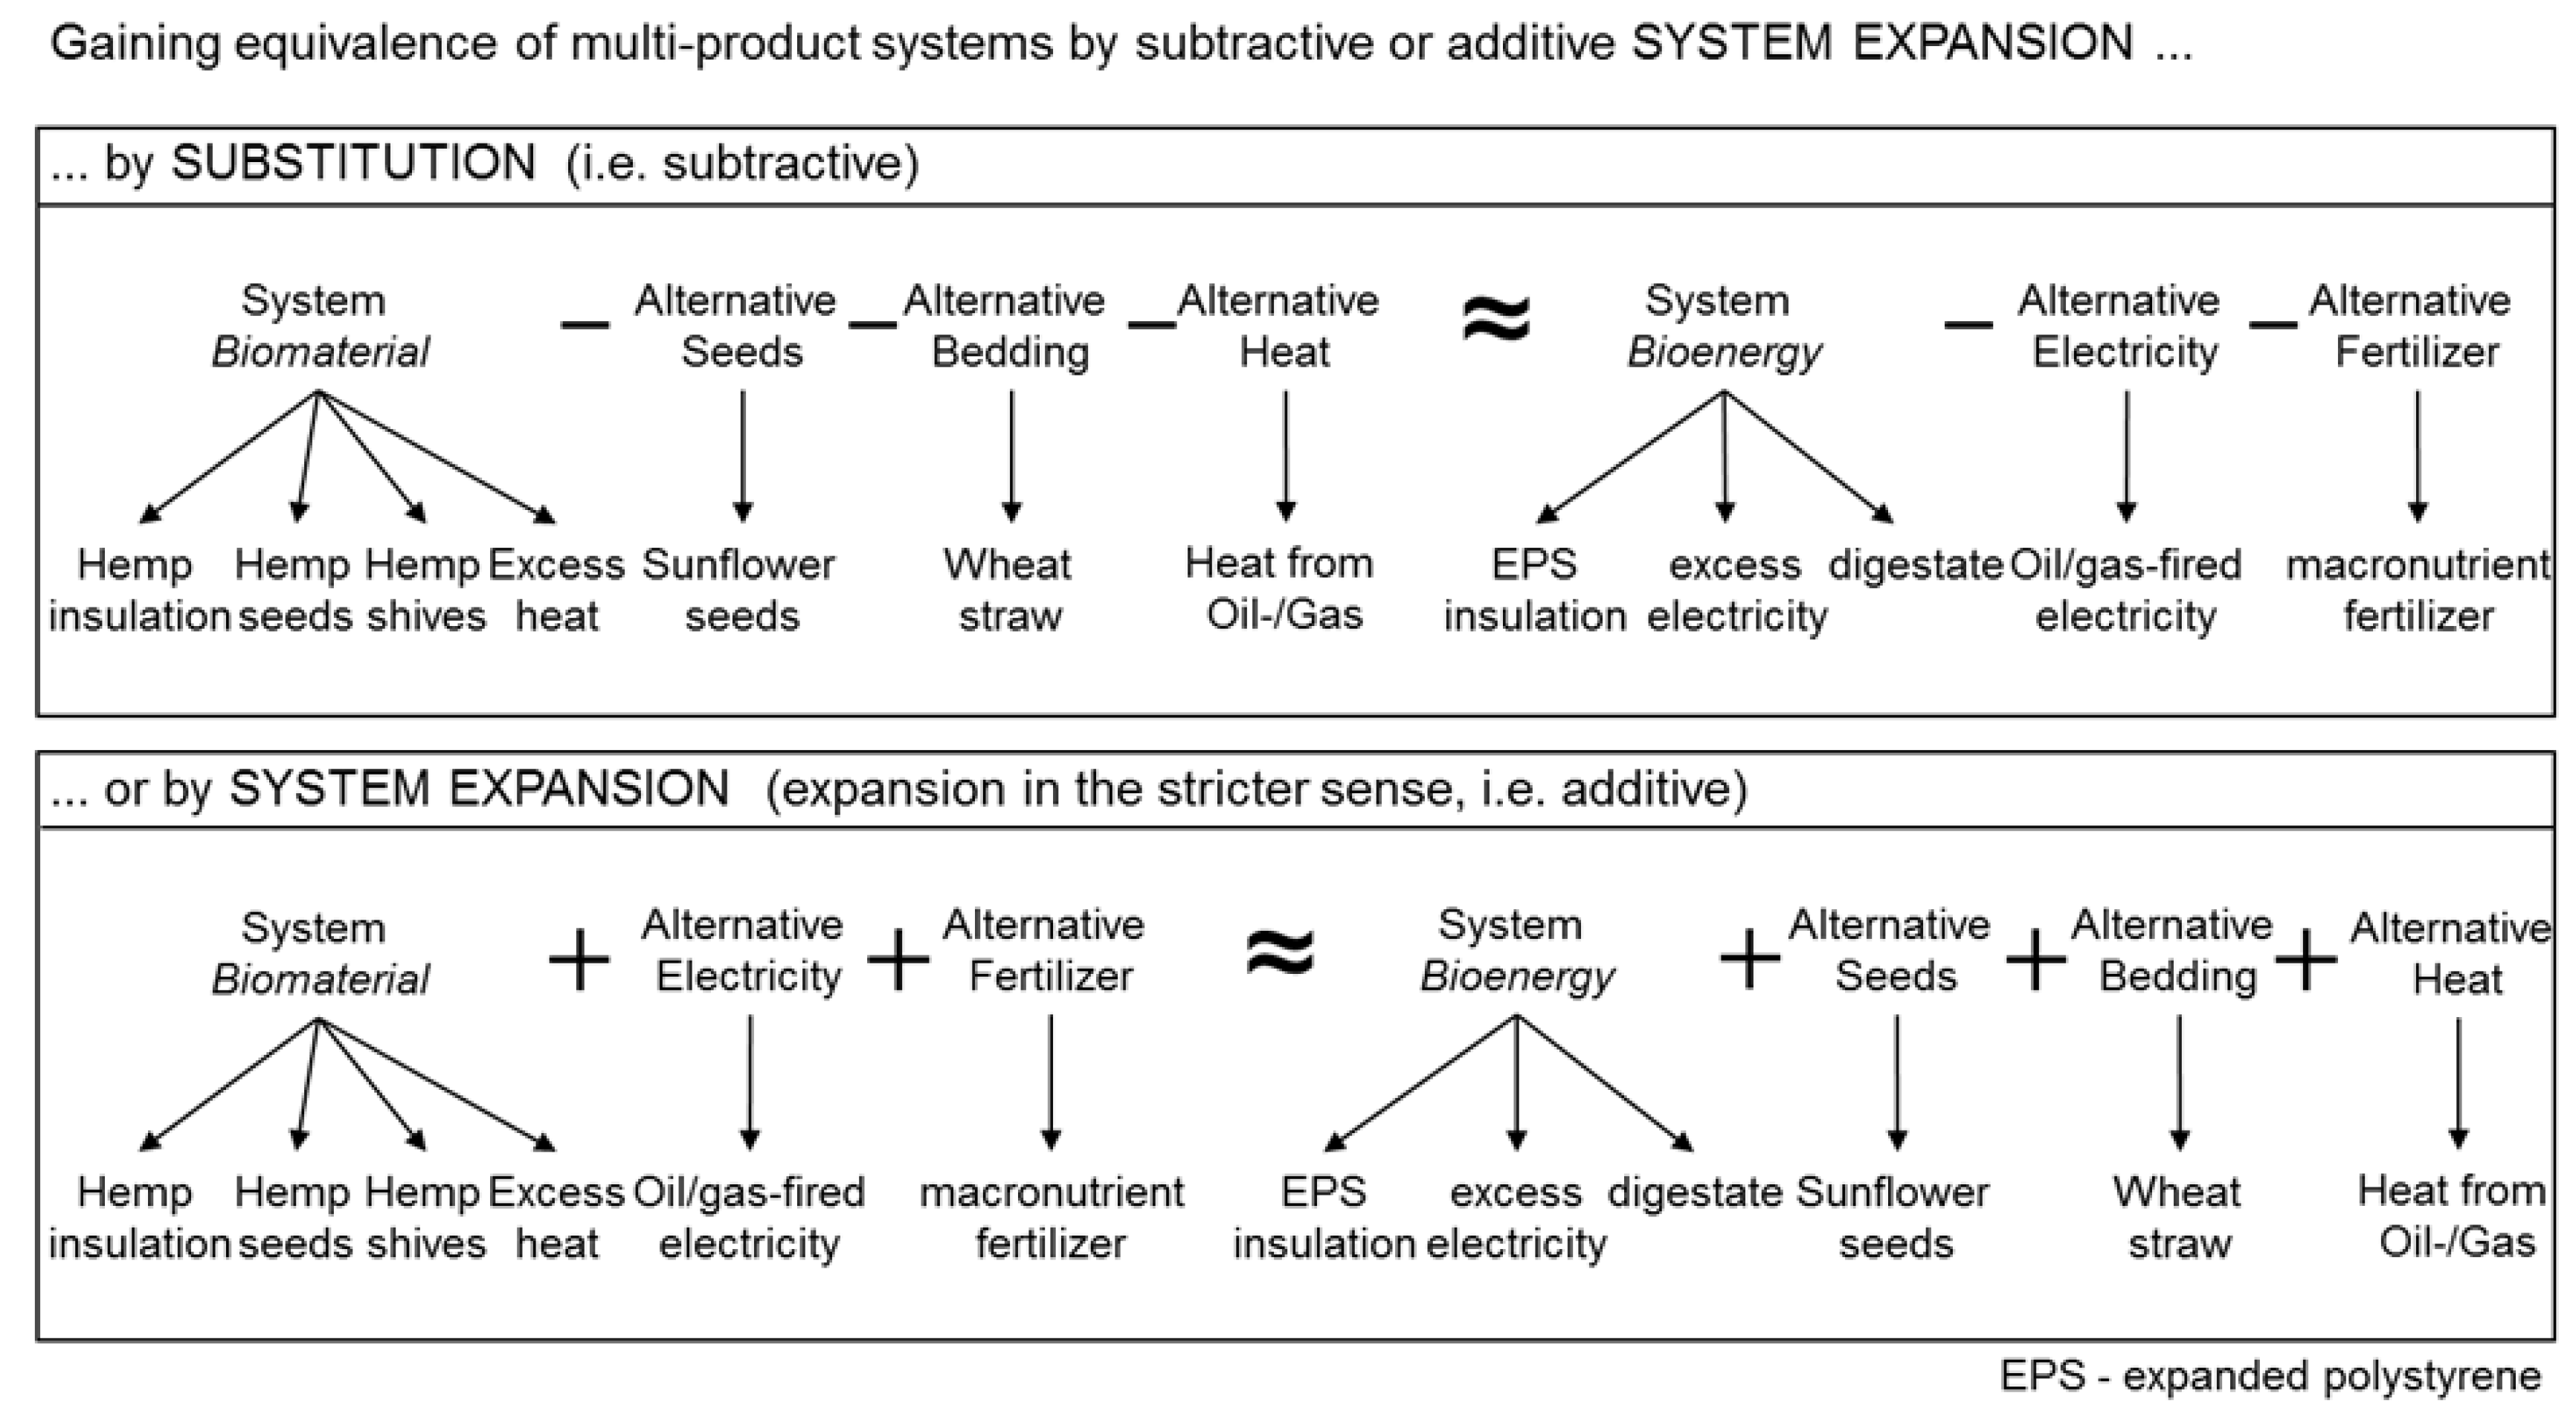
Land use change (LUC) effects can be crucial for the climate change impacts of bioresources, such as bioenergy crops [39] or bioplastics [40]. LUC can also affect biodiversity or have other environmental impacts [41]. However, the latter were out of the scope of this study.
We did not expect direct LUC (dLUC) for hemp cultivation: Management practices are similar to other annual crops. Accordingly, relevant changes in carbon stocks in above- and/or below-ground biomass as well as in soil-bound carbon are unlikely [42].
Hemp competes with cash crops like cereals, oleiferous plants, or bioenergy crops for agricultural land. It is usually considered to be a crop with positive effects within rotation systems, i.e., subsequent crops need no or less herbicides, whereas hemp itself needs none. Thus, unproductive sites can be used [35]. Provided that fiber demand grows (e.g., due to additional insulating efforts for buildings), we presumed that hemp would be integrated into existing crop rotation systems. For the calculation of indirect land use change (iLUC) effects on GHG emissions resulting from land demand for crops, global iLUC factors were published, for example 1.43 Mg CO2e·ha−1 [43] or 5 Mg CO2e·ha−1 [44]. As a conservative value, we applied the former factor to the gross value of land cultivated with hemp in a separate examination. We did not assign such factors to the system analyses in general because such iLUC is still marked by high uncertainties [45,46,47].

2.2.4. Co-Products

Hemp cultivation yields seeds and shives as market-relevant co-products. Hemp seeds are mainly used for animal feed (70%), especially in birdseed (4000 metric tons in 2010 in Europe) [33]. Sunflower (Helianthus annuus L.) seeds could be their alternative in feed compositions, even though they do not match hemp seed’s nutrient composition completely [48]. We assumed integrated Swiss farming systems as sunflower producers with yield levels around 3 Mg·ha−1 [49]. Hemp shives are mainly used for animal bedding [33], where alternatively wheat (Triticum aestivum L.) straw can be used. The third co-product was excess heat from the electricity co-generation process. Following the substitution approach, we determined credits for avoided GHG, energy and cropland demand according to those emissions and demands which would result from the alternative products and processes (Table 2).
For the end-of-life stage, we derived fossil fuel and GHG emission credits from environmental product declarations: For the co-incineration of detached insulations, the reference states a credit of non-renewable primary energy of 23.7 MJ·kg−1 insulation, of which 80% are from natural gas and 1% is from crude oil [11]. This source calculated the values based on the assumption that the German electricity supply mix and a heat generation from natural gas are displaced by the co-incinerated insulations. The resulting total fossil fuel credit was 19.2 MJ primary energy per kilogram of insulation.
BBSR datasets already offset the CO2 credits for biogenic carbon in hemp against the GHG emissions during waste incineration. Hence, the datasets display only aggregated GHG emissions for the end-of-life stage of hemp and EPS insulations, and we could not display disaggregated biogenic CO2e credits.

2.3. Bioenergy Strategy

2.3.1. EPS Production and Processing to Insulation

In the bioenergy strategy, we considered the supply chain from the cultivation of the bioenergy crops (optional SRC, or maize), to the provision of fossil fuels, to transport processes, up to the provision of heat and electricity, and finally to the end-of-life stage.
EPS insulations are made from polystyrene granulate, which can be produced from the fossil resources crude oil and natural gas via several pathways. Here, an oil to gas ratio of approx. one to one was assumed [49] (#1835). In the basic variant, the EPS had a 45% share of recycled material (EPS45). The heat demand of the EPS production process was met by either the gasification of poplar wood chips or by burning biogas from digested maize silage (Table 3). We scaled both co-generation processes to supply the heat demand of the EPS production process. The co-generated electricity is not entirely needed for the insulation production process itself (see also Section 2.3.3).
Disposed insulations can be co-fired in waste incineration plants. Our reference states a credit of non-renewable primary energy of 30.2 MJ·kg−1 insulation, of which 77% is from natural gas and 1% is from crude oil [11]. The source calculated the latter values while assuming a German electricity supply mix and heat generation from natural gas as displaced processes. This corresponded to a total credit of primary energy of 23.56 MJ·kg−1 EPS. GHG emissions from co-incineration were presented with 1.2 kg CO2e·kg−1.
Following Equations (1) and (2), 1 m2 of the insulation material EPS with U = 0.2 W·m−2·K−1 and a thermal conductivity λ = 0.036 W·m−1·K−1 weighed 5 kg and had a layer thickness of L = 0.18 m.

2.3.2. Potential Land Use Change Effects

The establishment of perennial bioenergy crops like SRC can result in recognizable, positive changes in carbon stocks as a direct LUC effect [53]. However, here we assigned no credits for a potential increase in soil organic carbon to the bioenergy strategy. The uncertainty of the amount of carbon sequestration remains still high: Long-term SOC data are missing for sites where SRC plantations were grubbed and re-grown with other crops [54]. We neglected indirect LUC effects of poplar cultivation in Germany [47] because we assumed that SRC replaces low yielding rye cultivation [50]. In an additional examination, we assigned a global iLUC factor [43] to gross SRC cultivation acreage.
LUC effects of maize cultivation as an annual energy crop can be important: In Europe, if maize is cultivated on previous grassland, GHG emissions of 2.6 Mg CO2e·ha−1·year−1 are possible [55]. We considered such potential emissions in a scenario analysis (see details for EPS45_LUC below). We generally did not consider indirect effects for maize [47], but again we addressed them with a separate iLUC examination for the gross value of agricultural land planted with maize [43].

2.3.3. Co-Products

In the bioenergy strategy, the excess electricity from the co-generation processes for the heat-driven EPS production process was a market-relevant co-product. Accordingly, we credited this strategy with avoiding emissions and resource demand from substituted oil- and gas-fired power plants (Table 4). We made this choice of fuels to maintain comparability to the fossil resources for material use. For the time being, we do not expect any large-scale structural effects on the electricity market from the additional electricity feed-in.
Biogas production from maize silage generates the additional co-product digestate. This digestate can be used as a mineral fertilizer substitute in agriculture [56]. The nutrient availability from organic residues can vary very widely between 6%–80% [57]. We assumed here that the substitution effect of the digestate was approximately 30% according to [56]. This is similar to other plant-based organic residues in [57]. We took the data for avoided emissions and resource demand from substituted fertilizers from ecoinvent [49].

2.4. Scenario Analyses

For both strategies, we had to make numerous assumptions, for example regarding parameter values or, among others, inclusion/exclusion of processes. We defined the most plausible scenarios to assess the influence of model assumptions and data sources on the strategy comparison (Table 5).
In the biomaterial strategy, we varied the share of hemp fibers in the insulation material and the production system of sunflower seed. Different mixtures of hemp insulations are available on the market. Therefore, in addition to the basic variant with 83% hemp fibers and 12% polyester fibers (Hemp83), we introduced a variant that was made from pure hemp fibers (Hemp95). Both variants were impregnated with sodium hydroxide (5%) as a flame retardant. For the variant Hemp83_Sunfl, we assumed a different production characteristic for the co-product sunflower seeds when substituting hemp seeds. As several regions could supply sunflower seeds [34], we chose conventionally produced sunflower seeds from Spain instead of seeds from Swiss integrated production. The main difference between regions is their yield and input level, which results in land demand that is three times higher in Spain than in Switzerland.
In the bioenergy strategy, we varied the share of recycled EPS in the insulation material and the LUC from grassland to maize was included. Synthetic insulation materials may contain different shares of recycled materials. In the basic bioenergy variant EPS45, the insulation had a 45% share of recycled EPS [49] (#11792), whereas in variant EPS100 it was produced entirely from recycled EPS [49] (#11791). The production process of EPS100 had more than twice the electricity demand compared to EPS45. However, the reduction in virgin EPS demand more than compensated for this by reduced CO2e emissions in the EPS pre-chain from 2.6 to 0.6 kg CO2e·kg−1 EPS [49,58].
Maize as an energy crop is discussed as a relevant driver of grassland to cropland conversion in Europe. It was identified with 50% as the dominant land use after grassland conversion in a GIS analysis of four German federal states [59]. Its cultivation in Germany increased to 800,000 ha between 2003 and 2012, whereas grassland decreased by 250,000 ha [60]. Therefore, we assumed that 16% of maize was cultivated on former grassland, and that associated GHG emissions were 0.277 kg CO2e·kWhth [52]. We considered such LUC emissions in variant EPS45_LUC.

3. Results and Discussion

3.1. Comparison of Strategies and Scenario Analyses

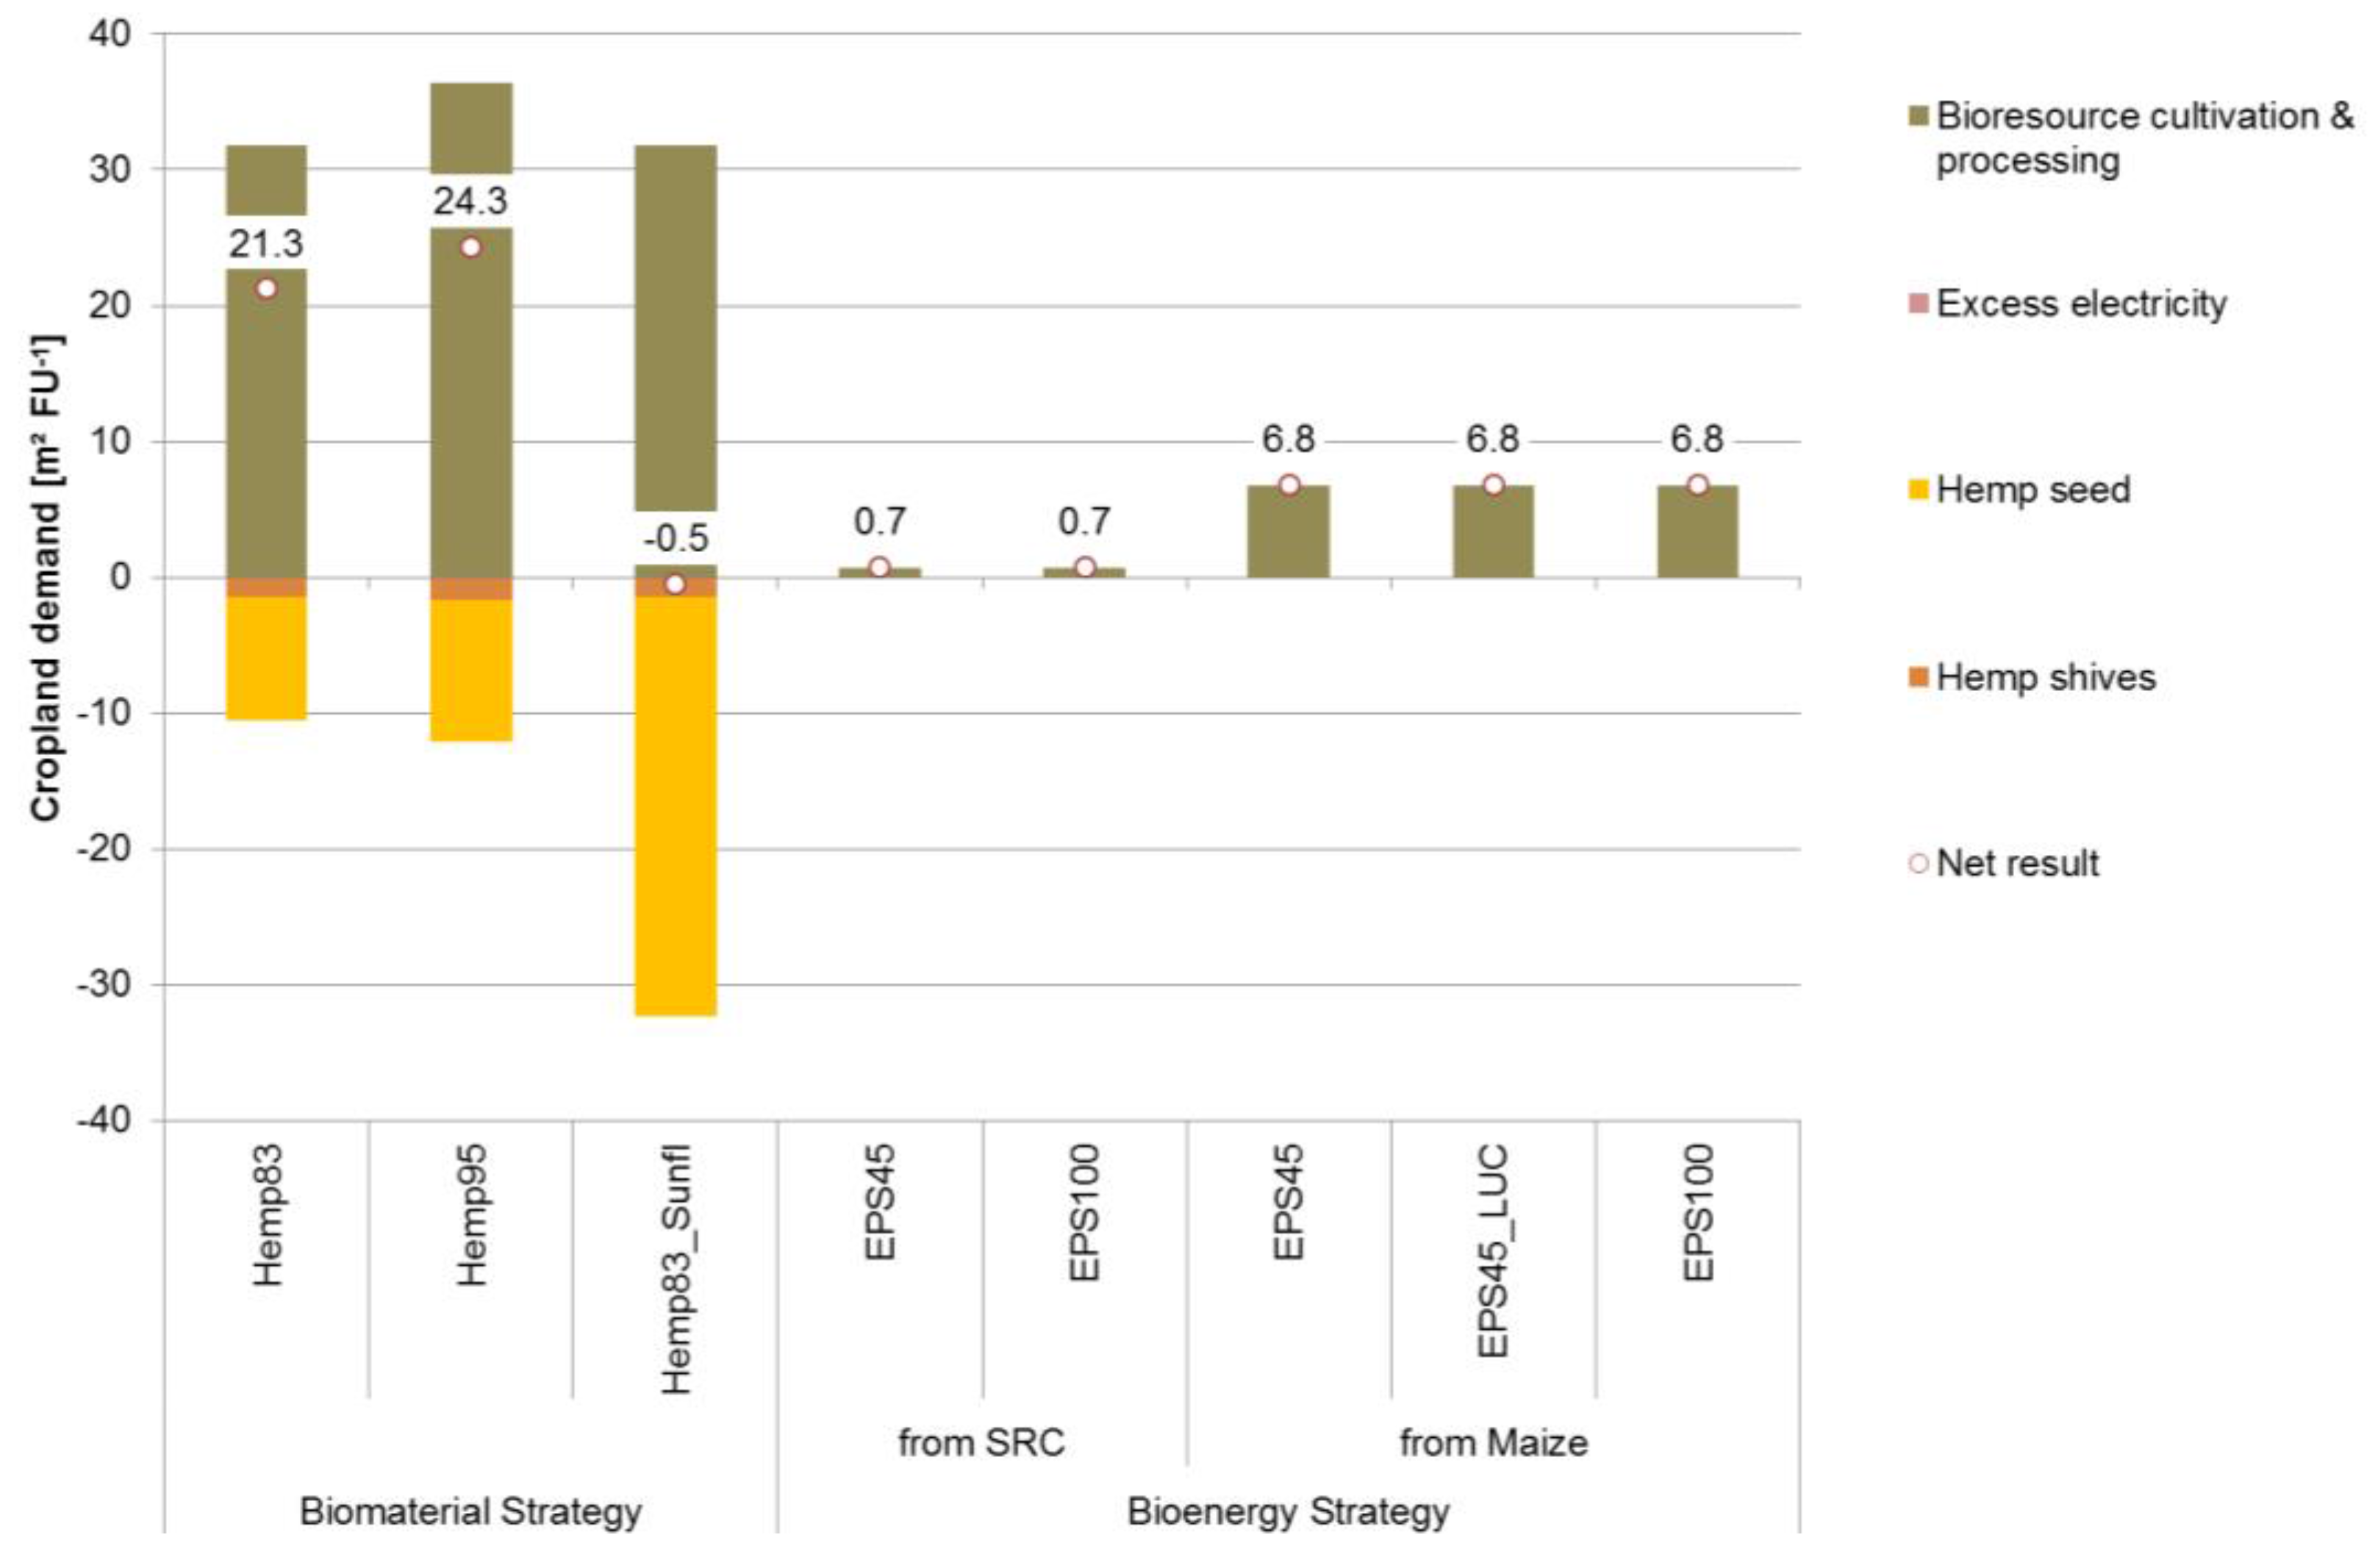
3.1.1 Cropland Demand

We found that cropland demand was lower in both of the basic bioenergy strategy options than in the basic biomaterial strategy (Table 6, Figure 1). Within the bioenergy options, the short rotation coppice needed less cropland than maize silage.
As we expected, the agricultural production processes that provided the bioresources fibers or bioenergy crops dominated this criterion (Figure 1). For an equal insulation effect, we found that the biomaterial strategy needed three times more land than the maize bioenergy option or approximately thirty times more than the SRC bioenergy option. The gross land demand in the biomaterial strategy was 31.84 m2·FU−1, with an additional 4.60 m2·FU−1 being necessary if the insulation material was produced from pure hemp (variant Hemp95).
We only obtained significant land credits for avoided cultivation of sunflower seeds, which we substituted for the co-product hemp seed in the biomaterial strategy. Our substitution choice had a relevant influence on the outcome of the strategy analysis: If we selected a less productive system as a reference (Hemp83_Sunfl), the calculated net land demand for producing a hemp mat as insulation material could even be negative (−0.52 m2·FU−1). Mean European yield levels for sunflower in 2014 were 1.44 Mg·ha−1 [61]. Hence, the Swiss seeds that we assumed here in the basic variant represented a very productive sunflower system with its yields of 3.15 Mg·ha−1, whereas the Spanish seeds represented the least productive ones (1.03 Mg·ha−1). The basic variant Hemp83 could accordingly be seen as a worst-case scenario and the biomaterial strategy becomes the preferable one with the caveat that superseded sunflower systems have low yield levels.
However, negative results must be interpreted with care. An oft-used interpretation for negative criteria values resulting from the substitutional approach is that the respective resource, in this case the cropland, is set free (“The overall impact of the system is more than compensated by the avoided impact the co-functions have elsewhere”[20] (p. 78)). In this study, the characteristics of the “set free” land, for example its soil fertility and climatic region and its respective farming specifications, are suitable for low-yielding sunflower cultivation. However, in general, it is not possible to infer its suitability for other agricultural purposes.
In the bioenergy strategy, we obtained hardly any cropland credits for excess electricity. We found that the variation in material characteristics, i.e., the share of recyclate, did not influence the cropland demand because the same amount of energy crops was needed, as the production of both virgin and recycled EPS insulations needed the same amount of thermal energy. Even though the electricity demand of EPS100 production is higher than that of EPS45 (2.4), the total amount of the by-product “co-generated electricity” still exceeded this demand. Accordingly, no additional cropland was needed for energy generation.

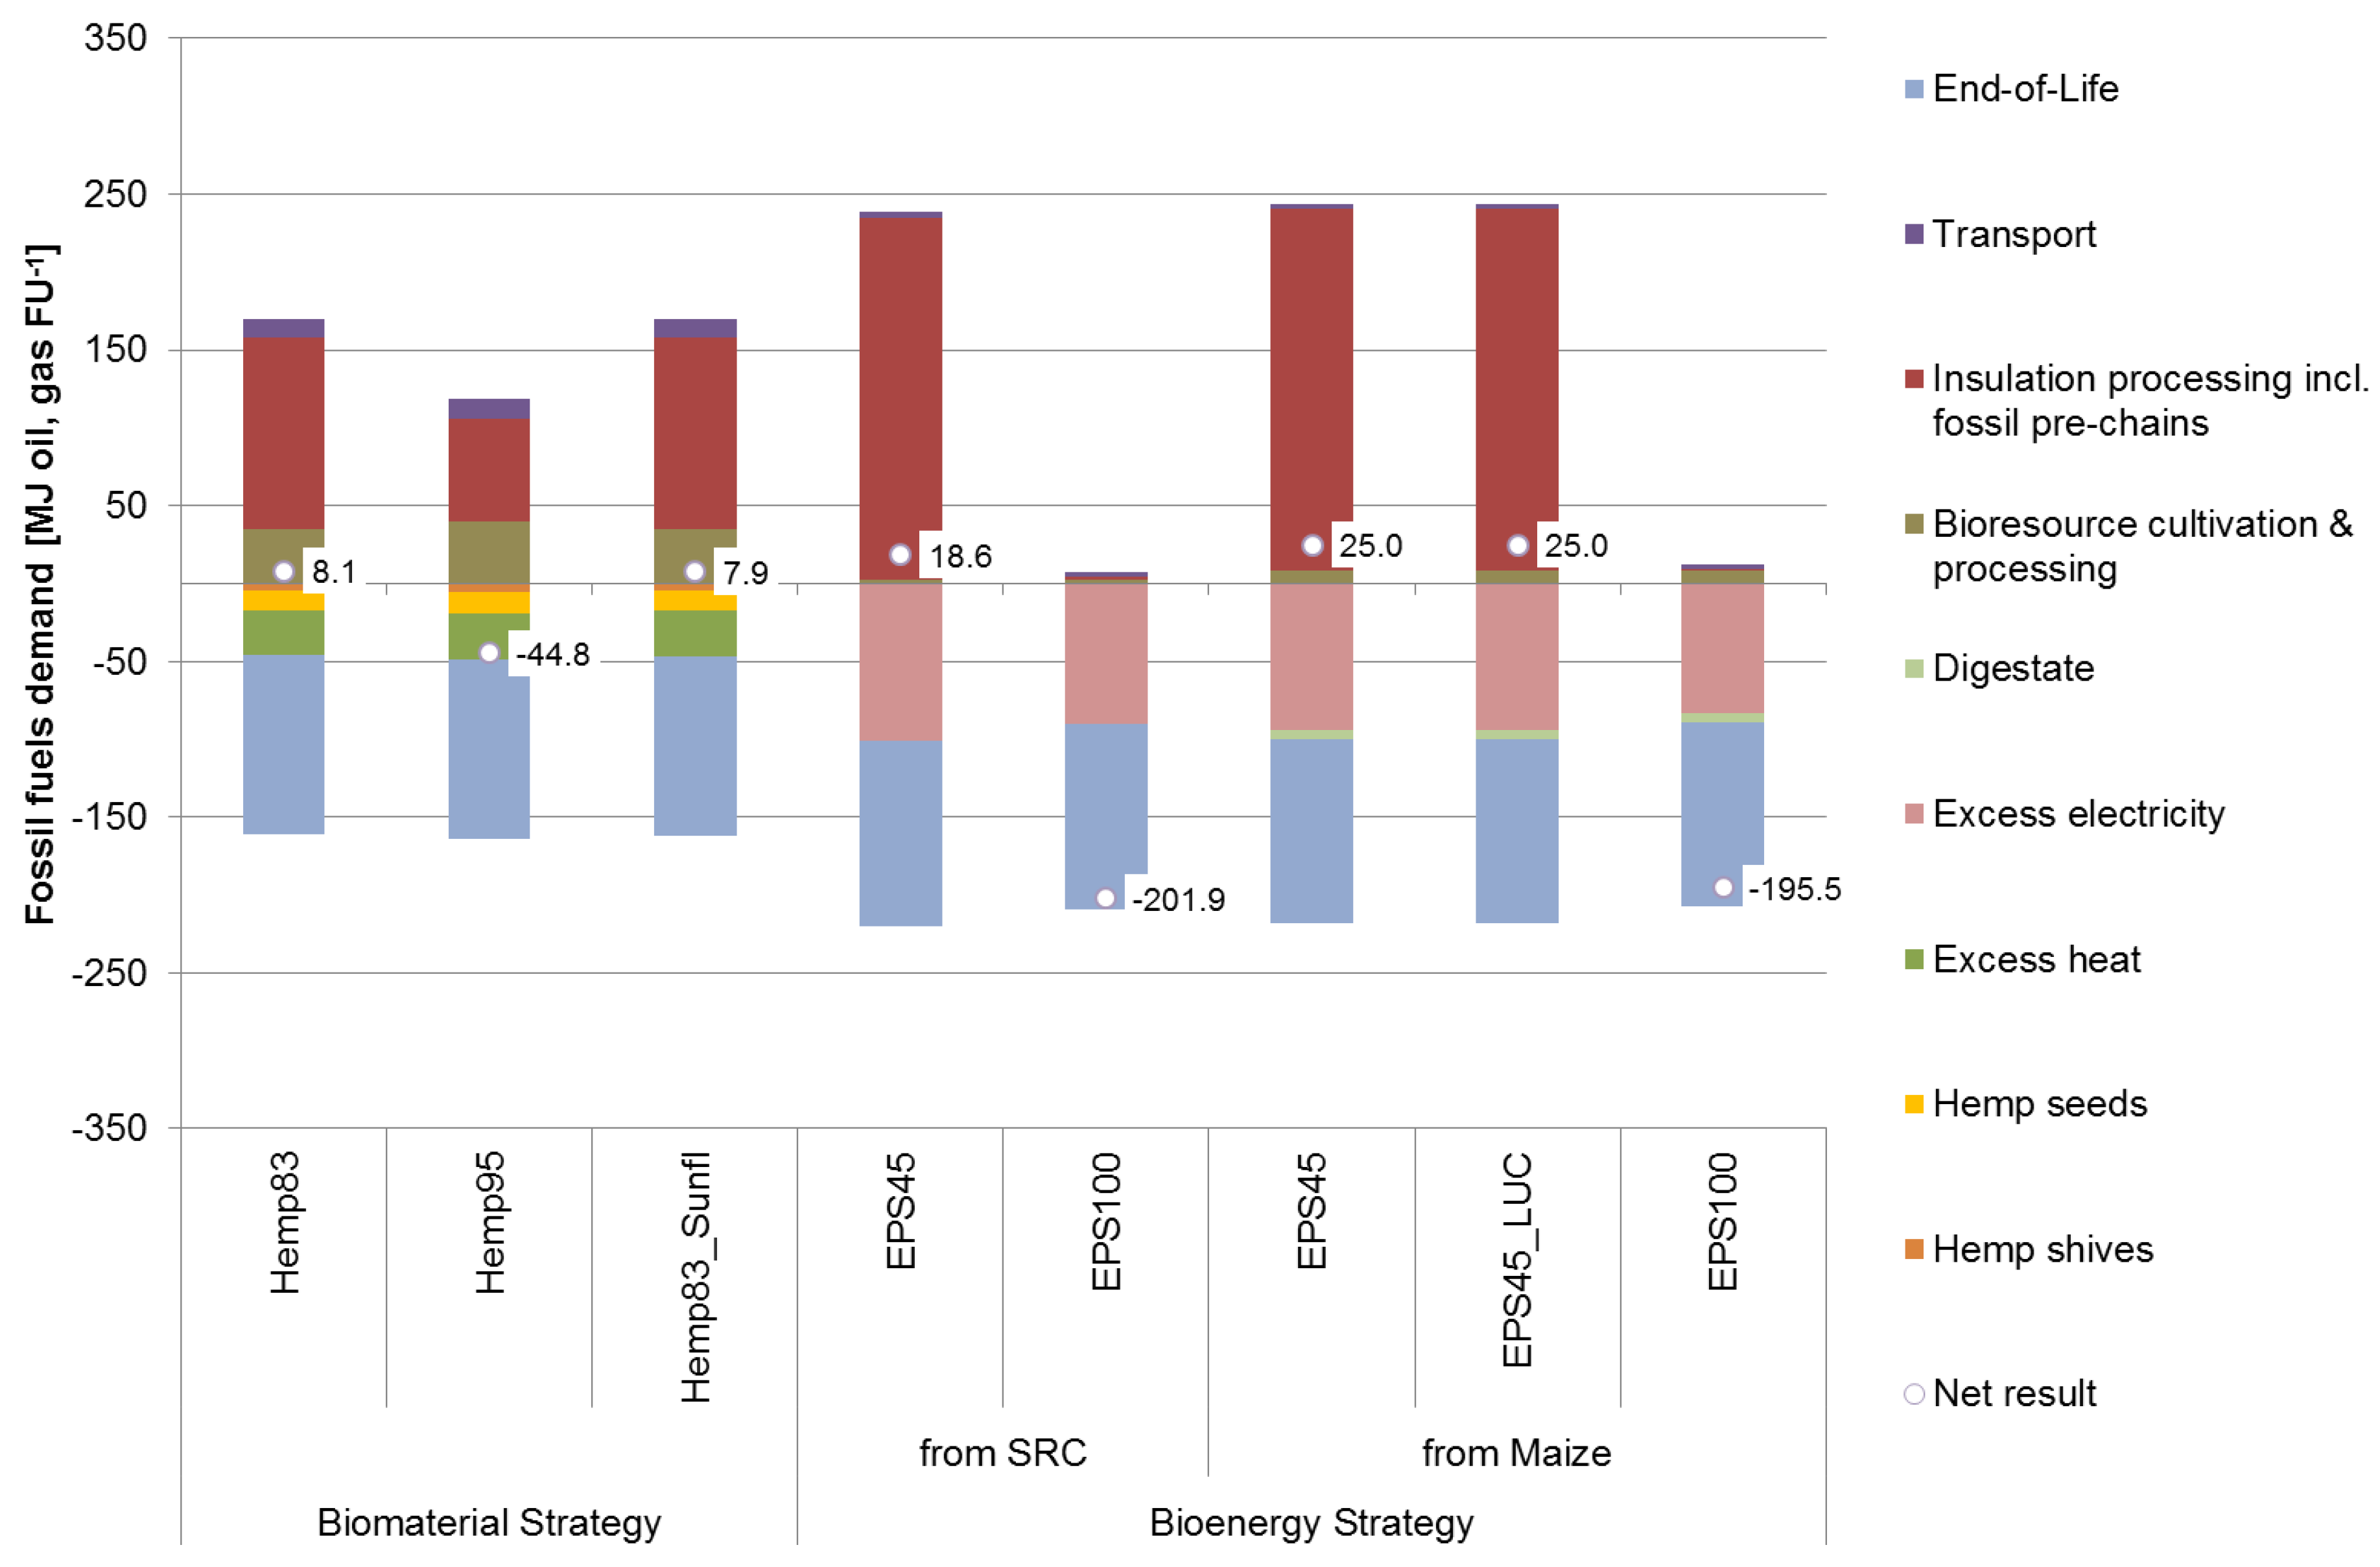
3.1.2. Fossil Fuels Demand

With regard to fossil fuel resource demand, the biomaterial strategy seemed to us to be preferable to the bioenergy strategy (Table 6, Figure 2).
The insulation production process dominated the fossil fuel demand in both of our strategies, with demands ranging between 66.07 and 232.35 MJ·FU−1, except for the bioenergy variant with pure recycling material (EPS100; 1.11 MJ·FU−1).
The end-of-life phase obtained relevant credits due to co-incineration in both of our strategies. In the bioenergy strategy, we substituted excess electricity for fossil resource-intense processes; this contributed as many credits as the end-of-life stage. We found that the substitution of mineral fertilizers by the co-product digestate had only a marginal effect, with 3% of total fossil fuels credits. In the biomaterial strategy, we found that the co-generated heat provided relevant credits, whereas the other co-products seed and shives added only minor ones. As with the cropland demand, our substitutional LCA approach resulted in a negative net fossil fuel demand in some variants.
Our basic biomaterial strategy needed nearly 30% of the net amount of fossil fuels compared to maize or 40% compared to SRC bioenergy. From the ecoinvent data for pure recyclate (EPS100), we determined considerable negative net fuel demands of approximately −200 MJ·FU−1 for the bioenergy strategy (−201.86 MJ·FU−1 for SRC, −195.45 MJ·FU−1 for maize). Using that data set would change the rating of the strategies and would make the bioenergy strategy preferable. The reason was how recycling material was defined in these datasets: Still-unused insulations that are collected from municipalities and builder’s merchants, consisting of clean, sorted offcuts, were re-processed to a so-called 100% recycling material. The previous resource demand from original material production was not considered. The dataset implied recycling, even though the first life cycle was not completely closed, as this material was not attached to a building as insulation. Furthermore, assuming best practice on the construction sites, only a small fraction of such virgin-like EPS would be available for the transformation into the recycling material. We think this balancing approach is debatable. Currently, we believe that recovery of EPS from dismantled insulation material after its service life is far from a practical implementation due to contaminants and adhesives, and hence we chose co-incineration as the end-of-life option.
Under the assumption that such a recycling becomes possible in the future, we believe that the fuel demand for the recyclate share must be accounted for as well. We estimated the fuel demand for a pure virgin material (EPS0) from the EPS45 dataset for the bioenergy SRC option by allocating its entire energy demand of the production process to the 55% share of virgin EPS (232.35/0.55) (Table A1). The resulting increased net fossil fuel demand of 209 MJ·FU−1 indicates the importance of recycling for this strategy. Its net fossil fuel demand is one order higher than that of the biomaterial strategy, no matter if recycling is considered there. The bioenergy variant EPS100 yielded net negative fossil fuel demands of −2.5 MJ·FU−1 from the second use cycle onwards. For the same benefit after three use cycles, we found that a minimum of 75% recyclate would be necessary (Table A1).
For bioresource-based insulations in the biomaterial strategy, explicit data on hemp recycling are scarcely available and thus, we did not assess recycling here.
From fossil fuel demand, we conclude that recycling concepts for materials are far more important in terms of fossil resource conservation than the choice between fossil or biogenic resources as raw materials. A comparable conclusion was reached by Colwill et al. [62], who claimed an efficient material use through effective end-of-life management and good design.

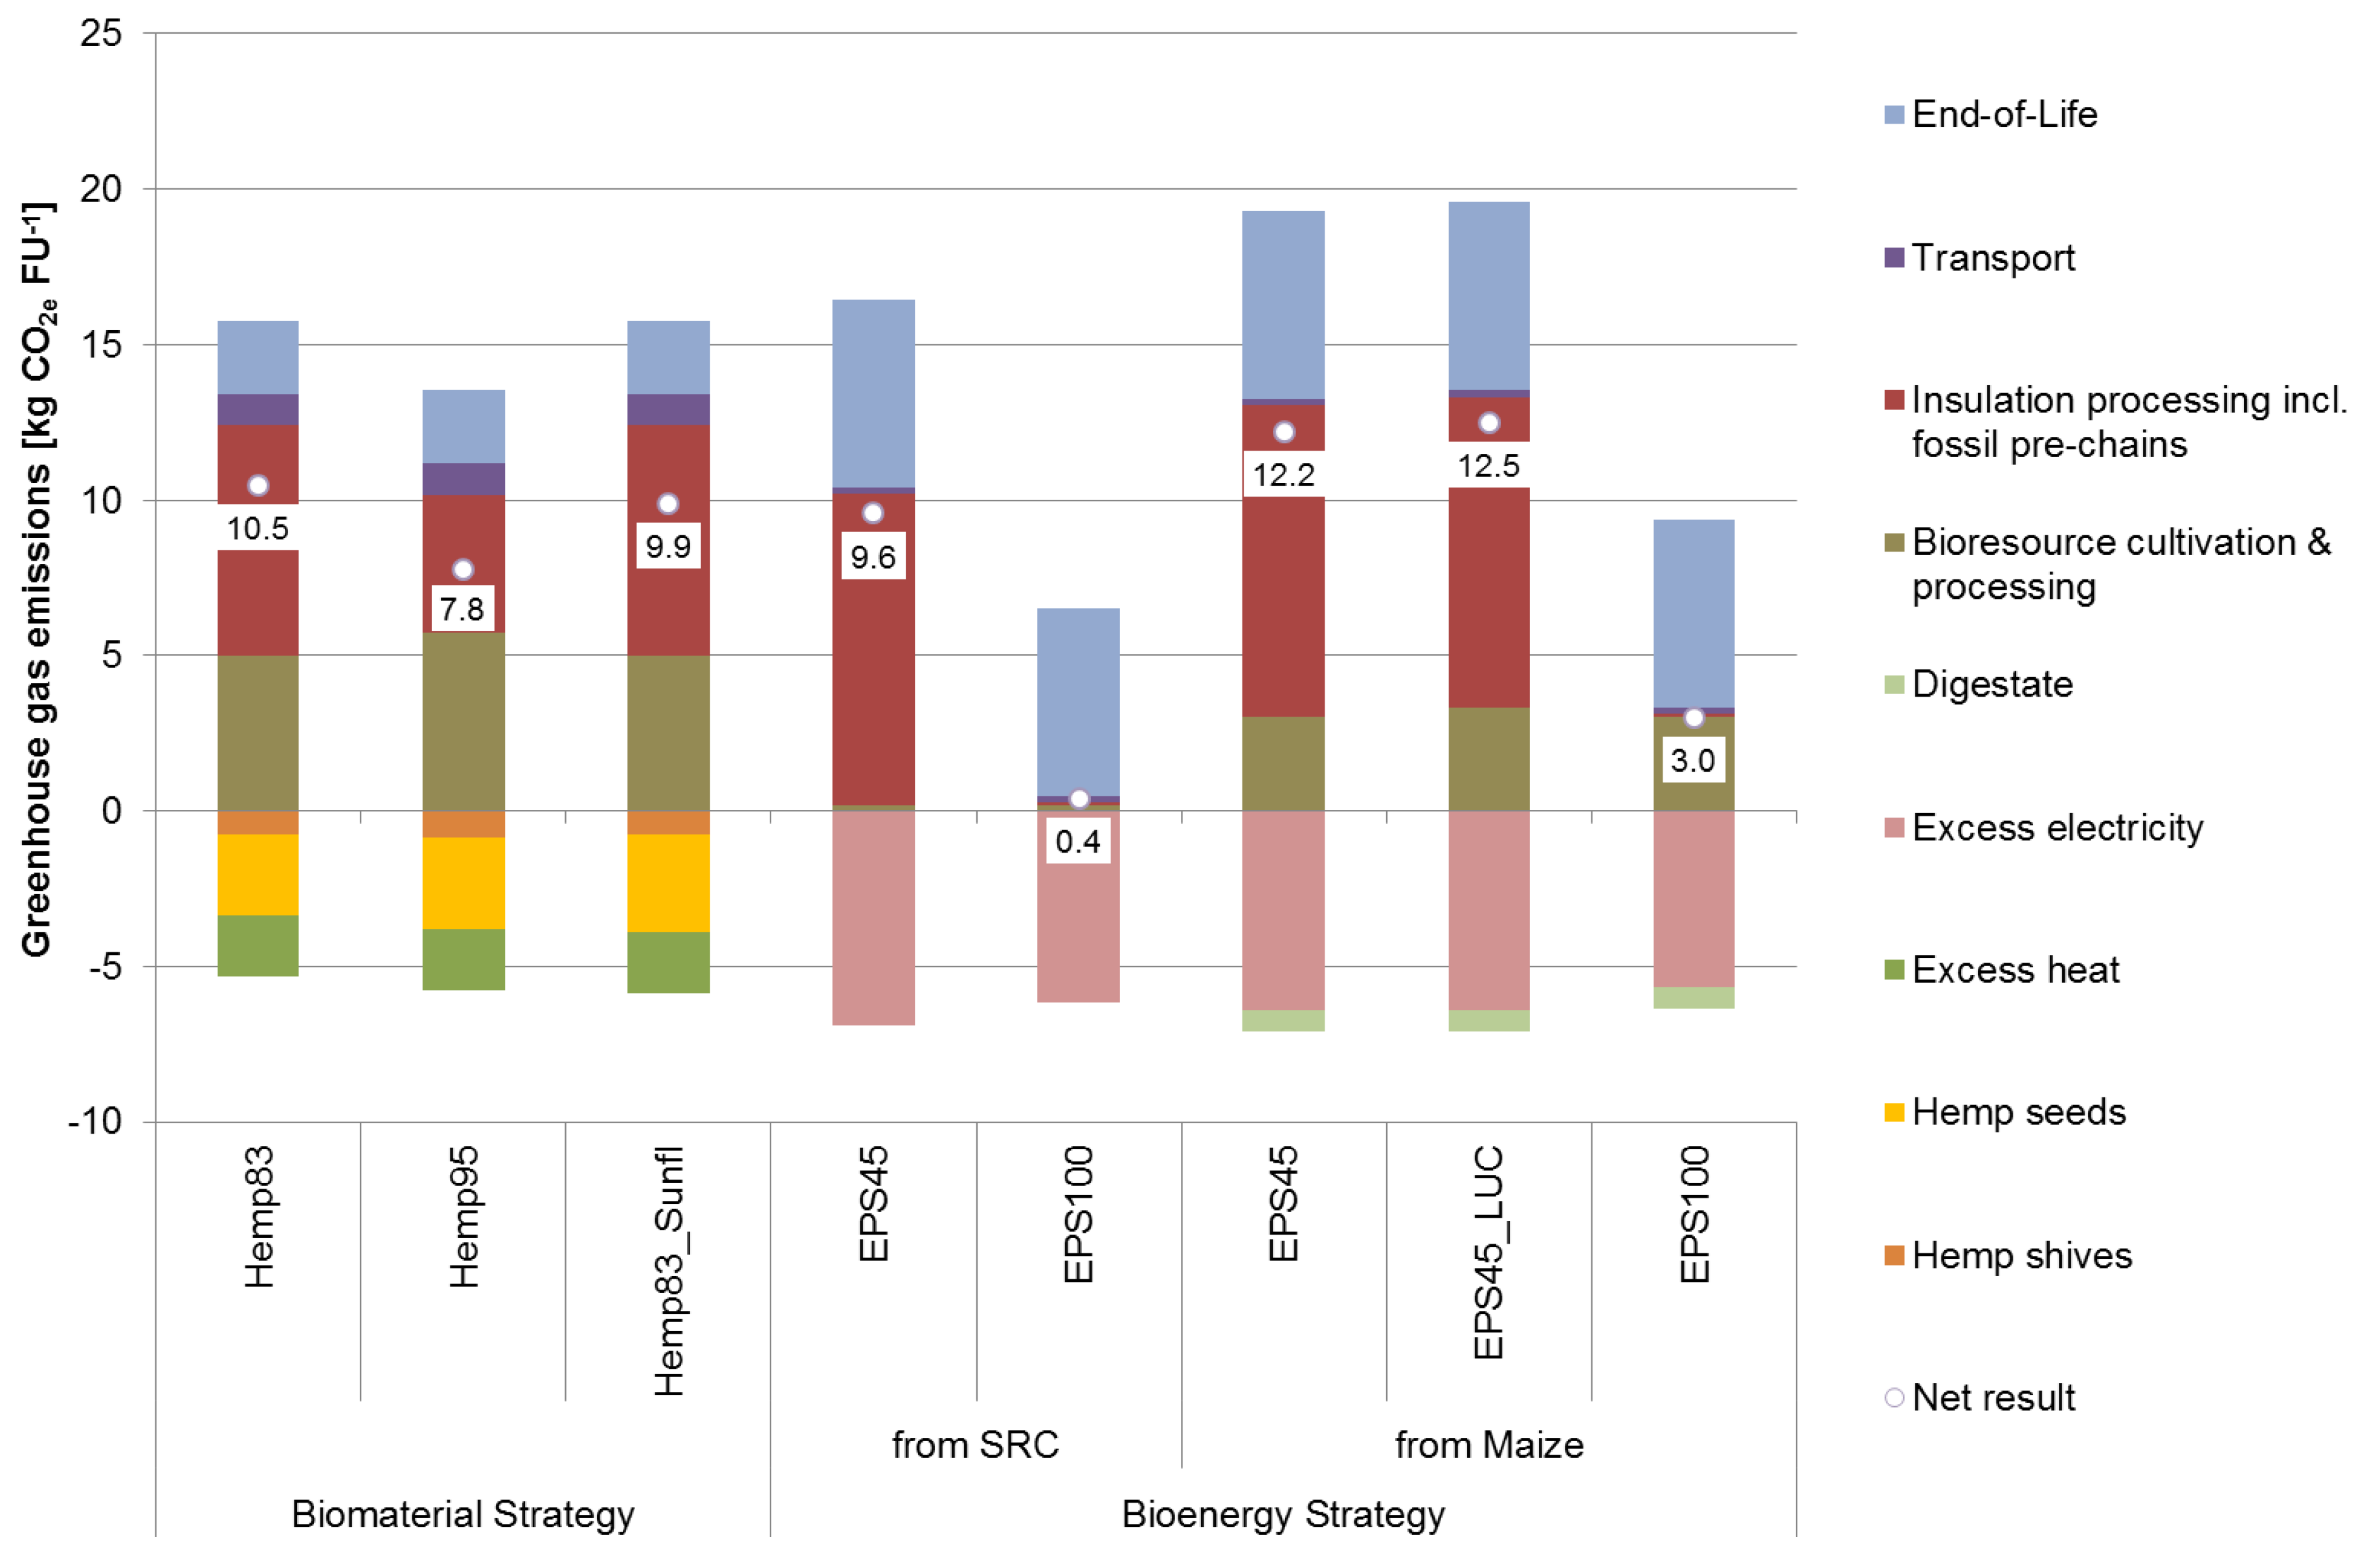
3.1.3. Contribution to Climate Change

We found that the net contribution to climate change was in the same range for the biomaterial and the SRC bioenergy strategy, whereas the bioenergy option from maize (EPS45_maize) emitted more GHG (Table 6, Figure 3). An increase in the amount of recyclate in the EPS insulation (EPS100) reduced emissions in a way that the bioenergy strategy would be favorable instead. Accounting for iLUC effects increased the difference between the strategies in the same way (Table 6).
In both of our strategies, the insulation processing contributed the most to climate change. In the biomaterial strategy, hemp cultivation contributed the second-most GHG emissions, whereas in the bioenergy strategy the emissions from the end-of-life incineration of detached insulation had the second highest share. We found that such end-of-life emissions were of lesser importance in the biomaterial strategy (2.38 kg CO2e·FU−1), because mostly biogenic carbon was re-emitted.
We found that the use of the co-product digestate in the bioenergy maize option contributed 10% of the GHG credits. The co-product excess electricity in the bioenergy strategy substituted electricity from carbon-intensive electricity production from fossil fuels, thus yielding far more credits.
By changing the material composition by an increase in the hemp fiber share in the biomaterial strategy (Hemp95), we would notably reduce GHG emissions by 26%. Another option to reduce the GHG emissions from the biomaterial strategy is the substitution of polyester fibers with fibers from maize starch. Such pre-existing technologies were analyzed in a CO2 balance for two hemp insulation materials [36]. Nevertheless, we found that pure hemp insulation without any additional fiber materials would still have a lower GHG impact.
The bioenergy EPS100 variants had a generally low climate change contribution (≤3.02 kg CO2e·FU−1).
If we included the emissions from direct land use change in the bioenergy strategy (EPS45_LUC), the net contribution to climate change amounted to 12.5 kg CO2e·FU−1, which was only 2% higher than that of the basic EPS45. When we accounted for indirect LUC effects on GHG emissions by a global emission factor, which is applicable to the land demand for the respective agricultural commodities hemp, SRC, or maize, this increased the difference between both strategies. The biomaterial strategy then had nearly 50% (compared to SRC) or 15% (compared to maize) higher emissions than the bioenergy strategy (Table 6). When we applied a recently published, less conservative global iLUC factor [44], this even resulted in 165% or 70% higher emissions.

3.2. Discussion of Market Implications and Reference Systems

It is still unclear whether high recycling quotas for insulations are achievable on a larger scale. The available data in this study for the product from recycled EPS stemmed from a single company acting in a limited region, so this variant could be interpreted as a best case scenario. Furthermore, we are not aware of technologies that would make it possible to detach old EPS insulation from buildings economically. More information on several end-of-life options is necessary to identify the best choice for the end of life of building materials [63], which was not available to us. Comprehensive information becomes even more important if additional environmental impacts like acidification or eutrophication are to be assessed for such bio-based materials [64].
The complexity of the involved systems made the substitutional approach challenging. Markets do exist for the hemp co-products seeds and shives. However, if the market placement is misjudged, possible side or rebound effects of the multi-product systems might be overlooked.
Under the geographic conditions analyzed in this study, we classified hemp seeds as valuable bird feed that cannot easily be substituted. Globally, other markets for hemp seed also exist: In Canada for example, hemp seed is mainly grown for human nutrition [65]. Accordingly, different alternative co-production processes would need to be identified if the assessment is done for different geographical regions. We conclude that bioresource usage should always be assessed with a regional focus.
For the second co-product shives, straw was assumed as an alternative bedding material. The market effects of straw use are difficult to anticipate. This is because this agricultural residue is a bioresource which can alternatively be used for bioenergy generation; this has already been implemented, for example in Denmark (approx. 5 TWh in 2012) [66]. If more straw is used as energy feedstock, there might be an even higher demand for straw substitutes on the animal bedding market.
Alternatively, hemp shives can be burned instantly instead of being credited with straw. The calorific values of hemp shives and straw can be assumed to be similar (18.8 vs. 18.7 MJ·kg−1 dry matter) [67]. Their incineration would accordingly yield similar energy credits with regard to mass, but land demand of the biomaterial strategy might be different.
Ongoing research is examining further marketable options for hemp fiber co-products. For instance, technologies are being proposed to increase the marketable share of shives and short fibers for technical applications [68]. This would increase the credits obtained for shives by the strategy.
However, from the information available at present, we considered that the assumption that straw substitutes for hemp shives in animal bedding, is the most appropriate one.
Nevertheless, we believe our discussion above clearly indicates how the complexity of the involved bioresource systems makes the substitutional approach challenging.

3.3. Excluded Effects

In different climatic regions, an identical insulation might yield lower CO2e benefits depending on the initial thermal insulation state of the building [69]. Thermal comfort ranges of inhabitants as well can have an important impact [70]. We neglected this due to our assumption that the buildings have the same initial thermal insulation state and are situated in the same climate. As already stated in Section 2.1.3, we excluded heating and cooling demand from the analysis because its equality in both systems is the functional unit that allows comparing both usage strategies.
The excluded scaling effects concern the assumed parity between material and energy use of bioresources. At higher emission taxes, bioelectricity was found to be more beneficial in terms of absolute emission reduction than the use of biomass as feedstock for bulk chemical production [64,71]. This was because of the large size of the electricity sector and, on the other hand, higher leakage effects for the non-energy use of biomass. We did not implement such cross-sector effects here.
To allow scaled up and geographically broader assessments in the future, we believe it is necessary to implement regional aspects (for example policy instruments—incentives, regulations, sanctions—[72], yield levels, supply chain networks, waste handling) and to adapt assumptions to market developments in order to consider leakage effects adequately. Additionally, a dynamic approach could improve how sequestration effects are represented in the bio- as well as the fossil materials [73]. This includes temporary carbon storage in biomaterials as suggested by Jørgensen et al. [74].
Our study focused on environmental impacts and did not analyze social and economic effects. In the future, comprehensive data might be available for social sustainability assessment, for example from the Social Hotspots Database (SHDB) [75], to facilitate data collection even in complex systems as those under study here. For an even more complete picture of the sustainable resource use of land and fossil fuels, also explicit economic assessments were to be wished for. At the moment, economic impacts are only implicitly considered, for example in the discussion of reference systems or iLUC effects.
There are other aspects that are difficult to assess: bioresource cultivation can be associated with changes in the agricultural landscape or agricultural management practices with complex effects on, amongst others, soil quality, diversity of agriculture [76], or economic opportunities for the farmers [77]. We think that such aspects are not reliably detectable with the criteria cropland and fuel demand and GHG emissions used here, and hence we did not take them into account. An ongoing discussion concerns the indirect effects if agricultural commodities are produced. That is, if cropland is grown with another crop and the previously produced commodity is supposed to be grown somewhere else, triggering changes in land occupation and/or production intensities as well in above- and below-ground biomass stocks. Even though uncertainties are still remarkable with regard to the size of land affected, first approaches are available for accounting for the GHG-related effects. These apply additional GHG emission factors per land used [43,44]. However, we are not aware of such factors for criteria other than GHG, for instance resource demand, which was a main criterion in this study.

4. Conclusions

Under the assumptions we made, none of the resource usage strategies operated best in all three categories. With a clear focus on sustainable land use, we conclude that a bioenergy strategy would be preferable, whereas a biomaterial strategy would maintain fossil resources. However, scenario analyses indicated to us that improved recycling concepts could make the bioenergy SRC strategy the preferable one in all criteria. Hence, this strategy could be seen as a promising way to exploit additional mitigation potentials in the building sector besides the direct reduction effects of insulations.
For complex production systems, such as the ones exemplarily analyzed in this study, the substitutional assessment approach is challenging and consequently, we strongly advise a combination of criteria for supporting strategy decisions in order to help reduce the impact of uncertainties. In the future, this could be supported by multi-criteria decision making-approaches. Furthermore, we conclude that bioresource systems should be analyzed with a clear regional focus.

Acknowledgments

We would like to thank Hans–Jörg Gusovius for his valuable comments and discussion about hemp cultivation and market implications in Germany and appreciate that several external experts were willing to share their market knowledge. This work was partially funded within the Leibniz–Pakt für Forschung project “bioenergy planet”. The publication of this article was funded by the Open Access fund of the Leibniz Association. John L. Grantham improved English grammar and syntax.

Author Contributions

The individual contribution and responsibilities of the authors are as follows: Jörn Budde and Anja Hansen designed the research. Anja Hansen defined the systems, modeled and analyzed the data and mainly wrote the manuscript. Annette Prochnow contributed to structuring the study and revising the manuscript. All authors have read and approved the final manuscript.

Conflicts of Interest

The authors declare no conflict of interest. The funding sponsors had no role in the design of the study; in the collection, analyses, or interpretation of data; in the writing of the manuscript, and in the decision to publish the results.

Abbreviations

The following abbreviations are used in this manuscript:
BBSR
Bundesamt für Bau-, Stadt- und Raumforschung im Bundesamt für Bauwesen und Raumordnung
CAN
calcium ammonium nitrate
CO2
carbon dioxide
CO2e
CO2 equivalents
dLUC
direct land use change
EPS
expanded polystyrene
EPS45
EPS with a share of 45% recyclate
EPS45_LUC
EPS with a share of 45% recyclate and land use change effects considered
EPS100
pure recyclate EPS
EU
European Union
FU
functional unit
GHG
greenhouse gas(es)
Hemp83
hemp insulation containing 83% hemp fibers
Hemp95
hemp insulation containing 95% hemp fibers
iLUC
indirect land use change
K2O
potassium oxide
LCA
life cycle assessment
LCC
life cycle costing
LUC
land use change
MJ
megajoule
N
nitrogen
P2O5
phosphate
SLCA
social life cycle assessment
SRC
short rotation coppice

Appendix A

Table A1. Approximated net fossil resource demands (d; MJ·FU−1) of the bioenergy strategy (wood chip gasification) for a range of material compositions of recycled and new expanded polystyrene and different use cycles of the recycled material. Italic cells indicate material compositions that would result in net resource credits. Values are calculated as proxies from EPS45 dataset (#11792; ecoinvent Centre, 2010) according to d = −213.7 + (%_new/100 + (100-%_new)/100 × 1/use_cycle) × 422.4. Basic variant EPS45 displayed in bold letters.
Share of Expanded Polystyrene in the Insulation MaterialUse Cycles
%_recycled%_new12345
1000208.8−2.5−72.9−108.1−129.2
955208.88.1−58.8−92.2−112.3
9010208.818.7−44.7−76.4−95.4
8515208.829.2−30.6−60.6−78.5
8020208.839.8−16.6−44.7−61.6
7525208.850.3−2.5−28.9−44.7
7030208.860.911.6−13.0−27.8
6535208.871.525.72.8−10.9
6040208.882.039.818.76.0
5545208.892.653.934.522.9
5050208.8103.167.950.339.8
EPS4555208.8113.782.066.256.7
4060208.8124.396.182.073.6
3565208.8134.8110.297.990.5
3070208.8145.4124.3113.7107.4
2575208.8156.0138.4129.5124.3
2080208.8166.5152.4145.4141.2
1585208.8177.1166.5161.2158.1
1090208.8187.6180.6177.1175.0
595208.8198.2194.7192.9191.9
0100208.8N/AN/AN/AN/A

References

  1. Alvarenga, R.A.F.; Dewulf, J. Plastic vs. Fuel: Which use of the brazilian ethanol can bring more environmental gains? Renew. Energy 2013, 59, 49–52. [Google Scholar] [CrossRef]
  2. Shah, D.U. Developing plant fibre composites for structural applications by optimising composite parameters: A critical review. J. Mater. Sci. 2013, 48, 6083–6107. [Google Scholar] [CrossRef]
  3. Change in the Raw Materials Base. Available online: http://www.dechema.de/dechema_media/Downloads/Positionspapiere/Positionpaper_Rohstoffbasis_engl_final.pdf (accessed on 31 July 2013).
  4. Wolf, J.; Bindraban, P.S.; Luijten, J.C.; Vleeshouwers, L.M. Exploratory study on the land area required for global food supply and the potential global production of bioenergy. Agric. Syst. 2003, 76, 841–861. [Google Scholar] [CrossRef]
  5. Rockström, J.; Steffen, W.; Noone, K.; Persson, Å.; Chapin, F.S.; Lambin, E.F.; Lenton, T.M.; Scheffer, M.; Folke, C.; Schellnhuber, H.J.; et al. A safe operating space for humanity. Nature 2009, 461, 472–475. [Google Scholar] [CrossRef] [PubMed]
  6. Jakob, M.; Edenhofer, O. Green growth, degrowth, and the commons. Oxf. Rev. Econ. Policy 2014, 30, 447–468. [Google Scholar] [CrossRef]
  7. Bruch, C.; (GDI (Gesamtverband Dämmstoffindustrie), Berlin, Germany). Personal Communication, 2012.
  8. Danner, H. Handbuch Ökologische Wärmedämmstoffe (Handbook of Ecological Insulations). Available online: http://www.muenchen.de/rathaus/dms/Home/Stadtverwaltung/Referat-fuer-Gesundheit-und-Umwelt/Dokumente/Klimaschutz_und_Energie/Bauzentrum/Fachinformationen/Leitfaeden/oekolog_waermedaemmstoffe_v_2.pdf (accessed on 12 October 2013). (In German)
  9. Erlandsson, M.; Levin, P.; Myhre, L. Energy and environmental consequences of an additional wall insulation of a dwelling. Build. Environ. 1997, 32, 129–136. [Google Scholar] [CrossRef]
  10. Schmidt, A.C.; Jensen, A.A.; Clausen, A.U.; Kamstrup, O.; Postlethwaite, D. A comparative life cycle assessment of building insulation products made of stone wool, paper wool and flax (part 2). Int. J. LCA 2004, 9, 122–129. [Google Scholar] [CrossRef]
  11. The Federal Institute for Research on Building, Urban Affairs and Spatial Development (BBSR). Oekobau.dat. Available online: http://www.nachhaltigesbauen.de/oekobaudat/ (accessed on 3 December 2012). (In German)
  12. Dornburg, V.; Lewandowski, I.; Patel, M. Comparing the land requirements, energy savings, and greenhouse gas emissions reduction of biobased polymers and bioenergy. J. Ind. Ecol. 2003, 7, 93–116. [Google Scholar] [CrossRef]
  13. Kauffman, N.S.; Hayes, D.J. The trade-off between bioenergy and emissions with land constraints. Energy Policy 2013, 54, 300–310. [Google Scholar] [CrossRef]
  14. Cherubini, F.; Strømman, A.H. Life cycle assessment of bioenergy systems: State of the art and future challenges. Bioresour. Technol. 2011, 102, 437–451. [Google Scholar] [CrossRef] [PubMed]
  15. Kjaer, L.L.; Pagoropoulos, A.; Schmidt, J.H.; McAloone, T.C. Challenges when evaluating product/service-systems through life cycle assessment. J. Clean. Prod. 2016, 120, 95–104. [Google Scholar] [CrossRef] [Green Version]
  16. DIN EN ISO. Environmental management—Life cycle assessment—Principles and framework (ISO 14040:2006); german and english version EN ISO 14040:2006. In Environmental Protection, Occupational Safety, Safety; Beuth: Berlin, Germany, 2006.
  17. DIN EN ISO. Environmental management—Life cycle assessment—Requirements and guidelines (ISO 14044:2006); german and english version EN ISO 14044:2006. In Environmental Protection, Occupational Safety, Safety; Beuth: Berlin, Germany, 2006.
  18. Arcese, G.; Lucchetti, M.C.; Massa, I.; Valente, C. State of the art in S-LCA: Integrating literature review and automatic text analysis. Int. J. LCA 2016. [Google Scholar] [CrossRef]
  19. Hannouf, M.; Assefa, G. Comments on the relevance of life cycle costing in sustainability assessment of product systems. Int. J. LCA 2016, 21, 1059–1062. [Google Scholar] [CrossRef]
  20. European Commission-Joint Research Centre. Institute for Environment and Sustainability International reference life cycle data system (ilcd) handbook—General guide for life cycle assessment—Detailed guidance. Available online: http://eplca.jrc.ec.europa.eu/uploads/ILCD-Handbook-General-guide-for-LCA-DETAILED-GUIDANCE-12March2010-ISBN-fin-v1.0-EN.pdf (accessed on 15 March 2012).
  21. Ekvall, T.; Tillman, A.-M.; Molander, S. Normative ethics and methodology for life cycle assessment. J. Clean. Prod. 2005, 13, 1225–1234. [Google Scholar] [CrossRef]
  22. Pawelzik, P.; Carus, M.; Hotchkiss, J.; Narayan, R.; Selke, S.; Wellisch, M.; Weiss, M.; Wicke, B.; Patel, M.K. Critical aspects in the life cycle assessment (LCA) of bio-based materials—Reviewing methodologies and deriving recommendations. Resour. Conserv. Recycl. 2013, 73, 211–228. [Google Scholar] [CrossRef]
  23. BBSR. Nutzungsdauern von Bauteilen für Lebenszyklusanalysen nach Bewertungssystem Nachhaltiges Bauen (Bnb). Available online: http://www.nachhaltigesbauen.de/fileadmin/pdf/baustoff_gebauededaten/BNB_Nutzungsdauern_von_Bauteilen__2011-11-03.pdf (accessed on 2 November 2012). (In German)
  24. Ingrao, C.; Lo Giudice, A.; Bacenetti, J.; Tricase, C.; Dotelli, G.; Fiala, M.; Siracusa, V.; Mbohwa, C. Energy and environmental assessment of industrial hemp for building applications: A review. Renew. Sustain. Energy Rev. 2015, 51, 29–42. [Google Scholar] [CrossRef]
  25. FNR Basisdaten Bioenergie Deutschland 2014. Available online: https://mediathek.fnr.de/media/downloadable/files/samples/b/a/basisdaten_9x16_2014_web.pdf (accessed on 15 September 2015). (In German)
  26. ISO. EN ISO 6946. Building Components and Building Elements—Thermal Resistance and Thermal Transmittance—Calculation Method; ISO: Geneva, Switzerland, 2007. [Google Scholar]
  27. Schmidt, A.C.; Jensen, A.A.; Clausen, A.U.; Kamstrup, O.; Postlethwaite, D. A comparative life cycle assessment of building insulation products made of stone wool, paper wool and flax (part 1). Int. J. LCA 2004, 9, 53–66. [Google Scholar] [CrossRef]
  28. Canto-Perello, J.; Martinez-Garcia, M.; Curiel-Esparza, J.; Martin-Utrillas, M. Implementing sustainability criteria for selecting a roof assembly typology in medium span buildings. Sustainability 2015, 7, 6854–6871. [Google Scholar] [CrossRef]
  29. European Union About Corine Land Cover. Available online: http://ec.europa.eu/agriculture/publi/landscape/about.htm (accessed on 18 August 2014).
  30. Frischknecht, R.; Jungbluth, N.; Althaus, H.-J.; Doka, G.; Heck, T.; Hellweg, S.; Hischie, R.; Nemecek, T.; Rebitzer, G.; Spielmann, M.; et al. Overview and Methodology. Available online: http://www.ecoinvent.org/files/200712_frischknecht_jungbluth_overview_methodology_ecoinvent2.pdf (accessed on 5 November 2013).
  31. Chapter 3, Energy Conversion. Available online: http://www.uni-magdeburg.de/isut/TV/Download/Kapitel_3_Combustion_Engineering.pdf (accessed on 16 October 2014).
  32. IPCC Climate Change 2007: The Physical Science Basis. Available online: http://www.ipcc.ch/pdf/assessment-report/ar4/wg1/ar4-wg1-errata.pdf (accessed on 4 March 2011).
  33. Carus, M.; Karst, S.; Kauffmann, A.; Hobson, J.; Bertucelli, S. The European Hemp Industry: Cultivation, Processing and Applications for Fibres, Shivs and Seeds. Available online: http://eiha.org/media/2014/10/13-06-European-Hemp-Industry.pdf (accessed on 9 March 2014).
  34. European Commission DG for Agriculture and Rural Development EU agriculture. Statistical and Economic Information. 2012. Available online: http://ec.europa.eu/agriculture/statistics/agricultural/2012/pdf/d11-1-411_en.pdf (accessed on 10 September 2013).
  35. Graf, T.; Reinhold, G.; Biertümpfel, A.; Zorn, W. Leitlinie zur effizienten und umweltverträglichen erzeugung von faserhanf. Available online: http://www.tll.de/ainfo/pdf/hanf0805.pdf (accessed on 5 October 2013). (In German)
  36. Bos, U. Aktualisierung der CO2-Bilanz des Dämmstoffes Thermo-Hanf Mit PES- und PLA-Faser; Fraunhofer Institut für Bauphysik IBP: Echterdingen, Germany, 2010; p. 11. (In German) [Google Scholar]
  37. Wötzel, K. Ökobilanz einer PKW-Seitenverkleidung aus einem Hanffaserverbundwerkstoff und Vergleich mit einem Referenzprodukt aus ABS-Kunststoff. Available online: https://www.tu-braunschweig.de/geooekologie/forschung/stoffstrom/wiss/1999 (accessed on 29 June 2016). (In German)
  38. ifu. IFEU Umberto®. version 5.5; ifu: Hamburg, Germany, 2011.
  39. Fargione, J.; Hill, J.; Tilman, D.; Polasky, S.; Hawthorne, P. Land clearing and the biofuel carbon debt. Sciences 2008, 319, 1235–1238. [Google Scholar] [CrossRef] [PubMed]
  40. Piemonte, V.; Gironi, F. Bioplastics and GHGs saving: The land use change (LUC) emissions issue. Energy Sources 2012, 34, 1995–2003. [Google Scholar] [CrossRef]
  41. De Rosa, M.; Knudsen, M.T.; Hermansen, J.E. A comparison of land use change models: Challenges and future developments. J. Clean. Prod. 2016, 113, 183–193. [Google Scholar] [CrossRef]
  42. IPCC. IPCC Guidelines For National Greenhouse Gas Inventories. Available online: http://www.ipcc-nggip.iges.or.jp/public/2006gl/pdf/2006gls_all_in.zip (accessed on 25 August 2010).
  43. Audsley, E.; Brander, M.; Chatterton, J.; Murphy-Bokern, D.; Webster, C.; Williams, A. How Low Can We Go? An Assessment of Greenhouse Gas Emissions from the UK Food System and the Scope to Reduce Them by 2050; WWF-UK: Surrey, UK, 2009. [Google Scholar]
  44. Tonini, D.; Hamelin, L.; Astrup, T.F. Environmental implications of the use of agro-industrial residues for biorefineries: Application of a deterministic model for indirect land-use changes. GCB Bioenergy 2015. [Google Scholar] [CrossRef] [Green Version]
  45. Verstegen, J.A.; van der Hilst, F.; Woltjer, G.; Karssenberg, D.; de Jong, S.M.; Faaij, A.P.C. What can and can’t we say about indirect land-use change in brazil using an integrated economic—Land-use change model? GCB Bioenergy 2016, 8, 561–578. [Google Scholar] [CrossRef]
  46. Schmidt, J.H.; Weidema, B.P.; Brandão, M. A framework for modelling indirect land use changes in life cycle assessment. J. Clean. Prod. 2015, 99, 230–238. [Google Scholar] [CrossRef]
  47. Finkbeiner, M. Indirect land use change—Help beyond the hype? Biomass Bioenerg 2014, 62, 218–221. [Google Scholar] [CrossRef]
  48. Schierhold, G.; (GEVO GmbH, Leer, Germany). Personal Communication, 2013.
  49. Ecoinvent Centre Ecoinvent data v2.2. Available online: www.ecoinvent.org (accessed on 22 April 2013).
  50. Hansen, A.; Meyer-Aurich, A.; Prochnow, A. Greenhouse gas mitigation potential of a second generation energy production system from short rotation poplar in eastern germany and its accompanied uncertainties. Biomass Bioenerg. 2013, 56, 104–115. [Google Scholar] [CrossRef]
  51. KTBL. Energiepflanzen—Daten für die Planung des Energiepflanzenanbaus; KTBL: Darmstadt, Germany, 2006. (In German) [Google Scholar]
  52. IINAS. Gemis—Global Emissions Model for Integrated Systems and Database (Version 4.93); IINAS: Darmstadt, Germany, 2014. [Google Scholar]
  53. Don, A.; Osborne, B.; Hastings, A.; Skiba, U.; Carter, M.S.; Drewer, J.; Flessa, H.; Freibauer, A.; Hyvönen, N.; Jones, M.B.; et al. Land-use change to bioenergy production in europe: Implications for the greenhouse gas balance and soil carbon. GCB Bioenergy 2012, 4, 372–391. [Google Scholar] [CrossRef]
  54. Walter, K.; Don, A.; Flessa, H. No general soil carbon sequestration under central european short rotation coppices. GCB Bioenergy 2014, 7, 727–740. [Google Scholar] [CrossRef]
  55. Fritsche, U.R.; Wiegmann, K. Treibhausgasbilanzen und kumulierter Primärenergieverbrauch von Bioenergie-Konversionspfaden unter Berücksichtigung möglicher Landnutzungsänderungen. Available online: http://www.wbgu.de/fileadmin/templates/dateien/veroeffentlichungen/hauptgutachten/jg2008/wbgu_jg2008_ex04.pdf (accessed on 17 September 2014). (In German)
  56. Vogt, R. Basisdaten zu THG-Bilanzen für Biogas-Prozessketten und Erstellung neuer THG-Bilanzen. Available online: http://www.ifeu.de/oekobilanzen/pdf/THG_Bilanzen_Bio_Erdgas.pdf (accessed on 22 August 2014). (In German)
  57. Delin, S.; Stenberg, B.; Nyberg, A.; Brohede, L. Potential methods for estimating nitrogen fertilizer value of organic residues. Soil Use Manag. 2012, 28, 283–291. [Google Scholar] [CrossRef]
  58. Hischier, R.; Althaus, H.-J.; Bauer, C.; Doka, G.; Frischknecht, R.; Jungbluth, N.; Nemecek, T.; Simons, A.; Sutter, J.; Stucki, M.; et al. Documentation of Changes Implemented in Ecoinvent Data v2.1 and v2.2; No. 16; Swiss Centre for Life Cycle Inventories: St. Gallen, Swizerland, 2010; p. 320. [Google Scholar]
  59. Nitsch, H.; Osterburg, B.; Roggendorf, W. Landwirtschaftliche Flächennutzung im Wandel—Folgen für Natur und Landschaft—Eine Analyse agrarstatistischer Daten (changing agricultural land use—Effects on nature and landscape—An analysis of agri-statistical data). Available online: http://www.foes.de/pdf/NABU,%20DVL_2009.pdf (accessed on 6 March 2015). (In German)
  60. BfN (Federal Agency for Nature Conservation). Grünland-Report: Alles im grünen Bereich? (grassland report). Available online: http://www.bfn.de/fileadmin/MDB/documents/presse/2014/PK_Gruenlandpapier_30.06.2014_final_layout_barrierefrei.pdf (accessed on 12 January 2015). (In German)
  61. FAO Faostat. Available online: http://faostat3.fao.org/home/E (accessed on 2 January 2015).
  62. Colwill, J.A.; Wright, E.I.; Rahimifard, S.; Clegg, A.J. Bio-plastics in the context of competing demands on agricultural land in 2050. Int. J. Sustain. Eng. 2011, 5, 3–16. [Google Scholar] [CrossRef]
  63. Silvestre, J.D.; de Brito, J.; Pinheiro, M.D. Environmental impacts and benefits of the end-of-life of building materials—Calculation rules, results and contribution to a “cradle to cradle” life cycle. J. Clean. Prod. 2014, 66, 37–45. [Google Scholar] [CrossRef]
  64. Weiss, M.; Haufe, J.; Carus, M.; Brandão, M.; Bringezu, S.; Hermann, B.; Patel, M.K. A review of the environmental impacts of biobased materials. J. Ind. Ecol. 2012, 16, S169–S181. [Google Scholar] [CrossRef]
  65. Canadian Hemp Trade Alliance. Grow Hemp. Sub-page—Markets. Available online: http://www.hemptrade.ca/grow-hemp (accessed on 12 November 2014).
  66. Danish Energy Agency. Energy Statistics. Available online: http://www.ens.dk/sites/ens.dk/files/info/tal-kort/statistik-noegletal/aarlig-energistatistik/energy_statistics_2012.pdf (accessed on 12 December 2014).
  67. Mankowski, J.; Kolodziej, J.; Baraniecki, P. Industrial hemp grown in remediated land used for energy. Chemik 2014, 10, 901–904. [Google Scholar]
  68. Lühr, C.; Pecenka, R.; Gusovius, H.-J.; Wallot, G.; Rinberg, R.; Tech, S. Development of an axial fractionator for hemp shive cleaning and industrial applications of shives. J. Agric. Sci. 2013, 5, 9–16. [Google Scholar] [CrossRef]
  69. Mazor, M.H.; Mutton, J.D.; Russell, D.A.M.; Keoleian, G.A. Life cycle greenhouse gas emissions reduction from rigid thermal insulation use in buildings. J. Ind. Ecol. 2011, 15, 284–299. [Google Scholar] [CrossRef]
  70. Ascione, F.; Bianco, N.; De Masi, R.F.; Mauro, G.M.; Vanoli, G.P. Design of the building envelope: A novel multi-objective approach for the optimization of energy performance and thermal comfort. Sustainability 2015, 7, 10809–10836. [Google Scholar] [CrossRef]
  71. Daioglou, V.; Wicke, B.; Faaij, A.P.C.; van Vuuren, D.P. Competing uses of biomass for energy and chemicals: Implications for long-term global CO2 mitigation potential. GCB Bioenergy 2014, 7, 1321–1334. [Google Scholar] [CrossRef]
  72. Feliciano, D.; Hunter, C.; Slee, B.; Smith, P. Climate change mitigation options in the rural land use sector: Stakeholders’ perspectives on barriers, enablers and the role of policy in north east scotland. Environ. Sci. Policy 2014, 44, 26–38. [Google Scholar] [CrossRef]
  73. Kilpeläinen, A.; Strandman, H.; Kellomäki, S.; Seppälä, J. Assessing the net atmospheric impacts of wood production and utilization. Mitig. Adapt. Strateg. Glob. Change 2014, 19, 955–968. [Google Scholar] [CrossRef]
  74. Jørgensen, S.; Hauschild, M.; Nielsen, P. The potential contribution to climate change mitigation from temporary carbon storage in biomaterials. Int. J. LCA 2015, 20, 451–462. [Google Scholar] [CrossRef] [Green Version]
  75. Benoit-Norris, C.; Cavan, D.A.; Norris, G. Identifying social impacts in product supply chains: Overview and application of the social hotspot database. Sustainability 2012, 4, 1946–1965. [Google Scholar] [CrossRef]
  76. Meynard, J.M.; Messéan, A.; Charlier, A.; Charrier, F.; Farès, M.; Bail, M.L.; Magrini, M.B.; Savini, I. Freins et leviers à la diversification des cultures. Etude au niveau des exploitations agricoles et des filières. Synthèse du rapport d’étude. Available online: http://www.inra.fr (accessed on 19 July 2013). (In French)
  77. TLL. Begleitung der Einführung des Praxisanbaus von Hanf in Thüringen—Abschlussbericht (monitoring of adoption of hemp cultivation in thuringia—Final report). Available online: http://www.tll.de/ainfo/pdf/hanf0107.pdf (accessed on 14 January 2015). (In German)
Scheme 1. Two options to make the multi-product systems comparable by system expansion. This study followed the upper approach, i.e., subtracting of alternative co-products (graph adapted from ILCD Handbook [20]).
Sustainability 08 00613 sch001
Scheme 2. Two strategies to achieve lower GHG emissions by combined use of cropland and fossil resources: cropland for material production (fibers; biomaterial strategy; left) or for bioenergy (short rotation coppice, maize; bioenergy strategy; right), and fossil fuels for energy generation or for material production (synthetic foam) using the example of two building insulations either made of hemp fiber (Cannabis sativa L.) or of expanded polystyrene. Co-products are indicated by oval frames.
Sustainability 08 00613 sch002
Figure 1. Resource demand—Cropland—from system processes in the biomaterial and bioenergy strategies as well as credits from co-products; numbers indicate net result for each strategy and its variants from scenario analyses (see descriptions in Table 5).
Sustainability 08 00613 g001
Figure 2. Resource demand—Fossil fuels (crude oil, natural gas)—from system processes in the biomaterial and bioenergy strategies as well as credits from co-products; numbers indicate net result for each strategy and its variants from scenario analyses (see descriptions in Table 5).
Sustainability 08 00613 g002
Figure 3. GHG emissions from system processes in the biomaterial and bioenergy strategies as well as credits from co-products; numbers indicate net result for each strategy and its variants from scenario analyses (see descriptions in Table 5).
Sustainability 08 00613 g003
Table 1. Characteristics of hemp (Cannabis sativa L.) cultivation and processing (biomaterial strategy).
UnitAmountReferences
Nitrogen | phosphate | potassium fertilizer | hemp seedskg·ha−180 | 100 | 180 | 45[35]
Straw (15% water content) | Fiber yield (technical fibers 22%)Mg·ha−18.00 | 1.76[35]
Co-product hemp seeds% w/w of total yield10[36]
Co-product hemp shives% w/w of straw yield57[33]
Tractor employment (all necessary activities)h·ha−16[37]
Emissions from and resource demand of the production of Polyester fiber | Sodium hydroxidekg CO2e·kg−14.43 | 1.43based on Eco-profiles of EU plastics industry [38]
m2·kg‑18.3 × 10⁻⁵ | 3.8 × 10⁻⁵
MJ·kg−179.42 | 10.22
Transports
  • Field to processing | processing to insulation production
km150 | 235[36]
  • Production to distributor | distributor to building
km400 | 40analogue to EPS
  • Building to end-of-life
km40analogue to EPS
a EPS—expanded polystyrene.
Table 2. Co-products in the biomaterial strategies and their alternatives (A), and credits for end-of-life energy recovery.
Co-product | Alternative AUnit aAmountRemarks bRef.
Hemp Seedkg·FU−12.55Substitution rate 100%; substituted by sunflower seeds in birds” feed[48]
A: Sunflower Seedkg CO2e·kg−11.02 | 1.24Production conditions: integrated Swiss | conventional Spanish #235 | #6961[49]
m2·kg−13.6 | 12.1
MJ·kg−14.835 | 4.928
Hemp Shiveskg·FU−19.00Substitution rate 62%; by wheat straw in animal bedding[33]
A: Wheat strawkg CO2e·kg−10.08Integrated Swiss production conditions; inputs and outputs of wheat cultivation are economically (7.5%) allocated to the straw (#240))[49]
m2·kg−10.2
MJ·kg−10.519
Co-generated heatMJ·FU−122.7Excess heat from electricity generation (from fossil fuels)[38]
A: Heat at industrial furnace from fuel oil | natural gaskg CO2e·MJ−10.09 | 0.08#1582 | #1352[49]
m2·MJ−13.4 × 10⁻⁷ | 5.7 × 10⁻⁸
MJ·MJ−11.287 | 1.285
Credits for energy-recovery (Crude oil | natural gas)MJ·kg−10.24 | 18.96From waste co-incineration after detaching from building; total credit is 23.7 MJ·kg−1 according to dataset 2.22.01; 1% is from crude oil, 80% from natural gas[11]
a m2 taken from land use category “arable land” in the ecoinvent datasets, representing CORINE definition level 21 [29]; b # indicates reference number of respective ecoinvent datasets [49].
Table 3. Characteristics of bioenergy co-generation (heat and electricity) from poplar short rotation coppice (Populus spp.) via gasification (option SRC) [50,51], and from maize silage (biogas; Zea mays L.) (option maize) [52], both for German technology and production characteristics.
Co-generation CharacteristicsUnitBioenergy option
Short rotation CoppiceMaize Silage
Yield (wood chips50% wet ; maize yielddry)Mg·ha−114.514.9
Power plant characteristics:
  • Mean transport distance of feedstock
km3050
  • Operating hours of gasification; biogas plant
h·year−170006000
  • Electric efficiency
%3333
  • Installed heat capacity
MW6.41.5
  • Installed electric capacity
MW50.5
Table 4. Co-products in the bioenergy strategies and their alternatives (A), and credits for end-of-life energy recovery.
Co-product | Alternative AUnit eAmountRemarksRef.
Co-generated electricity
  • from wood chips gasification
  • from biogas
kWh·FU−18.1 | 7.2Already reduced by own electricity demand 0.14 kWh·kg−1 EPS | 0.3 kWh·kg−1 EPS100 #11792 | #11791[49]
7.6 | 6.7
A: Electricity from oil- | gas-fired plantkg CO2e·kWh−11.13 | 0.56#1620 | #1384[49]
m2·kWh−11.9 × 10⁻⁶ | 1.7 × 10⁻³
MJ·kWh−114.896 | 9.888
Digestate containingkg N·kWh−1 heat0.003Values already corrected to represent plant-available nutrient content; 30% according to Ref. [56]
kg P2O5·kWh−1 heat0.005
kg K2O·kWh−1 heat0.013
A: CAN a-fertilizerkg CO2e·kg−1 N b8.66#42[49]
m2·kg−1 N b9.1 × 10−5
MJ·kg−1 N b51.4
A: P2O5c-fertilizerkg CO2e·kg−1 P2O52.03#57[49]
m2·kg−1 P2O59.2 × 10−5
MJ·kg−1 P2O518.612
A: K2O d-fertilizerkg CO2e·kg−1 K2O1.44#53[49]
m2·kg−1 K2O6.2 × 10−5
MJ·kg−1 K2O17.789
Credits for energy-recovery (Crude oil | natural gas) MJ·kg−10.3 | 23.25From waste co-incineration after detaching from building; total credit is 30.2 MJ·kg−1 according to dataset 2.22.06; 1% is from crude oil, 77% from natural gas[11]
a calcium ammonium nitrate; b nitrogen; c phosphate; d potassium oxide; e m2 taken from land use category “arable land” in the ecoinvent datasets, representing CORINE definition level 21 [29]; # indicates reference number of respective ecoinvent datasets [49].
Table 5. Characteristics of the biomaterial and bioenergy strategies and parameters varied (bold letters) in the different variants of the scenario analyses.
Biomaterial StrategyBioenergy Strategy
Hemp83Hemp95Hemp83_SunflEPS45EPS_LUCEPS100
Material Characteristics
  • Hemp share in mat (%)
839583N/AN/AN/A
  • Soda (%)
555N/AN/AN/A
  • Polyester fiber (%)
12012N/AN/AN/A
  • EPSa recyclate share (%)
N/AN/AN/A4545100
  • Bulk density (kg·m−3)
303030282828
  • Thermal conductivity (W·m−1·K−1)
0.040.040.040.0360.0360.036
  • Weight of 1 m2 insulation with U = 0.2 W·m−2·K−1 (kg)
666555
Substitute for co-product; Sunflower seed yield (Mg·ha−1)3.153.151.03N/AN/AN/A
GHG b emission factor (kg·CO2e·kWhth−1)N/AN/AN/A0.017 (SRC c)0.017 (SRC c)0.017 (SRC c)
0.253 (maize)0.277 (maize)0.253 (maize)
Electricity demand for production process (kWhel·kg−1 EPS a)N/AN/AN/A0.140.140.31
Description and main effect of variationBasic assumptionsNo additional synthetic fibers in insulation result in higher land demand and reductions in fossil fuels and GHG b emissions.Alternative source for sunflower seed substituting hemp seed from region with lower yield levels (Spain instead of Switzerland)Basic assumptionsConsidering land use change for maize cultivation results in additional GHG b emissions. Insulation production from 100% recyclate needs more electricity, resulting in higher fossil fuel demand and GHG b emissions.
a expanded polystyrene; b greenhouse gases; c short rotation coppice.
Table 6. Net results and deviations (absolute and relative) for the three criteria cropland use, fossil fuel demand and GHG emissions of the two strategies (basic assumptions in bold) and their variants in the scenario analyses: Hemp95—pure hemp fiber insulation; Hemp83_Sunfl—credited process with lower sunflower yield level; EPS100—pure EPS recyclate; EPS45_LUC—biogas from maize, partly grown on previous grassland. Values in parentheses have a global iLUC factor [43] assigned for land demanded for respective biomass cultivation.
Cropland UseFossil Fuels DemandClimate Change
Net ResultDeviationNet ResultDeviationNet ResultDeviation
m2·FU−1m2·FU−1%MJ·FU−1MJ·FU −1%kg CO2e·FU−1kg CO2e·FU−1%
Biomaterial strategy
Hemp8321.25 8.10 10.47 (15.02)
Hemp9524.323.0714−44.85−52.95−6547.78 (13.00) −2.69 (−2.03)−26 (−14)
Hemp83_Sunfl−0.53−21.77−1027.86−0.24−39.90 (14.46) −0.57 (−0.57)−5 (−4)
Bioenergy strategy
Gasification of wood chips from short rotation coppice
EPS450.72 18.64 9.57 (9.68)
EPS1000.7200−201.86−220.50−11830.39 (0.49)−9.18 (−9.18)−96 (−95)
Biogas from maize silage
EPS456.78 25.04 12.20 (13.17)
EPS45_LUC6.780025.040.00012.49 (13.46)0.28 (0.28)2 (2)
EPS1006.7800−195.45−220.49−8813.02 (3.99)−9.18 (−9.18)−75 (−70)

