Article

Impacts on the Social Cohesion of Mainland Spain’s Future Motorway and High-Speed Rail Networks

by
José Manuel Naranjo Gómez
Polytechnic School, University of Extremadura, 10003 Caceres, Spain
Sustainability 2016, 8(7), 624; https://doi.org/10.3390/su8070624
Submission received: 12 May 2016 / Revised: 27 June 2016 / Accepted: 28 June 2016 / Published: 2 July 2016

Abstract

:
A great expansion of the road and rail network is contemplated in the Infrastructure, Transport and Housing Plan (PITVI in Spanish), in order to achieve greater social cohesion in 2024 in Spain. For this reason, the aim of this study is to classify and to identify those municipalities that are going to improve or worsen their social cohesion. To achieve this goal, the municipalities were classified according to the degree of socioeconomic development, and their accessibility levels were determined before and after the construction of these infrastructures. Firstly, the socioeconomic classification demonstrates that there is predominance in the northern half of the peninsula in the most developed municipalities. Secondly, the accessibility levels show that the same center-peripheral models are going to be kept in the future. Finally, poorly-defined territorial patterns are obtained with respect to the positive or negative effects of new infrastructures on social cohesion. Therefore, it is possible to state that the construction plan is going to partially fulfill its aim, since a quarter of the population is going to be affected by a negative impact on socioeconomic development. As a consequence, people who live here are going to have major problems in achieving social cohesion.

1. Introduction

International agencies, national and local governments have begun a process of the definition and deepening of the concept of sustainable development. Nonetheless, this term began to be developed in 1987 by the World Commission on Environment and Development (WCED), and it is understood as a certain compromise among environmental, economic and social goals of the community, allowing for the wellbeing of present and future generations [1]. Moreover, this concept is broken into economic, environmental and social categories. In this regard, economic and social categories determine socioeconomic wellbeing; if all residents in a given territory are socially cohesive, socioeconomic wellbeing follows [2].
Social cohesion can be understood as the ability of a social, economic and political system to achieve three complementary objectives: promoting citizens’ empowerment and social participation, creating social and institutional networks that generate social capital and promote social inclusion and contributing to the implementation of social rights in their broadest sense [3]. Thus, social cohesion can be understood as forming the basis for people to access the necessary resources produced by society and in turn determines the degree of integration among individuals within a group and the values associated with the connections between them [4].

1.1. Background

Adopted transport policies pay particular attention to social cohesion through different models of use and development [5]. While the economic profitability and environmental impact of transport infrastructure were traditionally taken into account, social cohesion has now become an integral part of the deployment of new infrastructures or the improvement of existing ones, especially of motorways and high-speed railways. In addition, one of the strategic aims of the PITVI contemplates the infrastructures as indispensable support to achieve better social cohesion in Spain [6]. This plan advocates the building of new motorways and high-speed rail (HSR) lines for passengers, in order to achieve it.

1.2. Objectives

In this regard, this study focuses on the temporal dimension of transport, as well as the spatial aspect. The overall objective of this study is to assess how accessibility improvement in the deployment of new motorways and high-speed railway corridors affects social cohesion in Spanish peninsular municipalities. From this aim, specific objectives have been identified: (1) determining the degree of socioeconomic development; (2) measuring the potential accessibility of each municipality before and after the construction of new transport infrastructures; (3) assessing the degree of accessibility improvement in each municipality.
However, it is unclear how and why greater accessibility generated by new transport infrastructures in a given area affects its economic development [7]. This lack of clarity might exist because these impacts depend on other prevailing conditions, taking advantage of new development opportunities provided by the improved accessibility of new transport infrastructures [8].
Nonetheless, transport networks are crucial to the economic structure of the modern world [9] and are an important tool for social cohesion because they act as catalysts in unifying spaces [10] and providing structure to the territory, while reflecting the existing imbalance between urban systems and socioeconomic activities [7]. Therefore, transport systems should be responsive to the concerns and objectives of a policy that is efficient in terms of social demand [11], but mainly with the reduction of economic disparities or differences in economic and social welfare among regions [12,13] to avoid territorial imbalances [14].
Consequently, another fundamental concept in understanding the impact of transport infrastructure on social cohesion is accessibility [15]. This concept was born in 1950 [16], is very useful in different fields (e.g., transport planning, urban and regional planning) and has acquired a variety of meanings over the years. Therefore, there is no single approved definition, and it may be argued that accessibility is an elusive concept, one of those common terms that everyone uses until the problem of its definition and measurement arises [17]. However, all definitions of accessibility seek to give a measure of the separation of human activities or settlements that are connected through a transport system [18]. There are also four basic elements in the different definitions of accessibility and its measures: (1) the territorial distribution of different locations by measuring the distance between or proximity of two or more points [19] or how the displacement probability between two points decreases as their distance increases [20]; (2) the transport system, allowing the bridging of the gap between two points with a given cost, defining the ease with which activities can be reached from a given location with a specific transport system [21,22]; (3) the usefulness of different locations according to their characteristics, i.e., the possibilities that each potential destination offers of meeting the needs of citizens, businesses and public services [23]; and (4) the potential possibility that the inhabitants of a given territory can participate in specific activities in other places. The latter social and economic considerations can be added to quantify the net benefits of a specific place depending on the town’s location, the use of the transport network by the host population and the benefits the town enjoys from the infrastructure’s social and economic impact [24,25].
Accessibility measures become indicators whose mathematical formulation is variable: classification by different authors is extensive [25,26,27,28]. Among the different classifications of accessibility measures, that carried out by Curtis et al. [28] stands out. The researchers classified these indicators into six basic groups of measures: (1) spatial separation; (2) contour; (3) gravity; (4) competition; (5) time-space; (6) utility; (7) network.
Among all of the indicators mentioned above, those based on contour measures enable the assessment of the degree of social cohesion caused by the deployment and improvement of the transport system. In transport infrastructure planning, the analysis of social cohesion through these indicators is a recurrent theme in the research [29,30,31], because it explains the inter-relationships in human activities [32,33]. In this regard, greater accessibility caused by the deployment of new motorways and high-speed rail lines can reduce economic and social welfare disparities among municipalities [15,34,35]. Contrastingly, it can also reinforce the polarization of a few places that have good access to motorways and railway stations [36]. In fact, motorways and high-speed rail corridors do in fact provide important comparative advantages over other places that do not have them. Therefore, while not sufficient for economic growth and wealth creation alone, these infrastructures can boost substantial aspects of social and economic structures [31,37].
With respect to the studies that addressed the incidence of transport in social cohesion, the following stand out: first, the study that answered questions about the inequality in income distribution and social mobility [38]; second, research that analyzed the relation between investments and transport sector policies [39]; third, those studies that analyzed the impact of accessibility in municipalities caused by new infrastructure [40,41]; fourth, others that estimated the cost of mobility based on road pricing policy [35]; and lastly, others that evaluated the changes on social cohesion arising from new transport infrastructures and their relation to potential socioeconomic implications [42,43].

1.3. Organization of This Paper

This work is divided into six sections. After the Introduction, the methodology is outlined, starting with the structural characterization of municipalities, classifying them according to their potential accessibility and ending with an estimation of social cohesion. In the third section, the results are presented and the methodological proposals are analyzed, comparing the current road and rail situation with the future one resulting from the deployment of new land transport infrastructures planned in the PITVI. The paper ends with some general discussion, identification of limitations to the study and next steps, and it concludes with some comments, followed by a bibliography that can facilitate future research.

2. Materials and Methods

In this section, the study area and the methodological phases will be described.

2.1. Study Area

The PITVI action area, regarding new motorways and HSR lines in mainland Spain, constitutes the study area (Figure 1a, Figure 1b).
As for the scale of work, municipal level work was chosen because local connections prevail over the transport network [44]. Therefore, although the scale analysis could be regional when considering available HSR stops or services, the use of the local scale is deemed more appropriate because it takes into account specific stations and their locations in this mode of transportation and the particular connection between motorways and secondary roads.
There are two fundamental aspects of the methodological phases shown (Figure 2): firstly, obtaining the socioeconomic classification of the municipalities and, secondly, determining the potential accessibility variation for the municipalities, before and after the construction of the new transport infrastructures planned in the PITVI. Municipalities were once classified according to socioeconomic degree and potential accessibility. These two aspects are compared in order to estimate potential social cohesion in each municipality.

2.2. Designing and Creating Base Maps

In the initial task related to the design and generation of base cartography, the modelling of the transport system is noteworthy, as it makes use of vector-based mapping. In this regard, all types of roads and railways are represented by means of lines. This linear mapping evokes a multimodal transport network, the railway stations being the only connection points between either infrastructure (road and rail), whether high-speed or conventional rail. The line segments that are limited by two intersections with other line segments are considered sections, and the points where three or more line segments converge are considered nodes. Likewise, (non-geographic) alphanumeric information is associated with each network section by means of a unique identifier, its maximum allowable speed according to the type of track and the section length. Then, these two latest data are used to calculate the impedance. This is defined as the resistance of a rail or road section being crossed by a user of the system. The ArcGIS Network Analyst Tools estimate the shortest path route according to the transport network. The second type of cartography represents the only intermodal points, the railway stations, whether HSR or conventional rail. These are symbolized by means of geo-referenced points. The third type of mapping represents the main urban center of each municipality, also by means of geo-reference points. Finally, the fourth type of mapping shows the boundary of the municipalities by means of polygonal graphic entities.

2.3. Socioeconomic Classification of the Spanish Peninsular Municipalities

The following classification of municipalities is proposed [45]. R, which is a programming language and software environment for statistical computing support, was used. Data belonging to the municipality and the districts within it were added to the polygonal graphic entities mentioned (Table 1). The variables were selected after consulting a wide range of literature on the determination of socioeconomic conditions characterizing the dynamics of various municipalities under study [46,47,48,49].
This information is public and officially available online. Nonetheless, to avoid outliers, to reduce the dimensionality and so that the obtained classification would be easily interpreted and understood, the following procedures were carried out.
The 11 variables were normalized to obtain similar weight in the socioeconomic classification of municipalities. Then, the relationship or dependence between the variables was analyzed by using Spearman’s rank correlation coefficient (Table 2). It was found with this coefficient that there was a strong correlation between the numbers of variables: (1) population and market share per capita; (2) industrial average per capita and second homes; (3) market share per capita and industrial average per capita; and (4) population employed in the primary sector and population employed in the secondary sector.
Next, a principal component analysis (PCA) was performed in order to avoid extraneous data, keeping the most relevant information. In this sense, the data are projected onto a lower dimension while retaining most of the data required for the reconstruction of data with an acceptable level. It was found that by using seven components, it was possible to collect 85% of the original variance. This statistical synthesis technique is used to reduce the size, that is the number of variables, losing the least amount of data possible. Thus, the new major derived components are a linear combination of the original variables and are also independent of each other.
After the reduction to seven components, an independent component analysis (ICA) was conducted. In this regard, ICA is a statistical generative model. It is basically a proper probabilistic formulation of the ideas underpinning sparse coding [54]. To estimate the ICA basis from data, we need to collect samples (patches) from the data to model. The collected patches are used to build a data matrix X, which is the input to the FastICA [55] algorithm. In this algorithm, input data are centered first by subtracting the mean of each column of the data matrix X. The data matrix is then whitened (PCA) by projecting the data onto its principal component directions using a pre-whitening matrix (K). The number of components (features) to extract is selected a priori. The ICA algorithm then estimates an un-mixing matrix W, so that XKW = S, being S the estimated sources matrix. Using the previous notation, R being the data associated with a previously centered datum, we can obtain the feature vector ( F ) that characterizes the region of interest as F = K W R .
Once the PCA was completed, the correlation between the main components was verified to test their independence. Furthermore, the correlation between the seven components and the eleven original variables (Table 3) was simultaneously studied.
All municipalities were then classified using seven independent components grouped through the method of self-organizing maps (SOM), like an unsupervised classification. This methodology, used in neural networks to reduce the dimensionality of the data, is highlighted for its ability to represent the most significant vectors [56]. It also consists of two layers, an input and an output layer, which are interconnected. Thus, each neuron/element in the input layer has a connection with one neuron/element in the output layer. Each connection is in turn linked to a weight. Each output neuron is linked to a weight vector whose components are the connection weights with the neurons of the input layer. These weights are updated during the training process, which is the ultimate goal of learning. The main advantage of SOM is that the data are easily interpreted and understood. The reduction of dimensionality and grid clustering makes it easy to observe similarities in the data. In this sense, SOM is capable of handling several types of classification problems while providing a useful, interactive and intelligible summary of the data. According to [57], Kohonen stated that, I just wanted an algorithm that would effectively map similar patterns onto contiguous locations in the output space.
Recently, the SOM has been applied in the spatial and social sciences, because of the benefits of SOM, including: exploring the structures and uncovering hidden patterns of large and highly dimensional datasets about socioeconomic characteristics, making no assumptions about the underlying population distribution of the dataset, presenting the visualization of data and the complex entities in an understandable way [58].
Nonetheless, the major disadvantage of SOM is that it requires necessary and sufficient data in order to develop meaningful clusters. Lack of data or extraneous data will add randomness to the groupings. The ability to determine a good dataset is a deciding factor in determining whether to use an SOM or not [56,57]. Precisely in order to avoid extraneous data, previously-described statistical phases were carried out. In addition, after applying these statistics, phases’ dimensionality remained high, and also, a large quantity of data remains. Therefore, SOM was applied in the final phase.
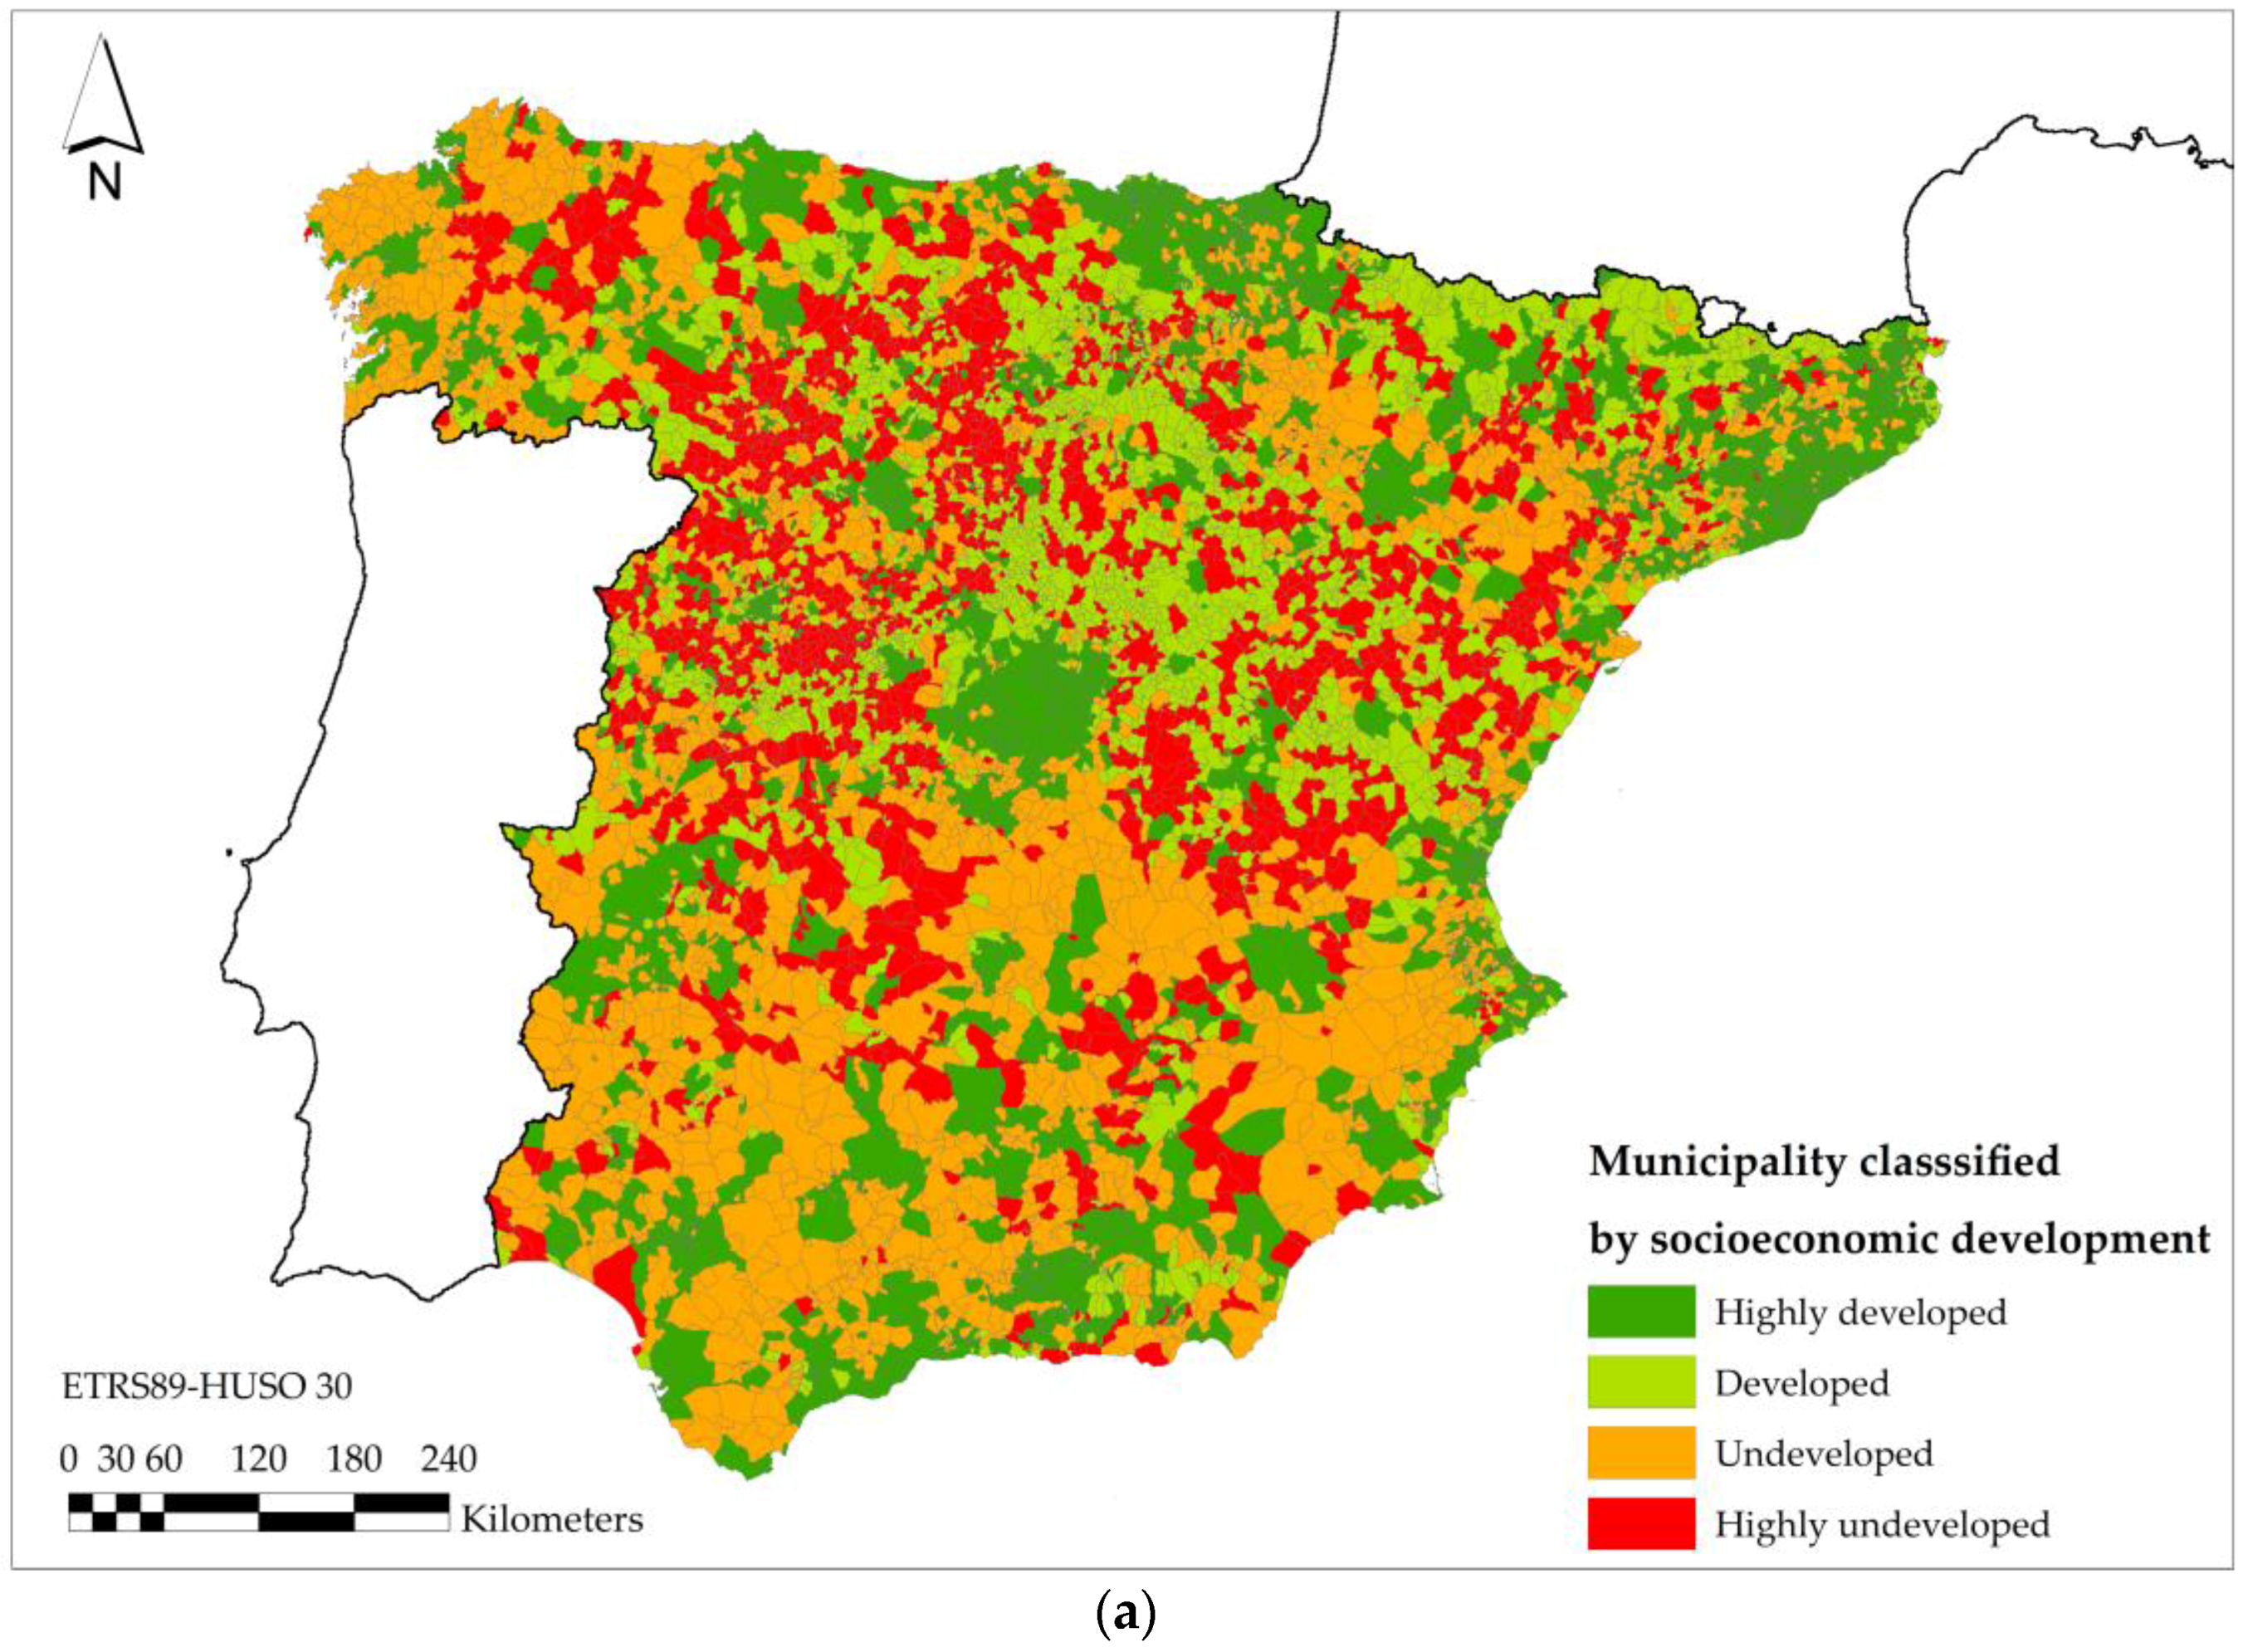
SOM generated four classes, depending on the values representing the original variables in them. They were reclassified according to social cohesion as follows: highly developed, developed, undeveloped and highly undeveloped.
Once the municipalities were classified, they were characterized statistically, by arithmetic mean and standard deviation, in the 11 original variables (Table 4).
Firstly, the highest values of population (V1), market share per capita (V2), industrial index (V4) and percentage of population employed in the tertiary sector (V10) correspond to Class 1. In addition, this class has the lowest values of the rate of vehicles per capita (V3), unemployment rate (V5), dependency ratio (V6), percentage of population employed in the primary sector (V8) and construction (V11). Therefore, this class contains the municipalities with greater socioeconomic dynamism.
Secondly, Class 2 contains municipalities that have the second highest values of population (V1), market share per capita (V2), industrial index (V4) and percentage of population employed in the tertiary sector (V10). Additionally, they have the second lowest values of the rate of vehicles per capita (V3), unemployment rate (V5), dependency ratio (V6) and percentage of population employed in the primary sector (V8) and construction (V11). Consequently, these municipalities also have a great socioeconomic dynamism, though this is lower than the previous ones.
Thirdly, Class 3 has the highest rate of vehicles per capita (V3), unemployment rate (V5) and percentage of population employed in the secondary sector (V9) and the construction industry (V11). Besides, these municipalities have the lowest rates of market share per capita (V2), industrial average per capita (V4) and percentage of second homes (V7). This class represents municipalities that have based their economies on the conjectural growth of sectors affected by the economic crisis in Spain from 2007. For this reason, this class represents the municipalities that currently have structural deficiencies in employment.
Lastly, Class 4 consists of municipalities with the highest average of dependency ratios (V6), proportion of second homes (V7) and percentage of population employed in the primary sector (V8). However, these municipalities have the lowest populations (V1) and the lowest proportions of people employed in the secondary (V9) and tertiary sectors (V10). Undoubtedly, these municipalities have the greatest demographic and geographic disadvantages in mainland Spain.

2.4. Calculation of Potential Accessibility

Once the classes were characterized, the potential accessibility is calculated.

2.4.1. Indicator of Potential Accessibility

The indicator of potential accessibility applies to each Spanish municipality and assesses accessibility with the new network of motorways and HSR lines. It should be noted that towns with greater populations were considered in compiling data, as the smaller populations were assigned to the most important center in each municipality. Potential accessibility measures the degree of connection between the main center of the municipality and all other peninsular municipalities. This accessibility measurement, following the requirements stated by [15], is adapted to measure social cohesion depending on accessibility, as it takes into account the availability of the transport mode for residents in the different regions and the spatial distribution of travel destinations. The mathematical expression of the potential accessibility indicator (PPr) is adopted as follows:
P P r = j = 1 n P j t i j β
where PPr refers to the accessibility of municipality i, P j refers to the population of the main destination center (to which those of the other towns of the municipality have been added if existing). On the denominator side, t is the shortest time of travel between the origin and destination town, and β is a distance parameter that represents the friction of movement. Likewise, the following formulation calculates t ij that is the minimum travel time between an original nucleus (i) and the destination nucleus (j) [59]:
I i j = t u i + t r + t h + t u j
where:
  • t u i = urban time penalty from the origin (i) to the exit of the town.
  • t u j = urban time penalty up to coming to the final point of the trip (j).
  • t r = travel time on the road.
  • t h = travel time by rail, either conventional or HSR.
t h = t u s i + t u s j + t c + t m
  • t u s i = urban time penalty needed to get the railway station of the origin of travel by rail.
  • t u s j = urban time penalty needed to get the final point of the travel (j), from the railway station destination of travel by rail to the final point of the travel (j).
  • t c = transfer time or waiting time of a line of the high-speed railway to another and the waiting time at the railway station
  • t m = time within the HSR in motion.
In this regard, the transfer time and waiting time at the HSR stations are calculated in the same way, according to the service frequency of the rails. These times are estimated as inversely proportional to the frequency of service, and in the case that the obtained value is greater than one hour, one hour is considered the transfer time and the waiting time. The frequency of the HSR and middle distance rail services are estimated by means of the formula [60]:
N S ( i , j ) = α ( P i P j D r 2 I R n 2 ) κ
where:
  • P i = population that lives in the city where the station is at the beginning of the journey by rail, expressed in thousands of inhabitants.
  • P j = population that lives in the city where the station is at the end of the journey by rail, expressed in thousands of inhabitants.
  • D r = geographical distance between the departure and destination station, expressed in kilometers.
  • I R n 2 = travel time using the HSR network, expressed in hours.
The number of high-speed rails is estimated through the calibration of the parameters named α and κ. To this end, the present frequency of existing services is used. Thus, the values obtained for α and κ are 3.007 and 0.3225; and 0.69 for the coefficient of correlation.
On the other hand, the absolute accessibility index improves, considering the time of global shift, the cost of crossing each urban environment. This intra-urban time can be decisive in the choice of one means of transport over another. The estimate of the urban time has been calculated considering this travel time as variable depending on the characteristics of the urban core. Obviously, good accessibility plays an important role in the development and implementation of town services and equipment so that those areas with greater accessibility and population also receive more services and equipment [44].

2.4.2. Calculation of the Distance Decay

We chose time as a distance decay element to be investigated. A particular value of the parameter β can be calculated based on the assumption that the half-time value of destination attractiveness (i.e., its “mass”) should be acquired at a median travel time typical for a specific travel purpose [61]. According to [62], there is a number of distance decay functions specified in the literature [25,63]. Among the most commonly used are an inverse power function [42,64,65] and a negative exponential function [66,67,68]. A normal or Gaussian function [19,25], a logistic function [69]or the Tanner,Box–Cox and Richards functions [70] are much more rarely used. In practice, at the national and regional level, both the power [42,63,65] and exponential functions [25,61,63,70,71] are in use. However, bearing in mind the behavioral point of view, very strong power function-related decay at short travel distances is far from being realistic, while a Gaussian function “decays too slowly at short distances and too rapidly at longer distances” [25] (p. 146). Therefore, the best option is to use the exponential function [62].
Nonetheless, the distance decay parameter was initially calibrated for both the power and the exponential functions. They were recorded as 2.567814 and 0.027362 for exponential decay functions. Since the exponential function fitted the observed interactions better, i.e., it has less standardized root mean square error, less mean travel cost error and higher r square, the distance decay parameter in the form of the exponential function was used. Besides, this value is comparable to the values of the parameters derived from the literature, 0.023105, 0.034657, 0.039, 0.04621, 0.049 and 0.034657 by [25,38,61,62,72], respectively.

2.4.3. Characterization of Areas According to Their Relative Levels of Accessibility

As municipalities were classified by means of four levels of socioeconomic development, they are classified into four categories according to their relative levels of accessibility (Table 5). The indicator of potential accessibility is then calculated.
In this way, the lesser level of relative accessibility is Level 1, and the greater one is Level 4. These relative levels of accessibility (Table 5) were established by the categorization of this variable according to Federal Ministry of Transport, Building and Housing [73].
In this sense, 0% corresponds to the minimum value of all of the values recorded. The value of 100% corresponds to the maximum value of all of the values recorded. The value of 50% corresponds to the arithmetic mean value calculated for all of the values recorded. The length of the interval between the arithmetic mean value (50%) and the minimum value (0%) is divided into two equal parts. This value and the minimum value add up to the value of 25%. In addition, the length of the interval between the maximum value (10%) and the arithmetic mean value (50%) are divided into two equal parts. This value and the arithmetic mean value add up to the value of 75% (Figure 3). In this regard, the range of values was divided into four intervals, whose length is unequal, since the data are not ideally distributed.

2.5. Estimating the Effect of the Potential Accessibility Variation in Social Cohesion

Once the municipalities are classified according to their socioeconomic structures, the difference between future accessibility and current accessibility ( PP rs PP ro )   is calculated for each municipality. Again, like the classification of municipalities according to their relative levels of accessibility and according to Federal Ministry of Transport, Building and Housing [73], the municipalities are classified into four classes, (0%–25%, 25%–50%, 50%–75% and 75%–100%). The maximum value of the potential accessibility variation in all calculated municipalities is established as 100% and the minimum as 0%. The value of 50% corresponds to the arithmetic mean value of all of the calculated values. Furthermore, the value of 25% corresponds to the difference between the minimum value (0%) and the arithmetic mean value (50%) divided by two, adding up to the minimum value. The value of 75% corresponds to the difference between the maximum value (100%) and the arithmetic mean value (50%) divided by two added to the arithmetic mean value (Figure 3). Again, the range of values was divided into four intervals whose length is unequal, since the data are not ideally distributed. These four classes of socioeconomic development are related to the difference between the future accessibility and the current accessibility of each municipality (Table 6). In this regard, if the increase in relative accessibility is understood to be the development opportunities for residents in the territories: (1) those territories that are less developed should receive the largest increases in accessibility, since a greater social cohesion will be achieved; (2) the opposite should happen in more developed territories. For this reason, it is considered that the potential impact of accessibility in social cohesion is going to be positive, if undeveloped or highly undeveloped municipalities receive accessibility increases greater than the value of the arithmetic mean ( PP rs PP ro )   obtained in the total group of municipalities analyzed. In the same way, it is considered that the impact is going to be negative, if highly developed or developed municipalities obtain accessibility increases greater than the value of the arithmetic mean ( PP rs PP ro ) , since they are going to receive better opportunities for development themselves and they may become socioeconomic poles. In addition, depending on the interval of the potential accessibility increase (four classes) for each municipality, the impact could be high, medium or low (Table 6).
Nonetheless, there is the possibility of reducing the number of combinations in Table 6; in this sense, if we reduce either the number of classes for the categorization of the socioeconomic development of municipalities or for the categorization of the relative levels of accessibility. In this case, this number of classes was maintained. Thus, a more detailed classification of the municipalities is achieved according to the impact produced by the new infrastructures on social cohesion. This classification is not intended to be either exclusive or excluding. However, it will potentially inform decision-makers, policy-makers and social agents if regions are likely to improve or worsen their social cohesion, even before the construction of new infrastructures.

3. Results

Thematic mapping, charts and summary tables display the results, making it possible to quickly extract relevant information for periods before the expansion of new motorways and HSR lines.

3.1. Socioeconomic Characterization of the Peninsular Spanish Municipalities

The analysis starts from the study of peninsular Spanish municipalities’ classification according to their structural lack of development (Figure 4).
The map (Figure 4a) brings to light the historical economic superiority of the north over the peninsular south, as there is in the northern half a predominance of developed municipalities (highly developed and developed), and in the southern half, there are more undeveloped municipalities (undeveloped and highly undeveloped). In addition, the bar chart (Figure 4b) shows that the predominant population that is highly developed (74.95%) is concentrated in approximately a quarter of the municipalities (26.16%).

3.2. Potential Accessibility

The potential accessibility indicator permits the calculation of potential movement from one municipality to others municipalities, by the residents of that municipality (measured in minutes).This indicator (Section 2.4.1. Indicator of Potential Accessibility) is applied to two different scenarios: (1) the current scenario, without taking into account the new motorways and HSR lines; (2) the future scenario, taking into account the new motorways and HSR lines that are going to be built.
The map (Figure 5a) and figure (Figure 5b) represent the relative levels of accessibility in the current scenario. The map (Figure 5a) shows how the western peninsular part presents lower levels of relative accessibility. In addition, the places that already have more transport infrastructure (standing out among them, HSR lines) have the highest levels of relative accessibility. These correspond to the metropolitan areas of Madrid, Barcelona, Valencia and Seville. In the case of Madrid, Barcelona and Valencia, these are the center of three accessibility distribution models denominated center-peripheral. Nevertheless, Seville cannot be considered as such, since the levels of accessibility around it descend sharply in the north and west.
On the other hand, the bar graph (Figure 5b) shows that relative accessibility is approximately intermediate in peninsular Spain. The majority of municipalities has intermediate levels of accessibility (25%–75%); those that show extreme levels of accessibility (0%–25% and 75%–100%) are scant. In addition, approximately a third part of the population (74.75%) has relative accessibility levels above the arithmetic mean value (50%). Likewise, the places where the highest levels of population are concentrated (26.54%) have the highest levels of accessibility.
The relative levels of accessibility of the municipalities were analyzed in the peninsular Spanish territory. The future scenario considers all planned infrastructures in the PITVI, both motorways and railways, already built. In this regard, if the map (Figure 6a) is compared to the map obtained previously (Figure 5a), it will be observed that the levels of relative accessibility increase in western areas. Furthermore, there is a noted increase in accessibility in metropolitan areas where there were already high levels of accessibility in Madrid, Barcelona, Valencia and Seville. The center-peripheral models increase in the first three cities, and this type of model is not generated for Seville. Likewise, significant increases in accessibility appear in the areas of Valladolid, Zaragoza and Alicante. In the future, these places are going to be connected with the rest of the territory by both motorways and high-speed railway lines.
On the other hand, if the bar chart (Figure 6b) is compared to the graph (Figure 5b), it is evident that an intermediate accessibility model is going to be accentuated in the future according to the number of municipalities. In this respect, the percentage of municipalities whose levels of relative accessibility are intermediate (25%–75%) is going to increase. In addition, many municipalities are going to increase their relative accessibility. Nevertheless, the number of municipalities with the lowest levels of accessibility (0%–50%) is going to reduce (33.98%). On the contrary, the number of municipalities with the highest levels of accessibility (50%–100%) is going to increase (66.02%). Therefore, the population that is going to reside in these municipalities is also going to be greater.

3.3. Estimating the Effect of the Potential Accessibility Variation in Social Cohesion

Once the municipalities have been characterized according to their socioeconomic degree (highly developed, developed, undeveloped and highly undeveloped municipality), the increase of accessibility is estimated in each of them as the difference between the future accessibility and the current accessibility (PPrs-PPro). Subsequently, this increase is related to the degree of socioeconomic development in order to estimate whether it is going to affect social cohesion (Table 7). From the point of view of social cohesion and taking into account the spatial distribution of the variables analyzed, a positive effect is going to occur, if the value of the accessibility increase is superior to the arithmetic mean value of the set of municipalities analyzed for those municipalities that are more undeveloped socioeconomically (highly undeveloped and undeveloped). On the contrary, the effects are going to be negative if the value of the accessibility increase is greater than the arithmetic mean value in the most developed municipalities (highly developed and developed).
The variation in accessibility produced in the municipalities after the implementation of new transport infrastructures in most of them is lower than the arithmetic mean value (0%–50%). In fact, the proportion of municipalities and inhabitants greater than the arithmetic mean value is practically non-existent.
Regarding the effect of accessibility according to the socioeconomic level of each municipality, it is possible to verify that the greatest value is going to be positive, and it is going to take place in municipalities that are going to increase their relative accessibility by a fourth part of the increase registered in the total set of all of the municipalities. Likewise, the least effect is going to be also positive, but in highly undeveloped municipalities that are going to increase their accessibility up to 100%. Nevertheless, in these, the number of inhabitants is practically non-existent.
The cartographic representation (Figure 7a) shows the results achieved territorially, showing the enormous disparity in social cohesion that would occur with the implantation of new transport infrastructures planned by the PITVI. Although there are many municipalities where the effect on social cohesion is positive, there are many municipalities where this effect is negative. This can be seen in the southwestern and northwestern regions, with many municipalities located in the provinces of Huelva, Cadiz, Seville, Badajoz, Caceres, Cordoba, Pontevedra, Vigo, A Coruña and Lugo, where the negative effect of medium or low is the most common. In this group of municipalities, this negative effect does not occur in provincial capitals, where the effect is positive medium or high, since these towns are socioeconomically the most developed, and they already display some economic dynamism. This indicates that although the effect is positive for those municipalities that are already economically dynamic to some extent, it is necessary that the municipalities where the effect is negative receive higher levels of accessibility or that they benefit from some compensatory measures, since medium-sized cities in the developing world can offer greater potential for more sustainable transformations than megacities [74].
In addition, in the metropolitan area in Madrid and Toledo, the effect is going to be positive. In contrast, the overall effect is going to be negative in Ciudad Real and Alcazar de San Juan to the south of Madrid and mainly positive in Siguenza and Segovia to the north of Madrid. Therefore, it is more likely that the area of influence whose center is in Madrid is going to extend more rapidly towards the north than the south of Madrid.
Regarding the representation of percentages in the bar graph (Figure 7b), it should be emphasized that the effect is going to be roughly positive in half of the number of municipalities (51.38%) and negative for the other half (48.62%). Nevertheless, the effect is going to be positive for approximately three-quarters of the population (77.07%) and negative for the remainder (22.93%). Therefore, the greatest effect is going to occur in the municipalities with the largest populations. The opposite happens in the number the municipalities where the effect is going to be negative high (13.23%) and low positive (10.96%), since these municipalities are sparsely populated (2.79% and 2.23%).

4. Discussion

Accessibility is one of the main objectives of national transport policies. The greatest degree of socioeconomic development is traditionally associated with regions with greater accessibility, while the lack of accessibility is related to peripheral regions characterized by significant problems in accessing economic markets and their low socioeconomic dynamism. Therefore, taking into account that changes in the transport system have an impact on accessibility transmitted through infrastructure and transport services, these changes can affect the spatial locations of different socioeconomic activities in the long term.
In this regard, the relative levels of accessibility obtained in the municipalities before and after the construction of new transport infrastructures show that the accessibility model is going to accentuate and not change. Therefore, if this model is to be changed, it will be necessary to act in a different form and not subordinate to the transport infrastructures. This purpose is especially important, since PITVI has as its priority aim the use of these infrastructures to achieve socioeconomic development in the most disadvantaged regions. Action should be taken in these less developed and isolated municipalities to revitalize policies in the national, regional and local framework. In addition, effective intermodal points (rail-road), through the adaptation of the railway service to the population residing in each municipality, should be achieved. Furthermore, it should act on less important transport networks than motorways and high-speed railways, such as conventional roads and conventional railways. Thus, adequate access to motorways and HSR stations would be achieved for residents in the less socioeconomically developed and isolated municipalities.

5. Limitations of the Study and Next Steps

This work analyzed the new motorways and HSR lines that will be built in peninsular Spain, since this is the target area of the PITVI. In this sense, analyses of the networks of different modes of transport have remained in separate literature, in part because researchers tend to specialize in one mode of transport, but also because of the limited availability of the disaggregated data on the different transport modes. For this reason, it is estimated that the analysis carried out in this paper is suitable when seeking to improve socioeconomic cohesion, because it simultaneously analyses the two modes of transport in Spain with the most investment from the EU to achieve the objectives set by the Social Cohesion Policy among its regions.
Nonetheless, it would be interesting to expand the space of analysis to an international level to analyze the effects of planned infrastructures internationally. It would also be of interest to analyze how the construction of new motorways and new HSR lines would influence socioeconomic cohesion in Europe. Likewise, it would be interesting to examine other means of transport, such as air and maritime transport. In addition, the use of historical data on the exposed methodology is proposed as a fruitful area of study.

6. Conclusions

Socioeconomic classification of the municipalities according to their structural lack of development (Figure 4a) shows that the layouts of high-speed rails and motorways are fundamentally linked to the socioeconomic organization in the Spanish peninsular territory. In fact, while in 2012, the network of motorways and high-speed rails connected the most socioeconomically-evolved areas with the highest population density (Figure 1a,b), in 2024, these networks are going to connect regions whose population density and development economics are high or medium. In addition, the grouping in the northern half of the peninsula of the most socioeconomically-developed municipalities and in the southern half peninsula the most undeveloped municipalities, demonstrates the historical economic hegemony of the north over the south. Nonetheless, the implementation of new transport infrastructures can end this hegemony if the municipalities in the southern half of the peninsula are able to seize the opportunities of economic dynamism provided by these new infrastructures.
With regard to the relative levels of accessibility observed for the municipalities in 2012 (Figure 5b), it is possible to state that there are municipalities that have huge deficiencies of accessibility, though these are scarce in number. On the Spanish mainland, there are municipalities that are isolated from the rest. As a result, they face challenges in socioeconomic development. Likewise, it is verified that the same model of accessibility is going to remain, having mainly intermediate levels of relative accessibility. In addition, the centers of the three existing center-peripheral models are going to remain (Figure 6a). Nevertheless, all of them (Madrid, Barcelona and Valencia) are located in the northern half of the peninsula.
Another important aspect is the connection between the degree of socioeconomic development and the relative level of accessibility in each municipality. This connection shows the effects produced by the new transport infrastructures on social cohesion are going to be disparate. Although approximately half of all municipalities are going to receive positive effects and the other half are going to receive negative effects in achieving greater social cohesion, approximately three-quarters of the population are going to receive positive effects, and the remaining part of the population is going to receive negative effects. The PITVI is going to partially fulfill its main objective based on achieving greater social cohesion. Social cohesion will improve in most municipalities. However, half of the municipalities and a quarter of the number of inhabitants are going to receive fewer development opportunities. Consequently, they are going to have more difficulties in socioeconomic progress. To achieve greater social cohesion, this half of municipalities and the fourth part of the population should receive action that helps them achieve greater development opportunities. This is especially the case in the less developed municipalities, since there is a risk that they are going to be isolated from the rest. Populations that live in these municipalities are probably not going to be capable of progressing socioeconomically in any proper way.

Acknowledgments

The publication of the present work was possible thanks to funding granted by the European Regional Development Fund (FEDER in Spanish) and by the Board of Extremadura to the Research Group of Sustainable Development and Territorial Planning through the financial help of reference GR15121. The author would like to thank José Antonio Gutiérrez-Gallego, area of Graphical Expression, Francisco Javier Jaraíz-Cabanillas, area of Geographical Analysis, Antonio García-Manso, area of Electronics, and Juan Luis García-Zapata, area of Applied Mathematics, for the guidance received. Thanks also to Fergus Crystal for help with revising the English version of this text. The author is also very grateful to the reviewers of this paper for providing constructive comments, which have contributed to improve the final version.

Conflicts of Interest

The author declares no conflict of interest.

Abbreviations

The following abbreviations are used in this manuscript:
HSRHigh-speed rail
ICAIndependent component analysis
INENational Institute of Statistics
PCAPrincipal component analysis
PITVIInfrastructure, Transport and Housing Plan 2012–2024, in Spanish
SEPEState Public Employment Service, in Spanish
SOMSelf-organizing maps
WCEDWorld Commission on Environment and Development

References

  1. Ciegis, R.; Ramanauskiene, J.; Martinkus, B. The concept of sustainable development and its use for sustainability scenarios. Eng. Econ. 2009, 62, 28–37. [Google Scholar]
  2. Pearce, D.; Markandya, A.E.; Barbier, E. Blueprint for a Green Economy; Earthscan Publications Limited: Londres, UK, 1989. [Google Scholar]
  3. Cabrero, G.R.; Hendrickson, M.A. Servicios Sociales y Cohesión Social; Consejo Económico Social: Madrid, Spain, 2011. (In Spanish) [Google Scholar]
  4. Carpiano, R.M. Neighborhood social capital and adult health: An empirical test of a bourdieu-based model. Health Place 2007, 13, 639–655. [Google Scholar] [CrossRef] [PubMed]
  5. Frank, A.I.; Mironowicz, I.; Lourenço, J.; Franchini, T.; Ache, P.; Finka, M.; Scholl, B.; Grams, A. Educating planners in europe: A review of 21st century study programmes. Prog. Plan. 2014, 91, 30–94. [Google Scholar] [CrossRef] [Green Version]
  6. Ministry of Public Works. Infrastructure, Transport and Housing Plan 2012–2024; Secretariat of State of Infrastructures, Transport and Housing, Ed.; Publications of the Ministry of Public Works Center: Madrid, Spain, 2012; p. 383.
  7. Givoni, M. Development and impact of the modern high-speed train: A review. Transp. Rev. 2006, 26, 593–611. [Google Scholar] [CrossRef]
  8. Banister, D.; Berechman, J. Transport Investment and Economic Development; Routledge: London, UK, 2003. [Google Scholar]
  9. Miralles, C.; Cebollada, A. Movilidad cotidiana y sostenibilidad: Una interpretación desde la geografía humana. Bol. Asoc. Geógr. Esp. 2009, 50, 193–216. (In Spanish) [Google Scholar]
  10. Vickerman, R.W. Transport infrastructure in the european community: New developments, regional implications and evaluation. In Infrastructure and Regional Development; Pion: London, UK, 1991. [Google Scholar]
  11. Tsamboulas, D.A.; Dimitropoulos, I. Appraisal of investments in european nodal centres for goods–freight villages: A comparative analysis. Transportation 1999, 26, 381–398. [Google Scholar] [CrossRef]
  12. Heij, C.; Nijkamp, P.; Rienstra, S.A.; Rothenberger, D. Assessing Scenarios on European Transport Policies by Means of Multicriteria Analysis; Tinbergen Institute Discussion Paper: Amsterdam, The Netherlands, 1997. [Google Scholar]
  13. Vickerman, R.W. Cost—Benefit analysis and large-scale infrastructure projects: State of the art and challenges. Environ. Plan. B Plan. Des. 2007, 34, 598–610. [Google Scholar] [CrossRef]
  14. European Community. European Spatial Development Perspective (ESDP): Towards Balanced and Sustainable Developoment of the Territory Opf the European Union; Office for Official Publications of the European Communities: Luxembourg, Luxembourg, 1999; p. 87. [Google Scholar]
  15. Martens, K.; Golub, A. A justice-theoretic exploration of accessibility measures. In Accessibility Analysis and Transport Planning: Challenges for Europe and North America; Edward Elgar Publishing: Cheltenham, UK; Northampton, MA, USA, 2012; p. 195. [Google Scholar]
  16. Geurs, K.T.; Krizek, K.J.; Reggiani, A. Accessibility analysis and transport planning: An introduction. In Accessibility Analysis and Transport Planning, Challenges for Europe and North America; Edward Elgar Publishing Limited: Cheltenham, UK; Northampton, MA, USA, 2012. [Google Scholar]
  17. Gould, P.R. Spatial Diffusion; Resource Paper No. 4; Education Resources Information Center: Washington, DC, USA, 1969. [Google Scholar]
  18. Sherman, L.; Barber, B.; Kondo, W. Method for evaluating metropolitan accessibility. Transp. Res. Rec. 1974, 499, 70–82. [Google Scholar]
  19. Ingram, D.R. The concept of accessibility: A search for an operational form. Reg. Stud. 1971, 5, 101–107. [Google Scholar] [CrossRef]
  20. Levinson, D.M. Accessibility and the journey to work. J. Transp. Geogr. 1998, 6, 11–21. [Google Scholar] [CrossRef]
  21. Morris, J.M.; Dumble, P.; Wigan, M.R. Accessibility indicators for transport planning. Transp. Res. A Gen. 1979, 13, 91–109. [Google Scholar] [CrossRef]
  22. Gutierrez, J.; Gomez, G. The impact of orbital motorways on intra-metropolitan accessibility: The case of Madrid M-40. J. Transp. Geogr. 1999, 7, 1–15. [Google Scholar] [CrossRef]
  23. Makri, M.-C.; Folkesson, C. Accessibility Measures for Analyses of Land Use and Travelling with Geographical Information Systems; Department of Technology and Society, Lund Institute of Technology, Lund University & Department of Spatial Planning, University of Karlskrona: Ronneby, Sweden, 1999. [Google Scholar]
  24. Domański, R. Accessibility, efficiency, and spatial organization. Environ. Plan. A 1979, 11, 1189–1206. [Google Scholar] [CrossRef]
  25. Geurs, K.T.; Ritsema van Eck, J. Accessibility Measures: Review and Applications. Evaluation of Accessibility Impacts of Land-Use Transportation Scenarios, and Related Social and Economic Impact; National Institute for Health and Environment (RIVM in Dutch): Bilthoven, The Netherlands, 2001. [Google Scholar]
  26. Wegener, M.; Schürmann, C.; Spiekermann, K. The SASI model: Model Software. Deliverable d13 of the EU Project Sociofeconomic and Spatial Impacts of Transport Infrastructure Investments and Transport System Improvements (SASI). p. 44. Available online: http://www.raumplanung.tu-dortmund.de/irpud/pro/sasi/ber50.pdf (accessed on 30 June 2016).
  27. Baradaran, S.; Ramjerdi, F. Performance of accessibility measures in Europe. J. Transp. Stat. 2001, 4, 31–48. [Google Scholar]
  28. Curtis, C.; Scheurer, J. Planning for sustainable accessibility: Developing tools to aid discussion and decision-making. Prog. Plan. 2010, 74, 53–106. [Google Scholar] [CrossRef]
  29. Mérenne-Schoumaker, B. La Localisation Des Industries. Enjeux et dynamiques; Presses Universitaires de Rennes (PUR): Rennes, France, 2008. (In French) [Google Scholar]
  30. Sanfeliu, C.B.; Casellas, A.; Logroño, M. Infraestructuras de transporte y territorio: Los efectos estructurantes de la llegada del tren de alta velocidad en españa. Bol. Asoc. Geógr. Esp. 2010, 52, 143–163. (In Spanish) [Google Scholar]
  31. Martens, K.; Golub, A.; Robinson, G. A justice-theoretic approach to the distribution of transportation benefits: Implications for transportation planning practice in the united states. Transp. Res. A Policy Pract. 2012, 46, 684–695. [Google Scholar] [CrossRef]
  32. Monzón, A.; Gutiérrez, J.; López, E.; Madrigal, E.; Gómez, G. Infraestructuras de transporte terrestre y su influencia en los niveles de accesibilidad de la españa peninsular. Estud. Constr. Transp. 2005, 103, 97–112. (In Spanish) [Google Scholar]
  33. Brocard, M. Transports et territories. Enjeux et débats. In Territoire en Mouvement Revue de Géographie et Aménagement; Ellipses: Paris, France, 2009. (In French) [Google Scholar]
  34. Gutiérrez, J.; García, J.C.; López, E. Análisis de los efectos de las infraestructuras de transporte sobre la accesibilidad y la cohesión regional. Estud. Constr. Transp. 2006, 105, 215–240. [Google Scholar]
  35. Condeço-Melhorado, A.; Gutiérrez, J.; García-Palomares, J.C. Spatial impacts of road pricing: Accessibility, regional spillovers and territorial cohesion. Transp. Res. A Policy Pract. 2011, 45, 185–203. [Google Scholar] [CrossRef]
  36. Martínez, H. La accesibillidad regional y el efecto territorial de las infraestructuras de transporte. Aplicación en castilla-la mancha. Bol. Asoc. Geógr. Esp. 2012, 59, 79–104. (In Spanish) [Google Scholar]
  37. Plassard, F. Les effets des infrastructures de transport, modèles et paradigmes. Infrastruct. Transp. Territ. 1997, Volume 43, 39–54. (In French) [Google Scholar]
  38. Prieto, J.; Salas, R.; Álvarez, S. Movilidad Social y Desigualdad Económica; Instituto de Estudios Fiscales: Madrid, Spain, 2001. (In Spanish) [Google Scholar]
  39. Bröcker, J.; Capello, R.; Lundqvist, L.; Meyer, J.; Rouwendal, J.; Schneekloth, N.; Spairani, A.; Spangenberg, M.; Spiekermann, K.; Van Vuuren, D. Final Report of Action 2.1.1. of the European Spatial Planning Observatory Network (Espon) 2000–2006; Christian-Albreschts-Universität Kiel: Kiel, Germany, 2004. [Google Scholar]
  40. Martín, J.C.; Gutiérrez, J.; Román, C. Data envelopment analysis (DEA) index to measure the accessibility impacts of new infrastructure investments: The case of the high-speed train corridor Madrid-Barcelona-French Border. Reg. Stud. 2004, 38, 697–712. [Google Scholar] [CrossRef]
  41. Badland, H.M.; Garrett, N.; Schofield, G.M. How does car parking availability and public transport accessibility influence work-related travel behaviors? Sustainability 2010, 2, 576–590. [Google Scholar] [CrossRef]
  42. Holl, A. Twenty years of accessibility improvements. The case of the spanish motorway building programme. J. Transp. Geogr. 2007, 15, 286–297. [Google Scholar] [CrossRef]
  43. Holl, A. Factors influencing the location of new motorways: Large scale motorway building in spain. J. Transp. Geogr. 2011, 19, 1282–1293. [Google Scholar] [CrossRef]
  44. Pueyo, A.; Jover, J.; Zúñiga, M. Accessibility evaluation of the transportation network in spain during the first decade of the twenty-first century. In Territorial Implications of High Speed Rail. A Spanish Perspective; ASHGATE: Farnham, UK, 2012; pp. 83–103. [Google Scholar]
  45. Naranjo, J.M. Estimación de la Cohesión Social en Los Municipios Españoles Peninsulares Tras la Implantación de la Alta Velocidad Ferroviaria; University of Extremadura: Caceres, Spain, 2015. (In Spanish) [Google Scholar]
  46. Fischer, M.M.; Nijkamp, P. Handbook of Regional Science; Springer: New, York, NY, USA, 2014. [Google Scholar]
  47. Rose, D.; Harrison, E. Social Class in Europe: An Introduction to the European Socio-Economic Classification; Routledge: London, UK, 2014. [Google Scholar]
  48. Serra, P.; Vera, A.; Tulla, A.F.; Salvati, L. Beyond urban–rural dichotomy: Exploring socioeconomic and land-use processes of change in spain (1991–2011). Appl. Geogr. 2014, 55, 71–81. [Google Scholar] [CrossRef]
  49. Mackenbach, J.D.; Randal, E.; Zhao, P.; Howden-Chapman, P. The influence of urban land-use and public transport facilities on active commuting in wellington, new zealand: Active transport forecasting using the wilute model. Sustainability 2016, 8, 242. [Google Scholar] [CrossRef]
  50. National Statistics Institute. Municipal census of inhabitants. In 1 Year; National Statistics Institute: Madrid, Spain, 2015. [Google Scholar]
  51. La Caixa. Economic Yearbook; La Caixa: Barcelona, Spain, 2012. (In Spanish) [Google Scholar]
  52. State Public Employment. Labor force survey. In 1 Year; State Public Employment: Madrid, Spain, 2015. [Google Scholar]
  53. National Statistics Institute. Census of Population and Housing. In 1 Year; National Statistics Institute: Madrid, Spain, 2015. [Google Scholar]
  54. Hyvärinen, A.; Hurri, J.; Hoyer, P.O. Natural Image Statistics: A Probabilistic Approach to Early Computational Vision; Springer Science & Business Media: New York, NY, USA, 2009; Volume 39. [Google Scholar]
  55. Hyvarinen, A. Fast and robust fixed-point algorithms for independent component analysis. IEEE Trans. Neural Netw. 1999, 10, 626–634. [Google Scholar] [CrossRef] [PubMed]
  56. Kohonen, T. Self-organized formation of topologically correct feature maps. Biol. Cybern. 1982, 43, 59–69. [Google Scholar] [CrossRef]
  57. Kohonen, T.; Somervuo, P. Self-organizing maps of symbol strings. Neurocomputing 1998, 21, 19–30. [Google Scholar] [CrossRef]
  58. Lu, D.; Tian, Y.; Liu, V.; Zhang, Y. The performance of the smart cities in china—A comparative study by means of self-organizing maps and social networks analysis. Sustainability 2015, 7, 7604. [Google Scholar] [CrossRef]
  59. Gutiérrez, J.A.; Naranjo, J.M.; Jaraíz, F.J.; Ruiz, E.E.; Su, J. A methodology to assess the connectivity caused by a transportation infrastructure; Application to the high-speed rail in Extremadura. Case Studies on Transport Policy 2015, 3, 392–401. [Google Scholar]
  60. Megía, J.M. Oferta de transporte de viajeros por ferrocarrilentre ciudades importantes de la unión europea. Estud. Constr. Transp. 2002, 95, 93–130. (In Spanish) [Google Scholar]
  61. Spiekermann, K.; Wegener, M.; Květoň, V.; Marada, M.; Schürmann, C.; Biosca, O.; Ulied Segui, A.; Antikainen, H.; Kotavaara, O.; Rusanen, J. Tracc Transport Accessibility at Regional/Local Scale and Patterns in Europe; Draft Final Report. ESPON Applied Research; Office for Official Publications of the European Communities: Luxembourg, Luxembourg, 2013. [Google Scholar]
  62. Rosik, P.; Stępniak, M.; Komornicki, T. The decade of the big push to roads in poland: Impact on improvement in accessibility and territorial cohesion from a policy perspective. Transp. Policy 2015, 37, 134–146. [Google Scholar] [CrossRef]
  63. Reggiani, A.; Bucci, P.; Russo, G. Accessibility and impedance forms: Empirical applications to the german commuting network. Int. Reg. Sci. Rev. 2011, 34, 230–252. [Google Scholar] [CrossRef]
  64. Hansen, W.G. How accessibility shapes land use. J. Am. Inst. Plan. 1959, 25, 73–76. [Google Scholar] [CrossRef]
  65. Kotavaara, O.; Antikainen, H.; Rusanen, J. Population change and accessibility by road and rail networks: GIS and statistical approach to finland 1970–2007. J. Transp. Geogr. 2011, 19, 926–935. [Google Scholar] [CrossRef]
  66. Song, S. Some tests of alternative accessibility measures: A population density approach. Land Econ. 1996, 72, 474–482. [Google Scholar] [CrossRef]
  67. Handy, S.L.; Niemeier, D.A. Measuring accessibility: An exploration of issues and alternatives. Environ. Plan. A 1997, 29, 1175–1194. [Google Scholar] [CrossRef]
  68. Haynes, R.; Lovett, A.; Sünnenberg, G. Potential accessibility, travel time, and consumer choice: Geographical variations in general medical practice registrations in eastern england. Environ. Plan. A 2003, 35, 1733–1750. [Google Scholar] [CrossRef]
  69. Jacobs, C. Integration of Spatially Explicit Potential Accessibility Measures in Land Use Scanner; University of Amsterdam: Amsterdam, The Netherlands, 2011. [Google Scholar]
  70. Páez, A. Access and social complexity. In Improving Urban Access: New Approaches to Funding Transport Investment; Routledge: Florence, Kentucky, USA; New York, NY, USA, 2016; Volume 1, p. 190. [Google Scholar]
  71. Skov-Petersen, H. Estimation of distance-decay parameters: GIS-based indicators of recreational accessibility. In Proceedings of the ScanGIS 2001, Aas, Norway, 24–27 June 2001; pp. 237–258.
  72. Stępniak, M.; Rosik, P.; Komornicki, T. Accessibility patterns: Poland case study. Eur. XXI 2013, 24, 77–93. [Google Scholar] [CrossRef]
  73. Federal Ministry of Transport, Building and Housing. Federal Transport Infrastructure Plan 2003: Basic Features of the Macroeconomic Evaluation Methodology (BMVBW); Federal Ministry of Transport, Building and Housing: Berlin, Germany, 2003; p. 345.
  74. Pojani, D.; Stead, D. Sustainable urban transport in the developing world: Beyond megacities. Sustainability 2015, 7, 7784–7805. [Google Scholar] [CrossRef]
Figure 1. (a) Map of roads; (b) map of high-speed rails.
Sustainability 08 00624 g001
Figure 2. Workflow.
Figure 2. Workflow.
Sustainability 08 00624 g002
Figure 3. Classification by relative level of accessibility.
Sustainability 08 00624 g003
Figure 4. (a) Map of the structural categorization of peninsular Spanish municipalities´ classification; (b) bar chart of the number of municipalities according to structural lack of development.
Sustainability 08 00624 g004aSustainability 08 00624 g004b
Figure 5. (a) Map of the relative levels of current accessibility; (b) bar chart of the number of municipalities and inhabitants in them, according to their relative level of current accessibility.
Sustainability 08 00624 g005
Figure 6. (a) Map of relative levels of future accessibility; (b) bar chart of the number of municipalities and inhabitants in them, according to their relative level of future accessibility.
Sustainability 08 00624 g006
Figure 7. (a) Map of the accessibility effects on social cohesion by new transport infrastructures; (b) bar chart of the number of municipalities and inhabitants in them, according to effect on social cohesion.
Sustainability 08 00624 g007
Table 1. Variables used for the socioeconomic characterization of the Spanish peninsular municipalities.
VariableIdentifierSource
Resident populationV12015 Municipal Census of Inhabitants by the National Institute of Statistics (INE) [50]
Market share per capitaV2La Caixa 2012 Economic Yearbook [51]
Motor vehicles registered per capitaV3La Caixa 2012 Economic Yearbook [51]
Industrial average per capitaV4La Caixa 2012 Economic Yearbook [51]
Unemployment rateV52015 Labour Force Survey by State Public Employment Service (SEPE) [52]
Dependence indexV62015 Municipal Census of Inhabitants by INE [50]
Percentage of second homesV72011 Census of Population and Housing, INE [53]
Population employed in the primary sectorV82011 Census of Population and Housing, INE [53]
Population employed in the secondary sectorV92011 Census of Population and Housing by INE [53]
Population employed in the tertiary sectorV102011 Census of Population and Housing by INE [53]
Population used in the construction industryV112011 Census of Population and Housing by INE [53]
Table 2. Spearman’s rank correlation coefficient.
V1V2V3V4V5V6V7V8V9V10V11
V11.000−0.9490.263−0.8300.548−0.172−0.622−0.2710.0310.238−0.184
V2−0.9421.000−0.2380.845−0.5300.1650.5980.231−0.014−0.2060.158
V30.253−0.2391.000−0.2120.123−0.083−0.223−0.1400.0780.096−0.063
V4−0.8320.841−0.2081.000−0.5320.1350.4490.1190.171−0.2180.076
V50.541−0.5310.119−0.5381.000−0.076−0.309−0.218−0.0320.2110.022
V6−0.1690.161−0.0810.136−0.0711.0000.1680.109−0.029−0.1010.094
V7−0.6210.593−0.2180.452−0.3040.1741.0000.196−0.176−0.1000.252
V8−0.2710.231−0.1410.119−0.2160.1090.1911.000−0.329−0.6800.085
V90.031−0.0090.0740.162−0.030−0.033−0.177−0.3311.000−0.261−0.212
V100.239−0.2040.092−0.2190.211−0.100−0.100−0.681−0.2601.000−0.208
V11−0.1890.160−0.0640.0780.0210.0940.2510.084−0.217−0.2081.000
Table 3. Correlation between principal components and original variables.
VariablesC1C2C3C4C5C6C7
V1−0.015150.10579−0.663770.10457−0.29879−0.05157−0.05995
V20.02998−0.092310.62659−0.107770.272560.052480.06958
V3−0.09170−0.05725−0.455960.00932−0.18774−0.018230.85422
V40.07103−0.042420.49061−0.283610.375540.041690.05965
V50.083150.01773−0.395320.08144−0.91245−0.00798−0.20659
V6−0.02282−0.060690.12115−0.03277−0.020020.963310.00132
V70.19316−0.028920.916470.01987−0.11125−0.008320.21258
V8−0.87191−0.267110.312590.00787−0.014870.02621−0.05897
V90.186870.09036−0.19356−0.964570.09239−0.021400.02989
V100.592620.48427−0.264780.61115−0.03102−0.001560.03987
V110.19969−0.890110.194470.165897−0.082350.02221−0.01898
Table 4. Characterization of socioeconomic classes.
Class 1V1V2V3V4V5V6V7V8V9V10V11
Mean8376.490.050.50.065.3659.7132.937.3716.1564.9610.55
Standard Deviation65013.850.060.280.133.3120.3322.546.868.379.814.48
Class 2V1V2V3V4V5V6V7V8V9V10V11
Mean7235.420.040.40.055.9463.8129.828.5418.4860.4911.23
Standard Deviation59801.440.030.350.063.8227.629.4412.0710.159.026.88
Class 3V1V2V3V4V5V6V7V8V9V10V11
Mean4396.630.010.750.039.0267.8719.1115.0720.1254.412.42
Standard Deviation6902.020.050.290.083.6928.2613.2511.6810.2210.116.12
Class 4V1V2V3V4V5V6V7V8V9V10V11
Mean696.130.030.610.046.4277.8542.3127.1210.3349.5911.97
Standard Deviation232.650.030.310.143.4938.0311.1211.238.9611.546.10
Table 5. Characterization of the areas according to their relative levels of accessibility
CategoryMunicipality Classified by Relative Level of Accessibility
Level 10%–25%
Level 225%–50%
Level 350%–75%
Level 475%–100%
Table 6. Impact produced by the increase of potential accessibility in the municipalities.
100%–75%75%–50%50%–25%25%–0%
Highly developedNegative highNegative mediumPositive mediumPositive high
DevelopedNegative mediumNegative lowPositive lowPositive medium
UndevelopedPositive mediumPositive lowNegative lowNegative medium
Highly undevelopedPositive highPositive mediumNegative mediumNegative high
Table 7. Characterization of areas according to their relative levels of accessibility.
100%–75%75%–50%50%–25%25%–0%
M 1I 2MIMIMI
Highly developed0.10%0.53%0.39%0.73%9.81%24.97%15.86%49.82%
Developed0.00%0.00%0.70%0.04%10.78%2.16%14.40%0.02%
Undeveloped0.01%0.00%0.17%0.07%9.65%6.35%14.86%12.02%
Highly undeveloped0.01%0.00%0.32%0.02%9.80%0.99%13.14%2.26%
1 Municipalities; 2 inhabitants.

