1. Introduction
With the ever-continuous evolution of information and communication technology (ICT), “Internet of Things” (IoT) technology has emerged. Here, the IoT is defined as an intelligent infrastructure providing “the network of physical objects, e.g., devices, vehicles, buildings and other items, embedded with electronics, software, sensors, and network connectivity that enables these objects to collect and exchange data” [
1]. Global market research institutes estimate that the IoT technology will connect 150 billion “things” by 2015, and that the scale of the IoT market will increase to 262.8 billion dollars in 2020 from 38.9 billion dollars in 2013 with a compound annual growth rate (CAGR) of 31.4% [
2,
3]. On the other hand, the Organization for Economic Co-operation and Development (OECD) predicts that the future, i.e., the third generation of the Internet, will be driven by the IoT, the second and first generations of which are based on wireless and wired Internet connections, respectively [
4].
Although applications of the IoT technology vary according to the scholar, they in general include smart energy, smart health, smart buildings, smart transport, smart living and the smart city, covering the domains of individuals, societies, environments, industries and governance [
5,
6,
7]. The smart city, one such IoT application, is designed for citizens to use intelligent services in an environment where transport, environment, energy, living, governance and civic components are integrated; it not only enhances quality of life on the individual level, but also operates the city in a smart and efficient manner. As a result, several governments expressed interest in the smart city, the establishment of which is expected to resolve a number of problems associated with the deterioration of a city due to excessive urbanization.
The world is experiencing an unprecedented level of urbanization; more than half of the total population of the world has already lived in a city [
8,
9]. Since the smart city provides a viable solution to relieve the stresses caused by urbanization, there has been a significant increase in governmental demands for such technology. In addition, global energy and environmental concerns, such as depletion of natural resources, climate change and pollution, and various threats to safety, including both natural disasters and terrorism, have been on the rise. This is another aspect where the smart city furnishes technological solutions to establish eco-innovation and a safe society, eventually resulting in sustainable growth. Furthermore, as shown empirically by a few previous research works, the investment in the smart city improved the competitiveness of a regional city, e.g., in terms of employment [
10], wealth creation [
11] and even the democratic system [
12] with increased human and social capital, as well as enhanced city infrastructure [
10,
11,
12].
Accordingly, the Korean government has strived to create a smart city infrastructure; for instance, the “Ubiquitous City Comprehensive Plan” was established as early as 2003 for investment in the research and development (R&D) of relevant technologies. Furthermore, the “Korean Ubiquitous-Eco-City Project” was launched to develop ICT-based eco-technologies (EcoT) for the sustainable growth of the city in 2007 [
13]. In addition to these technology-promoting programs, the government has focused on facilitation of the smart city market through several market-pull policies like demonstration programs for enhancing industrial competitiveness, as well as the sustainable growth of the city. The Korean government has concentrated on industrial convergence with IoT technologies based on short- and mid-term ICT plans, including “The Master Plan for Building the Internet of Things (IoT)” and “The K(Korea)-ICT Strategy” [
14]. The Ministry of Science, ICT and Future Planning (MSIP) has built a test complex for the smart city with an investment of more than four million dollars, in cooperation with a municipality (Busan city) and a telecommunication company (SK Telecom). Additionally, the Korea Agency for Infrastructure Technology Advancement (KAIA) launched a program to build a demonstration complex of the smart city based on a living laboratory collaborating with a municipality (Daegu city), public research institutes and universities.
Considering that policies for the smart city industry might have a spillover effect relatively larger than that of other IoT applications because of its platform nature in which smart energy, smart buildings, smart transport and smart living are integrated, it becomes more important to explicitly estimate the economic effect of the smart city industry. Several studies have tackled the identification of the regional economic effects of smart cities [
10,
11,
15,
16,
17]. Shapiro [
10] found the positive impact to human capital and quality of life with growth in employment of a smart city using a neoclassical model of city growth. Hollands [
16] suggested that a smart city, by means of utilizing networked infrastructure, cannot only develop urban culture and society, but also improve its economic and political efficiency. Caragliu and Nijkamp [
18], focusing on the roles of social and relational capital, examined regional absorptive capacity to induce spatial knowledge spillovers.
On the other hand, for the Korean government to forecast the potentials of the smart city and strategically determine its policy options, the effect of the smart city industry on the national economy needs to be analyzed structurally in terms of input-output transactions. Input-output analysis has been widely implemented to identify inter-industrial structure and to empirically evaluate the impact of an industry on the national economy [
19,
20,
21,
22,
23]. Nevertheless, there have been very few previous studies to empirically analyze the smart city industry based on input-output analysis because the concept of the smart city industry was only recently established. This in turn causes difficulties in identifying the scope of the industry, where the convergence propensity of ICT makes it even more fastidious. In other words, equivocality in the industrial classification of the smart city and the lack of relevant data appear responsible for the difficulties in analysis. There have been a few studies classifying the smart city industry sector, but they are based on the arbitrary opinion of the authors, apart from the technical adequacy of such classifications to explain the smart city industry. For example, Jeong et al. [
24] evaluated the impact of the IoT industry on the national economy of Korea; however, their classification can be criticized for considering only the supply side of the IoT technologies, i.e., ICT industries related to IoT technologies. In another study, Kim et al. [
25] analyzed the economic effect of the smart grid industry, the classification of which includes electricity, construction, transport and utility industries; however, their approach is limited in that it is based on the arbitrary decision of the authors.
The goal of this study is to provide a theoretical and empirical framework for the analysis of the economic effect of the smart city industry on the Korean national economy based on relevant industrial classification. After a brief explanation of the background of the smart city industry in Korea, the smart city industry is classified into several industry subsectors (384 in total) in a Korean input-output table. The relevant industry subsectors are determined from the results of a Delphi test from 13 experts in the field in order to prohibit arbitrary determination. Based on the input-output analysis results, the forward and backward linkage effects of the smart city industry on other industries are estimated in terms of induction coefficients for production, value added and employment, based on input-output analysis. Identification of the critical industries in this regard and assessment of the economic effects of the smart city demonstration program are expected to provide a key to facilitating the successful development of the smart city industry.
The rest of this paper is organized as follows. In “Understanding the Smart City”, the definition and current status with some background of the smart city are given in brief. Then, in the “Methodology”, the classification of the smart city industry and estimation method for measuring the economic effect with the implementation of the input-output analysis are described. As for the “Results and Discussion”, the input-output analysis results and estimation of economic effects due to the smart city industry and those due to the smart city demonstration program are reported with a discussion of the role of the smart city in the national economy of Korea. Finally, the results of this study are summarized and implications for smart city policies are presented in the “Conclusion”.
3. Methodology
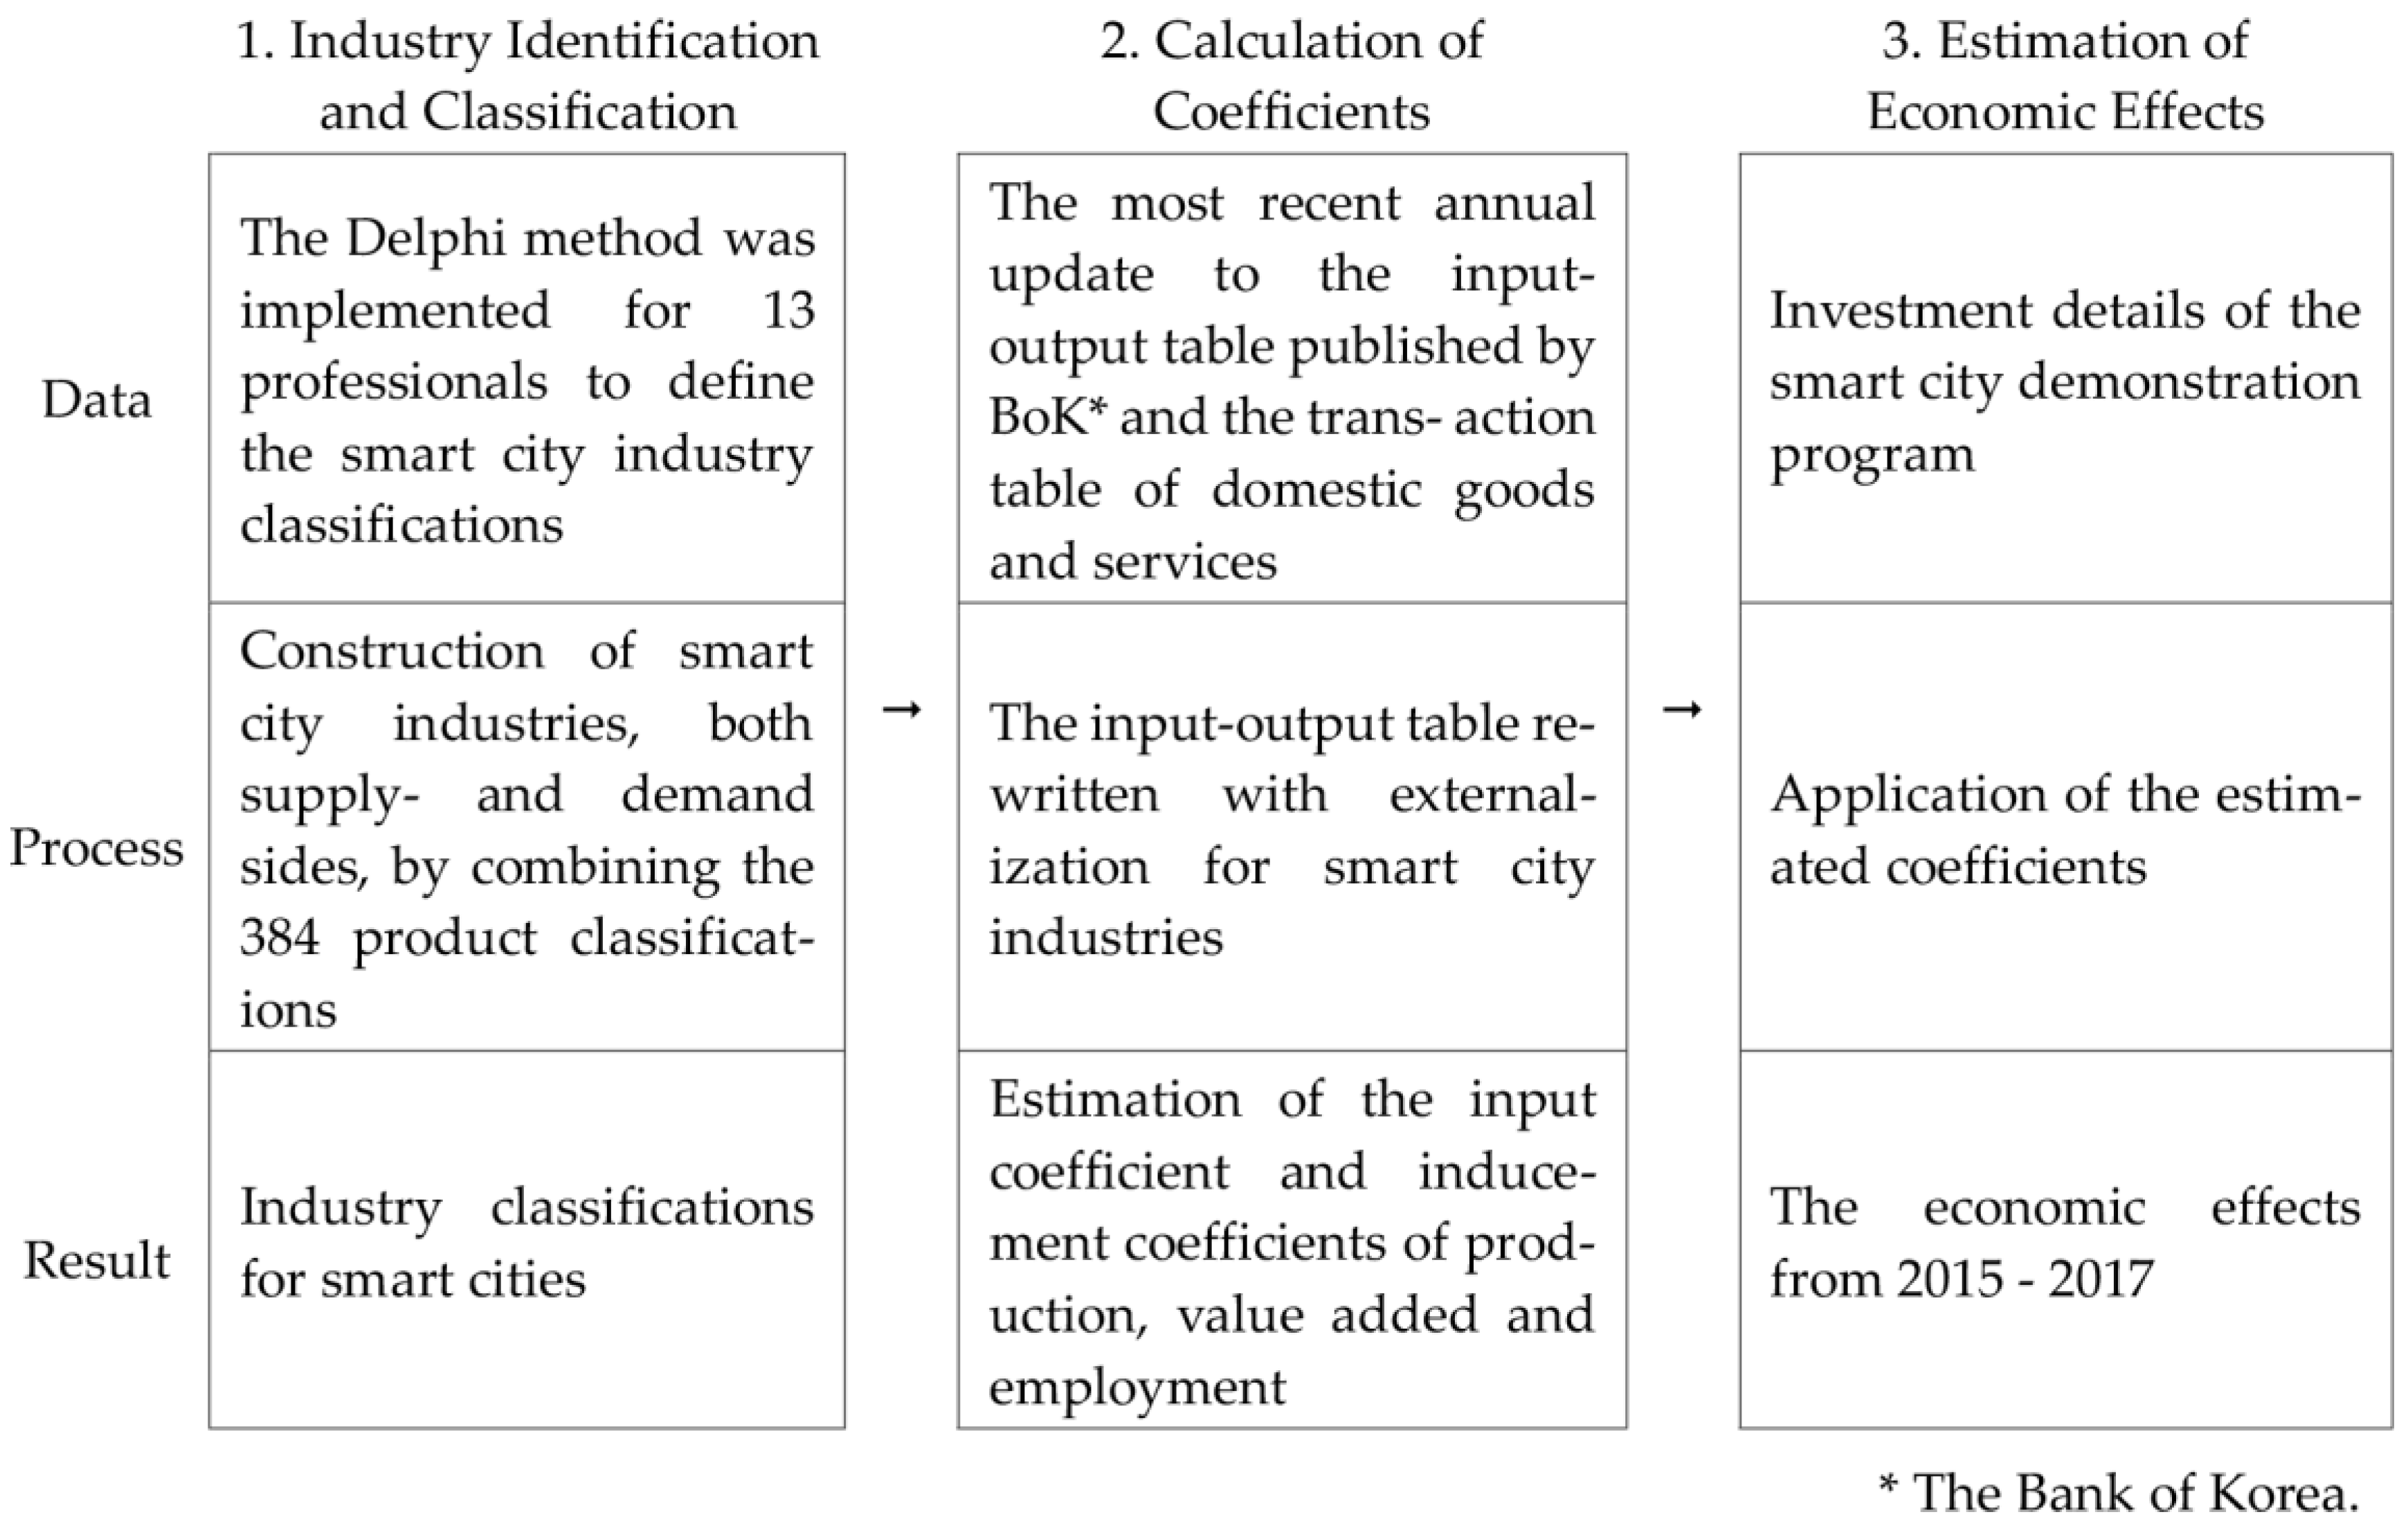
For analysis of the economic effect induced by demonstration programs for smart cities, this study implemented the input-output method in three stages, as described in
Figure 1. First, the relevant smart city industry was externalized based on the appropriate classification. Second, input coefficients and inducement coefficients for production, value added and employment were calculated by means of re-constructing the input-output table with externalization of the smart city industry. Third, the effect of investment for the smart city industry was analyzed based on the calculated coefficients, of which prospects were in turn estimated with the annual investment data available.
3.1. Classification of the Smart City Industry
Although previous studies that have focused on smart cities are quite limited, most of which are only indirectly related to smart cities, they suggest that there have been variations in the industry classification because of a lack of a standardized definition for the smart city industry. For instance, the classification of the IoT industry differs between researchers and is composed of industries that are arbitrarily assumed to have relations with IoT. To compromise the ICT industry classifications by the Bank of Korea, in which the IoT industry characteristics regarding data collection, processing and treatment are insufficiently reflected, Lee et al. [
39] suggested an alternative industry classification for IoT; they adjusted the IoT industry classification to be appropriate for IoT market surveys, of which various segments are matched with Korea Standard Industry Codes (KSICs). More specifically, the Korean IoT industry was classified into either equipment, support service or application industries, of which sub-industries were matched with the finest, i.e., in 5-digit KSIC classifications. Lee et al. [
39] maintained the utility of their alternative IoT classification in terms of compatibility with KSIC and easy integration with survey results without compromising the IoT characteristics. Jeong et al. [
24] proposed an alternative set of IoT industry classifications based on the 403 industry classifications defined in the 2010 input-output table published by the Bank of Korea, including services, such as telephones, broadband Internet services, information services, supplies of software development, computer-related services and other services and products, such as wires and cables, electricity supply and control, wired communication devices, wireless communication devices, telecommunication systems and measurement and analysis instruments. After externalization for the IoT industry, the main 11 classifications for the entire mining, manufacturing and service industries were left intact and applied to the input-output analysis. Thus, the study by Jeong et al. [
24] is meaningful in terms of its comprehensive classification of the IoT industry; however, their work may be criticized as an example of arbitrary classification with a lack of empirical evidence or logical proof with sufficient details. Jeong and Kim [
40] probed the possibility of an alternative ICT industry classification, which was referred to as the “smart network industry” and included industries for intelligent management electronic devices, e.g., for automatic control, various information services and measurement and analysis, in addition to the traditional fields of broadcasting and communication. The criterion for classification considered both installation and application aspects, where wires and cables, video, sound and communication devices, automatic control and management devices, measurement and analysis devices, communication facilities and supply for software development industries correspond to the former, while telephone, broadband network, information services, cable and satellite broadcasting systems and other services correspond to the latter [
40]. However, their approach to industry classification has been criticized for being based on the arbitrary determination.
On the other hand, Lim et al. [
41] classified the U-City industry. In Lim et al. [
41], the U-City stands for the “ubiquitous city” of which the definition is provided by the Act on the Construction, Etc. of Ubiquitous Cities (Ministry of Land, Infrastructure and Transport; Act No. 9052, 28 March 2008): Article 2 of the Act defines a U-City as a city that “provides ubiquitous city services at any time in any place through the ubiquitous city infrastructure constructed by utilizing ubiquitous city technologies to enhance the competitiveness of the city and the quality of life therein,” where “ubiquitous city services means a service prescribed by Presidential Decree that provides information, separately or in combination, about the main functions of a city, such as administration, transportation, welfare, the environment, and prevention and management of disasters, which is collected through the ubiquitous city infrastructure”. In this regard, Lim et al. [
41] carried out surveys for 20 professionals to identify the industry classifications that could be correlated to the U-City industry from the 403 industry fields defined in the KSIC. Based on the results of the surveys, they suggested the U-City industry classification consisting of 49 industry codes that more than 50% of the professionals agreed upon for the U-City [
41].
Kim et al. [
25] proposed an alternative classification for the smart grid industry, which included industries, such as power electric, heavy electric, construction, consumer electronics and automobiles among 168 classifications defined in the 2005 input-output table published by the Bank of Korea. However, their approach was not free from criticism due to their arbitrary combination of 168 industry classifications, even though the resulting classification contains relevant product and service industries, such as electric and electronic devices, transportation instruments, power generation instruments, construction, communication and information services and logistics services. Market research reports were consulted during the creation of the classifications.
This study develops a definition of a smart city and constructs an alternative industry classification complying with such a definition. The 384 industry classifications defined in the 2013 input-output table published by the Bank of Korea were binned to leave only industries that were highly correlated with the smart city industry. To ensure the relevance of the classified industries, the Delphi technique was implemented for 13 professionals in the field, including ICT policy experts, IoT researchers and developers, entrepreneurs and professors. The questionnaires for the Delphi technique not only covered the classifications for the IoT industry, but also the relationship test. In the latter, experts answered the degree of relationship of each industry classification of IoT on a five-point scale with very low (1 point), low (2 points), fair (3 points), high (4 points) and very high (5 points). The industry classification was divided into supply and demand sides, where the former covered the industries providing IoT products and services and the latter the industries needing additional classification with reflecting the characteristics per segment. To ensure the fairness and objectiveness of the IoT industry classification, the process was conducted in two stages: first, only the industry classifications with a score not lower than “fair (3 points)” were collected; second, the classifications with expert agreements not less than 6 (13 in total) were used as the IoT industry. The resulting definition of the smart city industry is given in
Table 1. In
Table 1, the industry sectors according to the supply and demand sides are designated as well.
3.2. Input-Output Analysis
Input-output analysis is one of the most popular methods to analyze economic effects, such as production and employment inducements of an industry [
38]. Since interindustry relationships can be figured out, input-output analysis is appropriate for measuring the structural effect of an industry. Such an interindustry model is joined organically with the entire national economy from the part to the whole. Therefore, the results of the input-output analysis provide a useful basis for planning the national economy [
42,
43].
With a presumption of the fixed input coefficient, the input-output analysis requires fulfillment of the four assumptions. First, no combined production exists, which means that the products and the industries are correlated one by one. Second, there is only one method of production per product; in other words, no alternative way of production exists. Third, no economies of scale are available, i.e., each input of an industry should be proportional to its output or production. Finally, no external economy exists, so the sum of the input or output of each industry should equal the input or output of the entire economy.
The input coefficient
is defined as the intermediate input (such as the cost of the raw materials and fuel, etc.) bought for the production of a good or service divided by the total input of the good or service, i.e.,
where
and
stand for the input and resources input for the production of a good or service
, such as raw materials and fuels, respectively.
The value added rate
is defined as the ratio of the value added
to the total input as in Equation (2):
The combination of the input-output table and the input coefficient matrix
yields simultaneous equations, where:
of which the mathematical description in terms of the matrix appears as in Equation (4):
where
is the unit vector,
the vector for total output,
the vector for final demand,
the vector for import and
the residual vector; in the case of the transaction table of domestic goods and services,
as export is excluded. Therefore, when the final demand
is given as an external variable, the total output
, value added
and employment
can be described in Equations (5)–(7):
where
and
correspond to the diagonal matrices for the coefficients of value added and of employment, respectively.
To analyze the inducement effects of production, value added and employment of backward industries resulting from changes in the production of a given industry, the industry needs externalization. Considering such externalization, the total output is described as in Equation (8), assuming no changes in
, i.e., the final demand of all of the other industries except the externalized one and residual
;
is the vector matrix of the input coefficients for the industries, except the externalized one, i.e.,
, so that:
3.3. Data
The Bank of Korea is responsible for the measurement, analysis and distribution of the input-output table. To estimate induction coefficients, this study used the most up-to-date table, i.e., the 2013 input-output table published in 2015, which consists of 384 industry fields in total. Utilization of the 2013 input-output table in this study to analyze the economic effects of a program that was recently launched as late as 2015 may be criticized as a limitation. However, it is noted that in the analyses of economic effects, the interindustry relationship seems more important than the precise numbers of intermediate demand and input, as well as total output and input. Furthermore, it seems hardly reasonable to assume significant changes in such an interindustry relationship year by year. Therefore, especially in the absence of 2015 data, the application of the 2013 input-output table is appropriate considering the objective and scope of this study.
This study is based on the transaction table of domestic goods and services, in which the establishment of the input structure is assumed. This is because it only reflects the structure of domestic input in the table; in other words, it is suitable for understanding the domestic interindustry relationship and comprehensive economic forecasting with the capability of estimating the effect of a given industry on the industrial structure.
4. Results and Discussion
4.1. Effect of the Smart City Industry on Other Industries
The input-output analysis reveals that the induction coefficients of production, value added and employment for the smart city industry are 1.9750, 0.6541 and 6.015, respectively. The coefficient of production induction of 1.9750 indicates a production-inducing effect as high as 1.9750 units, corresponding to a single-unit increase in the final demand for the smart city industry products and services. That is, with an increase in the total output of the smart cities of about 1.0 billion Korean won (0.87 million dollars; the exchange rate used in this study corresponds to 1 USD = 1149.70 KRW), an induced effect of production as high as 1.9750 billion Korean won (about 1.72 million dollars) is expected. By the same token, the value added induction coefficient of 0.6716 stands for the value added to the national economy, equivalent to 0.6541 units in the final demand for the output of the smart city industry. Therefore, an increase of 1 billion Korean won (0.87 million dollars) in the total output of the smart city industry corresponds to a value added induction effect of 0.6541 billion Korean won (0.57 million dollars). The coefficient of employment induction can be understood in a similar manner. The results of this study show that the effect of employment is equivalent to 6.01 persons in the national economy with a one billion Korean won (0.87 million dollars) increase in the total output of the smart city industry.
Table 2 summarizes the estimated induction coefficients of industry sectors, including the smart city industry. The induction coefficient of the smart city industry is 1.9750, which is higher than the average of the induction coefficients of the entire industries (1.9032), but lower than that of Construction (2.1481) or that of total manufacturing (2.0732; the average for 15 industry sectors from agricultural, forestry and fisheries to other manufacturing products) of the input-output table. This is because the smart city industry is not composed only of manufacturing industries, but service industries (on both the supply and demand sides), such as wireless telecommunications, other telecommunications activities, information services, software development and supply. Similar behavior is found in the induction coefficient of value added for the smart city industry. On the other hand, the smart city industry’s induction coefficient of value added is 0.6541, which is slightly lower than that of the entire industries (0.6781) and lower than that of construction (0.7309), but much higher than those of total manufacturing (0.5946) and electrical and electronic equipment (0.5454). The induction coefficient of employment of the smart city industry is 6.0105, which is lower than that of the total industry (8.6863). A similar explanation for the induction coefficient of employment is possible with comparison to other industry sectors, e.g., Electrical and electronic equipment (4.1885) and various service industries (ranging from 10.0497–27.4608). This appears to be in accordance with the recent trend in industries, where service elements, such as design, engineering and distribution had increasing significance in the value chains of manufacturing industries. As a result, the smart city industry composed of the industrial classifications proposed in this study can be summarized as being dominated by the characteristics of the Electrical and electronic equipment industry, with comparable influences of the service industry sectors, including communications and information services.
Table 3 explains the composition of the induction coefficients for the smart city industry. The induction effect of production for the smart industry consists of 1.0838 for the smart city industry itself and 0.8912 for other industries. While the induction effect of value added corresponds to 0.3685 units for the smart city industry itself and 0.2855 units for other industries, those of employment are 2.5267 and 3.4838 persons, respectively. Apart from the dominance of the smart city industry itself in the induction coefficients of production or value added, other industries also play a major role in the induction effect of employment. This may be attributed to high induction coefficients of Wholesale and retail trade, Professional, scientific and technical activities and Administrative and support service activities for other industries, which correspond to 0.6728, 0.4995 and 0.4396, respectively. The relatively high contribution of the smart city industry to the induction coefficients of employment in Professional, scientific and technical activities and Administrative and support service activities sectors supports the idea that human and social capital can be leveraged by public administration and education based on ICT, improving in turn the competitiveness of a city [
12]. This also appears to agree well with the findings of the previous studies, which empirically showed that various ICT applications in smart cities ultimately led to the build-up of intellectual capital or the creation of wealth by means of the interconnection of human and social capital via activated knowledge networks [
11,
12,
30,
31].
In the input column of the input-output table to the smart city industry shows that the smart city industry (24,633 billion KRW; equivalent to 21.426 billion USD) is likely to be closely related to Wholesale and retail trade (19,397 billion KRW; equivalent to 16.872 billion USD) and Professional, scientific and technical activities (14,357 billion KRW; equivalent to 12.487 billion USD). In the demand row for the smart city industry, closely related industries include Sholesale and retail trade (12,255 billion KRW; equivalent to 106.59 billion USD) followed by Electrical and electronic equipment (7861 billion KRW; equivalent to 68.38 billion USD), Finance and insurance (4806 billion KRW; equivalent to 4.180 billion USD) and Professional, scientific and technical activities (4077 billion KRW; equivalent to 3547 billion USD). Since the scale of input and demand transactions differ according to the industries, the quantitative relationship of an industry to other needs to be normalized.
It is further noted that the industries having a relatively closer relationship with the smart city industry can be identified, especially from the viewpoint of the backward and forward industries. This indicates that the effectiveness of the industrial value-chain centered on the smart city industry may be even more enhanced with the facilitation of the relevant industries, by systematic support from governmental entities, for example. As a result, further growth in the smart city industry may be expected. In addition to that, it is noted in this study that the service industries, rather than manufacturing counterparts, show prevalently high demand for the smart city industry: the demand of the Wholesale and retail trade industry predominate, whereas those of Finance and insurance, Professional, scientific and technical activities and Real estate and business services follow. Even on the supply side for the smart city industry, service industries such as Wholesale and retail trade and Professional, scientific and technical activities still occupy a majority, not to mention manufacturing industries including Electrical and electronic equipment, Non-metallic mineral products, Primary metal products and Metal products.
While the principal forward industries with regard to the smart city industry can be quantitatively identified by estimating the index of the sensitivity of dispersion, the backward counterparts can be that of the power of dispersion. The index of the sensitivity of dispersion is the influence that an industry experiences corresponding to a unit increase in the final demand for all industries. In other words, it can be defined as:
where
is the number of industry sectors and
.
Similarly, the index of the power of dispersion stands for the influence to the entire industries with a unit increase in the final demand for the industry. In a similar fashion to Equation (9), the index of the power of dispersion is described as:
For the sake of comparison, both indices in Equations (9) and (10) are normalized with regard to the average of the entire industries [
44,
45].
Table A1 in the
Appendix shows that the index of the sensitivity of dispersion and that of the power of dispersion in this study correspond to 1.1264 and 1.0377, both of which indicate stronger forward and backward linkage effects, respectively. In other words, the smart city industry appears to have the primary position in the industrial production of Korea, although the Primary metal products and the Chemicals industries play a key role in the production activity chain of Korea (as shown in
Table A1) based on the export-oriented economy characteristics.
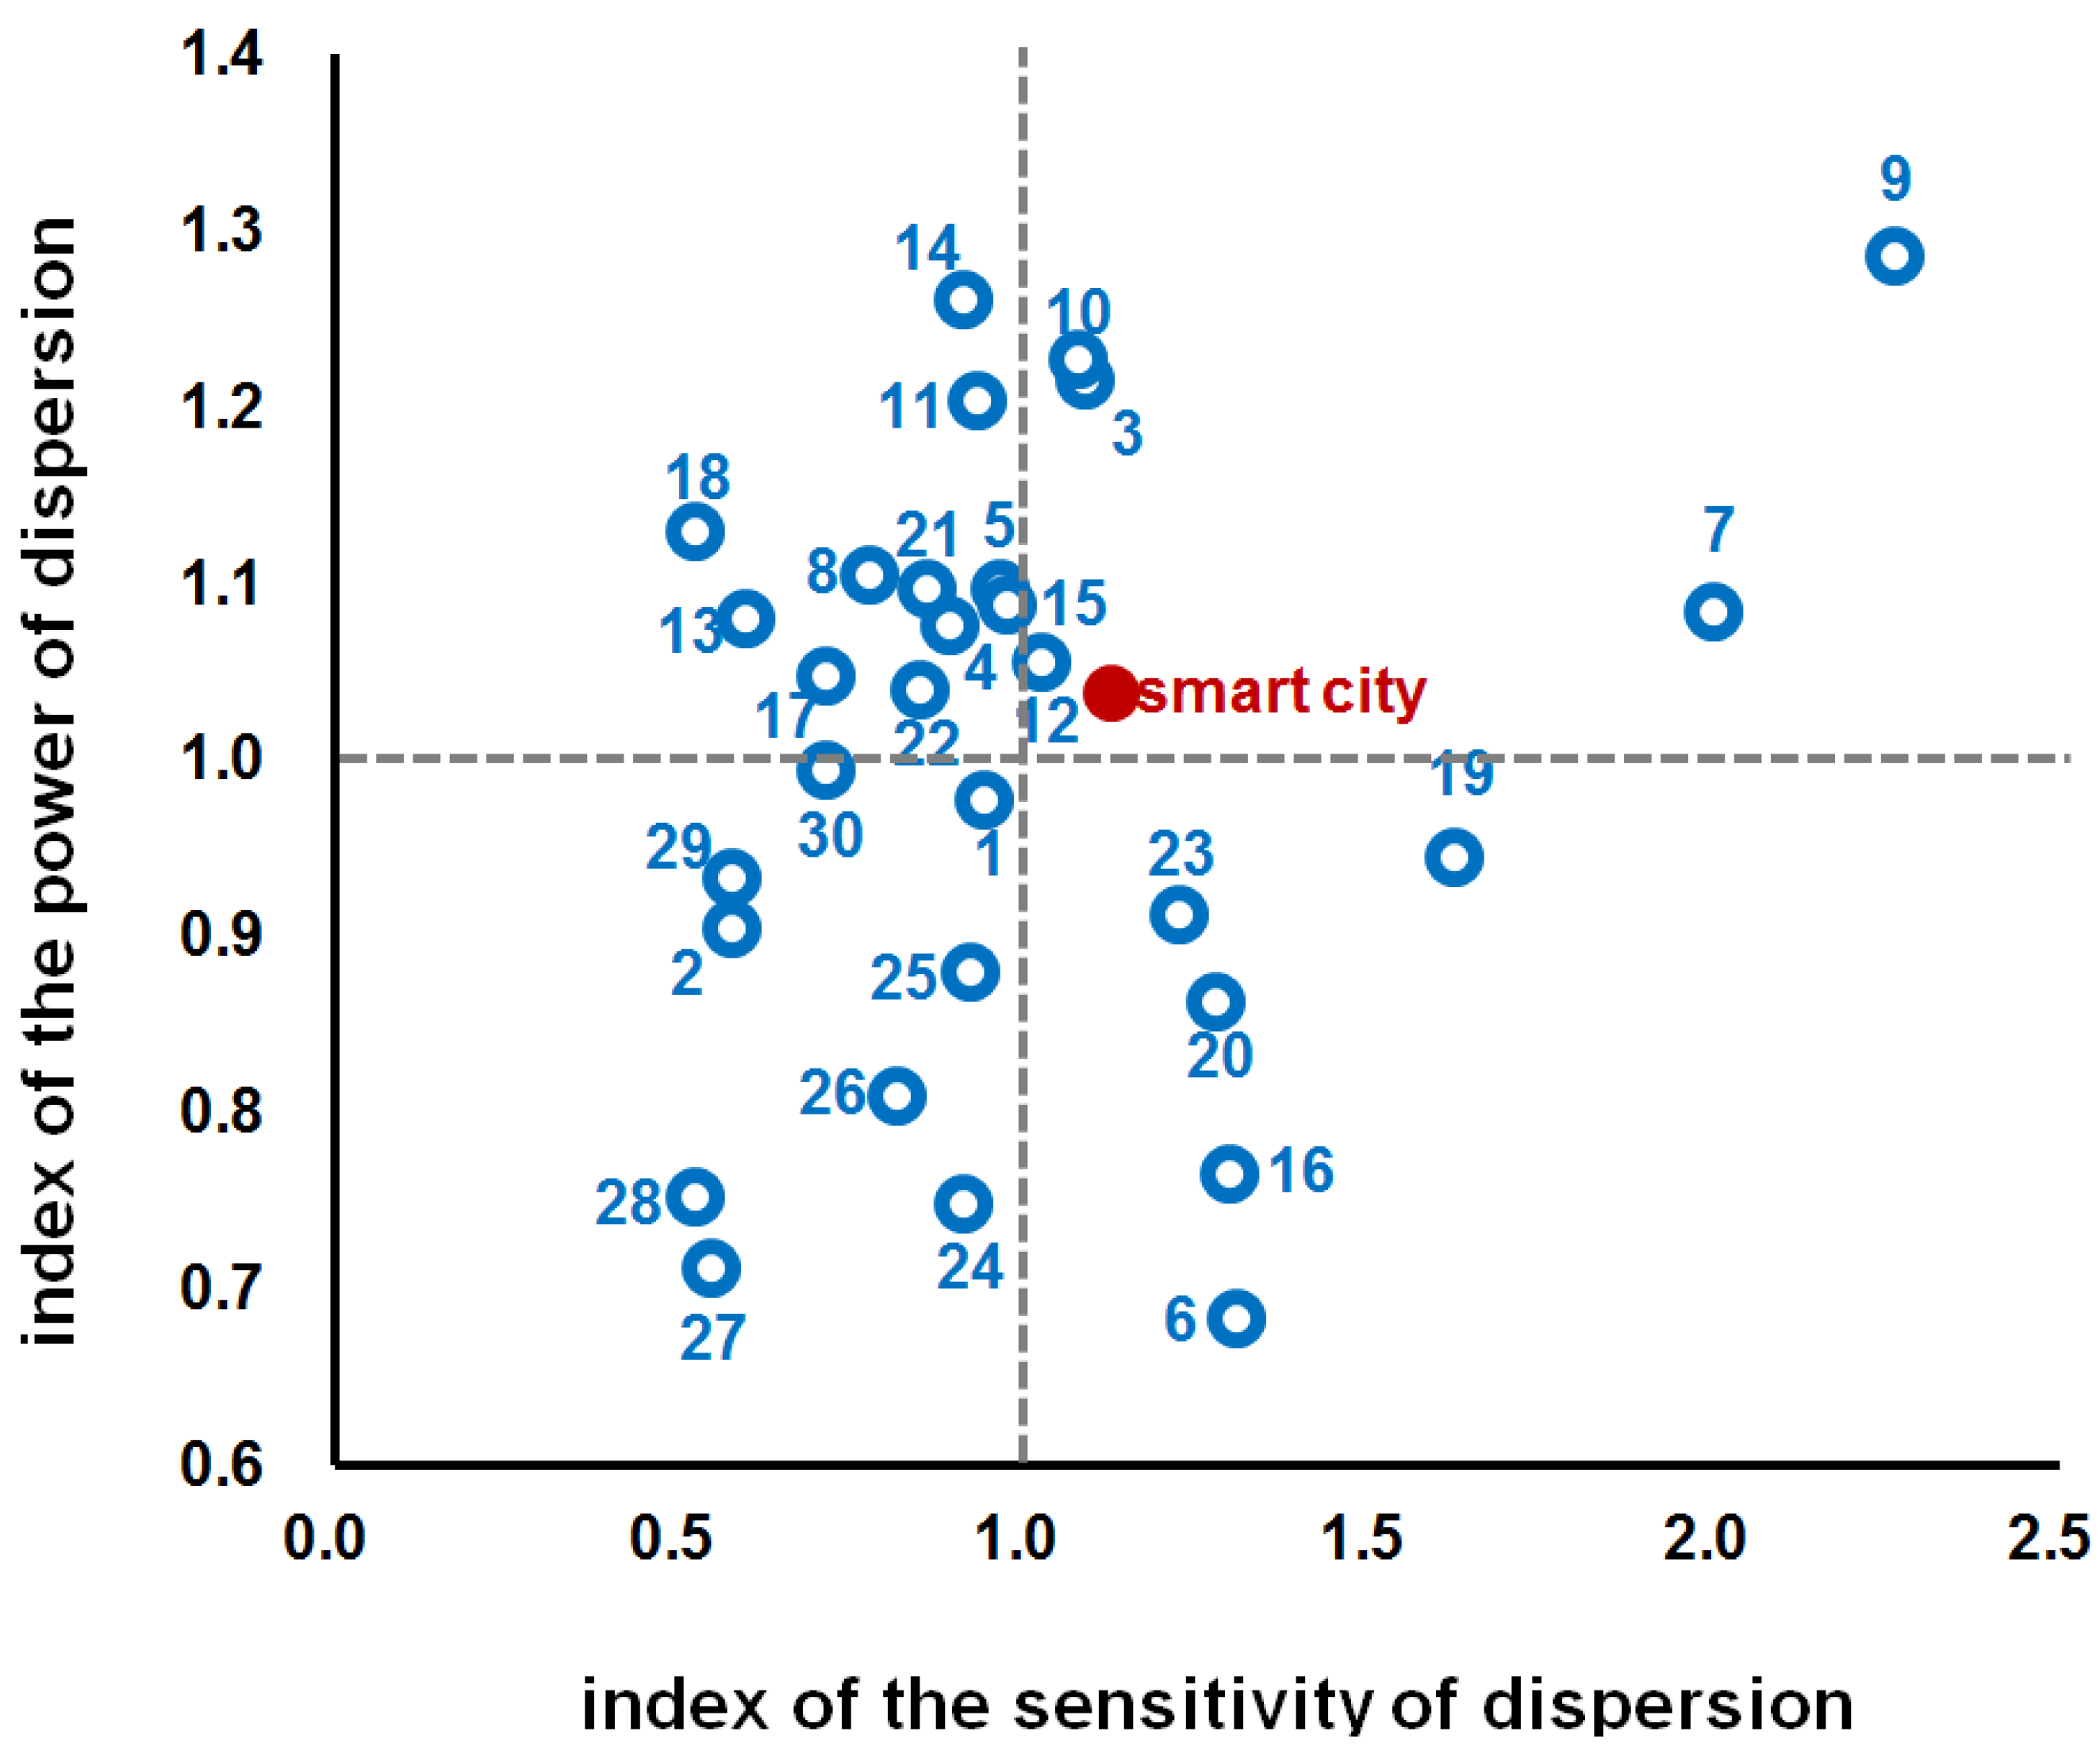
A schematic comparison of the forward and backward linkage effects per industry of Korea is provided in
Figure 2. For instance, Wholesale and retail trade, Electricity, gas, stream and air conditioning supply and Petroleum and coal products industries show relatively high indices of the sensitivity of dispersion due to the production activities of other industries; however, their impacts on other industries appear mediocre considering their indices of the power of dispersion, of which the indices are listed in
Table A1 of the
Appendix. The opposite case is found for Construction and Precision instruments industries [
45]. Therefore, the comparison of the 30 industry sectors in
Figure 2 (and
Table A1) shows that the smart city industry occupies the primary position in the production value chain of Korea, following Primary metal products, Chemicals, Metal products and Food products and beverages, which is in accordance with the findings from
Table A1.
4.2. Analysis of the Economic Effect of the Demonstration Program for the Smart City
The economic effect of the smart city demonstration program was analyzed with consideration of both public and private sector investments. Here, the public investment is the sum of the governmental subsidies, while the private investment is the sum of the local government subsidy and all of the charges to the private business, both in terms of cash and goods.
Table 4 summarizes the investments by public and private sectors for the program.
The time period for the estimation of the economic effect spans three years, from 2015–2017, during which no change in the industrial structure is assumed. It is noted that the investments for the years 2016 and 2017 are projected based on the midterm fiscal plan published by the corresponding ministry, i.e., MSIP in this study. Similarly, the private sector investments are projections, except 2.27 billion Korean won (1.97 million dollars) for the year 2015; it is assumed that the private sector will invest the same 2.565 billion Korean won (2.23 million dollars) in 2016 and 2017, based on the original plan in which 7.4 billion Korean won (6.44 million dollars) in total are to be invested.
The effect of production induction by the smart city demonstration program is summarized in
Table 5.
Table 5 shows that the governmental investment of 9.6 billion Korean won (8.35 million dollars) from 2015–2017 is expected to induce production in the national economy as much as 18.96 billion Korean won (16.49 billion dollars).
In addition,
Table 5 shows the sum of the direct and indirect effects of production in the national economy induced by the public and private sector investments of 17.0 billion Korean won (14.79 million dollars), which amounts to 33.5748 billion Korean won (29.20 million dollars).
The effect of the value added induction by the smart city demonstration program, by the same token, is shown in
Table 6. The value added in the national economy induced by the public sector investment of the program from 2015–2017 is 12.401 billion Korean won (10.79 million dollars). Inclusion of the value added induced by the private sector investment increases the total effect induced to no less than 21.960 billion Korean won (19.10 million dollars).
The employment inducement effect of the smart city demonstration program is summarized in
Table 7.
Table 7 shows that the sum of direct and indirect employment induced by the public sector investment from the program from 2015–2017 is 114 employees. When the sum of direct and indirect effects due to the private sector investment is added, this number is increased to 202 employees.
5. Conclusions
Through the implementation of input-output analysis, this study shows that the smart city industry has the characteristics of an intermediary between the ICT and urban construction industries, especially in terms of the production, value added and employment induction effects. This in turn indicates that the competitive edge of both the ICT and construction industries is key to the success of smart city programs. In fact, the successful implementation of smart cities in Barcelona (Spain) and Singapore are cases where the capabilities of the ICT and construction industries were combined. In this regard, Korea appears to be an appropriate candidate for a smart city testbed due to its strength in the ICT and construction industries. Moreover, the case of the Korean smart city is expected to yield invaluable information with regard to input-output analysis. This is because Korea has established systematic collection of national accountancy data on the industrial basis of complying with international standards, such as the System of National Accounts (SNA), by a singular entity (The Bank of Korea).
In addition, this study enables the identification of crucial industries related to the smart city industry by means of input-output analysis. It is able to significantly enhance the efficiency of externality implemented by government investment, in spite of the scarcity of academic studies on the smart city. As a matter of fact, the economic effects on the national economy induced by the MSIP program for smart city demonstration, including a total investment of 17.0 billion Korean won (14.79 million dollars) from both the public and private sectors, amount to the production of 33.5748 billion Korean won (29.2 million dollars), the value added of 21.960 billion Korean won (19.10 million dollars) and the employment of 202 employees. Further refinement in the smart city industry may lead to an additional contribution to growth in the national economy, including production, value added and employment.
This study empirically shows that the service industries, such as Wholesale and retail trade and Professional, scientific and technical activities, play no less of an important role than the manufacturing industries, including Electrical and electronic equipment, Non-metallic mineral products, Primary metal products and Metal products, as the key backward industries of the smart city industry. This is unsurprising, because the integration of the smart city requires various infrastructures for software development to implement ICT, e.g., IoT, as well as hardware infrastructures to build the smart city physically.
In other words, this study suggests that the establishment of the ICT industry is crucial if the national and municipal policies for sustainable cities back up the implementation of a smart city. Such a significance of service industry sectors facilitated by ICT infrastructure appears in accordance with previous studies, which empirically showed that a wide spectrum of ICT applications led to the accumulation of intellectual capital, ultimately resulting in wealth creation by means of interconnecting human and social capital via activated knowledge networks [
11,
12,
30,
31]. For instance, this study found the high induction coefficients of employment of the smart city industry in service industry sectors, including Professional, scientific and technical activities and Administrative and support service activities, supporting the idea that human and social capital can be leveraged by ICT-based public administration and education, thus improving the competitiveness of a smart city [
11]. In this regard, such service industries need to be based on the actual demand for ICT services, which enables maximized efficiency with minimized cost, rather than the public services that are likely to be supplier-oriented, leading to failure in persistence due to an inappropriate revenue model. Another interesting characteristics of in this study is that the smart city industry shows a significantly high forward linkage effect with regard to the service industries such as Wholesale and retail trade, Finance and insurance, Real estate and business services, Professional, scientific and technical activities from the viewpoint of the industrial production value chain of Korea. Considering both the forward and backward linkage effects, i.e., overall supply and demand for all of the industries, smart cities are ranked in the top five industries, indicating again the importance of the smart city industry in the production value chain of Korea. Considering the impact of the smart city industry’s growth, both the forward and backward, including its services, industries and policies, the smart city is expected to play a key role not only in the sustainable city, but also in the growth of the national economy.


