Article

Underground Potential for Urban Sustainability: Mapping Resources and Their Interactions with the Deep City Method

Laboratory of Environmental and Urban Economics (LEURE), École polytechnique fédérale de Lausanne (EPFL), Station 16, CH-1015 Lausanne, Switzerland
*
Author to whom correspondence should be addressed.
Sustainability 2016, 8(9), 830; https://doi.org/10.3390/su8090830
Submission received: 13 June 2016 / Revised: 16 August 2016 / Accepted: 16 August 2016 / Published: 25 August 2016
(This article belongs to the Special Issue A Contextual and Dynamic Understanding of Sustainable Urbanisation)

Abstract

:
In the process of urban growth, the underground is often only addressed once all surface alternatives have been exhausted. Experience shows that this can lead to unforeseen conflicts (e.g., subsidence, groundwater pollution) and to lost opportunities (e.g., combined geothermal systems and building foundations or recycling of excavation materials). One challenge is how the underground potentials are assessed by urban actors; data collection, analysis and visualization for the different resources are often conducted in separate disciplinary corners and administrative divisions. This paper presents a mapping method developed within the Deep City project at the Swiss Federal Institute of Technology in Lausanne (EPFL) and its application to San Antonio, Texas. San Antonio is interesting in its lack of major underground infrastructure and its few means and political support for short-term underground development. We will specifically look at the production of a series of interaction maps, an original mapping strategy that is complementary to the resource potential maps we have produced in prior work. After situating this research within larger theoretical and philosophical questions, we will show how mapping the combined potentiality of underground resources can serve as a compass for future interdisciplinary discussions that address the urban underground as a source of opportunity, rather than as an afterthought.

1. Introduction: Mapping the Urban Underground

Cartographical representations of the city are typically founded on the ground plane. This has contributed to a dominance of the bird’s eye views in urban planning and to a general absence of the underground in theoretical models of “good” city form. These normative and prescriptive models, of which cosmological, mechanical and ecological are the most recurrent, tend to impose upon the landscape an idealized form that responds little to the local context [1]. In the cosmological model, the underground often remains symbolically as a place into which one descends in death or in ritual acts of rebirth [2]. At the turn of the twentieth century, the popularity of addressing the city as a machine inspired urban planners and engineers, such as Eugène Hénard [3] and George Webster [4], to call for a rational integration of the subsurface into aboveground urban systems of transport and logistics. In this same vein, Édouard Utudjian founded the GECUS (Groupe d’études et de Coordination de l’Urbanisme souterrain) in 1933, which campaigned well into the second half of the twentieth century for an “underground urbanism” [5]. Within this normative model of the city as machine, geology and geography feature only as obstacles to be overcome through advances in technology.
The growing awareness of environmental degradation due to rapid urbanization gradually turned city planning and design to natural processes as an inspiration in thinking of the city as an organism [1]. Landscape architect Ian McHarg’s work, including “Design with nature” [6], called for geology to be a principle constraint in city design and established a tradition of overlaying geographical information in a single map in order to identify latent synergies and conflicts [7]. The “biophysical world” becomes a source of a planning “ethic” [6]. This version of the ecological model has been pursued to this day by a number of urbanists who seek to elaborate design responses to interactions between human settlements and ecological processes [8,9]. In their work, however, the underground, understood as geology and hydrogeological processes, tends to be a point of departure for surface and near subsurface (within the first couple of meters) design and planning interventions. Only recently has someone in this intellectual community proposed to consider all “altitudes” of urbanization, from the deep subsurface to the sky [10].
The approach to the underground within the norms of the mechanical model tends to be reductionist and to prove problematic in the long term. On the one hand, conflicts have occurred between competing uses. Mexico City is well known for its century-long problem of subsidence. Heavy pumping of the urban aquifer has led to a decrease in groundwater levels and a gradual drying up and sinking of the highly compressible lacustrine sediments underlying much of the urban area [11]. In Paris, a similar problem led to a moratorium in the 1960s on overexploitation of the aquifer, which resulted in a rise of the water table and a flooding of buildings with basements built according to former groundwater levels [12]. Paris, like New York and many other cities, suffers from a congestion of infrastructure beneath its streets. On the other hand, the rationalization of decision-making processes has led to disciplinary divisions in the collection, visualization and analysis of data [13]. Within this paradigm, urbanization tends to first formulate needs and problems and only later examines the potential of resources to meet or solve them [14].
Design practices operating within the ecological model tend towards the reverse logic, one in which the potentiality of resources is investigated prior to needs. Mapping and the map overlay tradition initiated by Ian McHarg seek to establish the “conditions for the emergence of new realities” [15]. In interdisciplinary planning practices, however, the ecological model returns to a mechanical rationalization of stocks and flows. Borrowing from cybernetics and 19th century thermodynamics, the city is viewed as an organism whose metabolism drives towards “balanced flows of energy and materials between the human and natural subsystems of the material realm” [16]. Within the imperatives of sustainability and resilience, this means, respectively, managing resources locally so that global stocks are not depleted and so that shocks to the (eco)system will not prove fatal or destructive. Achieving such a balance requires knowing in advance for which needs resources are entering and leaving urban systems [17]. This returns the planning process to one oriented towards needs, which are met by carefully controlling the inputs and outputs of resources.
The alternative paradigm, of resources to needs, which the Deep City project is advocating, does not presume a global balance as a point of departure or return. This precludes thinking in terms of the shortest and least path of resistance for underground resources in the evaluation of their potential in diagnostic phases. The underground is no longer, like for Hénard or Utudjian, simply a source of stabilization mechanisms for a system to be optimized, but rather a source of novelty, of evolution and change. Novelty and invention rely on the importing of information that is otherwise as yet undetermined. Information theory, taking thermodynamics beyond the 19th century understanding, refers to this information as negentropy. According to Léon Brillouin [18], there are in fact two types of negentropy or information, one that participates in maintaining the current capacities of the system and the other that was considered “free” or of “no specified physical significance”. Both are of relevance to a sustainable mapping of the underground that embraces the information available already within the system and that which circulates “freely” like noise on a channel, information whose meanings have yet to be interpreted [19].
Most maps that account for the underground are needs-driven and sectoral. The evaluation of potential and suitability is already oriented towards a particular resource. In response to land scarcities, Helsinki, Hong Kong and Singapore are investigating the potential for the local geology to accommodate underground space [20,21,22]. Cities like Montreal and Toronto, which are often cited in the literature as exemplary cases of underground urbanism, remain space-oriented. Their expansion has been driven more by private investment than a masterplan or a diagnostic map of space potential [23,24,25]; potential was simply locally intuited case by case. In China, eleven cities are in some way incorporating underground space in their masterplans [26]. The Qingdao case study presented by Zhao and colleagues [26] is exceptional in that the construction potential is geographically situated and multi-level. However, the geological formations and groundwater are only incorporated as constraints on the space resource, not as potential resources in themselves. What is the use value of excavated materials? Could groundwater be reused locally? What about thermal conductivity for geothermal cooling or heating systems? The message that urban underground space should find its way into masterplans has been heard, but the fact that this “space” comprises multiple resources has not [27,28].
Despite being oriented towards underground space, in these examples, the existing urban form and distribution of activities is addressed as a limiting factor. The Helsinki plan only includes existing underground structures and potential cavern entry points [20]. The Hong Kong cavern master plan identifies openings and land ownership status [21]. The method used in the Qingdao study includes distributions of land uses, population densities, transit networks or property status, but these are understood as indicators of possible demand [26]. Lu and colleagues [29], in their rail station case study, only evaluate geological suitability, independently of the station’s urban context. The urban form is not only a passive source of demand, but also supplies a particular potential that is both latent and actual. The existing urban structure is the result of accumulated spatial practices over time periods of different scales. This structure is maintained not only materially, but also socially, by the continued presence of activities and people practicing the spaces of the city [30,31]. They have both imported information that has contributed to their evolution and encode a certain amount of possibility that is latent, but that can be deciphered intuitively [32,33] and mathematically [30,31].

2. Deep City: Resources to Needs

The Deep City project at the Swiss Federal Institute of Technology (EPFL) has for almost ten years been working on cartographical, legal, political, social and economic strategies to better address the urban volume (potential space, groundwater, geothermal energy and geomaterials) in the maintenance and evolution of urban areas and their surroundings [14]. The cartographical method is founded upon the principle that all resources must be taken into consideration and that no resource in its exploitation should be considered in isolation from the synergies and conflicts it may have with other resources. This is markedly different from existing mapping methods where conflicts tend to be minimized at the expense of synergies. It is also important for the mapping method to be able to make use of the data on hand, particularly in urban contexts where limited use of the underground has produced general or very project-specific information. Additionally, as the maps are intended for use by non-geologists, the geological formations are classified into geotypes according to their genealogy (Quaternary, Mesozoic, etc.) and sedimentology (petrographic/mineral qualities) [34].
Without geographical information systems (GIS), map overlaying is limited to the superposition of multiple layers. The quantification of criteria facilitates the synthesis and analysis of map data. Where existing quantitative data on the geological properties is scarce, the tacit knowledge of local experts is translated into quantitative data situating elements on a relative scale using the analytic hierarchy process (AHP) [35]. AHP places n elements in an n × 
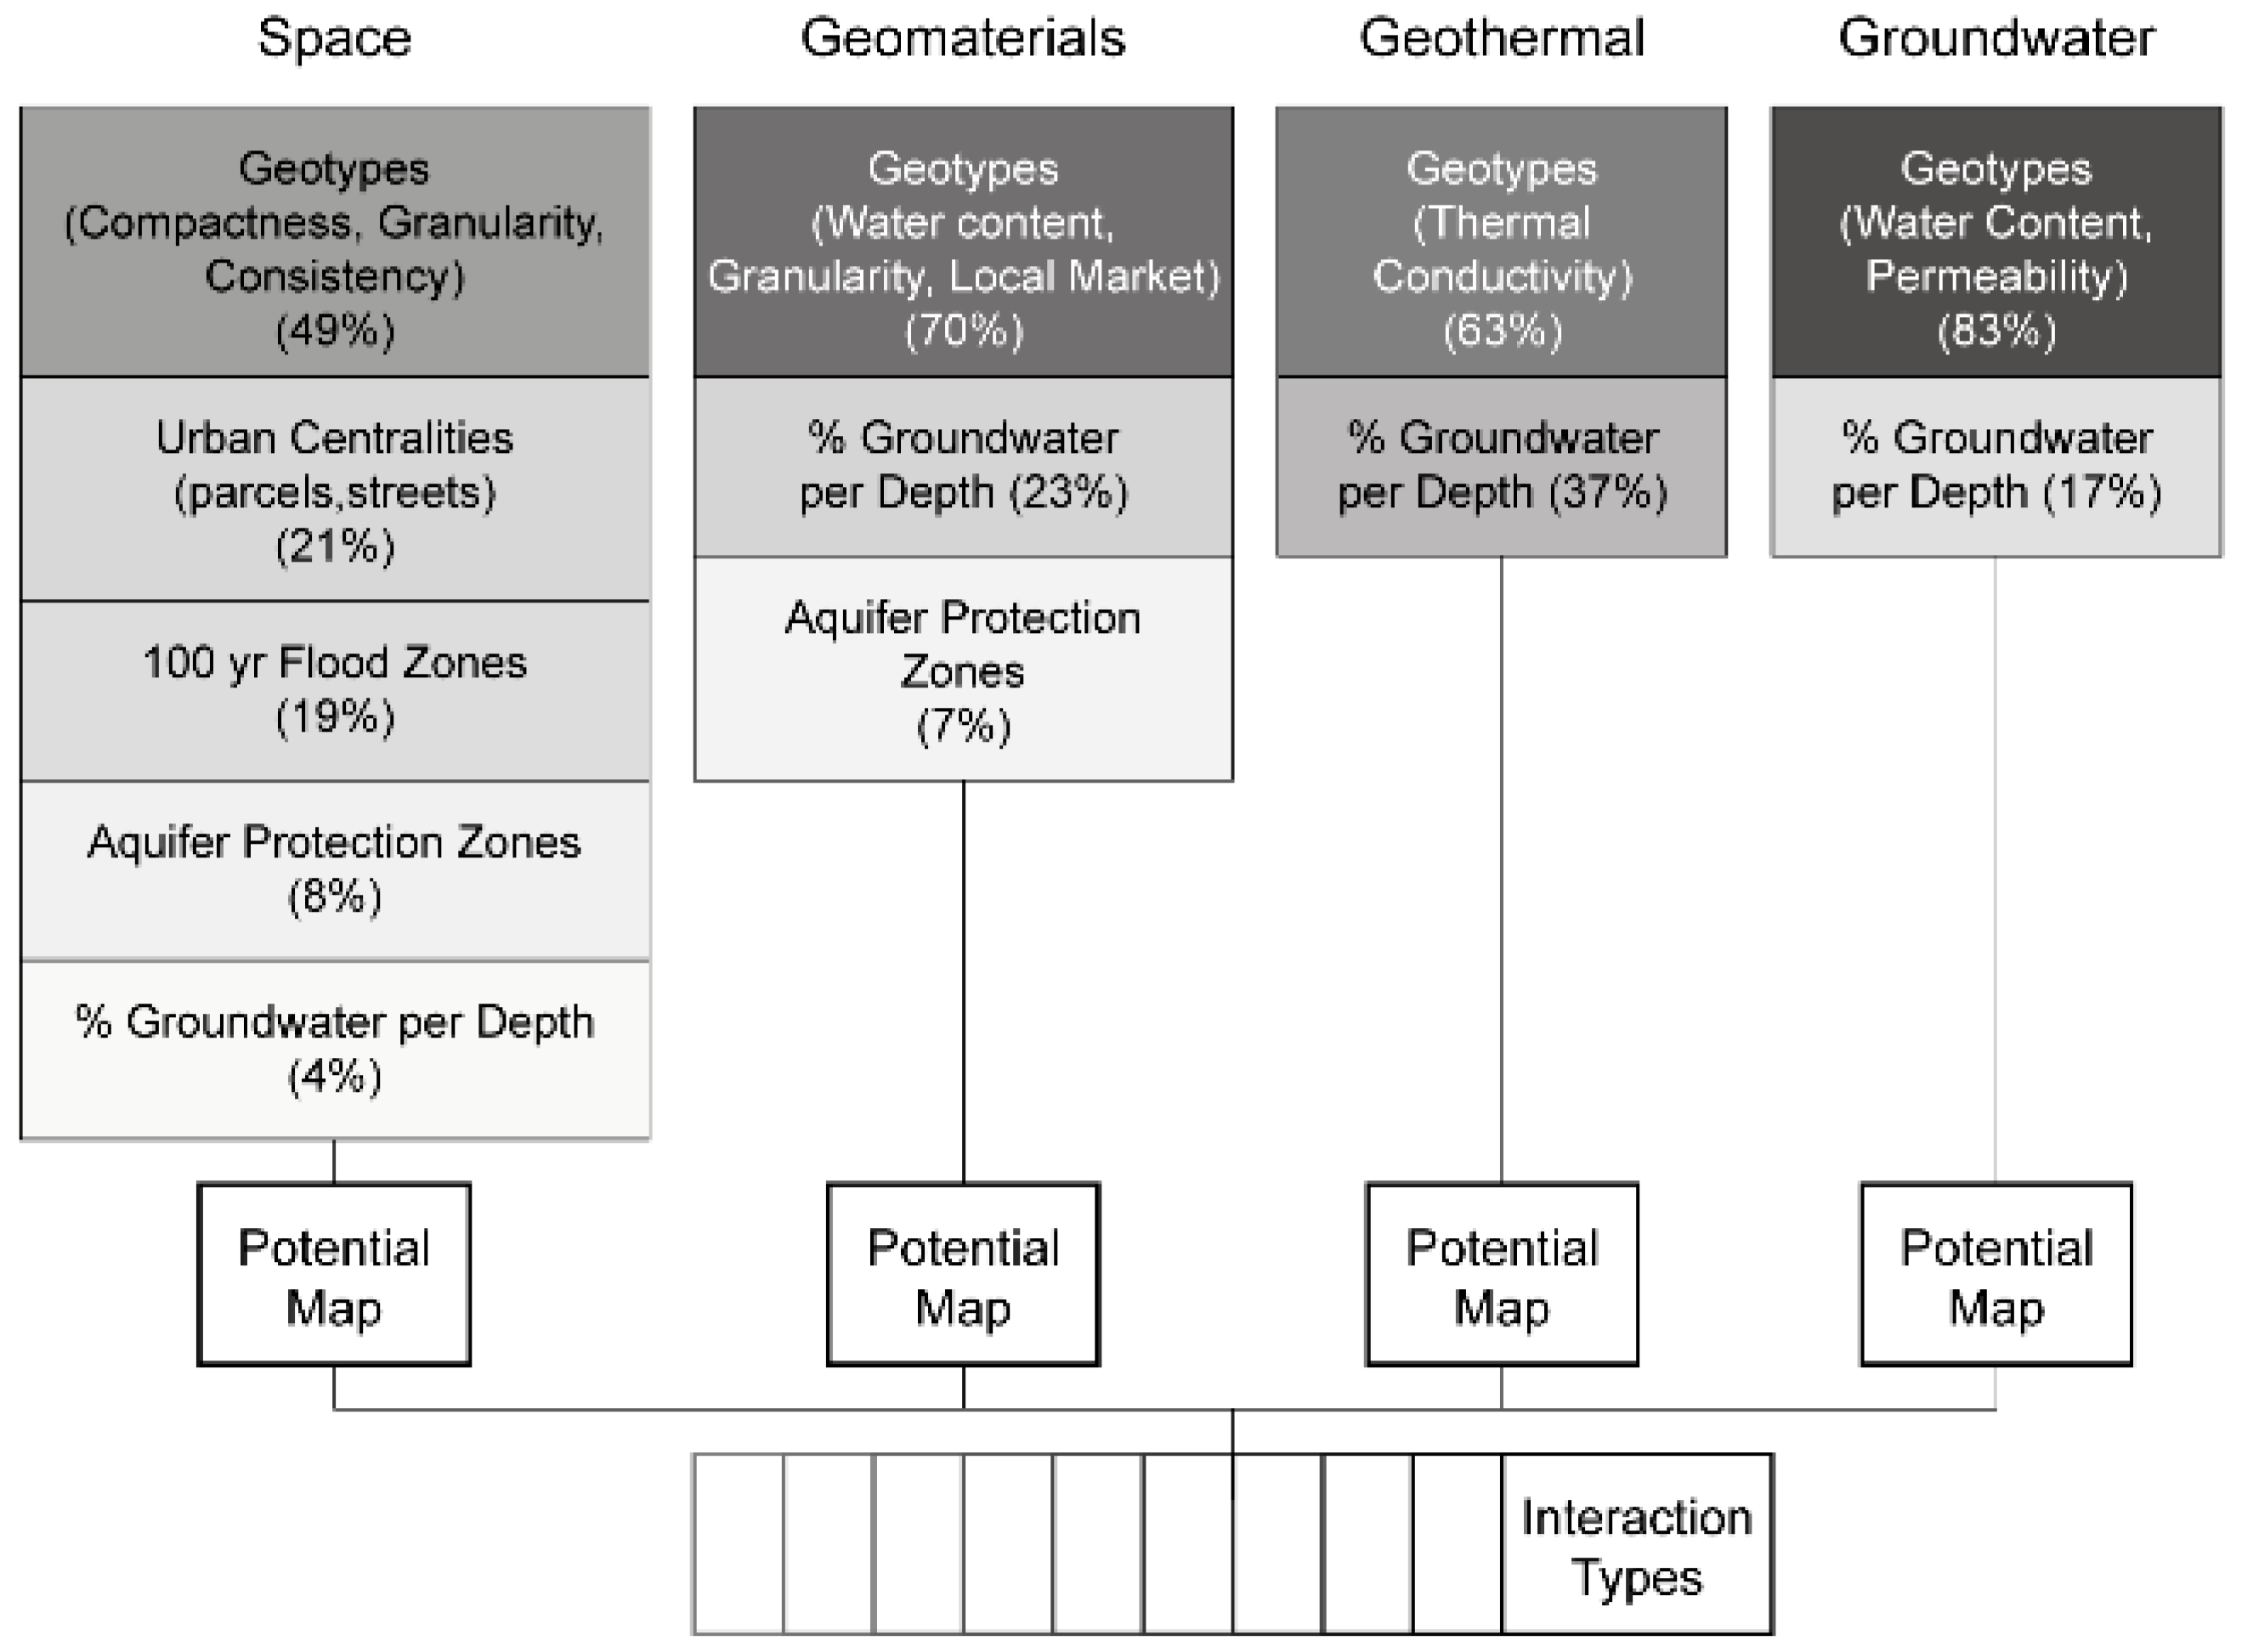
n matrix and evaluates each element pairwise according to a particular criterion. For Deep City, these criteria are the potential of each geotype to be a better alternative for space construction (compactness, granularity and consistency), as geomaterials (water content, granularity, value in the local market), for the presence of groundwater (water content and permeability) and for geothermal systems (based on conductivity), as derived from either local experts (geologists, hydrogeologists, etc.) or geotechnical and geomorphological descriptions of the formations that were used to define the geotypes. AHP can also be used to situate each resource on a relative scale of priority when passing from overall multiple to single-use potential, allowing the Deep City method to be relevant for needs, as well as resource-based mapping.
The analytic hierarchy process is a widely-used method for the quantification of priorities and preferences for evaluating underground resource potential. The case study of the city of Qingdao mentioned earlier quantified the suitability of the geology at multiple depths for underground space construction. Criteria include geological conditions, construction status and development value (including population distribution, location, land use and economic conditions) [26]. Pairwise comparisons by experts determined the relative importance of each criterion. Lu and colleagues [29] also evaluated geological suitability for underground construction referring to expert opinion on geotechnical properties, geological structure, geomorphology, hydrogeology and adverse geological conditions. Their case study of the Wuchang Railway Station mapped suitability values according to the depth at which development was forecasted. Both studies account for uncertainty in the pairwise scores and the relative importance of each criterion in the evaluation using fuzzy sets, which permits either the preference information or the aggregation process to vary over a set of values [36]. Zhao and colleagues used fuzzy set qualifiers [36] in aggregating the decision criteria in response to different attitudes toward risk by decision-makers. Lu and colleagues incorporate a fuzzy set directly into the pairwise comparisons as a way to address dissensus in the expert opinions. Fuzzy sets provide an interesting way of addressing risk and uncertain in terms of group membership.
The Deep City mapping method has been tested on three cities, with a fourth and fifth currently underway. A first case study conducted on the city of Geneva tested the use of the AHP for evaluating the resources and fuzzy qualifiers for handling different degrees of risk [12]. A more extensive study was later carried out in collaboration with Nanjing University on the Chinese city of Suzhou, where the potential for underground space development was investigated using geological characteristics as supply criteria and urban characteristics as indicators of demand [37]. The AHP was used without fuzzy qualifiers as an aggregation method. San Antonio, Texas, was taken as a case study of the city where there is no explicit demand for underground space, but a complex relationship to an urban aquifer. Case studies that are still underway include an evaluation of the basement potential for Hong Kong as a complement to the cavern map [21], including urban form as a supply source for commercial activities, and on the city of Dakar in Senegal where groundwater is a challenging source of synergy and conflict [38].
One major addition in the recent work, and one that constitutes the originality of the Deep City method in its current state, is the integration of surface or near subsurface urban connectivity into the evaluation of underground potential. We propose to decipher this potential in terms of the urban structure’s current capacity to support different types of underground spaces. The interest in incorporating underground space into strategies to increase urban density or preserve public spaces means that we have focused on mostly those types of activities that find themselves in the urban subsurface, notably parking and commercial activities. Both types of places tend to benefit from high centrality. Being centrally located is often necessary to offset the additional construction and land acquisition costs that building underground entails [39]. Rather than situate population or existing building density as possible indicators of demand, as with our Suzhou case study [37], we take them as constitutive of potential, because we are looking at what the urban form and the distribution of activities affords in terms of potential scales and dynamics of movement (rather than the movement itself through origin-destination surveys or tracking data). Research using centrality metrics like closeness (proximity) and betweenness (being situated on shortest paths) suggests that centrality at multiple scales provides a certain sustainability and resiliency in the urban form [40], and this has been found to be beneficial in particular for commercial activities [41,42].
The research presented in this paper will return to the San Antonio case study, building on a previous article [43]. That paper evaluated the separate resource potentials using the AHP and aggregated them according to a scenario of underground space development using fuzzy qualifiers to account for different attitudes towards risk, similar to the work by Zhao and colleagues [26]. Urban potential was calculated using centrality metrics (gravity and betweenness) of non-residential property to commercial spaces and residential spaces at 10-minute walks of 800 m. The results of the evaluation of resource potential indicate that the inner 410 ring (Figure 1) has a relatively high (within the 25th to 5th percentiles) underground construction and geomaterial excavation potential in the north (among the limestone and marl geotypes) with the southern portion characterized by groundwater, geothermal and space potentials that are all situated within a mid to low potential (60th to 90th percentiles) amidst the sand and clay geotypes. A good portion (77%) of the central downtown area is characterized by a medium to low potential (within the 50th percentile or higher) for all four resources. The overall potential within the 410 ring increased from 0.54 (between zero and one) to 0.66 in the risk-taking aggregation scenario and decreased to 0.36 in the risk-averse scenario. The resource potentials of two transit stops along projected surface light rail and bus rapid transit corridors were examined in more detail. The Woodlawn stop, situated along a commercial street in a neighborhood, had an overall high potential (within the top 20th to 10th percentiles) for groundwater, geomaterials and construction of underground space, as well as a relatively high destination potential to both commercial and residential (top 5%), revealing its potential for transit-oriented development. The Westside Multimodal Transit Center is situated in a neighborhood on the edge of the central business district where it is relatively disconnected (80th percentile) from residential areas. Its highest potential is for underground construction (25th percentile), but its geomaterials are of little reuse value due in part to their level of saturation (placing them in the 65th percentile). Geothermal and groundwater systems may be of greater interest (45th to 40th percentiles), but the interactions between them would have to be carefully monitored. If the Woodlawn station scores higher for combined resource interactions in the risk-taking and risk-neutral scenarios, both locations score almost equally for the risk-averse scenario.
Taking the San Antonio case study as a point of departure, while avoiding unnecessary repetition of information presented there [43], this paper will present an analysis that tests an alternative aggregation procedure. Rather than aggregating the four resources with an emphasis on underground space construction and incorporate fuzzy qualifiers as capturing attitudes towards risk, the aggregation procedure will weight each resource with equal value, and fuzzy logic will be used to identify a series of interaction profiles to which each location will be assigned membership. This will allow for a non-deterministic, risk-neutral approach to evaluating potential resource interactions, leaving the decision of the best or most optimum use to a later interdisciplinary planning process accompanied, of course, by more detailed site investigations. In the Results section, the Westside Multimodal Transit Center will be examined again under this alternative mapping procedure, comparing with the results from the needs-oriented method adopted in the aforementioned article.

3. San Antonio, Texas: Extractions, Constructions and Transformations

3.1. Conditions: Geology, Aquifers, Geothermal Energy, Urban Structure

Located in Bexar County in south-central Texas, the city of San Antonio is, as of 2015, the seventh largest city in the United States with a population of a little over two million and an average population density of 1100 people per square kilometer [44]. Like many North American cities, its population growth over the next ten years is expected to be around 1% per year [45,46], and nearly 80% of work trips are made alone in an automobile [47]. Although it is difficult to compare cities using such general statistics, it is evident that San Antonio does not display any urgent need for underground space development. Surface land is plentiful enough to support the activities of the population for several years to come. As evidenced by proposals made by the City Design Department [48] and the feasibility studies mandated by the VIA Metropolitan Transit [45], there is an interest in consolidating urban activities and linking them by attractive transportation alternatives to the automobile. Presumably, the lack of extensive underground space development means that certain synergies remain to be explored and conflicts avoided.
To say that San Antonio has no relationship with its underground resources would be to ignore other affordances of the groundwater and geological formations. Almost 75% of the drinking water comes from the Edwards aquifer system situated beneath most of the city [49], requiring a rate of extraction that places it on the World Hydrogeological list of 122 cities where overexploitation is a growing risk [50]. Most inhabited areas in Bexar County lie over the artesian and recharge zones of the aquifer (Figure 2), the former being the location where water flows naturally without pumping in wells and the latter where rainfall and surface springs feed into Edwards. A transition zone, which contributes to a lesser degree to aquifer recharge, has been identified by the San Antonio Water Services (SAWS) between the two. The southern border of the artesian zone is determined by the underground infiltration of sea water from the coast. The movement further inland of this line, which threatens the affordance of the aquifer as a source of drinking water, is monitored regularly by SAWS and the U.S. Geological Service (USGS) [51]. Above Edwards, small locally-confined groundwater resources provide secondary sources of water for irrigation and industrial uses [52].
San Antonio is situated on the Balcones Fault Zone, which not only structures the Edwards aquifer system, but also explains the variety of geological strata that are visible on the surface. Permeable karstic limestone formations constitute the major geological formations found in the northwest portion of the county, with clay and sand formations of limited permeability making up the geological conditions in the south (Figure 1). The location of the permeable formations coincides with the aquifer recharge and transition zones. Traversing these substrata and carried mostly by the river systems of the San Antonio, San Pedro Springs and the Leon and Salado Creeks are a series of quaternary alluvial formations that are around six to fifteen meters deep and coincide in particular with the downtown and the historic neighborhoods of the city. The pattern of urbanization follows the ease of foundation construction afforded by the geology. The expansion of the city northward (in the directions of Kendall, Comal and Guadalupe counties) has occurred mostly over the stable limestone formations, while the tendency for the clay and sand formations to expand and contract renders construction more difficult [52].
Around Bexar County, the different geological formations are extracted and transformed for reuse as building and construction materials. According to the Texas Mineral Resources Map maintained by the Bureau for Economic Geology, Texas is one of the nation’s leading producers of limestone, and there are thirteen limestone quarries in the San Antonio area, according to mine data [53]. The limestone is relatively easy to extract and is used for bulk building materials in roads and concrete aggregates. The sand and gravel formations serve for the construction of roads, sidewalks and building foundations. Much of the asphalt used in San Antonio’s roads is locally produced, and the clay formations are reused for fabricating bricks and cement [54]. The local production of building materials is praised for saving costs in infrastructure and is seen as an important mainstay in the San Antonio economy [55].
The interactions between urban expansion, water extraction and mineral transformation has led San Antonio to develop important management instruments. The benefits of the synergetic affordance identified historically by patterns of settlement and the quarrying of limestone are countered by the need to monitor the quality and quantity of the groundwater available. The groundwater resource must be maintained within certain limits, in order to continue to provide drinking water to current and future populations. The flow of the aquifer varies from 0.4 to 4 m2/s throughout the region [56], making pollution difficult to control and its source difficult to identify. The Edwards Aquifer Protection Program has existed in several forms since the 1950s and regulates the types of activities and permits necessary in order to build or operate in the recharge, transition and contributing zones [57]. A section of the Texas Administrative Code directly addresses these three zones, requiring special permission to build roads, highways, residential buildings of a particular size, storage tanks and to clear or excavate. The recharge zone is perceived as the area most at risk and the contributing zone the least at risk [58].
With the apparent abundance and low cost of petroleum and natural gas in Texas, there are only a few cases of harnessing the conductive capacity of the geology and temperature of underground water resources for heating, cooling or electricity production. A report published by the Texas State Energy Conservation Office [59] named geothermal energy as an untapped potential, in particular for three affordances of geothermal energy: (1) geothermal heating, ventilation and air-conditioning systems (HVAC) systems through geoexchange (the conduction of heat into or out of the ground), (2) direct use (such as for spas) and (3) electrical power production (using vaporized water pressure to run turbines). The subsurface temperatures in the San Antonio area favor all three of these uses, with electrical production more feasible (and cost-effective) in existing oil or gas fields (in the southern portion of the county) where extraction tends to remove large volumes of pressurized hot water at the same time. Geothermal HVAC systems are the applications that are most likely to appeal to private home and building owners, and the management of underground resources would need to consider their interactions with other uses. The authors of the report [59] underline the need to manage the extraction and discharge loops of water, where geothermal systems are open (or are producing electricity using geopressured-geothermal resources). Closed systems that rely only on thermal conductivity (geoexchange) pose only the problem of going so deep that they impede potential future activities in the underground [12].

3.2. Analysis: Data Sources, Transformation and Conversion to Relative Scales

In order to develop relative scales of potential, several sources of data were compiled in a geographical information system (Table 1). The geological map published by the USGS was taken to represent the geological conditions at the near subsurface (excluding soils), and the substrata map published in a geological report from the 1960s was understood, when compared with sections available with the map and in other sources [52,60], to represent the geology at about a 30-m depth. In order to identify the location of groundwater (either from the Edwards or other locally-confined aquifers), well data containing the potentiometric level of the groundwater (the level to which it would rise in its artesian state) were converted from a point to a raster surface using a kriging algorithm available in ArcGIS 10.3. The regulated aquifer zones and the 100-year flood zones were also included as conditioning the affordance of the geology in particular areas. The urban form of the surface was represented using data from the Bexar County Appraisal District (BCAD), which records the current value, activities and built surface area of all land within the boundary of the county. A spatial network model was built in ArcGIS by locating the parcels as address points along street segments. The resident population of each parcel was estimated using U.S. Census data available in GIS format distributed proportionally to each BCAD residential parcel within the tract. Excluding the data acquired for a nominal fee by writing to the BCAD, all data are freely available online.
The geotypes were evaluated in pairwise comparisons for each of the four resources, per the analytic hierarchy process, which has been presented in greater detail elsewhere [43]. This evaluation is not location-specific and other characteristics can affect construction suitability, which we account for by incorporating the geology as an evaluation criterion compared to several others. Preference is given for locations where the groundwater saturation is lower, which are outside of the 100-year flood zones and the Edwards protection zones and where parcel commercial and population centrality is higher. Each additional criterion was quantified according to its own internal relationships. For instance, it was considered to be preferable to be outside or in the areas of lower risk of the aquifer protection zones. Groundwater saturation was left as continuous values (where less is always better in the case of the space potential). This additional data constituted the elements in a new matrix constructed for each resource, the pairwise comparisons for which were carried out through discussions among the authors. This process would ideally be carried out by local experts. For the potential of buildable underground space (Table 2), for instance, the quality of the geology was judged to be more important than the amount of groundwater present, because the presence of groundwater is an approximate estimation based on well data. Local investigations would have to follow once certain areas of interest were identified. For each resource, the comparison matrices were developed in the same way.

3.3. Synthesis: Mapping of Aggregate Criteria and Potentials

The relative scales resulting from the calculation of affordances using pairwise comparisons can be aggregated per resource (Figure 3). In our GIS model, this is accomplished by first converting all vector data into a 50 by 50-m grid raster dataset and then calculating potentiality for each cell. Because the entire region for which data are available is of interest to us (here, at county level), conversion into a grid provides a single spatial unit that is divorced from political or topographical boundaries. The relative scores are situated between zero and one (or zero and 100 if presented as percentages) and can be compared from one resource to another.
Whereas the approach adopted in our previous work [43] demonstrates the visualization of the four resource potentials in a single map, in this paper, we explore an alternative strategy that is indifferent to (admittedly volatile) attitudes towards risk. A multi-use approach places the emphasis on the potential to develop multiple resources in a single location. Previous work by our colleagues laid out some examples of these, in both their positive (geothermal energy-collecting building foundations) and negative (aquifer-polluting geothermal conduits) forms [12,14]. Interactions between construction, excavation and the use of geothermal energy suggest different potentialities than those formed by interactions that include groundwater. They imply different discussions and different stakeholders who participate in those discussions. In order to produce interaction maps, we propose to characterize locations according to their degree of overlap in potential and to combine the extraction (geomaterials) and construction (space) potentialities because they are coupled in transformation activities. Three different potentialities mean eight different combinations, including those where there is no presupposed interaction (e.g., where only geothermal scores highly). For example, an interaction between geothermal and groundwater potentialities is one in which geothermal and groundwater both equal one (and where construction/excavation or space and geomaterials is zero).
A similarity index for each of the 1,301,102 locations in the 50 by 50-m grid of Bexar County was calculated in ArgGIS 10.3 (Esri: Redlands, CA, USA, 2014) using the eight resource potential combinations as candidate features. Normalizing their values (between zero and one) and plotting them according to percentiles reveal the dominant potentials in the county (Figure 4). Interactions between space, geomaterials, groundwater and geothermal (SpGm + Gw + Gt in Figure 4), as well as space and geomaterials and groundwater (SpGm + Gw) appear to be those that would need to be addressed over the largest part of the territory (with the 90th percentile situated between 0.9 and 1.0). The overall range of similarity scores suggests that interactions between all three potentialities (SpGm + Gw + Gt) is the most pressing (with almost all values situated between 0.5 and 1.0). Interactions between space, geomaterials and groundwater, as well as geothermal alone (with no interaction) have a larger range of middle values (that is, only half of all locations in the study area displays a strong degree of similarity to these particular combinations).

3.4 Local Potentiality: The Underground Potential of a Future Transit Hub

The significance of these values depends to a great deal on where they are located relative to current or forecasted settlement areas. For instance, interaction between the three resources has the highest potential in the central downtown area and in the northern half of Bexar County, particularly over the limestone formations (Figure 5, right). Interactions between construction and excavation activities, as well as groundwater extraction appear the most prevalent along the quaternary riverbeds and the mixed marl and limestone (MC) formations (Figure 6, top left). In the southern half of the county, in the clay and sand formations, are the areas where geothermal looks to be promising as a single use; there does not appear to be strong interactions with other affordances of the geology. This decreases slightly along areas that are locally central parcels, where the potential for space development is somewhat higher, the result of which is a slight lowering of the degree of similarity to the single-use geothermal category.
A more specific example helps to clarify further the interpretation of the interaction maps. The Deep City project previously [43] examined the underground potential of two future public transit hubs as proposed by the 2035 Long Range Comprehensive Transportation Plan [45]. One of these stations, the Westside Multimodal Transit Center (WMTC), is a future transit hub from regional to local rail and is currently being developed aboveground. The evaluation using order-weighted averaging and the classic AHP approach found that the WMTC would have a medium to low underground potential, although its highest potentials are for construction of underground space (because of its urban centrality), followed by geothermal and groundwater potential [43]. Looking at the similarity scores for the eight combinations of resource potentials, the approximate appreciation AHP and OWA provided is confirmed. The WMTC is situated in an area where it is most similar to a high combination of all three (its normalized similarity score is 0.82 for a maximum of 1.00) (Figure 6). This means that not only would any underground development on one resource have to engage with another, any intervention that does not incorporate the potential synergies between affordances is a lost opportunity.

4. Conclusions: The Map as a Compass

The interaction maps presented in this paper are intended to inform the brainstorming or visioning process conducted by planners or urban designers prior to master planning. As such, they are most appropriate for the strategic phase. Like a compass, they can orient the planner without indicating a particular direction. They ensure that the urban volume is thought of in its multiple uses and affordances. The maps could provide criteria for multidisciplinary design charrettes or competitions where participants are asked to imagine multi-use scenarios that push the boundaries of the urban volume. This is the contribution of maps that seek to establish the “conditions for the emergence of new realities” [15] and the strength of cartography in the map overlay tradition [7]. The challenge is bridging the cartographical gap between urban planners and designers and the various disciplines whose expertise provides valuable information for the creative process. Following a visioning process, or multidisciplinary design competition, specific objectives can be formulated, missing data added or collected (where possible) or the existing data updated. Multicriteria decision-making can then begin to prescribe different directions for the design and planning process to take. For the public transit corridors in San Antonio, this would have meant strategically placing the surface lines so that they are already situated over areas of high underground potential. Even if the current financial means or political climate are not pursuing underground development, the conditions are set for future possibilities. This is also why resource potential needs to rely on as little (but relatively good) data as possible. Where investment has not occurred heavily in underground construction or resource management, data may be scarce and the motivation to collect it for a master planning process absent or of low priority.
Although each city, in its geology, its decision-making structure and procedures and its political and economic climate, is different, there are several common conditions that will facilitate the operationalization of the interaction maps in the planning process. First, data collection should be cross-departmental yet centrally controlled. Each project or site investigation should be submitted to the city GIS database. This includes drawing up standards for data collection. We showed in this article that the maps can be produced without recourse to onerous quantities of data. However, more and more rigorously-compiled data would improve the maps. Second, if the data are centralized, the underground potential and interaction maps should not be. The process of the evaluation of geological potential is certainly not the sole responsibility of geologists, and geologists have the responsibility of becoming the stewards of the maps.
Third, a sustainable management of underground resources means considering all four of them where they exist and regardless of their current significance. In San Antonio, discussions with local decision-makers suggested that the public sector did not want to be responsible for managing geomaterial use, even if its use could be something that public policy encouraged. Perhaps more private sector involvement will be necessary with public sector encouragement. In Switzerland, the company Terrabloc (www.terrabloc.ch) has been working with construction sites to use excavated materials for the production of terra cotta blocks, reducing the amount of material to be placed in landfills. The underground potential maps would help in identifying the sites where contractors would have the greatest interest in contacting companies like Terrabloc. The potential maps indicate areas where there are likely local aquifers or where the water table is high. In certain situations, it may be of interest to coordinate with the local water management system and permit local extraction, for example for irrigation. Geothermal energy is often given too little attention because fossil fuels remain inexpensive, although geothermal is only second after photovoltaic in being a renewable resource harvesting solar energy indirectly through the Earth’s crust. When placing resources before needs, geothermal energy will increasingly be harvested as a competitive (and cleaner) alternative to petroleum and natural gas.
Finally, the interaction and potential maps would need to be integrated into any form of territorial diagnostic conducted prior to or during the planning process. Part of centralizing the data collection is making the maps easier to produce using richer datasets, but the maps themselves need to be readily available for use by interested parties. In a city like San Antonio, the underground would likely only be considered long term. The message would not be to develop the underground at all costs, but to consider it where density is being increased and as an alternative to the seas of surface parking scattered throughout the downtown. The potential maps would serve to identify the areas of greatest interest, and then, the interaction maps would show which other resources are present. In some cases, the underground would be off-limits. Like aquifer recharge protection zones, it may be a question of a potential of high value. However, it can also be a question of protecting a resource, like geothermal in many places, for which there is more potential than current value. In zones of high underground construction and geothermal potential, any excavation project may be required to not only ensure that the excavated materials can somehow be used on site (or elsewhere), but also to make use of the local geothermal potential and reduce reliance on non-renewable sources.
Further work will fine-tune the methodology and test it in other contexts. Deep City is already conducting case studies on Hong Kong and on the city of Dakar in Senegal. One of the objectives is to test the pairwise comparison exercise with local experts, addressing specifically possible dissensus in the evaluation of geotypes. Where the comparison matrix incorporates judgments from multiple participants, sensitivity analysis should be conducted as a complement to the consistency index. A sensitivity analysis identifies the stability of the priority vector and of the compared alternative elements. The legibility of the information contained in the interaction and resource potential maps would be improved by developing a series of sectional drawings and by reminding people working with them that multiple depths are of concern. Future work should also test the maps in a design or planning setting. Where this may not immediately occur in practice (and where the status quo often prevails), the academic environment could test the interaction maps within a design studio and present its proposals to local actors and stakeholders for feedback.
Reversing the needs to resources paradigm in addressing underground resources means exposing first the latent potentials, before prescribing particular outcomes. As mentioned in the introduction, it takes this information as a source of uncertainty. While the prevailing ecological model of the city, in practice, treats this uncertainty as a problem to be eliminated, we propose here to first preserve it as a source of unforeseen opportunity. Following this, the advances made in resource management can contribute to dealing with the complex reality of resources flowing out of project sites or being better used, existing groundwater flow being harnessed or protected, as well as the concurrent development of geothermal energy systems. For the city to maintain its delicate imbalance, its maintenance practices must be able to evolve and to incorporate novelty and the unknown. The underground has always been a sometimes silent, sometimes noisy contributor to these practices. It is not a question of condemning it to silence, but rather of finding unheard opportunities in the noise.

Author Contributions

Michael R. Doyle designed the study and analysis of the data with significant contributions by Philippe Thalmann and Aurèle Parriaux, who are the first author’s thesis advisors. Michael R. Doyle wrote the paper, and Philippe Thalmann and Aurèle Parriaux helped to revise and approve the final version of the paper.

Conflicts of Interest

The authors declare no conflict of interest.

References

  1. Shane, D.G. Recombinant Urbanism: Conceptual Modeling in Architecture, Urban Design, and City Theory, Kindle Edition ed; Wiley-Academy: Chichester, UK, 2005. [Google Scholar]
  2. Williams, R.H. Notes on the Underground an Essay on Technology, Society, and the Imagination; MIT Press: Cambridge, MA, USA, 2008. [Google Scholar]
  3. Hénard, E. Etudes sur les Transformations de Paris, et Autres Écrits sur L’urbanisme; Collection “Formes Urbaines”; L’Equerre: Paris, France, 1982. [Google Scholar]
  4. Webster, G.S. Subterranean street planning. Ann. Am. Acad. Polit. Soc. Sci. 1914, 51, 200–207. [Google Scholar] [CrossRef]
  5. Barles, S.; Guillerme, A. L’urbanisme Souterrain; Presses universitaires de France: Paris, France, 1995. [Google Scholar]
  6. McHarg, I.L. Design with Nature; Published for the American Museum of Natural History; The Natural History Press: Garden City, NY, USA, 1969. [Google Scholar]
  7. Kuitert, W. Urban landscape systems understood by geo-history map overlay. J. Landsc. Archit. 2013, 8, 54–63. [Google Scholar] [CrossRef]
  8. Diener, R. Switzerland: An Urban Portrait; ETH Studio Base-Institut Stadt der Gegenwart, Eidgenössische Technische Hochschule Zürich, Ed.; Birkhäuser: Basel, Switzerland, 2006. [Google Scholar]
  9. Viganò, P. Les Territoires de L’urbanisme. Le Projet Comme Producteur de Connaissance; MetisPresses: Genève, Switzerland, 2012. [Google Scholar]
  10. Bélanger, P. Altitudes of urbanization. Tunn. Undergr. Space Technol. 2016, 55, 5–7. [Google Scholar] [CrossRef]
  11. Ortiz-Zamora, D.; Ortega-Guerrero, A. Evolution of long-term land subsidence near Mexico City: Review, field investigations, and predictive simulations: Long-term Land Subsidence. Water Resour. Res. 2010. [Google Scholar] [CrossRef]
  12. Blunier, P. Méthodologie de Gestion Durable des Ressources du Sous-Sol Urbain. Ph.D. Thesis, École Polytechnique Fédérale de Lausanne (EPFL), Lausanne, Switzerland, 2009. [Google Scholar]
  13. Feyt, G. Les visages et usages de l’information géographique dans le processus de décision territoriale. In Les SIG au Service du Développement Territorial; Walser, O., Thévoz, L., Joerin, F., Schuler, M., Joost, S., Debarbieux, B., Dao, H., Eds.; Presses Polytechniques et Universitaires Romandes: Lausanne, Switzerland, 2011. [Google Scholar]
  14. Parriaux, A.; Blunier, P.; Maire, P.; Dekkil, G.; Tacher, L. Projet Deep City : Ressources du Sous-Sol et Développement Durable des Espaces Urbains; Vdf Hochschulverlag AG an der ETH Zürich: Lausanne, Switzerland, 2010. [Google Scholar]
  15. Corner, J. The Agency of Mapping: Speculation, Critique and Invention. In Mappings; Cosgrove, D.E., Ed.; Reaktion Books: London, UK, 2002; pp. 214–300. [Google Scholar]
  16. Moffatt, S.; Kohler, N. Conceptualizing the built environment as a social–ecological system. Build. Res. Inf. 2008, 36, 248–268. [Google Scholar] [CrossRef]
  17. Baccini, P. Designing urban systems: Ecological strategies with stocks and flows of energy and material. In Applied Urban Ecology: A Global Framework; Richter, M., Weiland, U., Eds.; Wiley-Blackwell: Chichester, UK; Hoboken, NJ, USA, 2012; pp. 54–65. [Google Scholar]
  18. Brillouin, L. Science and Information Theory, Kindle Edition (orig. 1962) ed; Academic Press: Cambridge, UK, 2013. [Google Scholar]
  19. Serres, M. The Parasite; Johns Hopkins University Press: Baltimore, MD, USA, 1982. [Google Scholar]
  20. Vähäaho, I. An introduction to the development for urban underground space in Helsinki. Tunn. Undergr. Space Technol. 2016, 55, 324–328. [Google Scholar] [CrossRef]
  21. Wallace, M.I.; Ng, K.C. Development and application of underground space use in Hong Kong. Tunn. Undergr. Space Technol. 2016, 55, 257–279. [Google Scholar] [CrossRef]
  22. Delmastro, C.; Lavagno, E.; Schranz, L. Underground urbanism: Master Plans and Sectorial Plans. Tunn. Undergr. Space Technol. 2016, 55, 103–111. [Google Scholar] [CrossRef]
  23. El-Geneidy, A.; Kastelberger, L.; Abdelhamid, H.T. Montréal’s roots: Exploring the growth of montréal’s indoor city. J. Trans. Land Use 2011, 4, 33–46. [Google Scholar] [CrossRef]
  24. Boisvert, M.A. Montréal et Toronto: Villes Intérieures; Presses de l’Université de Montréal: Montréal, QC, Canada, 2011. [Google Scholar]
  25. Bélanger, P. Underground landscape: The urbanism and infrastructure of Toronto’s downtown pedestrian network. Tunn. Undergr. Space Technol. 2007, 22, 272–292. [Google Scholar] [CrossRef]
  26. Zhao, J.-W.; Peng, F.-L.; Wang, T.-Q.; Zhang, X.-Y.; Jiang, B.-N. Advances in master planning of urban underground space (UUS) in China. Tunn. Undergr. Space Technol. 2016, 55, 290–307. [Google Scholar] [CrossRef]
  27. Bobylev, N. Mainstreaming sustainable development into a city’s Master plan: A case of Urban Underground Space use. Land Use Policy 2009, 26, 1128–1137. [Google Scholar] [CrossRef]
  28. Parriaux, A.; Tacher, L.; Joliquin, P. The hidden side of cities—Towards three-dimensional land planning. Energy Build. 2004, 36, 335–341. [Google Scholar] [CrossRef]
  29. Lu, Z.; Wu, L.; Zhuang, X.; Rabczuk, T. Quantitative assessment of engineering geological suitability for multilayer Urban Underground Space. Tunn. Undergr. Space Technol. 2016, 59, 65–76. [Google Scholar] [CrossRef]
  30. Hillier, B. Space Is the Machine: A Configurational Theory of Architecture, Electronic Edition (orig. 1996) ed; Cambridge University Press: Cambridge, UK, 2007. [Google Scholar]
  31. Hillier, B.; Hanson, J. The Social Logic of Space; Cambridge University Press: Cambridge, UK, 1984. [Google Scholar]
  32. Easterling, K. Extrastatecraft: The Power of Infrastructure Space, Kindle Edition ed; Verso: Brooklyn, NY, USA, 2014. [Google Scholar]
  33. Wall, A. Programming the urban surface. In Recovering Landscape: Essays in Contemporary Landscape Architecture; Corner, J., Ed.; Princeton Architectural Press: New York, NY, USA, 1999; pp. 232–249. [Google Scholar]
  34. Parriaux, A.; Turberg, P. Les géotypes, pour une représentation géologique du territoire. Tracés 2007, 133, 11–17. [Google Scholar]
  35. Saaty, T.L.; Vargas, L.G. Models, Methods, Concepts & Applications of the Analytic Hierarchy Process, 2nd ed.; International Series in Operations Research & Management Science; Springer: New York, NY, USA, 2012. [Google Scholar]
  36. Yager, R.R.; Kelman, A. An extension of the Analytical Hierarchy Process using OWA operators. J. Intell. Fuzzy Syst. 1999, 7, 401–417. [Google Scholar]
  37. Li, H.; Li, X.; Parriaux, A.; Thalmann, P. An integrated planning concept for the emerging underground urbanism: Deep City Method Part 2 case study for resource supply and project valuation. Tunn. Undergr. Space Technol. 2013, 38, 569–580. [Google Scholar] [CrossRef]
  38. Doyle, M.R. Potentialities of the Urban Volume: Mapping Underground Resource Potential and Deciphering Spatial Economies and Configurations of Multi-Level Urban Spaces. Ph.D. Thesis, Swiss Federal Institute of Technology Lausanne (EPFL), Lausanne, Switzerland.
  39. Maire, P. Étude Multidisciplinaire D’un Développement Durable du Sous-Sol Urbain: Aspects Socio-Économiques, Juridiques et de Politique Urbaine. Ph.D. Thesis, Swiss Federal Institute of Technology Lausanne (EPFL), Lausanne, Switzerland, 2011. [Google Scholar]
  40. Hillier, B. Spatial sustainability in cities: Organic patterns and sustainable forms. In Proceedings of the Seventh International Space Syntax Symposium, Stockholm, Sweden, 8–11 June 2009; Koch, D., Marcus, L., Steen, J., Eds.; Royal Institute or Technology: Stockholm, Sweden, 2009; pp. K01.1–K01.20. [Google Scholar]
  41. Brown, G. Design and Value: Spatial Form and the Economic Failure of a Mall. J. Real Estate Res. 1999, 17, 189–225. [Google Scholar]
  42. Kärrholm, M.; Nylund, K.; Prieto de la Fuente, P. Spatial resilience and urban planning: Addressing the interdependence of urban retail areas. Cities 2014, 36, 121–130. [Google Scholar] [CrossRef]
  43. Doyle, M.R. From hydro/geology to the streetscape: Evaluating urban underground resource potential. Tunn. Undergr. Space Technol. 2016, 55, 83–95. [Google Scholar] [CrossRef]
  44. Demographia. Demographia World Urban Areas: 12th Annual Edition; Demographia: Belleville, IL, USA, 2016. [Google Scholar]
  45. Jacobs Engineering. 2035 Long Range Comprehensive Transportation Plan; VIA Metropolitan Transit: San Antonio, TX, USA, 2011. [Google Scholar]
  46. United Nations Human Settlements Programme. State of the World’s Cities, 2012/2013: Prosperity of Cities; Routledge for and on behalf of UN-Habitat: New York, NY, USA, 2013. [Google Scholar]
  47. U.S. Census Bureau. 2014 American Community Survey 1-Year Estimates: Means of Transport to Work by Selected Characteristics; U.S. Census Bureau: Suitland, MD, USA, 2014.
  48. San Antonio City Design Center Downtown Design Guide. Available online: https://www.sanantonio.gov/Portals/0/Files/CityDesignCenter/DowntownDesignGuide.pdf (accessed on 7 January 2014).
  49. San Antonio Water System. Semiannual Water Management Report: January–June 2015; San Antonio Water System: San Antonio, TX, USA, 2015. [Google Scholar]
  50. Struckmeier, W.; Richts, A. Groundwater Resources of the World; UNESCO: Paris, France, 2008. [Google Scholar]
  51. Thomas, J.V.; Stanton, G.P.; Lambert, R.B. Borehole Geophysical, Fluid, and Hydraulic Properties within and Surrounding the Freshwater/Saline-Water Transition Zone, San Antonio Segment of the Edwards Aquiferr, South-Central Texas, 2010–2011; Texas Water Science Center: Austin, TX, USA, 2012.
  52. Ewing, T.E. Landscapes, Water and Man: Geology and History in the San Antonio Area of Texas; South Texas Geological Society: San Antonio, TX, USA, 2008. [Google Scholar]
  53. United States Geological Survey Mineral Resources on Line Spatial Data 2014. Available online: http://mrdata.usgs.gov/mrds/ (accessed on 16 December 2015).
  54. Texas State Historical Association Texas Almanac: Nonpetroleum Materials Internet. Available online: http://www.tshaonline.org/home/ (accessed on 2 June 2016).
  55. Taylor, L.Y. San Antonio’s Quarries Help Keep Costs of Area Construction Projects in Line. Available online: http://www.bizjournals.com/sanantonio/stories/2002/05/20/focus1.html (accessed on 14 February 2014).
  56. Lindgren, R.J.; Dutton, A.R.; Hovorka, S.D.; Worthington, S.R.H.; Painter, S. Conceptualization and Simulation of the Edwards Aquifer, San Antonio Region, Texas; U.S. Geological Survey Scientific Investigations Report 2004–5277; USGS: Reston, VA, USA, 2004; p. 143. [Google Scholar]
  57. Regulatory History of the Edwards Aquifer. Available online: https://www.tceq.texas.gov/field/eapp/history.html (accessed on 1 July 2015).
  58. Texas Secretary of State. Environmental Quality: Edwards Aquifer. Available online: http://www.tceq.state.tx.us/field/eapp/program.html (accessed on 1 December 2015).
  59. Frontier Associates. Texas Renewable Energy Resource Assessment; Texas State Energy Conservation Office: Austin, TX, USA, 2008. [Google Scholar]
  60. Arnow, T. Ground-Water Geology of Bexar County, Texas; US Government Printing Office: Washington, DC, USA, 1963.
Figure 1. Geological map of Bexar County and the four resource potentials around the 410 Loop (map source: Doyle 2016; data source: USGS).
Sustainability 08 00830 g001
Figure 2. Aquifer zones and the distribution of population densities over Bexar County (data sources: U.S. 2010 Census and the Edwards Aquifer Authority).
Sustainability 08 00830 g002
Figure 3. Aggregation hierarchy for the separate resource potentials and their interactions. Percentages represent the relative importance of each criterion to the resource potential.
Sustainability 08 00830 g003
Figure 4. Distribution of the degree of similarity to interaction types, presented as percentiles.
Sustainability 08 00830 g004
Figure 5. Maps of the degree of similarity to two different types of interaction (top left: groundwater and space/geomaterials; right: space/geomaterials, groundwater and geothermal) and single-use geothermal (bottom left).
Sustainability 08 00830 g005
Figure 6. The Westside Multimodal Transition Center is characterized most strongly by a potentiality that combines excavation/construction, groundwater and geothermal energy.
Sustainability 08 00830 g006
Table 1. San Antonio resource potential data sources and initial transformations necessary.
DataSourceFormatInitial Transformations
Superficial GeologyUSGSPolygon shapefileNone
Substrata (without alluvium)[60]Raster TIFVectorized in ArcGIS
Local well data (n = 1529)Texas Water Development BoardPoint shapefileInterpolation of groundwater saturation at 15- and 30-m depths
Edwards Aquifer ZonesEdwards Aquifer AuthorityPolygon shapefileNone
100-Year flood zonesBexar County Open Data PortalPolygon shapefileNone
Bexar County parcels in 2010 (n = 420,339)Bexar County Appraisal District (BCAD)Polygon shapefileConversion to address points using the street network as a geolocator
Bexar County roadsBCADLine shapefileNone
Resident population per census tractU.S. 2010 Census DataPolygon shapefileDistribution of population counts by relative surface area to BCAD residential parcels located in the census tract
Table 2. Comparison matrix for the potential of buildable underground space.
Geotype Potential Urban Centralities100-Year Flood ZonesAquifer Prot. Zones% of Gw at DepthPriority Vector (%)
Geotype potential1.003.004.006.008.0049
Urban centralities0.331.002.003.004.0021
100-year flood zones0.250.501.005.005.0019
Aquifer protection zones0.170.330.201.003.008
% Groundwater at depth0.130.250.200.331.004

