
Quantifying the Spatiotemporal Patterns of Urbanization along Urban-Rural Gradient with a Roadscape Transect Approach: A Case Study in Shanghai, China

Abstract
:1. Introduction
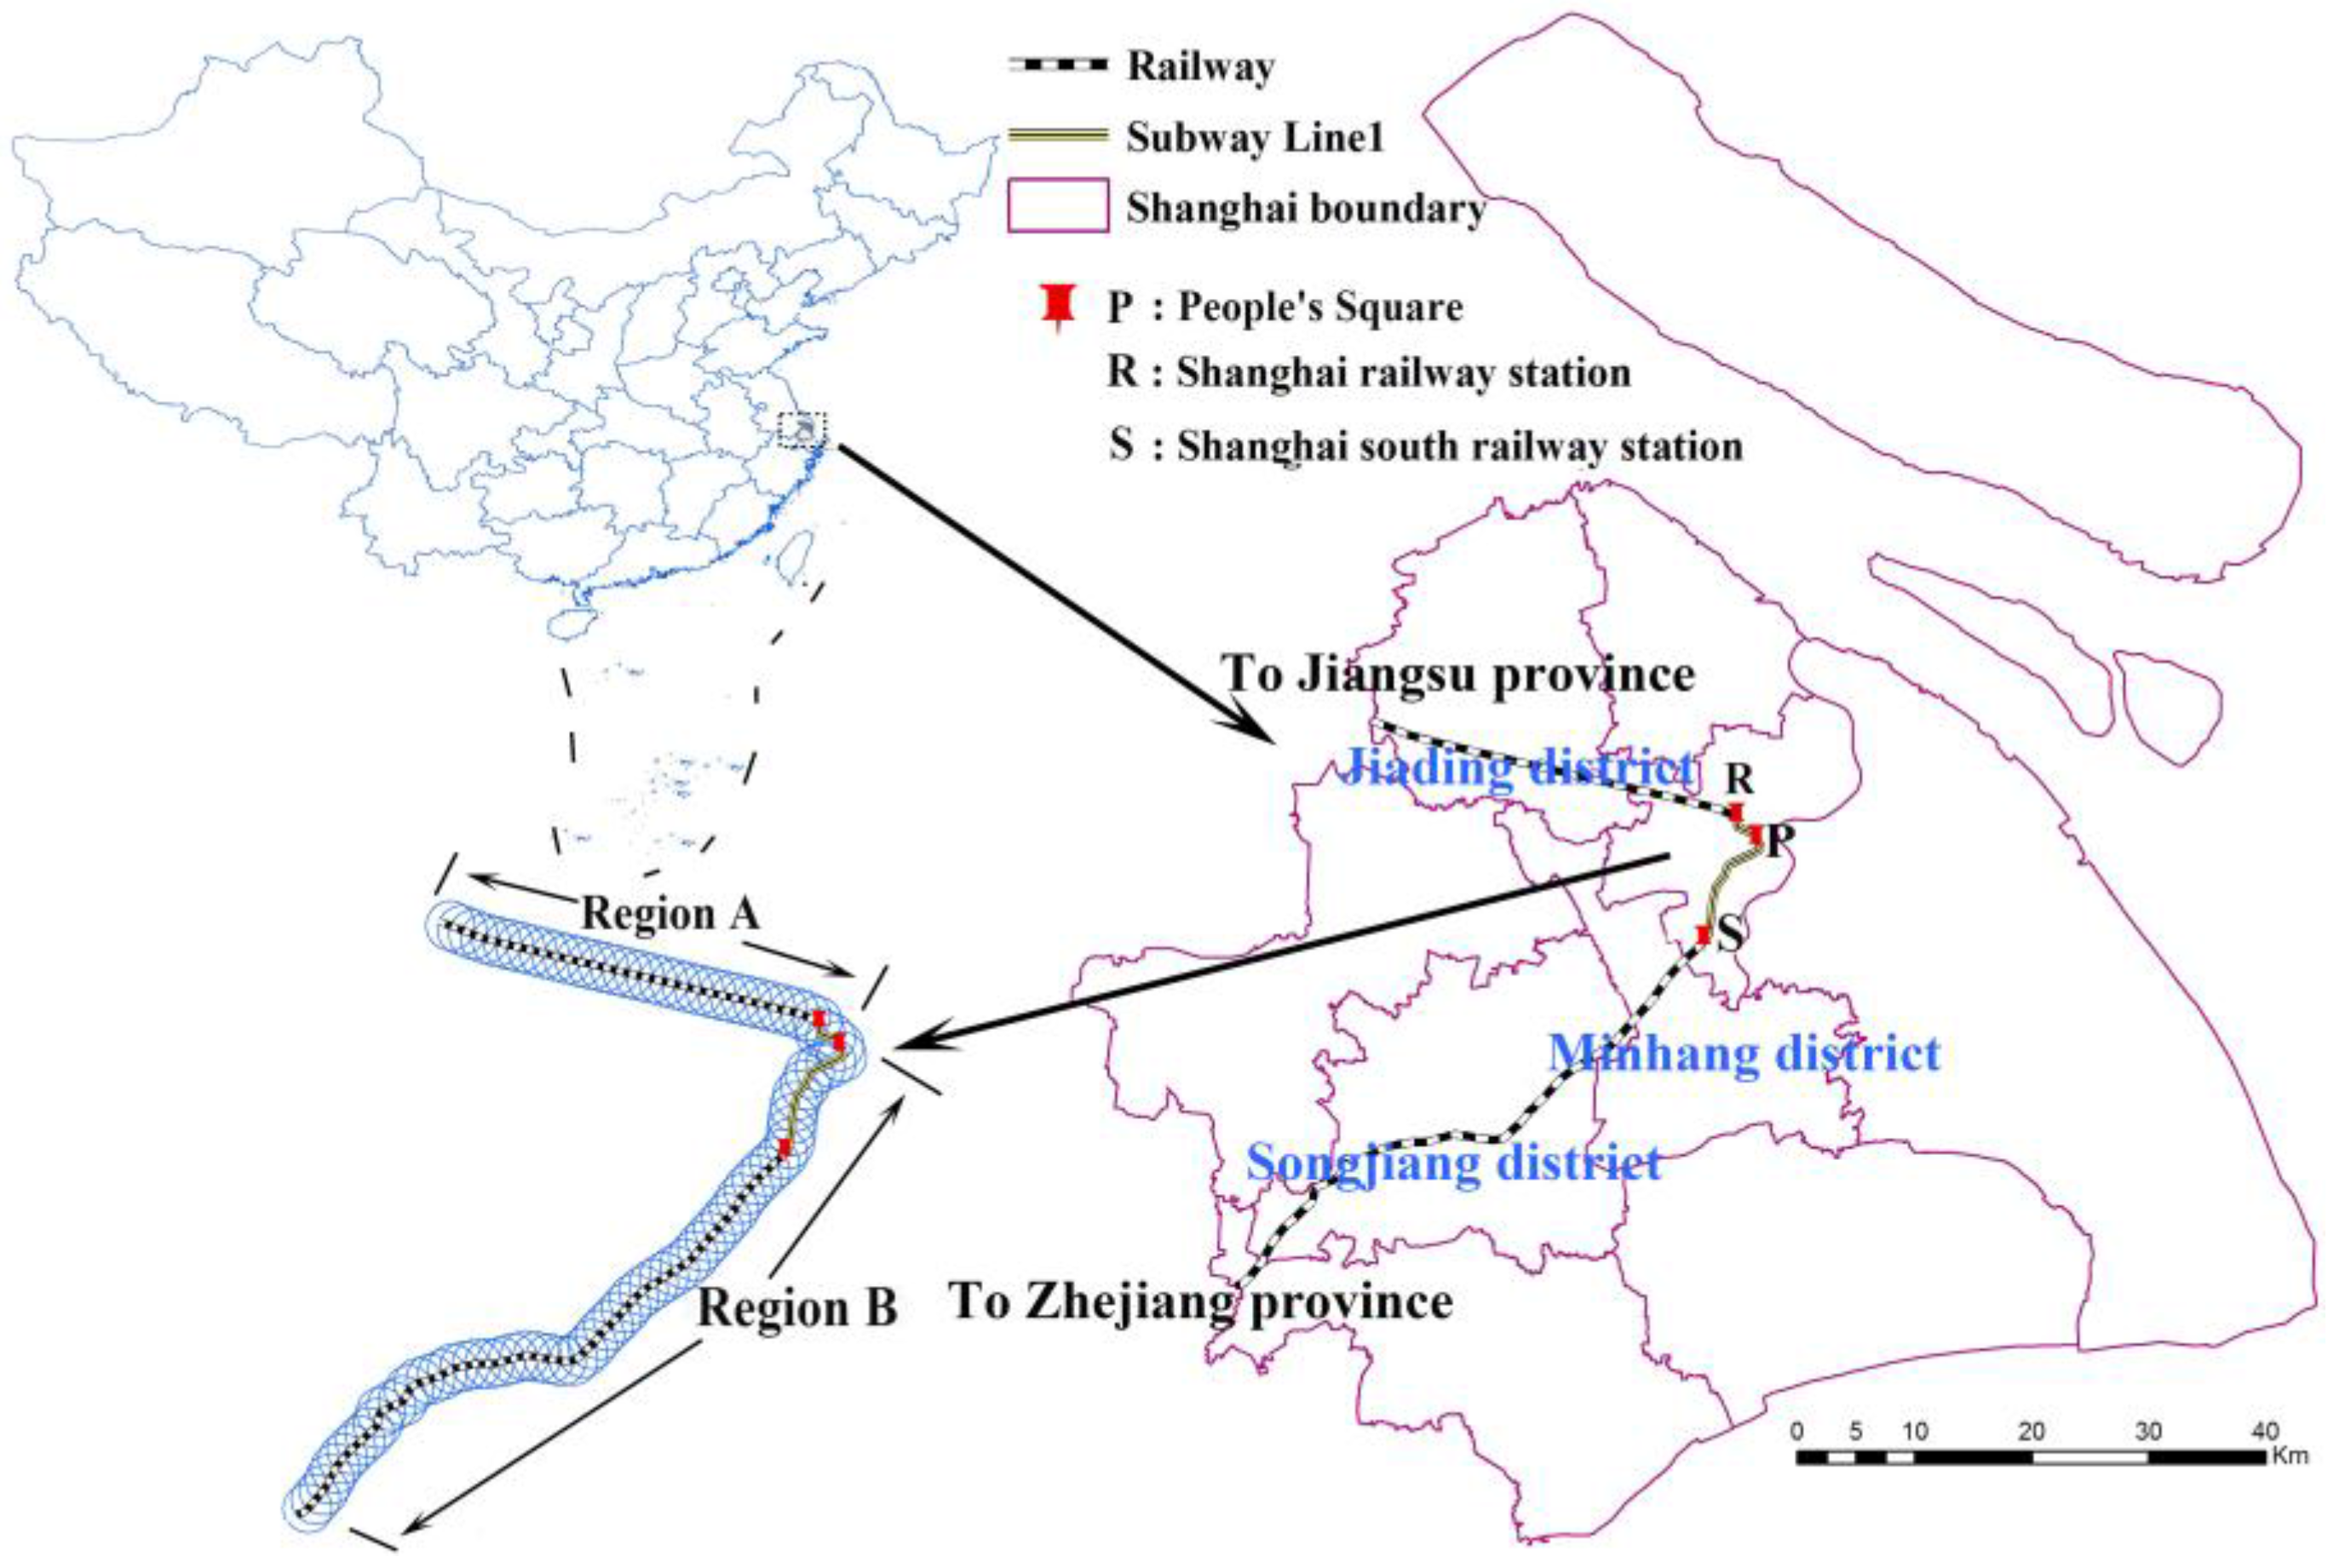
2. Study Area
3. Data Preparation and Methods
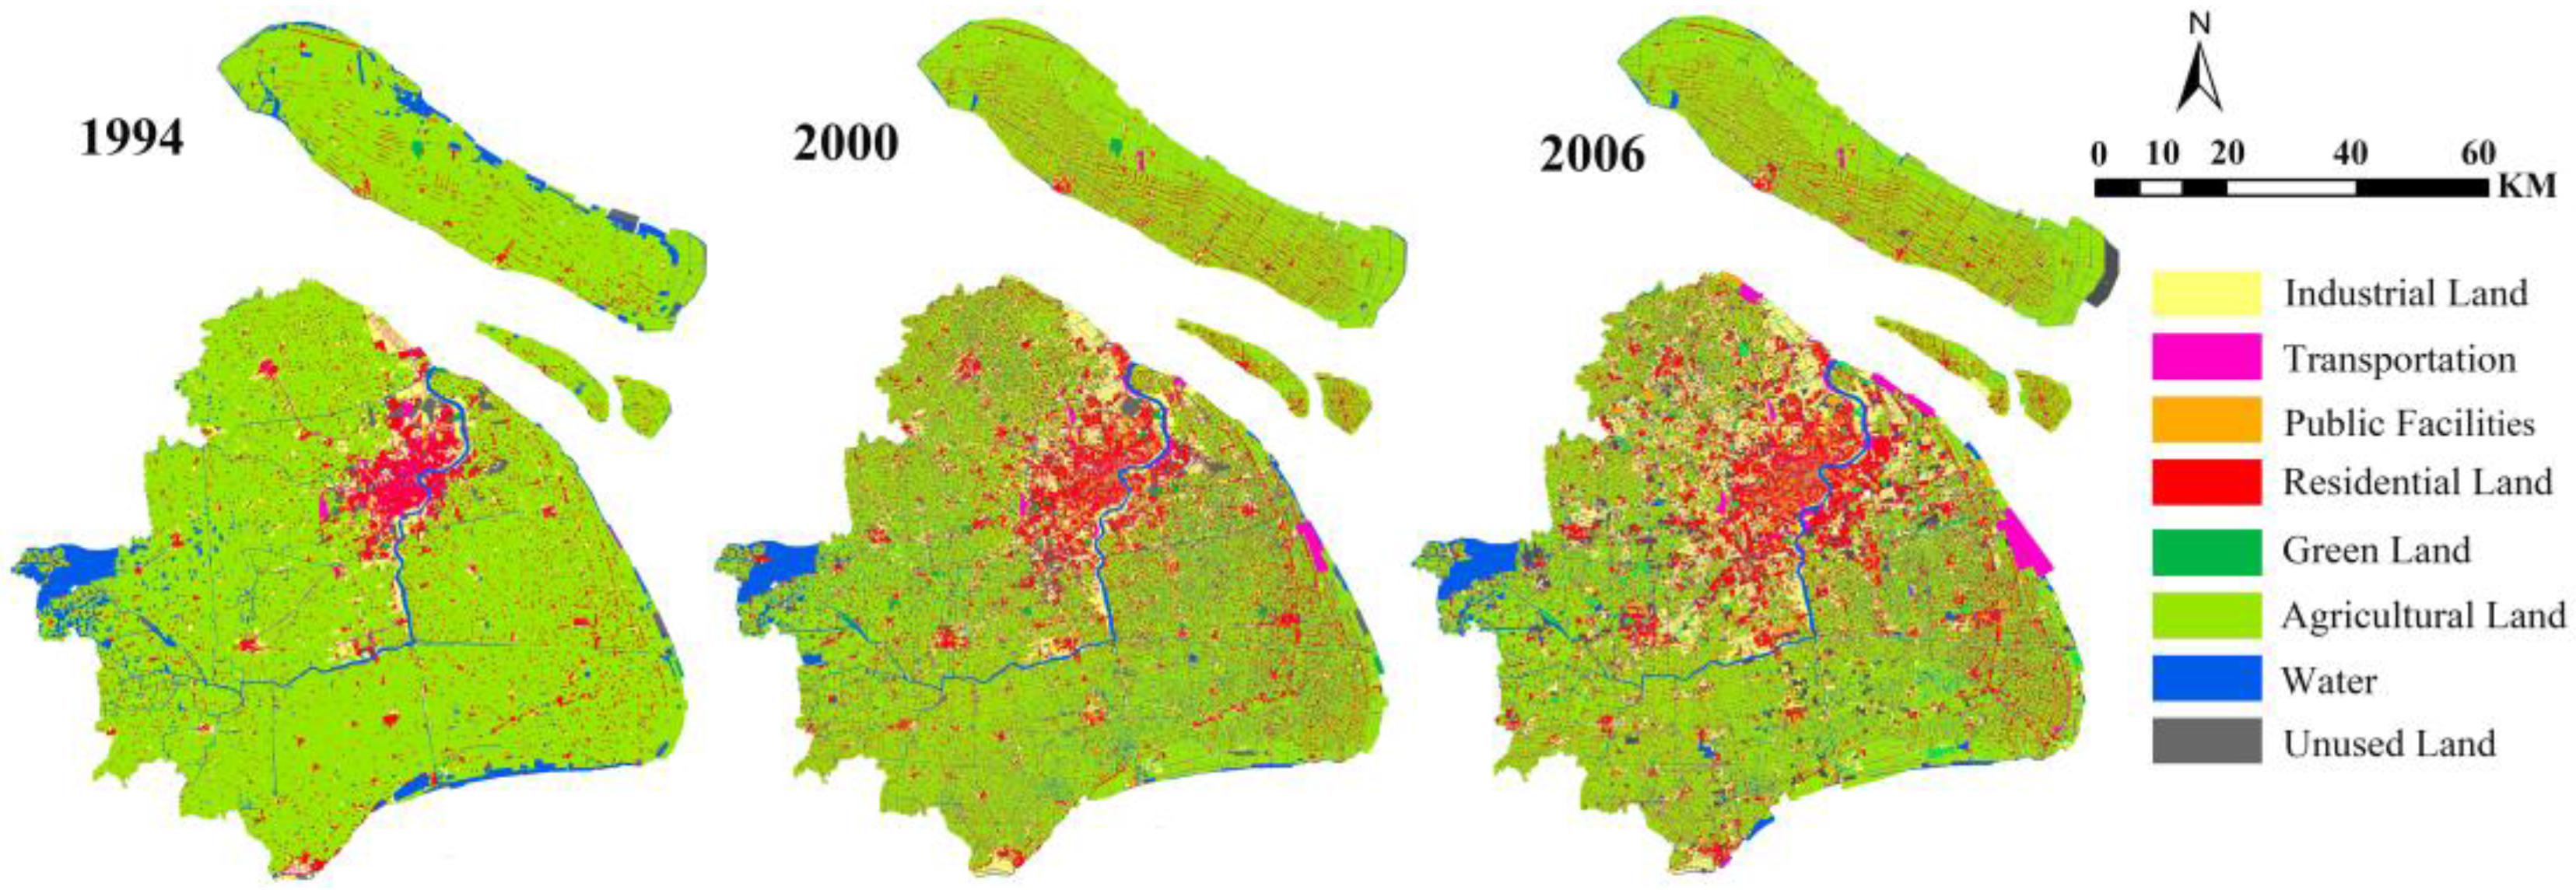
3.1. Land Use/Land Cover Data Preparation
3.2. The Urban-Rural Gradient Transect along the Railway Route
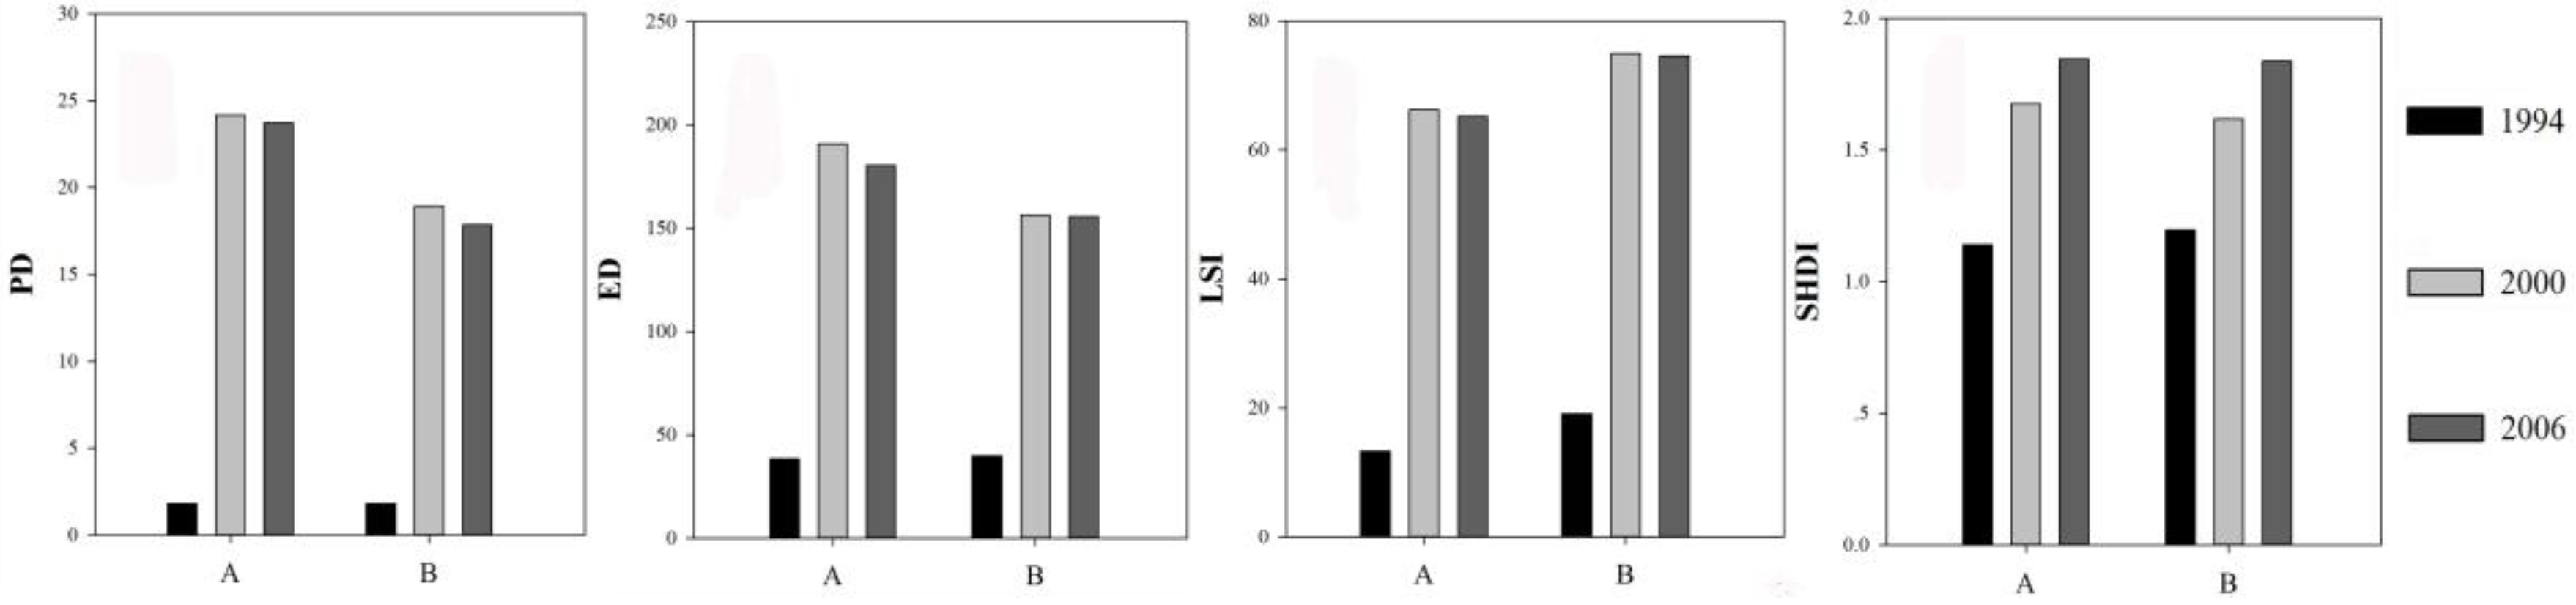
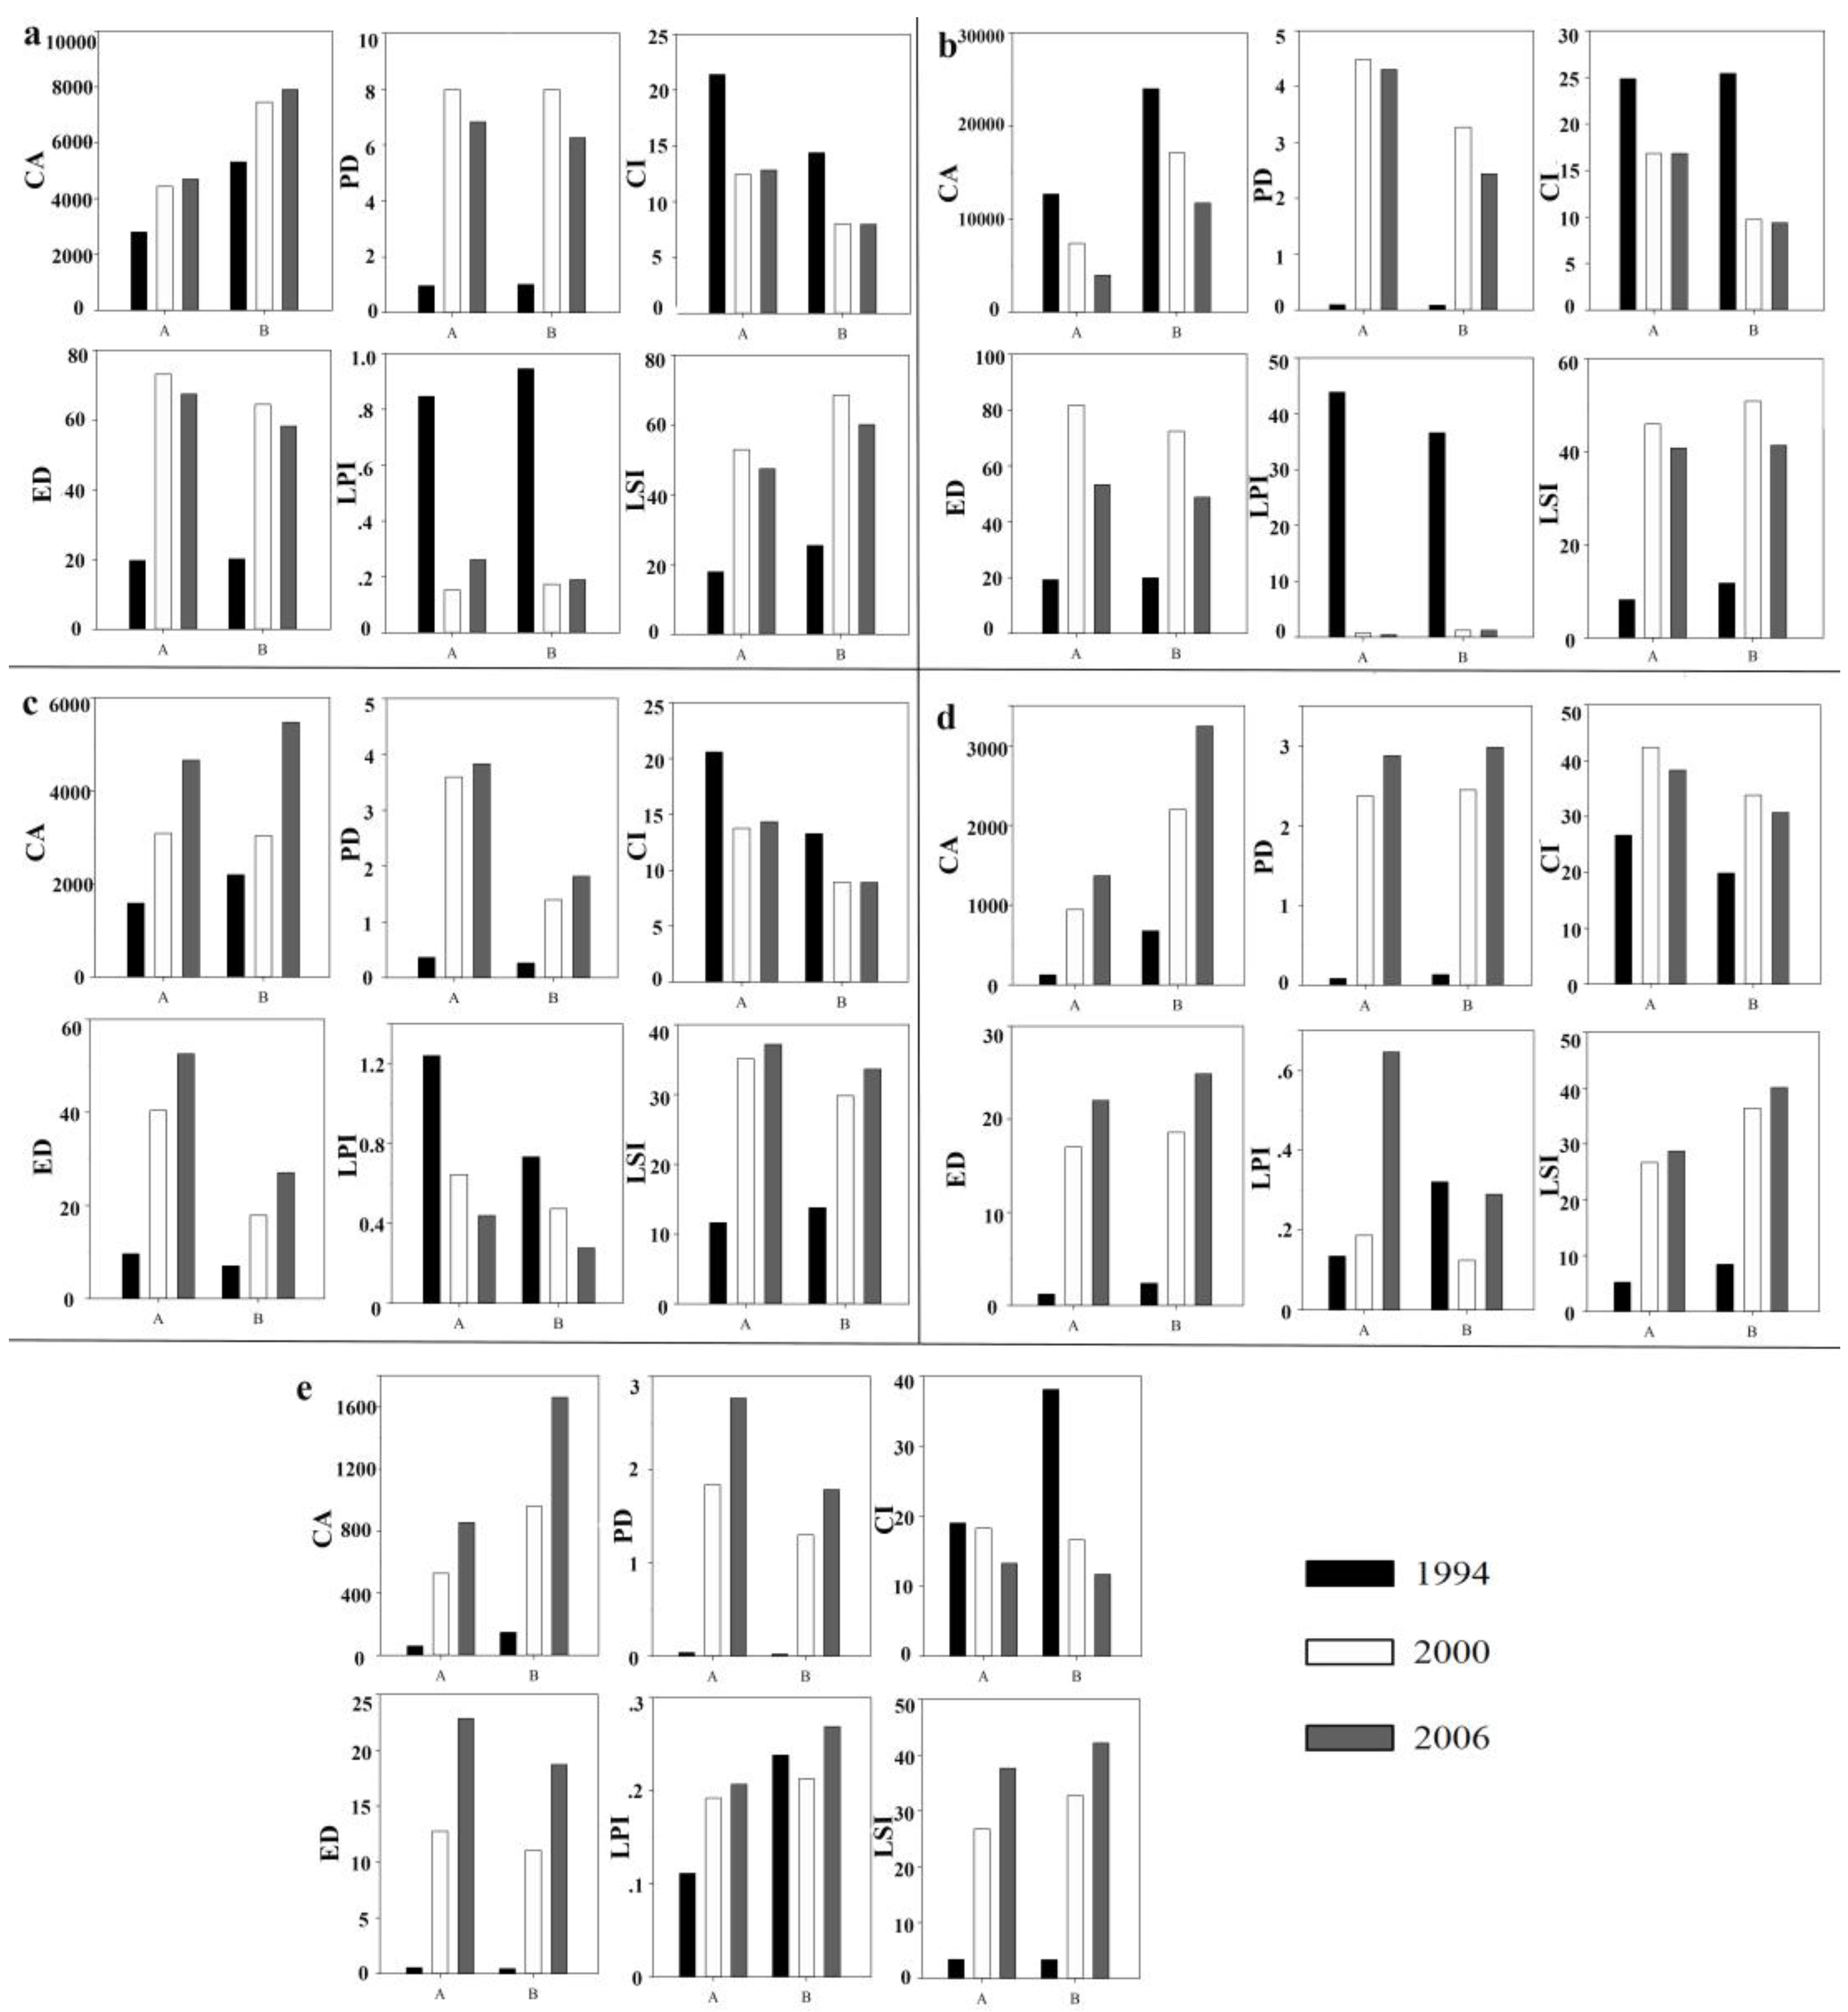
3.3. Landscape Metrics
4. Results
4.1. Synoptic Characteristics of the Landscape Patterns from 1994 to 2006.
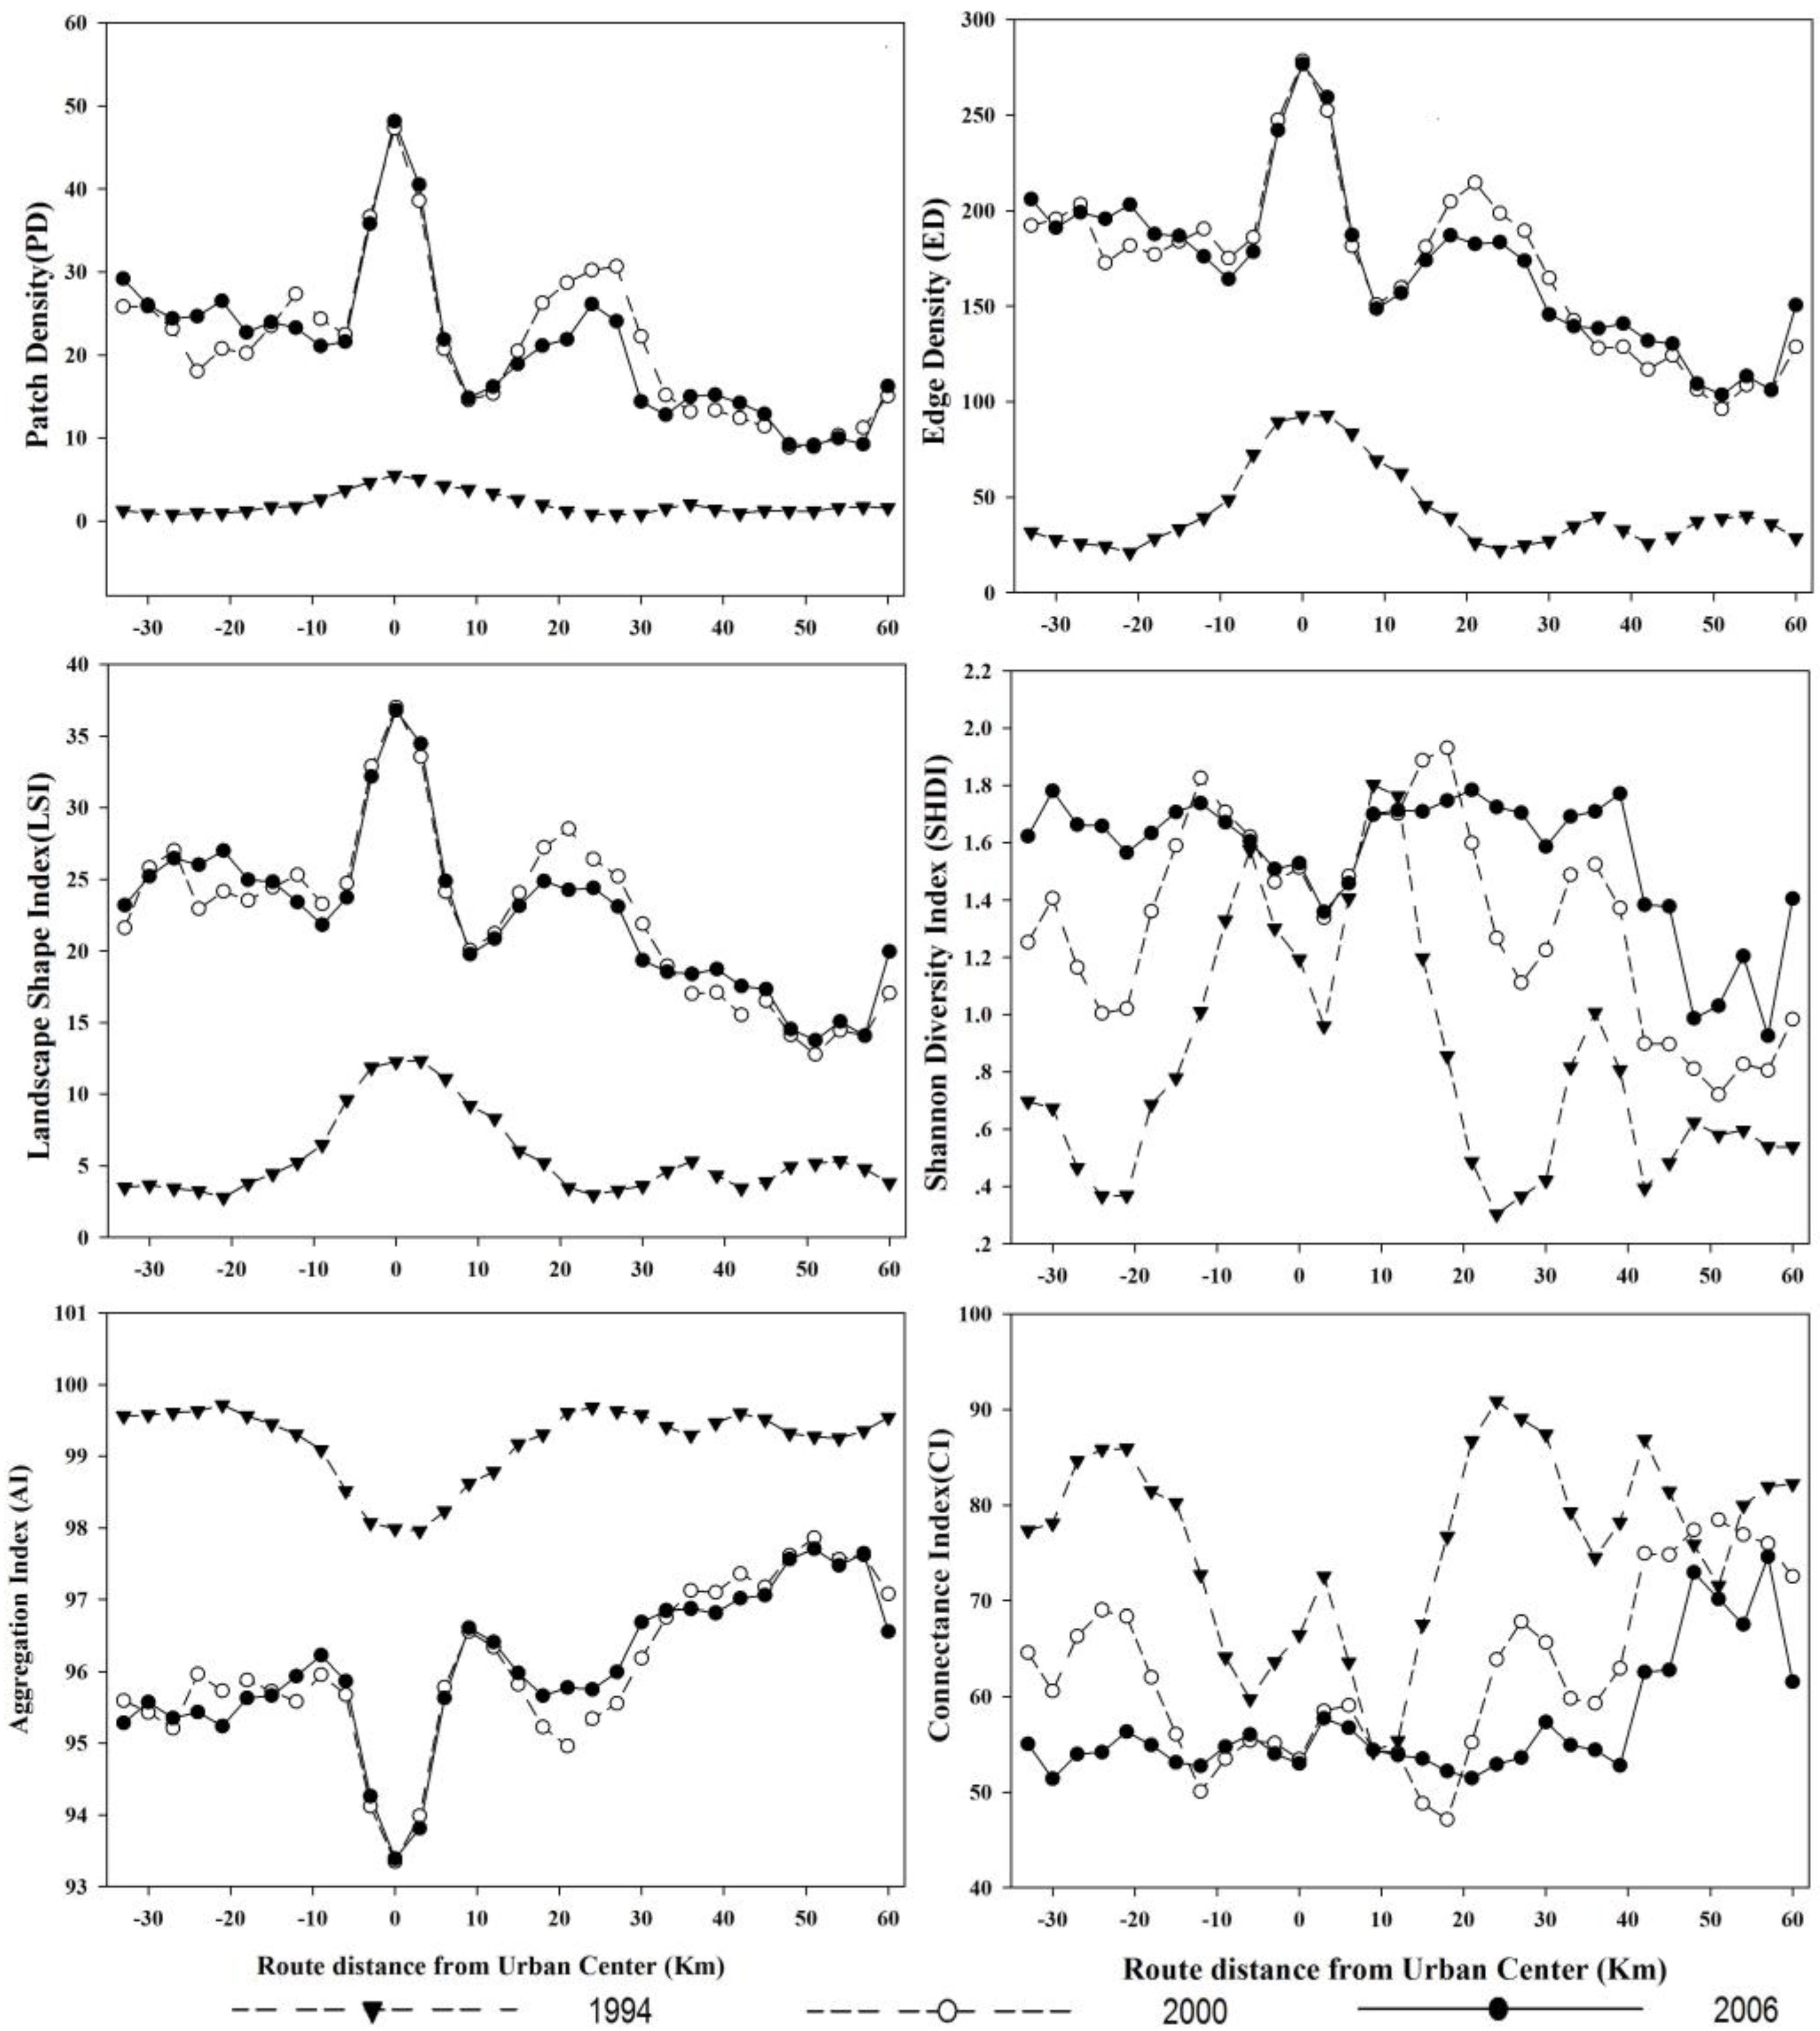
4.2. The Characteristics of Landscape-Level Patterns along the Urban-Rural Gradient
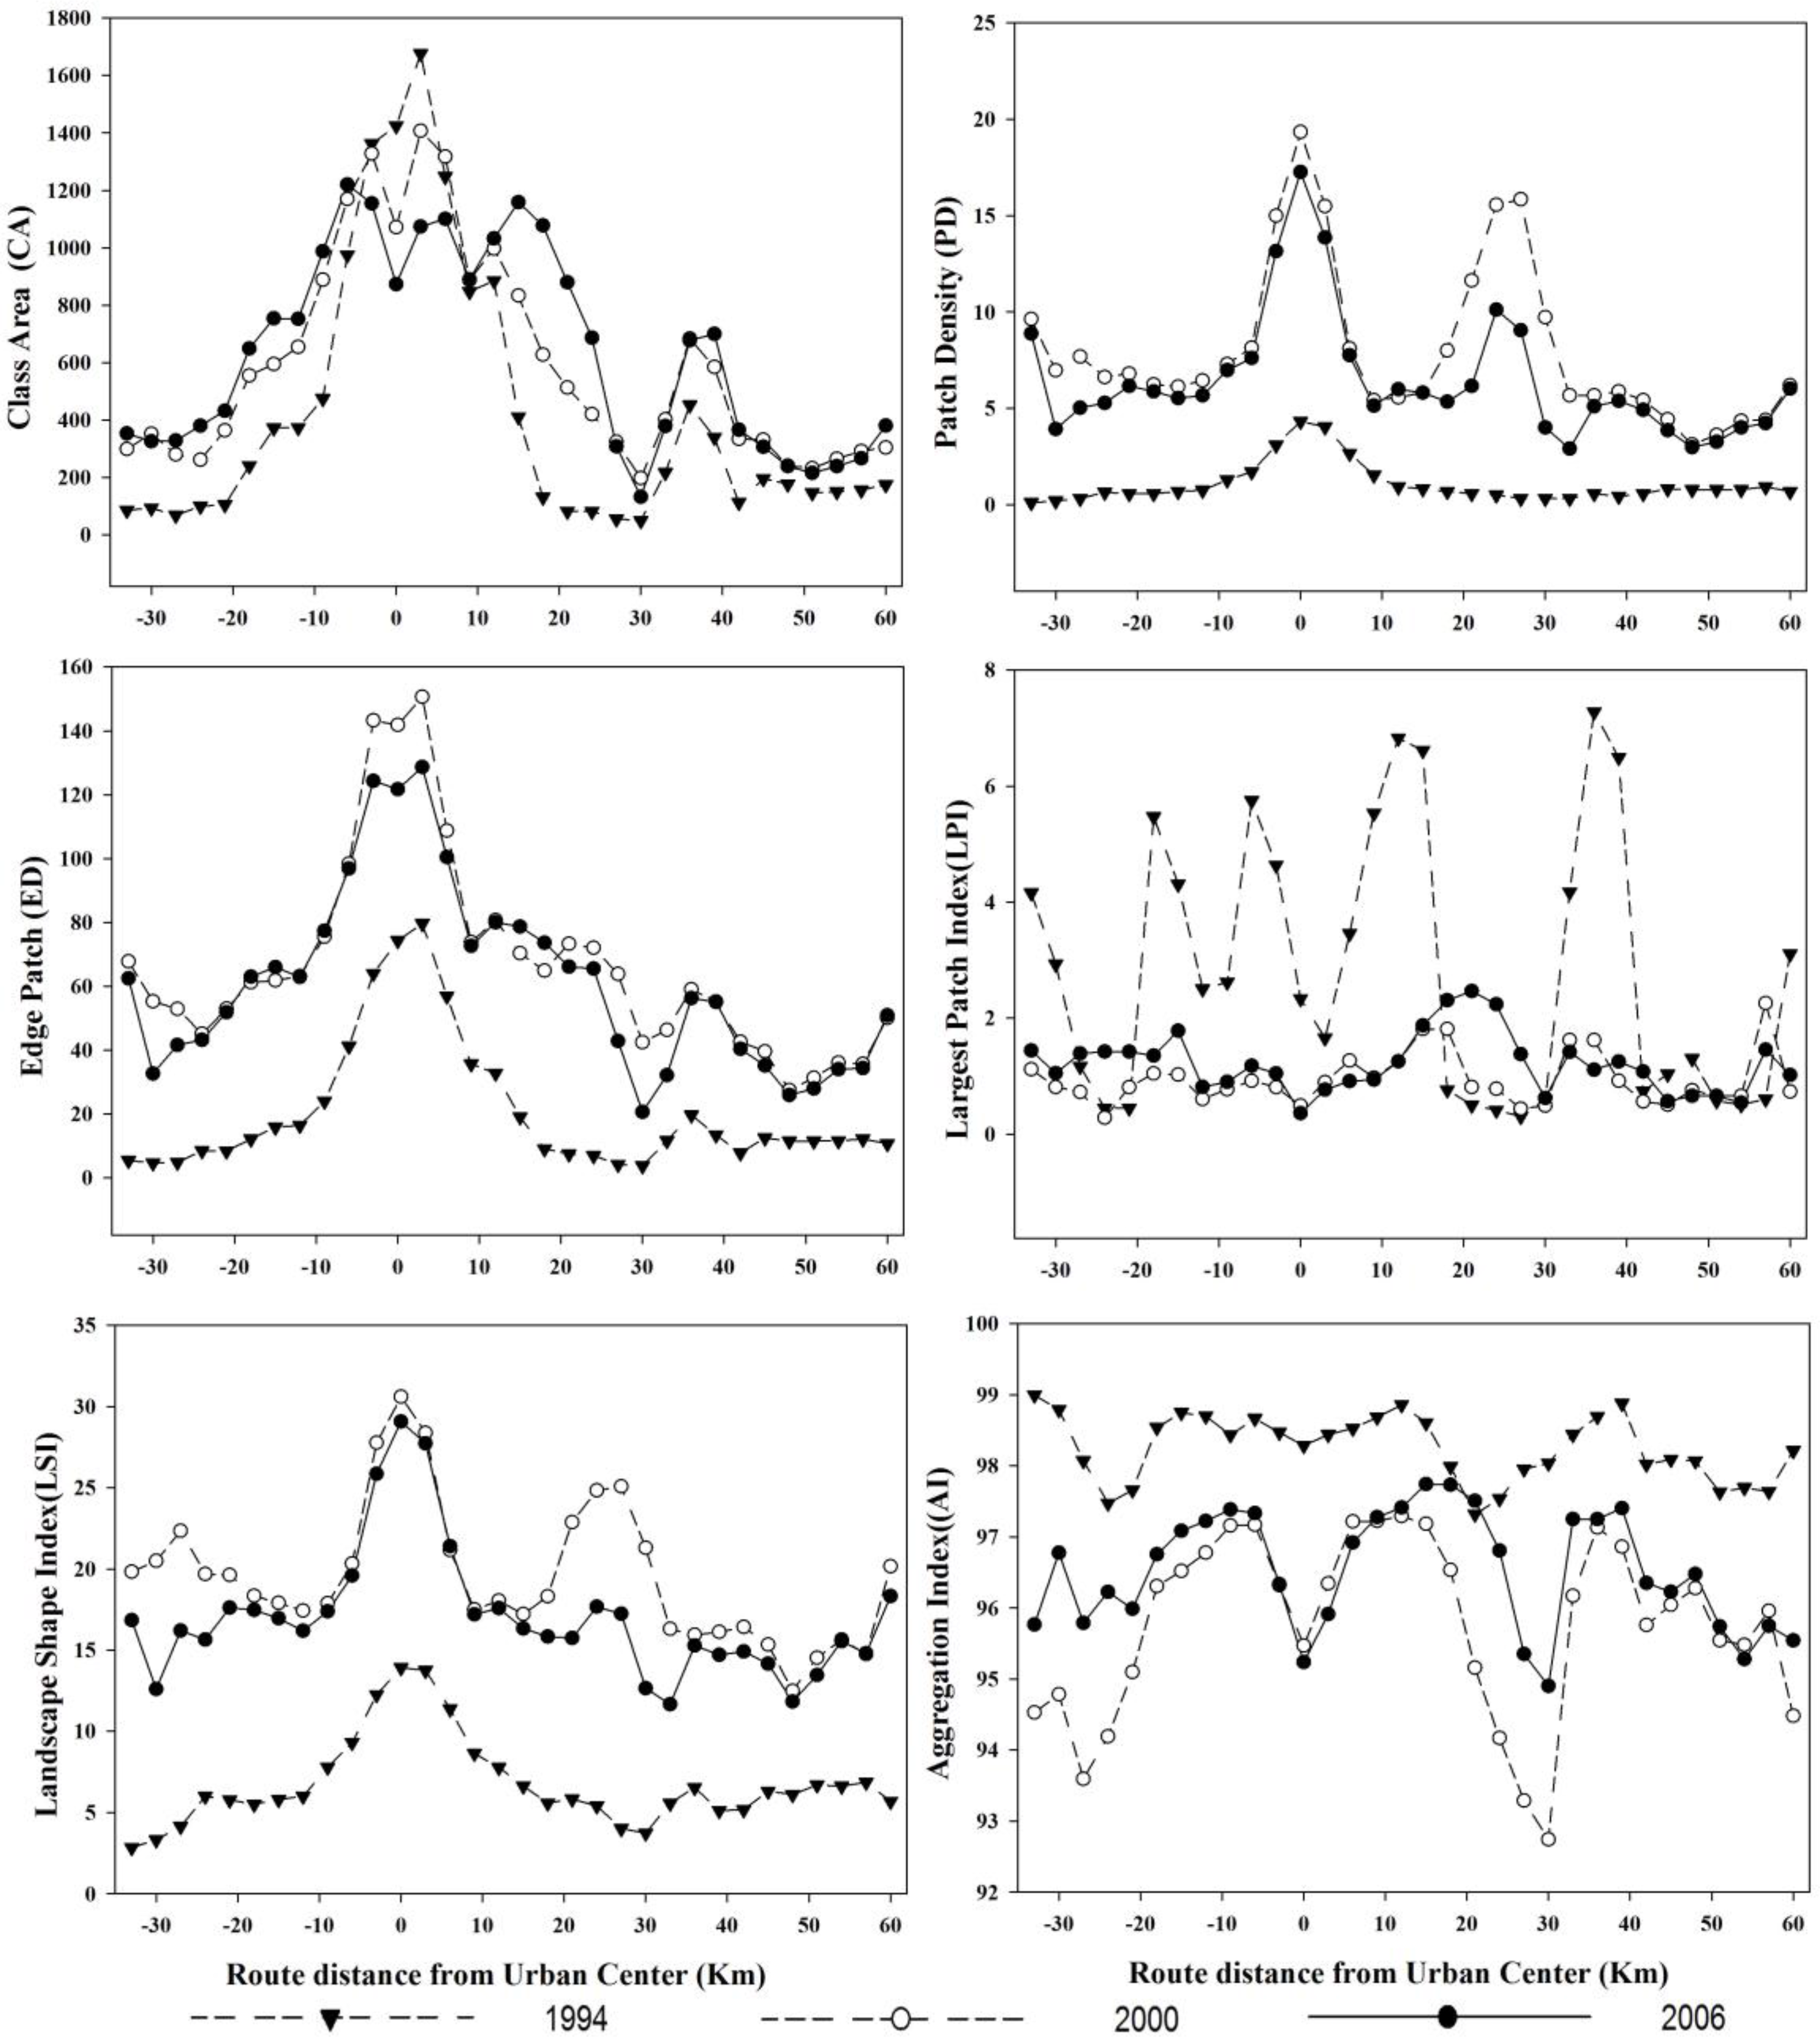
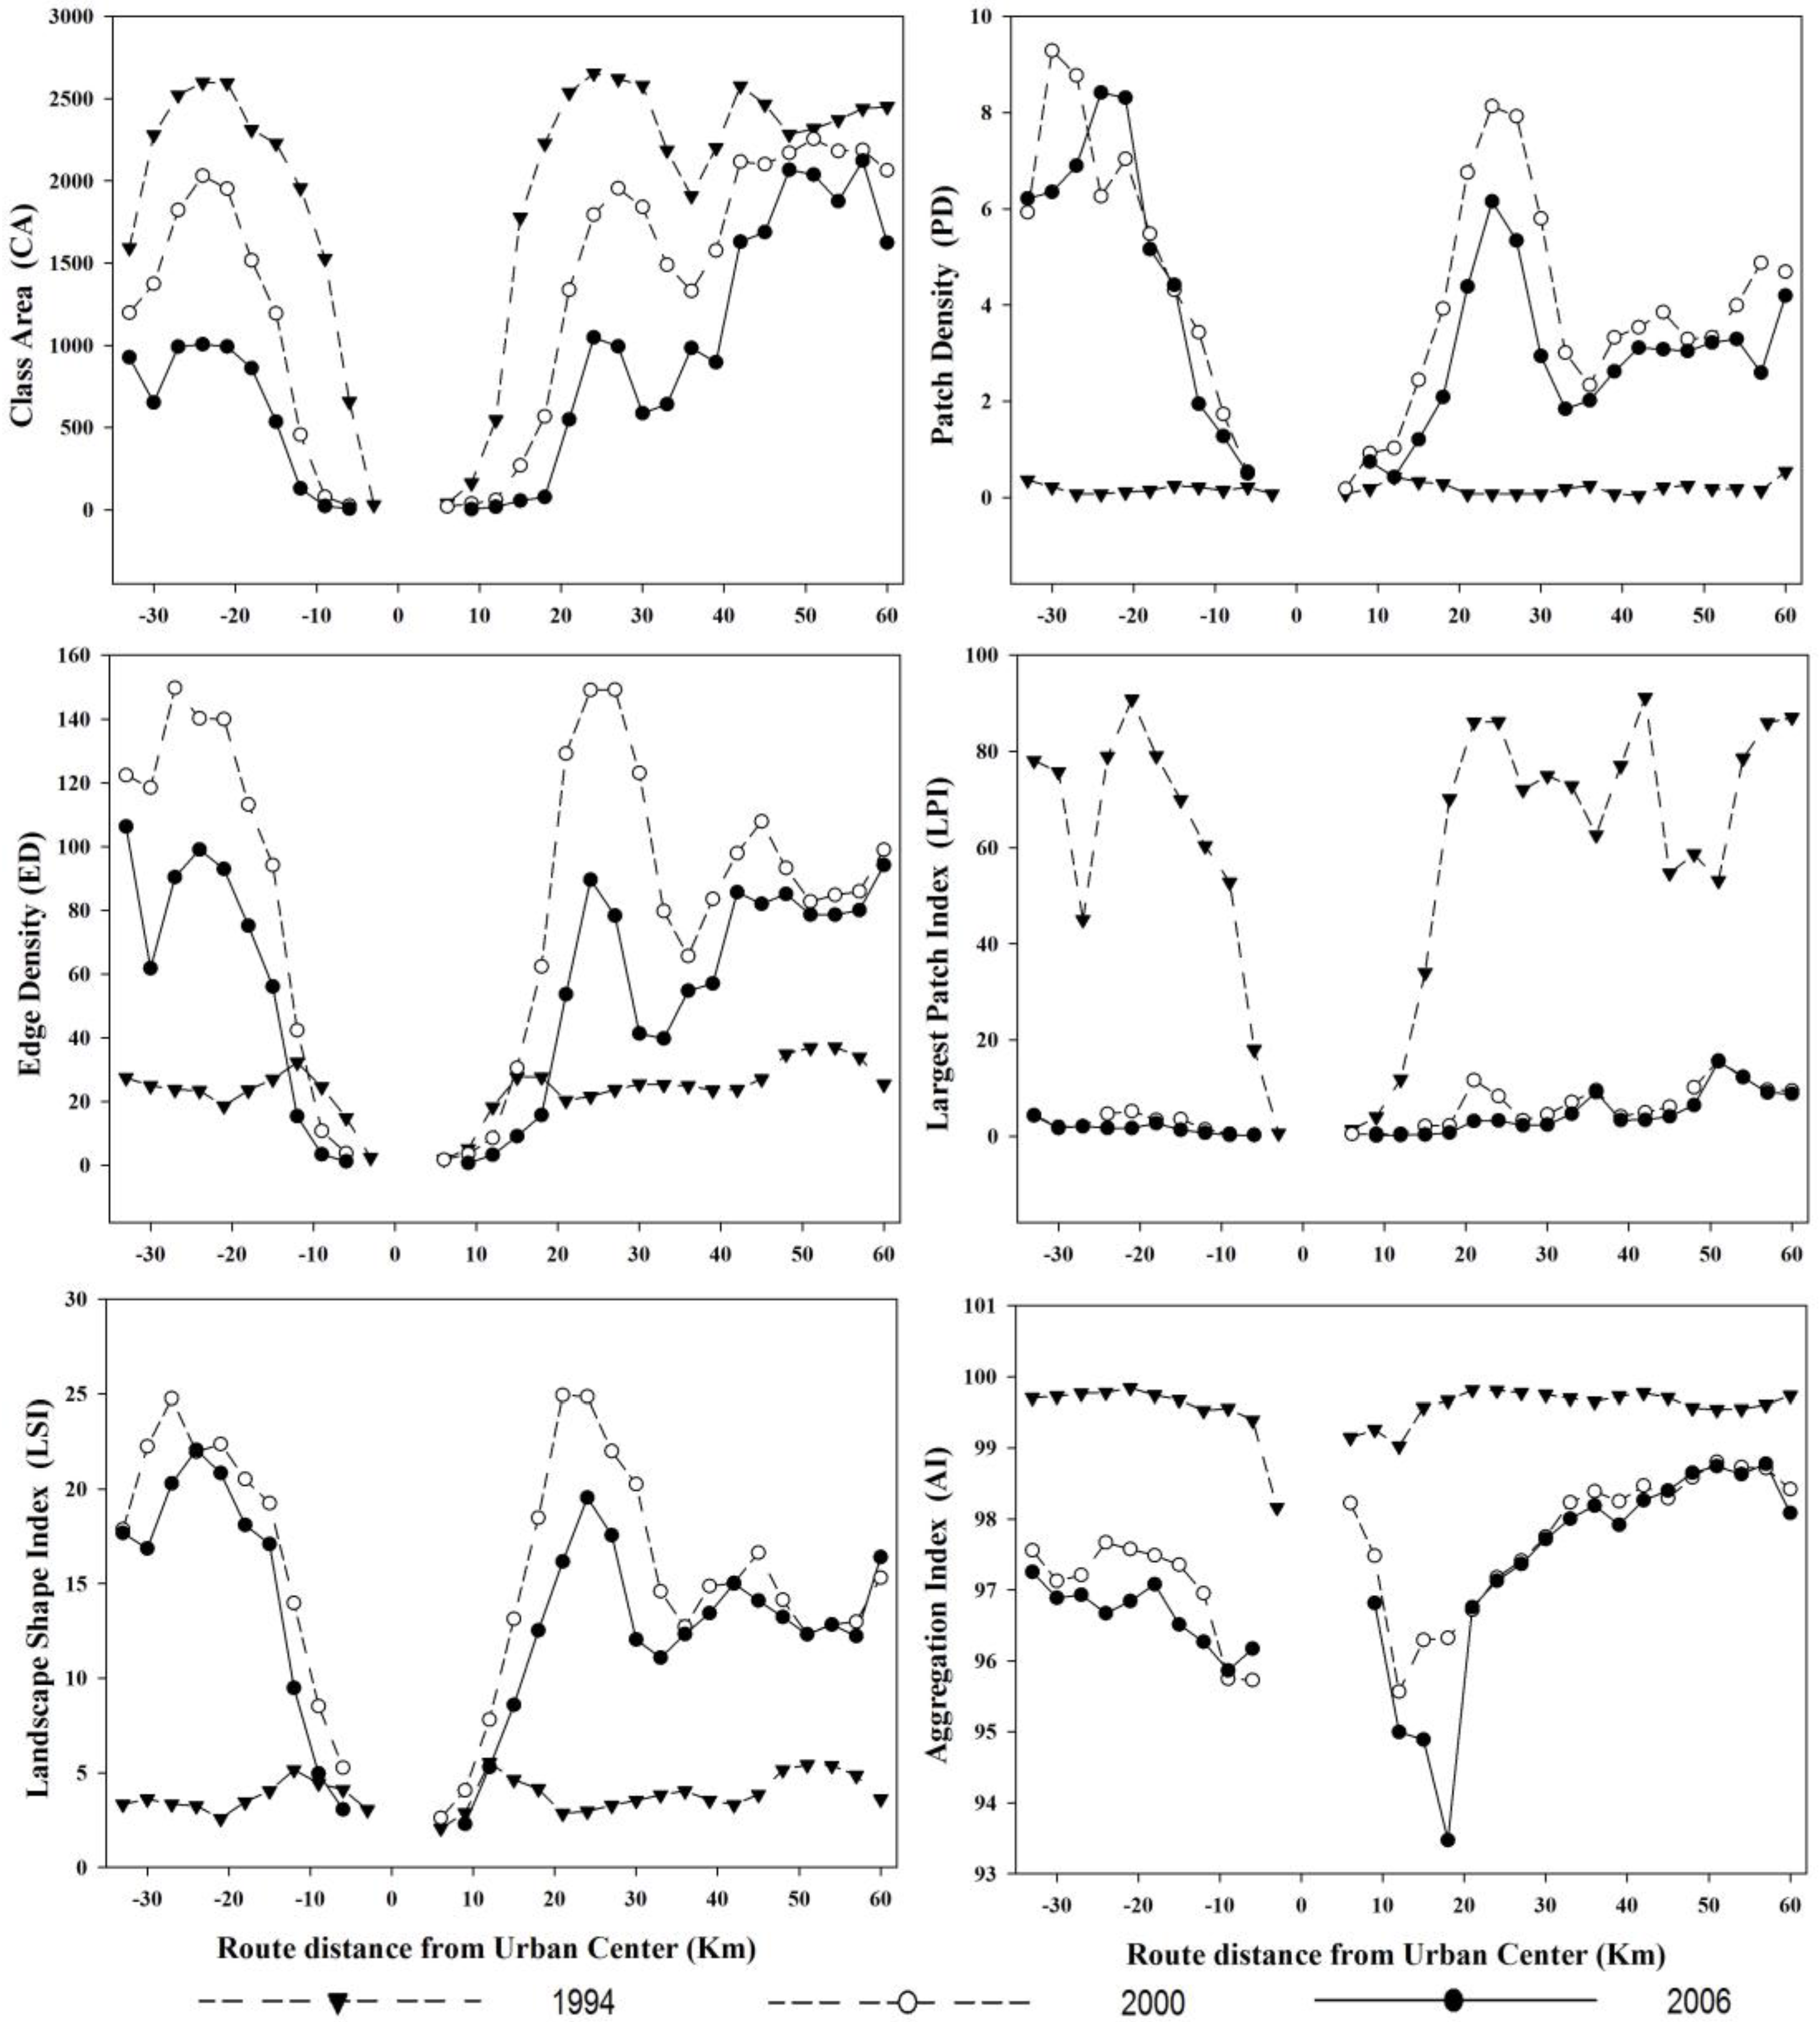
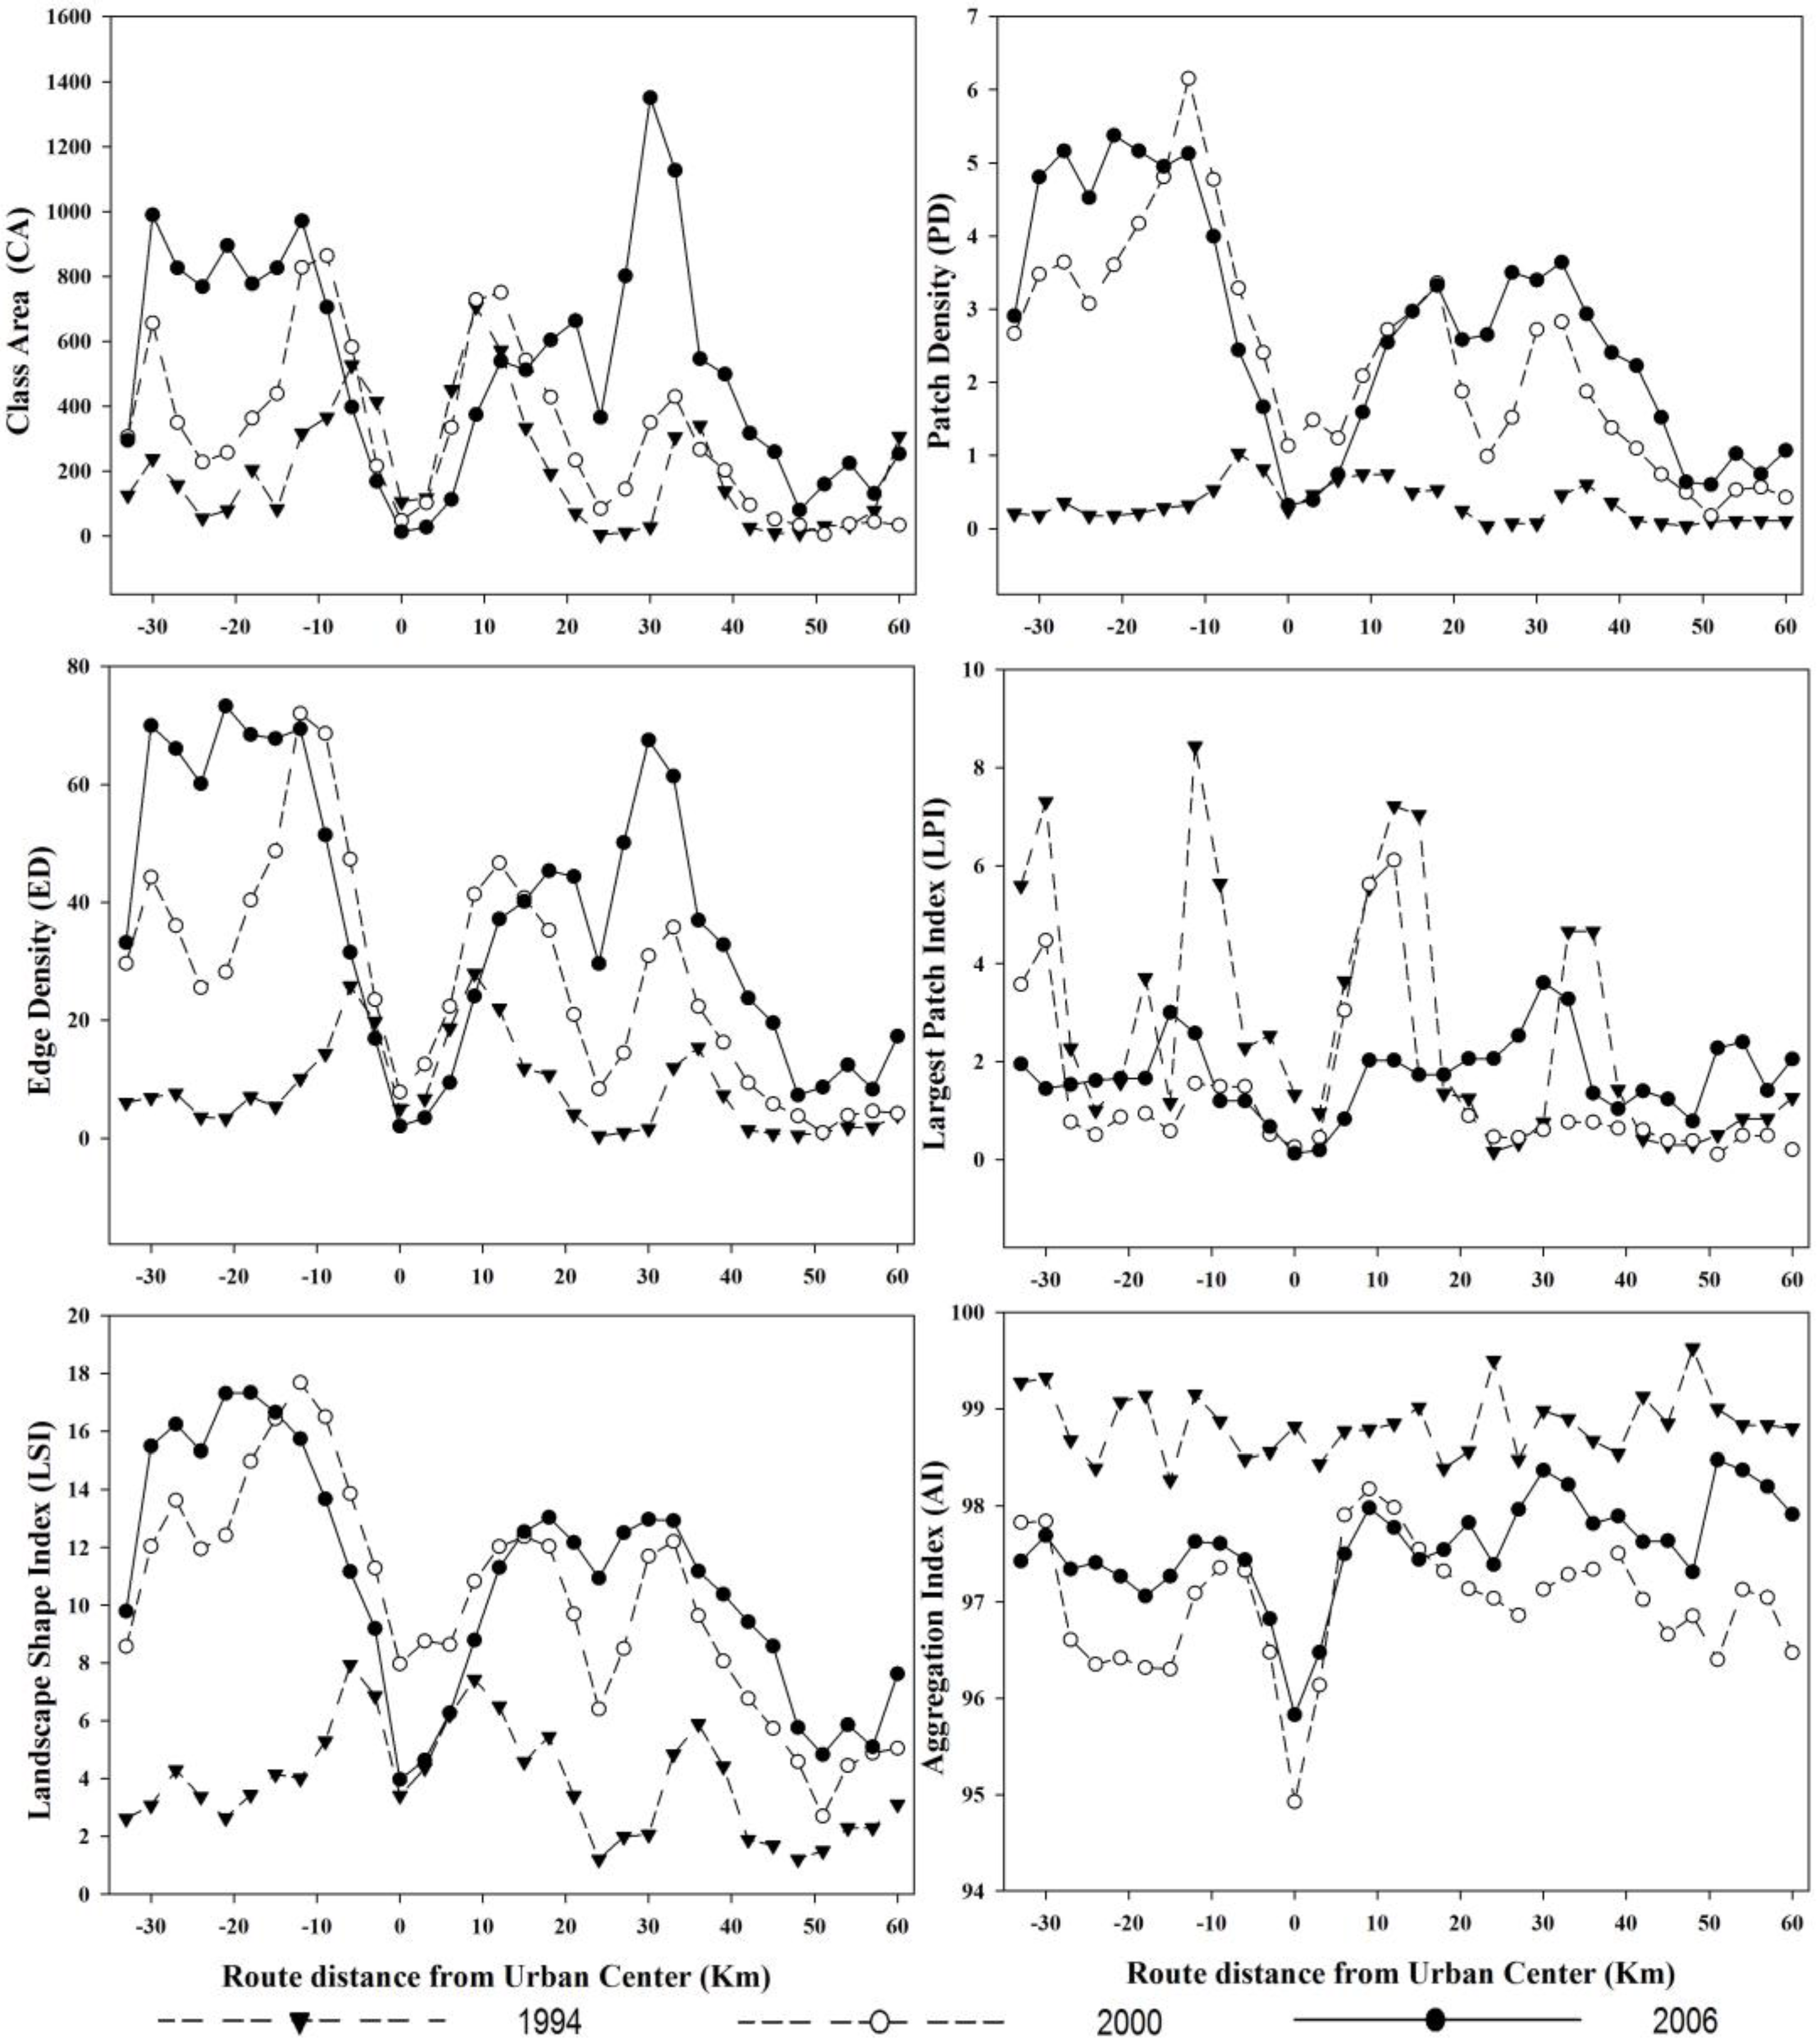
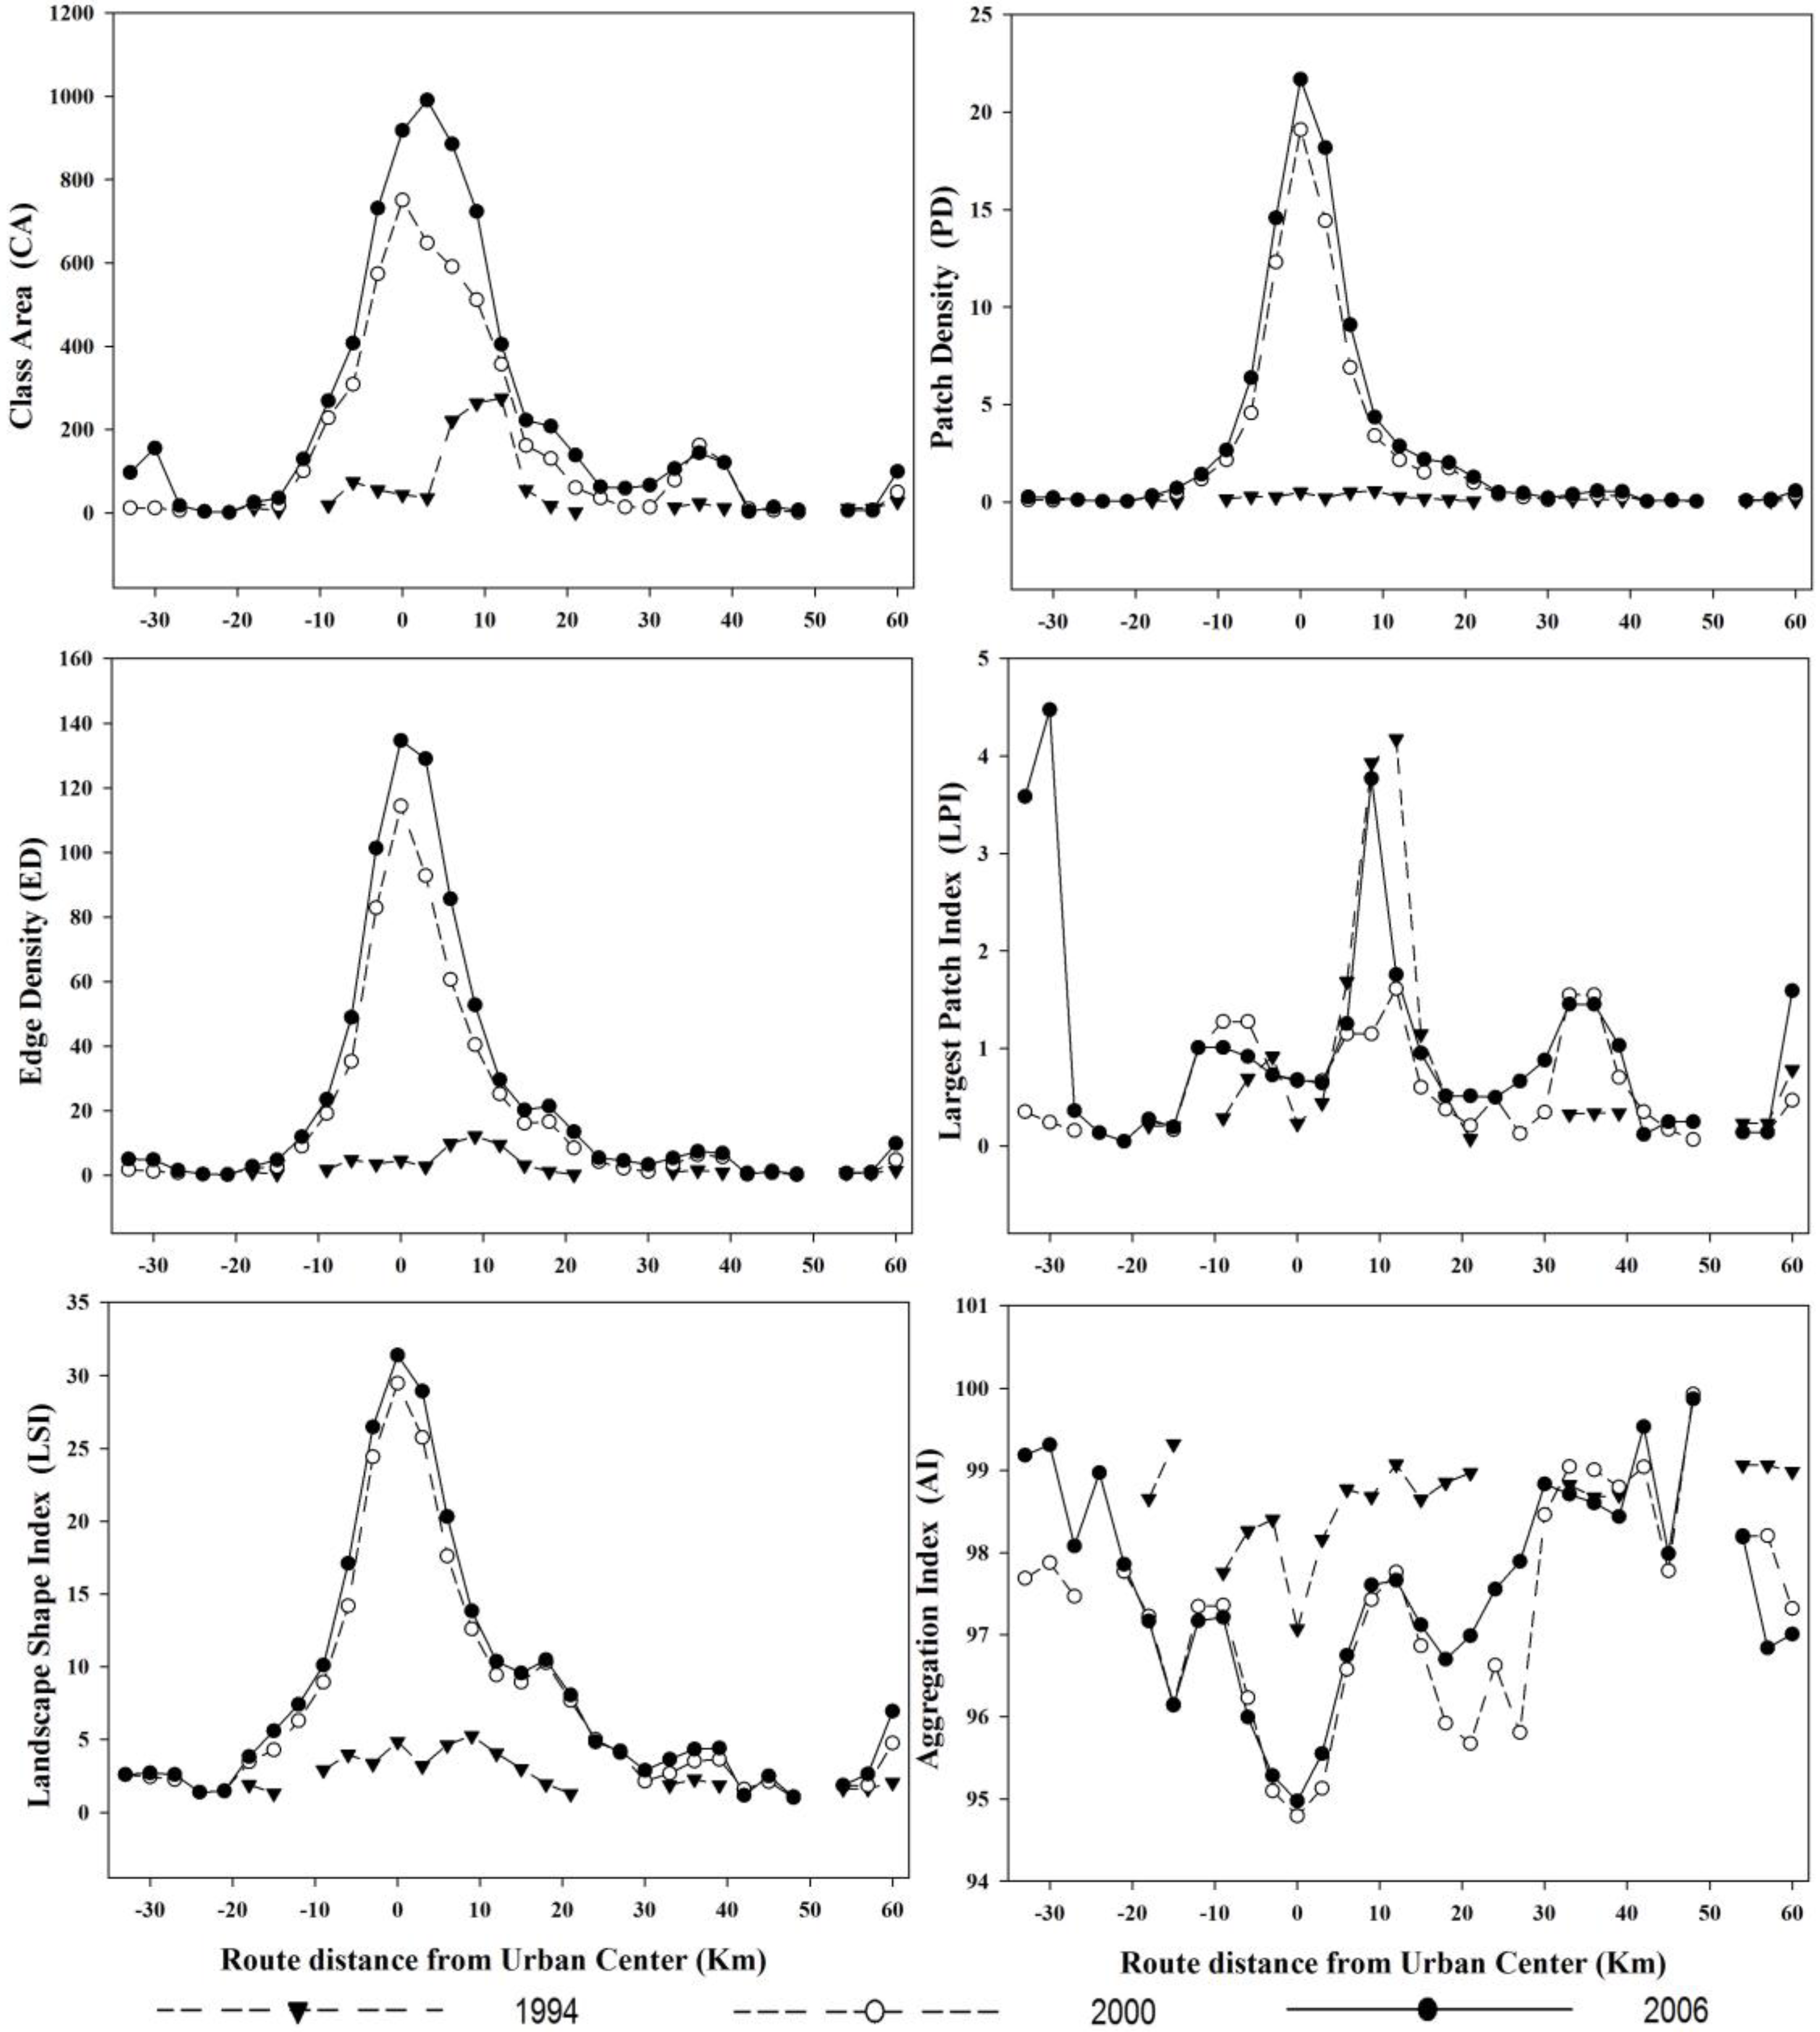
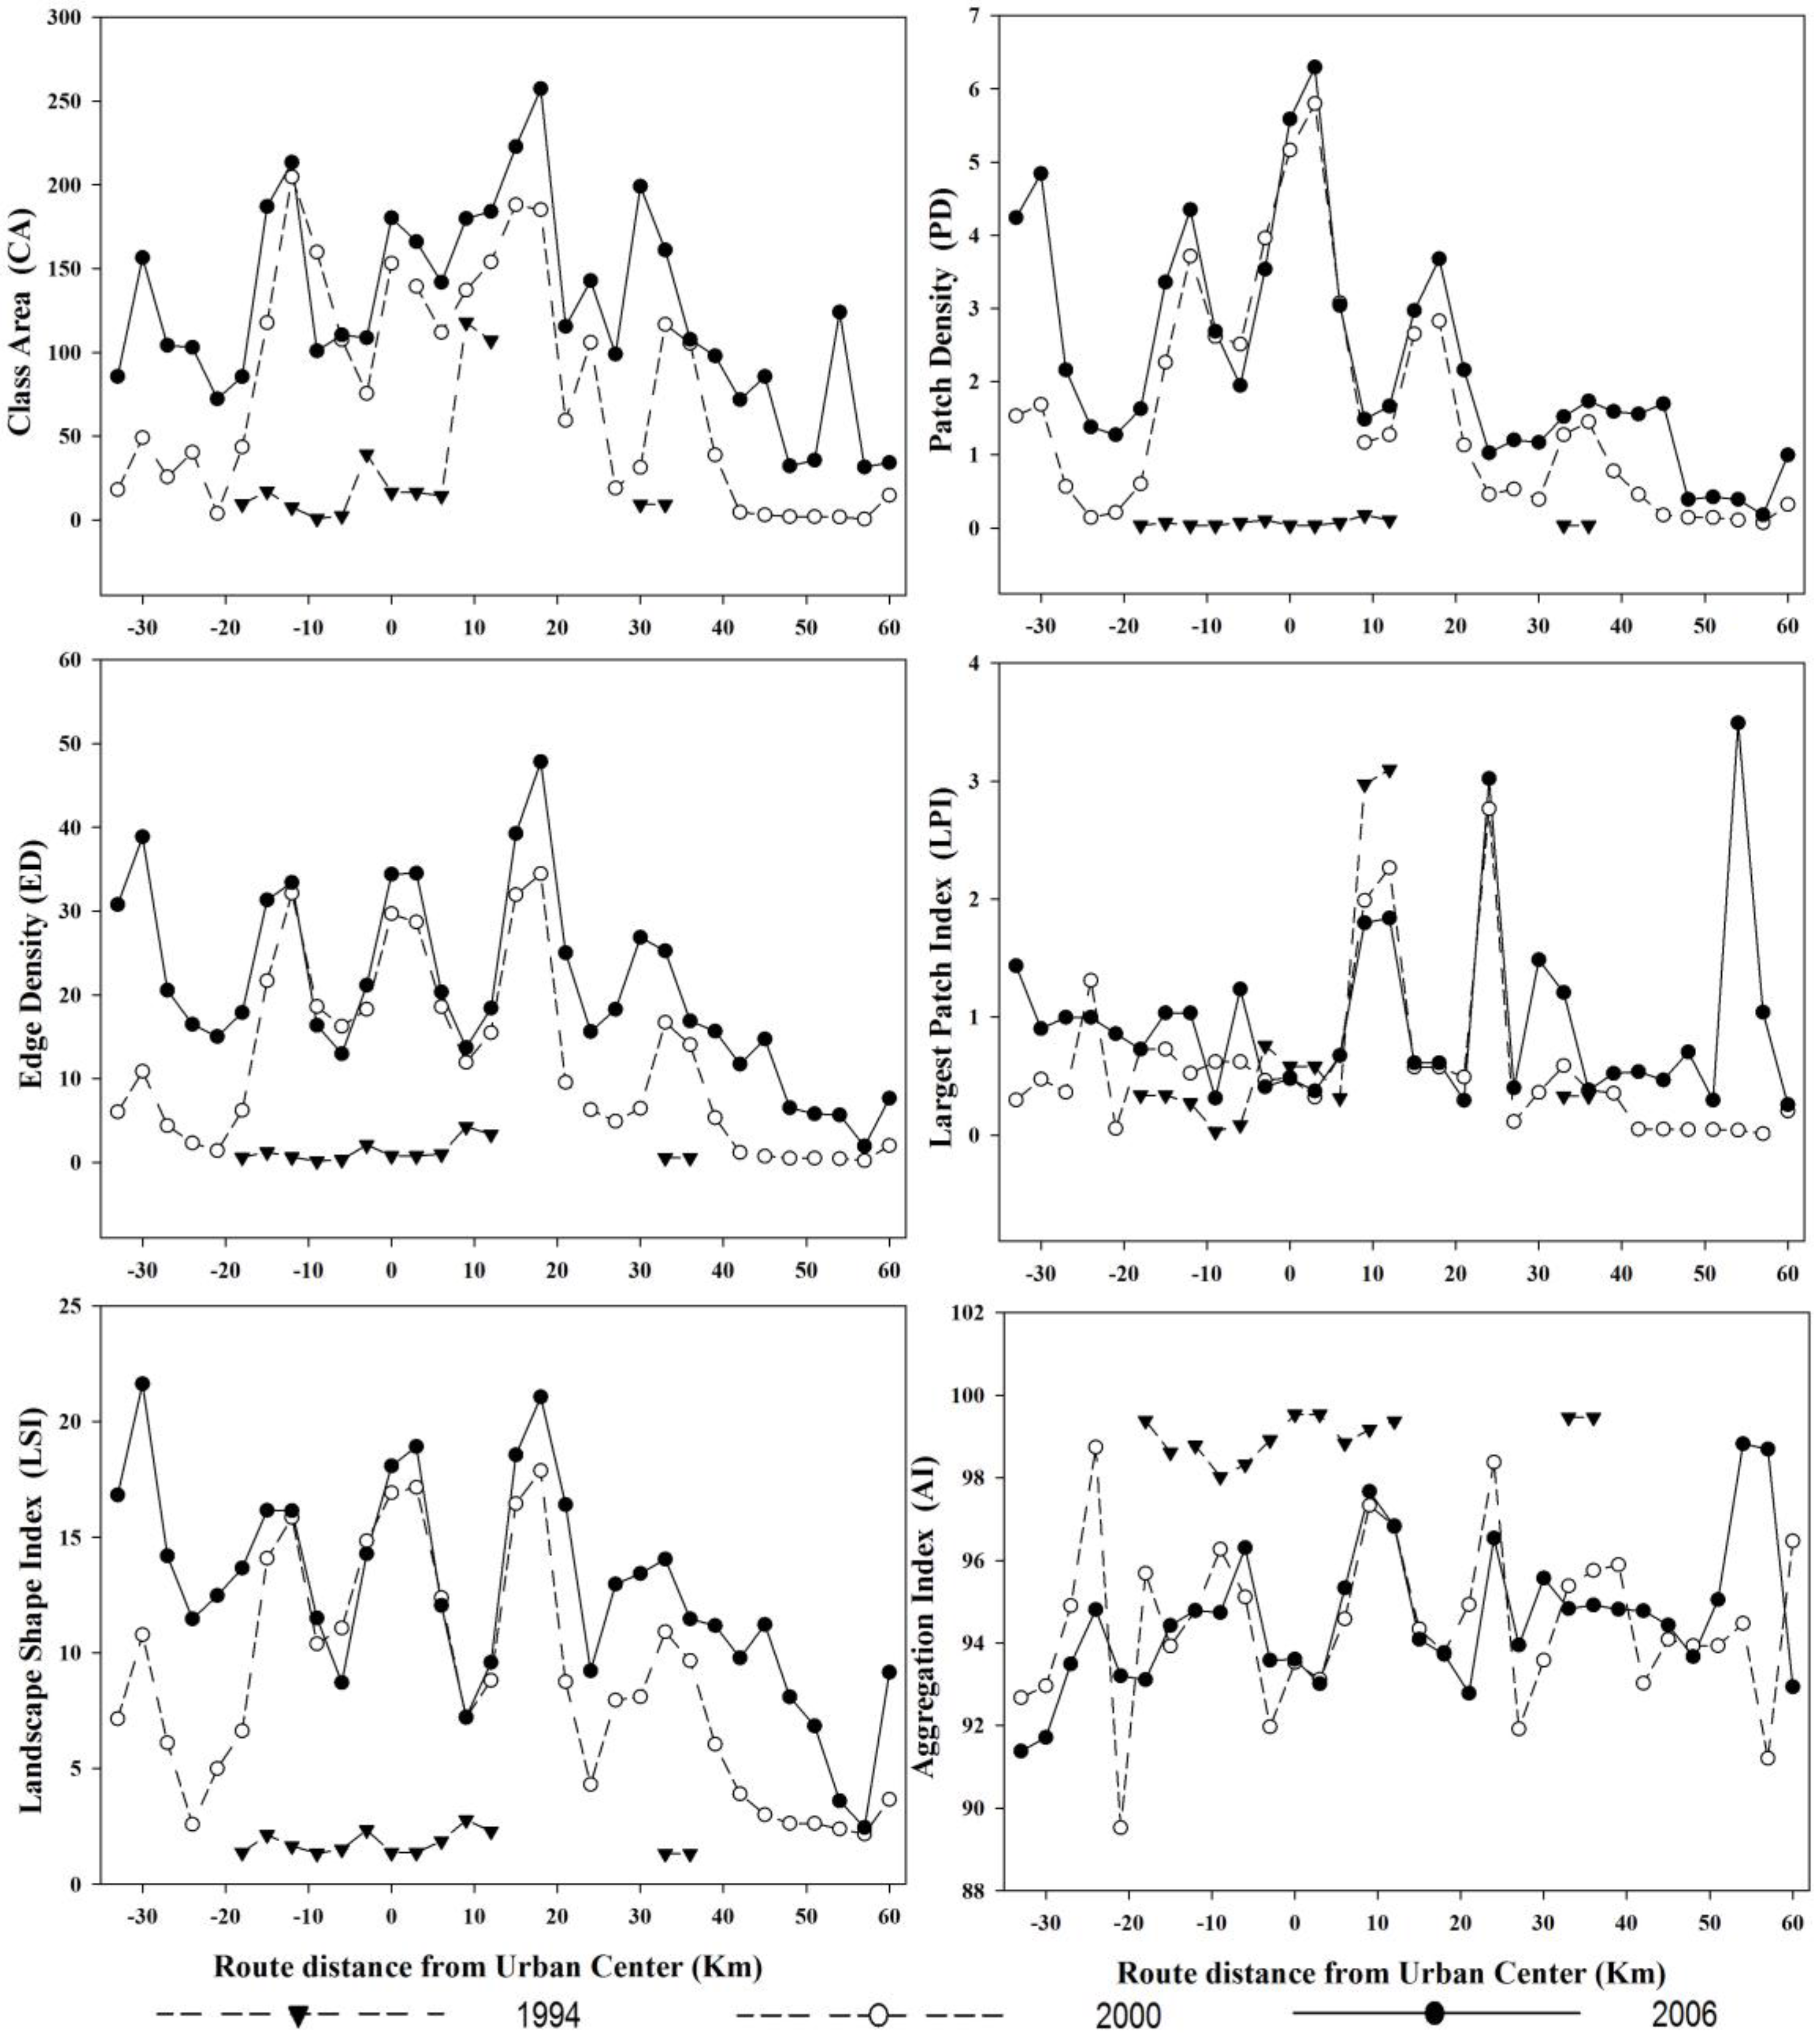
4.3. The Gradient Analysis of Landscape Patterns with Class-Level Metrics along the Railway
5. Discussion and Conclusions
5.1. The Metrics Varying Characteristics for Individual and Entire Landscape
5.2. The Spatiotemporal Pattern of Landscape Changes under Rapid Urbanization
5.3. Gradient Analysis along Railway Route as a New form Transects
5.4. The Suggestion and Implications for Urban Development
6. Limitations
Acknowledgments
Author Contributions
Conflicts of Interest
References
- Schneider, A.; Woodcock, C.E. Compact, dispersed, fragmented, extensive? A comparison of urban growth in twenty-five global cities using remotely sensed data, pattern metrics and census information. Urban Stud. 2008, 45, 659–692. [Google Scholar] [CrossRef]
- Gan, M.; Deng, J.; Zheng, X.; Hong, Y.; Wang, K. Monitoring urban greenness dynamics using multiple endmember spectral mixture analysis. PLoS ONE 2014, 9, e112202. [Google Scholar] [CrossRef] [PubMed]
- Seto, K.C.; Fragkias, M. Quantifying spatiotemporal patterns of urban land-use change in four cities of China with time series landscape metrics. Landsc. Ecol. 2005, 20, 871–888. [Google Scholar] [CrossRef]
- Wu, J.; Jenerette, G.D.; Buyantuyev, A.; Redman, C.L. Quantifying spatiotemporal patterns of urbanization: The case of the two fastest growing metropolitan regions in the United States. Ecol. Complex. 2011, 8, 1–8. [Google Scholar] [CrossRef]
- Xie, Y.; Yu, M.; Bai, Y.; Xing, X. Ecological analysis of an emerging urban landscape pattern—Desakota: A case study in Suzhou, China. Landsc. Ecol. 2006, 21, 1297–1309. [Google Scholar] [CrossRef]
- Antrop, M. Landscape change and the urbanization process in Europe. Landsc. Urban Plan. 2004, 67, 9–26. [Google Scholar] [CrossRef]
- Bagan, H.; Yamagata, Y. Landsat analysis of urban growth: How Tokyo became the world’s largest megacity during the last 40 years. Remote Sens. Environ. 2012, 127, 210–222. [Google Scholar] [CrossRef]
- Luck, M.; Wu, J. A gradient analysis of urban landscape pattern: A case study from the Phoenix metropolitan region, Arizona, USA. Landsc. Ecol. 2002, 17, 327–339. [Google Scholar] [CrossRef]
- Li, C.; Li, J.; Wu, J. Quantifying the speed, growth modes, and landscape pattern changes of urbanization: A hierarchical patch dynamics approach. Landsc. Ecol. 2013, 28, 1875–1888. [Google Scholar] [CrossRef]
- McGee, T.G. Urbanisasi or kotadesasi? Evolving patterns of urbanization in Asia. Urban Asia Spat. Dimens. Policy Issues 1989, 1, 93–108. [Google Scholar]
- Sui, D.Z.; Zeng, H. Modeling the dynamics of landscape structure in Asia’s emerging desakota regions: A case study in Shenzhen. Lands. Urban Plan. 2001, 53, 37–52. [Google Scholar] [CrossRef]
- Tavares, A.; Pato, R.; Magalhães, M. Spatial and temporal land use change and occupation over the last half century in a peri-urban area. Appl. Geogr. 2012, 34, 432–444. [Google Scholar] [CrossRef]
- Schneider, A. Monitoring land cover change in urban and peri-urban areas using dense time stacks of Landsat satellite data and a data mining approach. Remote Sens. Environ. 2012, 124, 689–704. [Google Scholar] [CrossRef]
- McDonnell, M.J.; Hahs, A.K. The use of gradient analysis studies in advancing our understanding of the ecology of urbanizing landscapes: Current status and future directions. Landsc. Ecol. 2008, 23, 1143–1155. [Google Scholar] [CrossRef]
- Li, X.; Zhang, L.; Liang, C. A GIS-based buffer gradient analysis on spatiotemporal dynamics of urban expansion in Shanghai and its major satellite cities. Procedia Environ. Sci. 2010, 2, 1139–1156. [Google Scholar] [CrossRef]
- McDonnell, M.J.; Pickett, S.T. Ecosystem structure and function along urban-rural gradients: An unexploited opportunity for ecology. Ecology 1990, 71, 1232–1237. [Google Scholar] [CrossRef]
- Qureshi, S.; Haase, D.; Coles, R. The Theorized Urban Gradient (TUG) method—A conceptual framework for socio-ecological sampling in complex urban agglomerations. Ecol. Indic. 2014, 36, 100–110. [Google Scholar] [CrossRef]
- Li, H.; Wei, Y.H.D.; Huang, Z. Urban land expansion and spatial dynamics in globalizing shanghai. Sustainability 2014, 6, 8856–8875. [Google Scholar] [CrossRef]
- Bennett, A.B.; Gratton, C. Local and landscape scale variables impact parasitoid assemblages across an urbanization gradient. Landsc. Urban Plan. 2012, 104, 26–33. [Google Scholar] [CrossRef]
- Zhu, M.; Xu, J.; Jiang, N.; Li, J.; Fan, Y. Impacts of road corridors on urban landscape pattern: A gradient analysis with changing grain size in Shanghai, China. Landsc. Ecol. 2006, 21, 723–734. [Google Scholar] [CrossRef]
- Ahlfeldt, G.M.; Wendland, N. Fifty years of urban accessibility: The impact of the urban railway network on the land gradient in Berlin 1890–1936. Reg. Sci. Urban Econ. 2011, 41, 77–88. [Google Scholar] [CrossRef] [Green Version]
- Liu, Y.; Wang, H.; Jiao, L.; Liu, Y.; He, J.; Ai, T. Road centrality and landscape spatial patterns in Wuhan Metropolitan Area, China. Chin. Geogr. Sci. 2015, 25, 511–522. [Google Scholar] [CrossRef]
- Yu, X.J.; Ng, C.N. Spatial and temporal dynamics of urban sprawl along two urban–rural transects: A case study of Guangzhou, China. Landsc. Urban Plan. 2007, 79, 96–109. [Google Scholar] [CrossRef]
- Weng, Y.-C. Spatiotemporal changes of landscape pattern in response to urbanization. Landsc. Urban Plan. 2007, 81, 341–353. [Google Scholar] [CrossRef]
- Dietzel, C.; Herold, M.; Hemphill, J.J.; Clarke, K.C. Spatio-temporal dynamics in California’s Central Valley: Empirical links to urban theory. Int. J. Geogr. Inf. Sci. 2005, 19, 175–195. [Google Scholar] [CrossRef]
- Yue, W.; Fan, P.; Wei, Y.D.; Qi, J. Economic development, urban expansion, and sustainable development in Shanghai. Stoch. Environ. Res. Risk Assess. 2012, 28, 783–799. [Google Scholar] [CrossRef]
- ESRI. ArcInfo Desktop GIS; ESRI Press: Redlands, CA, USA, 2010. [Google Scholar]
- Li, J.; Li, C.; Zhu, F.; Song, C.; Wu, J. Spatiotemporal pattern of urbanization in Shanghai, China between 1989 and 2005. Landsc. Ecol. 2013, 28, 1545–1565. [Google Scholar] [CrossRef]
- O’neill, R.V.; Riitters, K.H.; Wickham, J.; Jones, K.B. Landscape pattern metrics and regional assessment. Ecosyst. Health 1999, 5, 225–233. [Google Scholar] [CrossRef]
- Zhang, Z.; Su, S.; Xiao, R.; Jiang, D.; Wu, J. Identifying determinants of urban growth from a multi-scale perspective: A case study of the urban agglomeration around Hangzhou Bay, China. Appl. Geogr. 2013, 45, 193–202. [Google Scholar] [CrossRef]
- McGarigal, K.; Marks, B.J. Spatial Pattern Analysis Program for Quantifying Landscape Structure; Genneral Technical Reporet PNW-GTR-351; US Department of Agriculture, Forest Service, Pacific Northwest Research Station: Portland, OR, USA, 1995.
- Cheng, L.; Xia, N.; Jiang, P.; Zhong, L.; Pian, Y.; Duan, Y.; Huang, Q.; Li, M. Analysis of farmland fragmentation in China Modernization Demonstration Zone since “Reform and Openness”: A case study of South Jiangsu Province. Sci. Rep. 2015, 5, 11797. [Google Scholar] [CrossRef]
- Vizzari, M.; Sigura, M. Landscape sequences along the urban–rural–natural gradient: A novel geospatial approach for identification and analysis. Landsc. Urban Plan. 2015, 140, 42–55. [Google Scholar] [CrossRef]
- McKinney, M.L. Urbanization as a major cause of biotic homogenization. Biol. Conserv. 2006, 127, 247–260. [Google Scholar] [CrossRef]
- Gong, J.; Liu, Y.; Xia, B. Spatial heterogeneity of urban land-cover landscape in Guangzhou from 1990 to 2005. J. Geogr. Sci. 2009, 19, 213–224. [Google Scholar] [CrossRef]
- You, H. Quantifying urban fragmentation under economic transition in shanghai city, China. Sustainability 2016, 8, 21. [Google Scholar] [CrossRef]
- Pham, H.M.; Yamaguchi, Y.; Bui, T.Q. A case study on the relation between city planning and urban growth using remote sensing and spatial metrics. Landsc. Urban Plan. 2011, 100, 223–230. [Google Scholar] [CrossRef]
- Forman, R.T.; Godron, M. Landscape Ecology; John Wiley & Sons: New York, NY, USA, 1986. [Google Scholar]
- Yang, S.; Wang, M.Y.; Wang, C. Socio-spatial restructuring in Shanghai: Sorting out where you live by affordability and social status. Cities 2015, 47, 23–34. [Google Scholar] [CrossRef]
- Henle, K.; Alard, D.; Clitherow, J.; Cobb, P.; Firbank, L.; Kull, T.; McCracken, D.; Moritz, R.F.; Niemelä, J.; Rebane, M. Identifying and managing the conflicts between agriculture and biodiversity conservation in Europe—A review. Agric. Ecosyst. Environ. 2008, 124, 60–71. [Google Scholar] [CrossRef]
- Wu, J. Landscape of culture and culture of landscape: Does landscape ecology need culture? Landsc. Ecol. 2010, 25, 1147–1150. [Google Scholar] [CrossRef]
- Verburg, P.H.; van Eck, J.R.R.; de Nijs, T.C.; Dijst, M.J.; Schot, P. Determinants of land-use change patterns in the Netherlands. Environ. Plan. B Plan. Des. 2004, 31, 125–150. [Google Scholar] [CrossRef]
- Reimets, R.; Uuemaa, E.; Oja, T.; Sisas, E.; Mander, Ü. Urbanisation-related landscape change in space and time along spatial gradients near roads: A case study from estonia. Landsc. Res. 2015, 40, 192–207. [Google Scholar] [CrossRef]
- Solon, J. Spatial context of urbanization: Landscape pattern and changes between 1950 and 1990 in the Warsaw metropolitan area, Poland. Landsc. Urban Plan. 2009, 93, 250–261. [Google Scholar] [CrossRef]
- Niemelä, J.; Kotze, D.J. Carabid beetle assemblages along urban to rural gradients: A review. Landsc. Urban Plan. 2009, 92, 65–71. [Google Scholar] [CrossRef]
- Di Giulio, M.; Holderegger, R.; Tobias, S. Effects of habitat and landscape fragmentation on humans and biodiversity in densely populated landscapes. J. Environ. Manag. 2009, 90, 2959–2968. [Google Scholar] [CrossRef] [PubMed]
- Deng, J.S.; Wang, K.; Hong, Y.; Qi, J.G. Spatio-temporal dynamics and evolution of land use change and landscape pattern in response to rapid urbanization. Landsc. Urban Plan. 2009, 92, 187–198. [Google Scholar] [CrossRef]
- Pătru-Stupariu, I.; Stupariu, M.-S.; Tudor, C.A.; Grădinaru, S.R.; Gavrilidis, A.; Kienast, F.; Hersperger, A.M. Landscape fragmentation in Romania’s Southern Carpathians: Testing a European assessment with local data. Landsc. Urban Plan. 2015, 143, 1–8. [Google Scholar] [CrossRef]
- Larondelle, N.; Haase, D. Urban ecosystem services assessment along a rural–urban gradient: A cross-analysis of European cities. Ecol. Indic. 2013, 29, 179–190. [Google Scholar] [CrossRef]
- Huang, Q.; He, C.; Gao, B.; Yang, Y.; Liu, Z.; Zhao, Y.; Dou, Y. Detecting the 20 year city-size dynamics in China with a rank clock approach and DMSP/OLS nighttime data. Landsc. Urban Plan. 2015, 137, 138–148. [Google Scholar] [CrossRef]
- Zhang, H.; Wang, X.; Ho, H.H.; Yong, Y. Eco-health evaluation for the Shanghai metropolitan area during the recent industrial transformation (1990–2003). J. Environ. Manag. 2008, 88, 1047–1055. [Google Scholar] [CrossRef] [PubMed]
- Chen, D.; Wang, Y.; Ren, F.; Du, Q. Spatio-temporal differentiation of urban-rural equalized development at the county level in Chengdu. Sustainability 2016, 8, 422. [Google Scholar] [CrossRef]
- You, H. Quantifying the coordinated degree of urbanization in Shanghai, China. Qual. Quant. 2016, 50, 1273–1283. [Google Scholar] [CrossRef]


| Landscape Metrics (Abbreviation) | Study Level | Description |
|---|---|---|
| Aggregation index (AI) | L, C | AI represents the aggregation of the landscape pattern. |
| Class area (CA) | C | The area of the landscape patches (100 ha). |
| Connectance index (CI) | L, C | It is defined on the number of functional joinings between patches of the given types. |
| Edge density (ED) | L, C | It equals the total length of the landscape patch edges divided by the total landscape area (m/ha). |
| Landscape shape index (LSI) | L, C | Total length of the patch edges divided by the total area of the landscape (m/m2). |
| Largest patch index (LPI) | L, C | The percentage of the largest patch in the total landscape (%). It refers to the dominance for one type of patch. |
| Patch density (PD) | L, C | The numbers of patches per 100 ha. |
| Shannon diversity index (SHDI) | L | High value of SHDI means the type of patch increased or each type of the landscape is more equitably distributed. |
© 2016 by the authors; licensee MDPI, Basel, Switzerland. This article is an open access article distributed under the terms and conditions of the Creative Commons Attribution (CC-BY) license (http://creativecommons.org/licenses/by/4.0/).
Share and Cite
Zhang, Z.; Tu, Y.; Li, X. Quantifying the Spatiotemporal Patterns of Urbanization along Urban-Rural Gradient with a Roadscape Transect Approach: A Case Study in Shanghai, China. Sustainability 2016, 8, 862. https://doi.org/10.3390/su8090862
Zhang Z, Tu Y, Li X. Quantifying the Spatiotemporal Patterns of Urbanization along Urban-Rural Gradient with a Roadscape Transect Approach: A Case Study in Shanghai, China. Sustainability. 2016; 8(9):862. https://doi.org/10.3390/su8090862
Chicago/Turabian StyleZhang, Zhonghao, Yaojen Tu, and Xin Li. 2016. "Quantifying the Spatiotemporal Patterns of Urbanization along Urban-Rural Gradient with a Roadscape Transect Approach: A Case Study in Shanghai, China" Sustainability 8, no. 9: 862. https://doi.org/10.3390/su8090862
APA StyleZhang, Z., Tu, Y., & Li, X. (2016). Quantifying the Spatiotemporal Patterns of Urbanization along Urban-Rural Gradient with a Roadscape Transect Approach: A Case Study in Shanghai, China. Sustainability, 8(9), 862. https://doi.org/10.3390/su8090862