
Sustainability Measures of Urban Public Transport in Cities: A World Review and Focus on the Asia/Middle East Region


Abstract
:1. Introduction
By 2030, provide access to safe, affordable, accessible and sustainable transport systems for all, improving road safety, notably by expanding public transport, with special attention to the needs of those in vulnerable situations, women, children, persons with disabilities and older persons.
2. Research Context
2.1. Defining Sustainability
“… development that meets the needs of the present without compromising the ability of future generations to meet their own needs”.
“Development that meets the needs of the present while safeguarding Earth’s life-support system, on which the welfare of current and future generations depends”.
2.2. Transport Sustainability
- Economic: transport demand, costs, and infrastructure-related indicators
- Social: accessibility, mobility, safety, health, affordability, and employment-related indicators
- Environmental: transport emissions, energy, and environmental-based indicators
- Technical and operational: vehicle occupancy and technology-related indicators
- Institutional: consideration of measures to improve transport sustainability.
2.3. Public Transport Sustainability
3. Research Method
3.1. Key Data Sources and Cities
3.2. Selection of Public Transport Sustainability Indicators
3.3. Data Analysis
- ni negative = normalised value for negative indicator i
- xi = raw value of indicator i
- ni positive = normalised value for positive indicator i
- xi = raw value of indicator i
4. Results
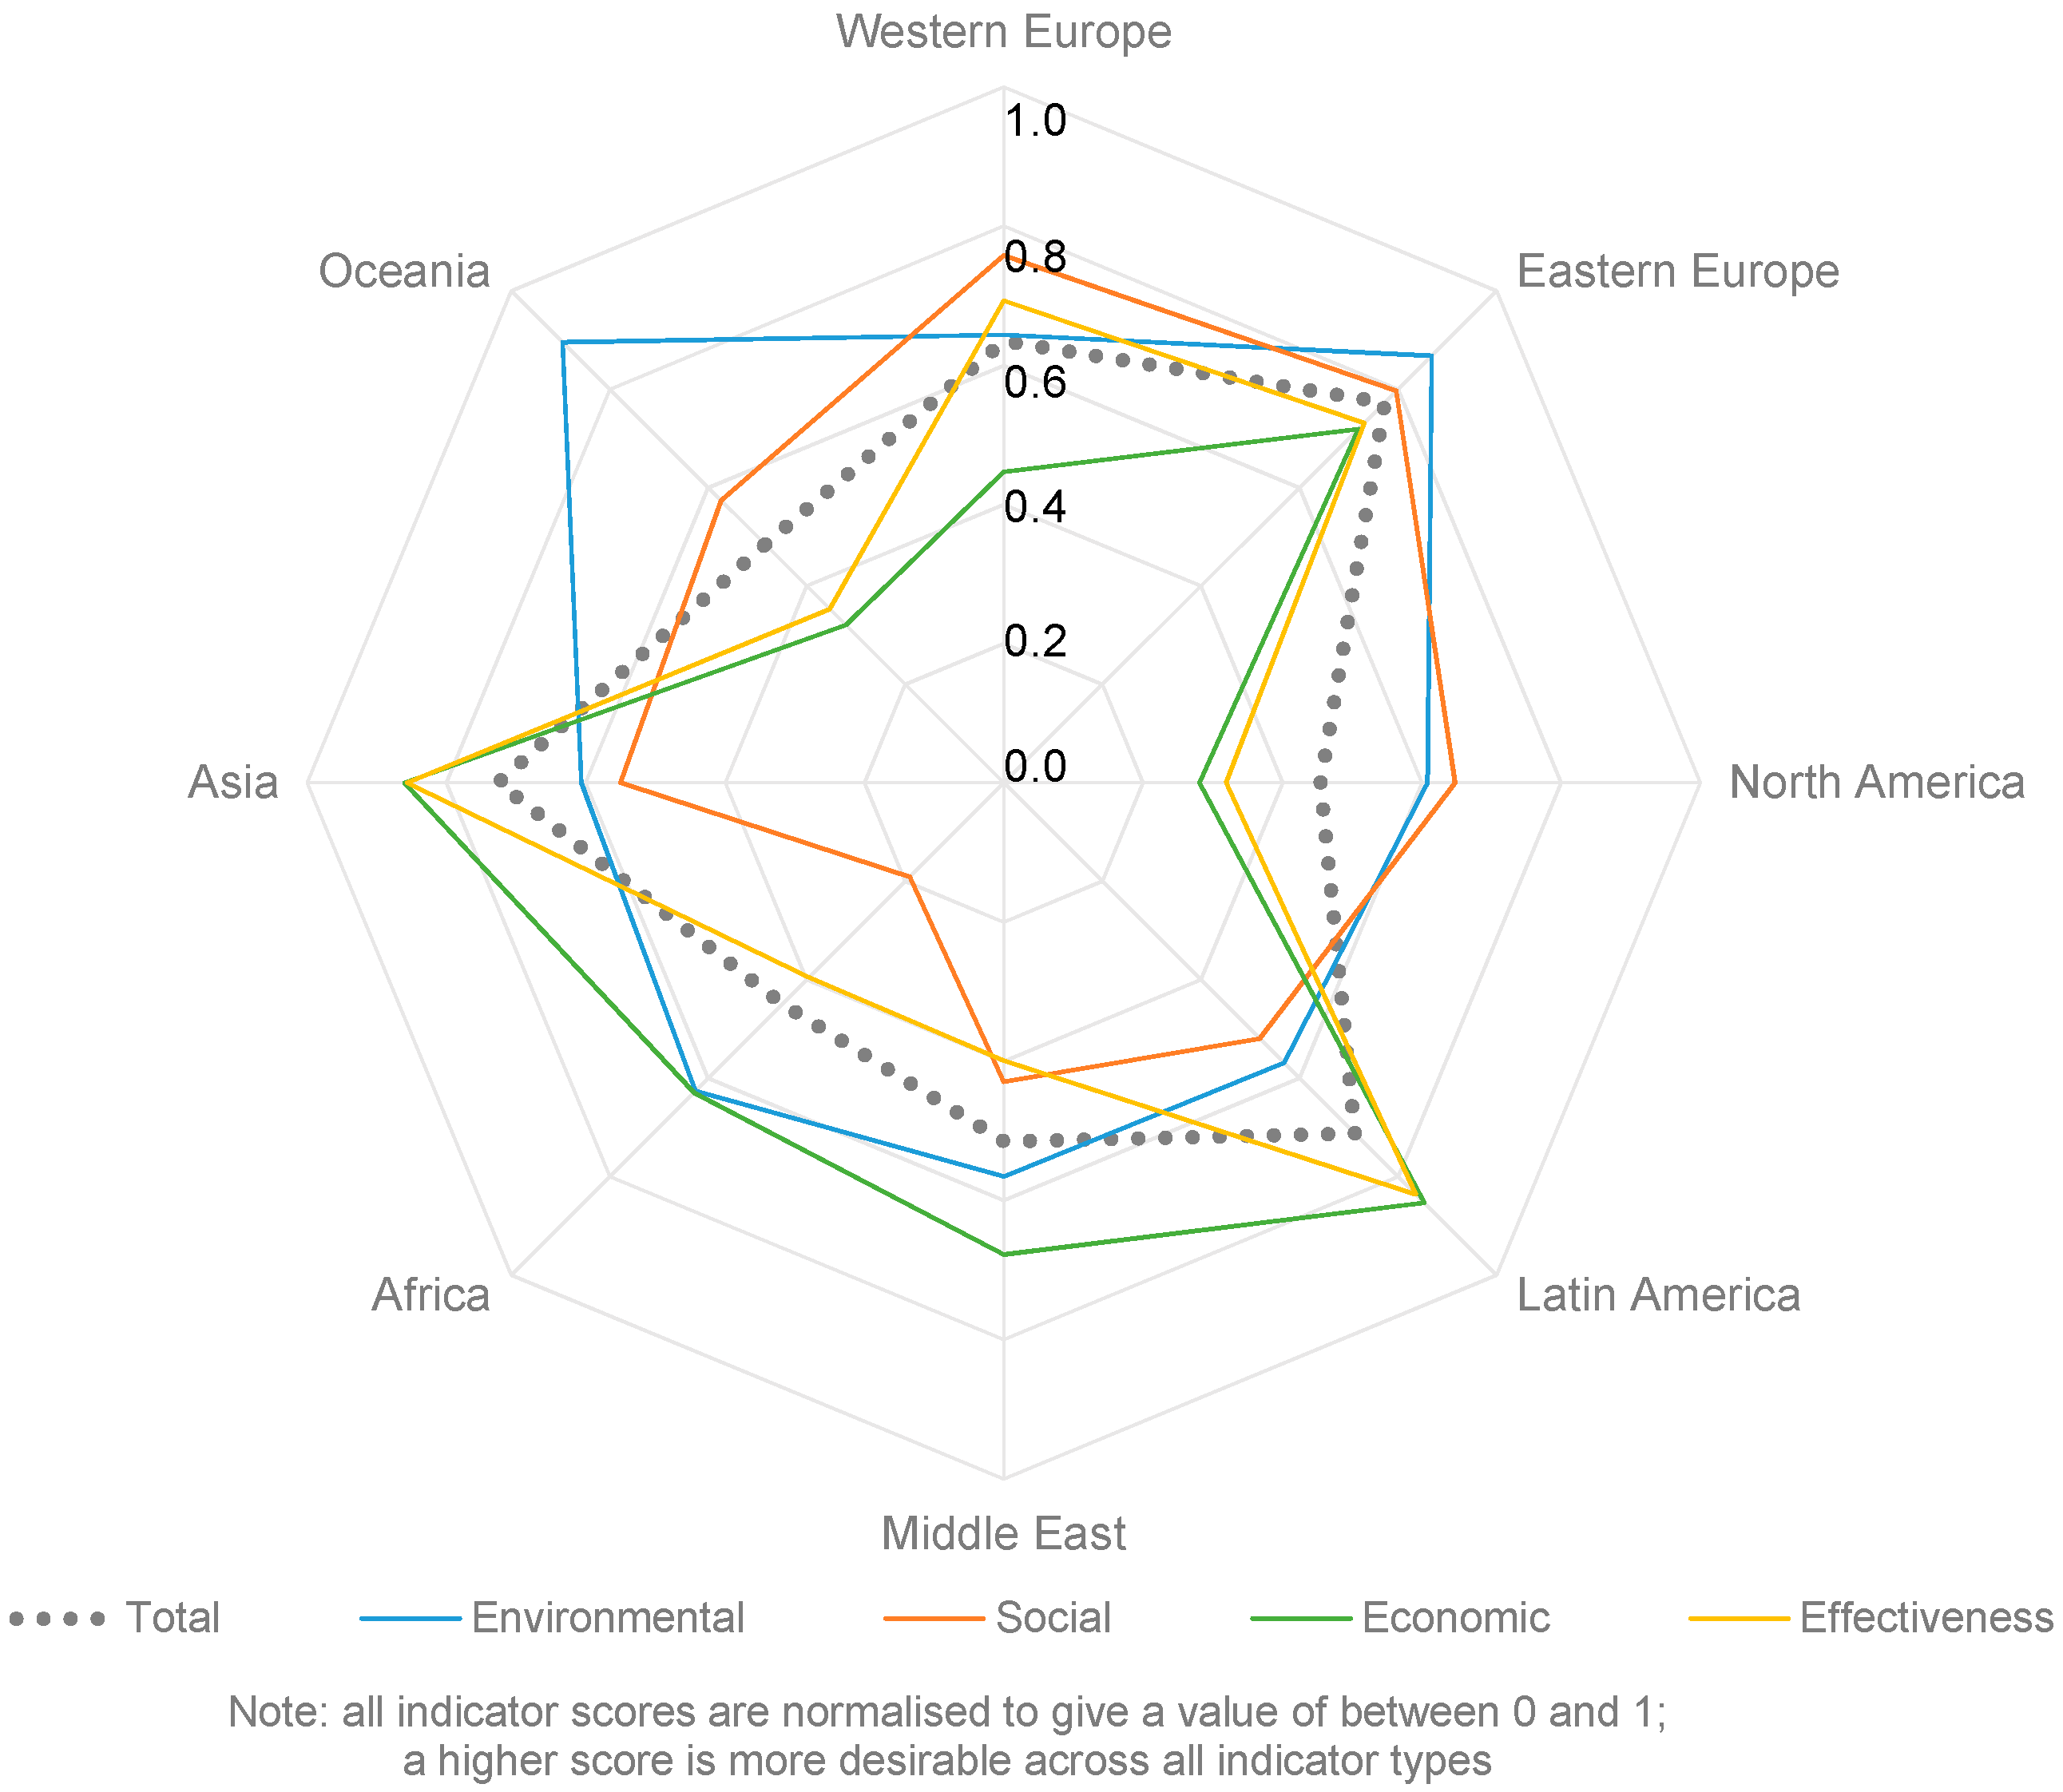
4.1. World Region Analysis
- Eastern Europe, Asia, and Latin America achieve the highest aggregate normalised scores (in that order).
- Eastern Europe has the highest rating results of all regions, which is a result of high scores on all scales, but particularly a first-place rating for social indicators, a second place for environmental, and third place for the others.
- Asia is second ranked because it has a first-place rating for both system effectiveness and economic indicators. It is, however, rated only fifth and sixth out of the eight regions for social and environmental indicators, respectively.
- Latin America is rated third place because it has a second-place rank for system effectiveness and economic indicators, but sixth and seventh place for social and environmental indicators.
- The Middle East, one of the two major regions of focus in this paper, is rated fifth out of the eight regions, including a last-place rating for environmental indicators, second last for social, and a fourth- and fifth-place rating for economic and system effectiveness indicators.
- Asia rated first place for system effectiveness and economic indicators:
- -
- System effectiveness is first due to top ratings for vehicle occupancy and second-highest ratings for mode split and transit fleet per capita (service level)
- -
- Economic indicators are first due to the highest cost recovery (Asia has a value of 122%, which means fares are profitable relative to operating costs; the only other regions to achieve this are Latin America and the Middle East). Asia also has the second-highest rating of the regions for passenger kilometre per GDP and a high rating for average time cost per trip.
- Asia rated lowest fifth and sixth out of the eight regions for social and environmental indicators respectively:
- -
- Lower environmental ratings resulted because pollution levels and the land consumed were second highest of all regions
- -
- Midrange social ratings resulted from mid of group scores for affordability and travel distance, but a high rate of transit deaths.
- The Middle East rated fifth out of the eight regions including a last-place rating for environmental indicators and a second-last for social indicators:
- -
- Poor environmental performance resulted from the highest rating of pollutants and the highest land area used for transit (20%)
- -
- The Middle East has the second-least affordable systems and midrange values for all other social indicators.
- The Middle East rated a fourth- and fifth-place rating for economic and system effectiveness indicators:
- -
- Although the Middle East had the lowest time cost per trip, other economic indicators were poor, including the cost per passenger kilometre and passenger kilometre per unit GDP
- -
- The Middle East rates fifth or sixth for all system effectiveness measures (i.e., it has low mode share, ridership, occupancy, and service level).
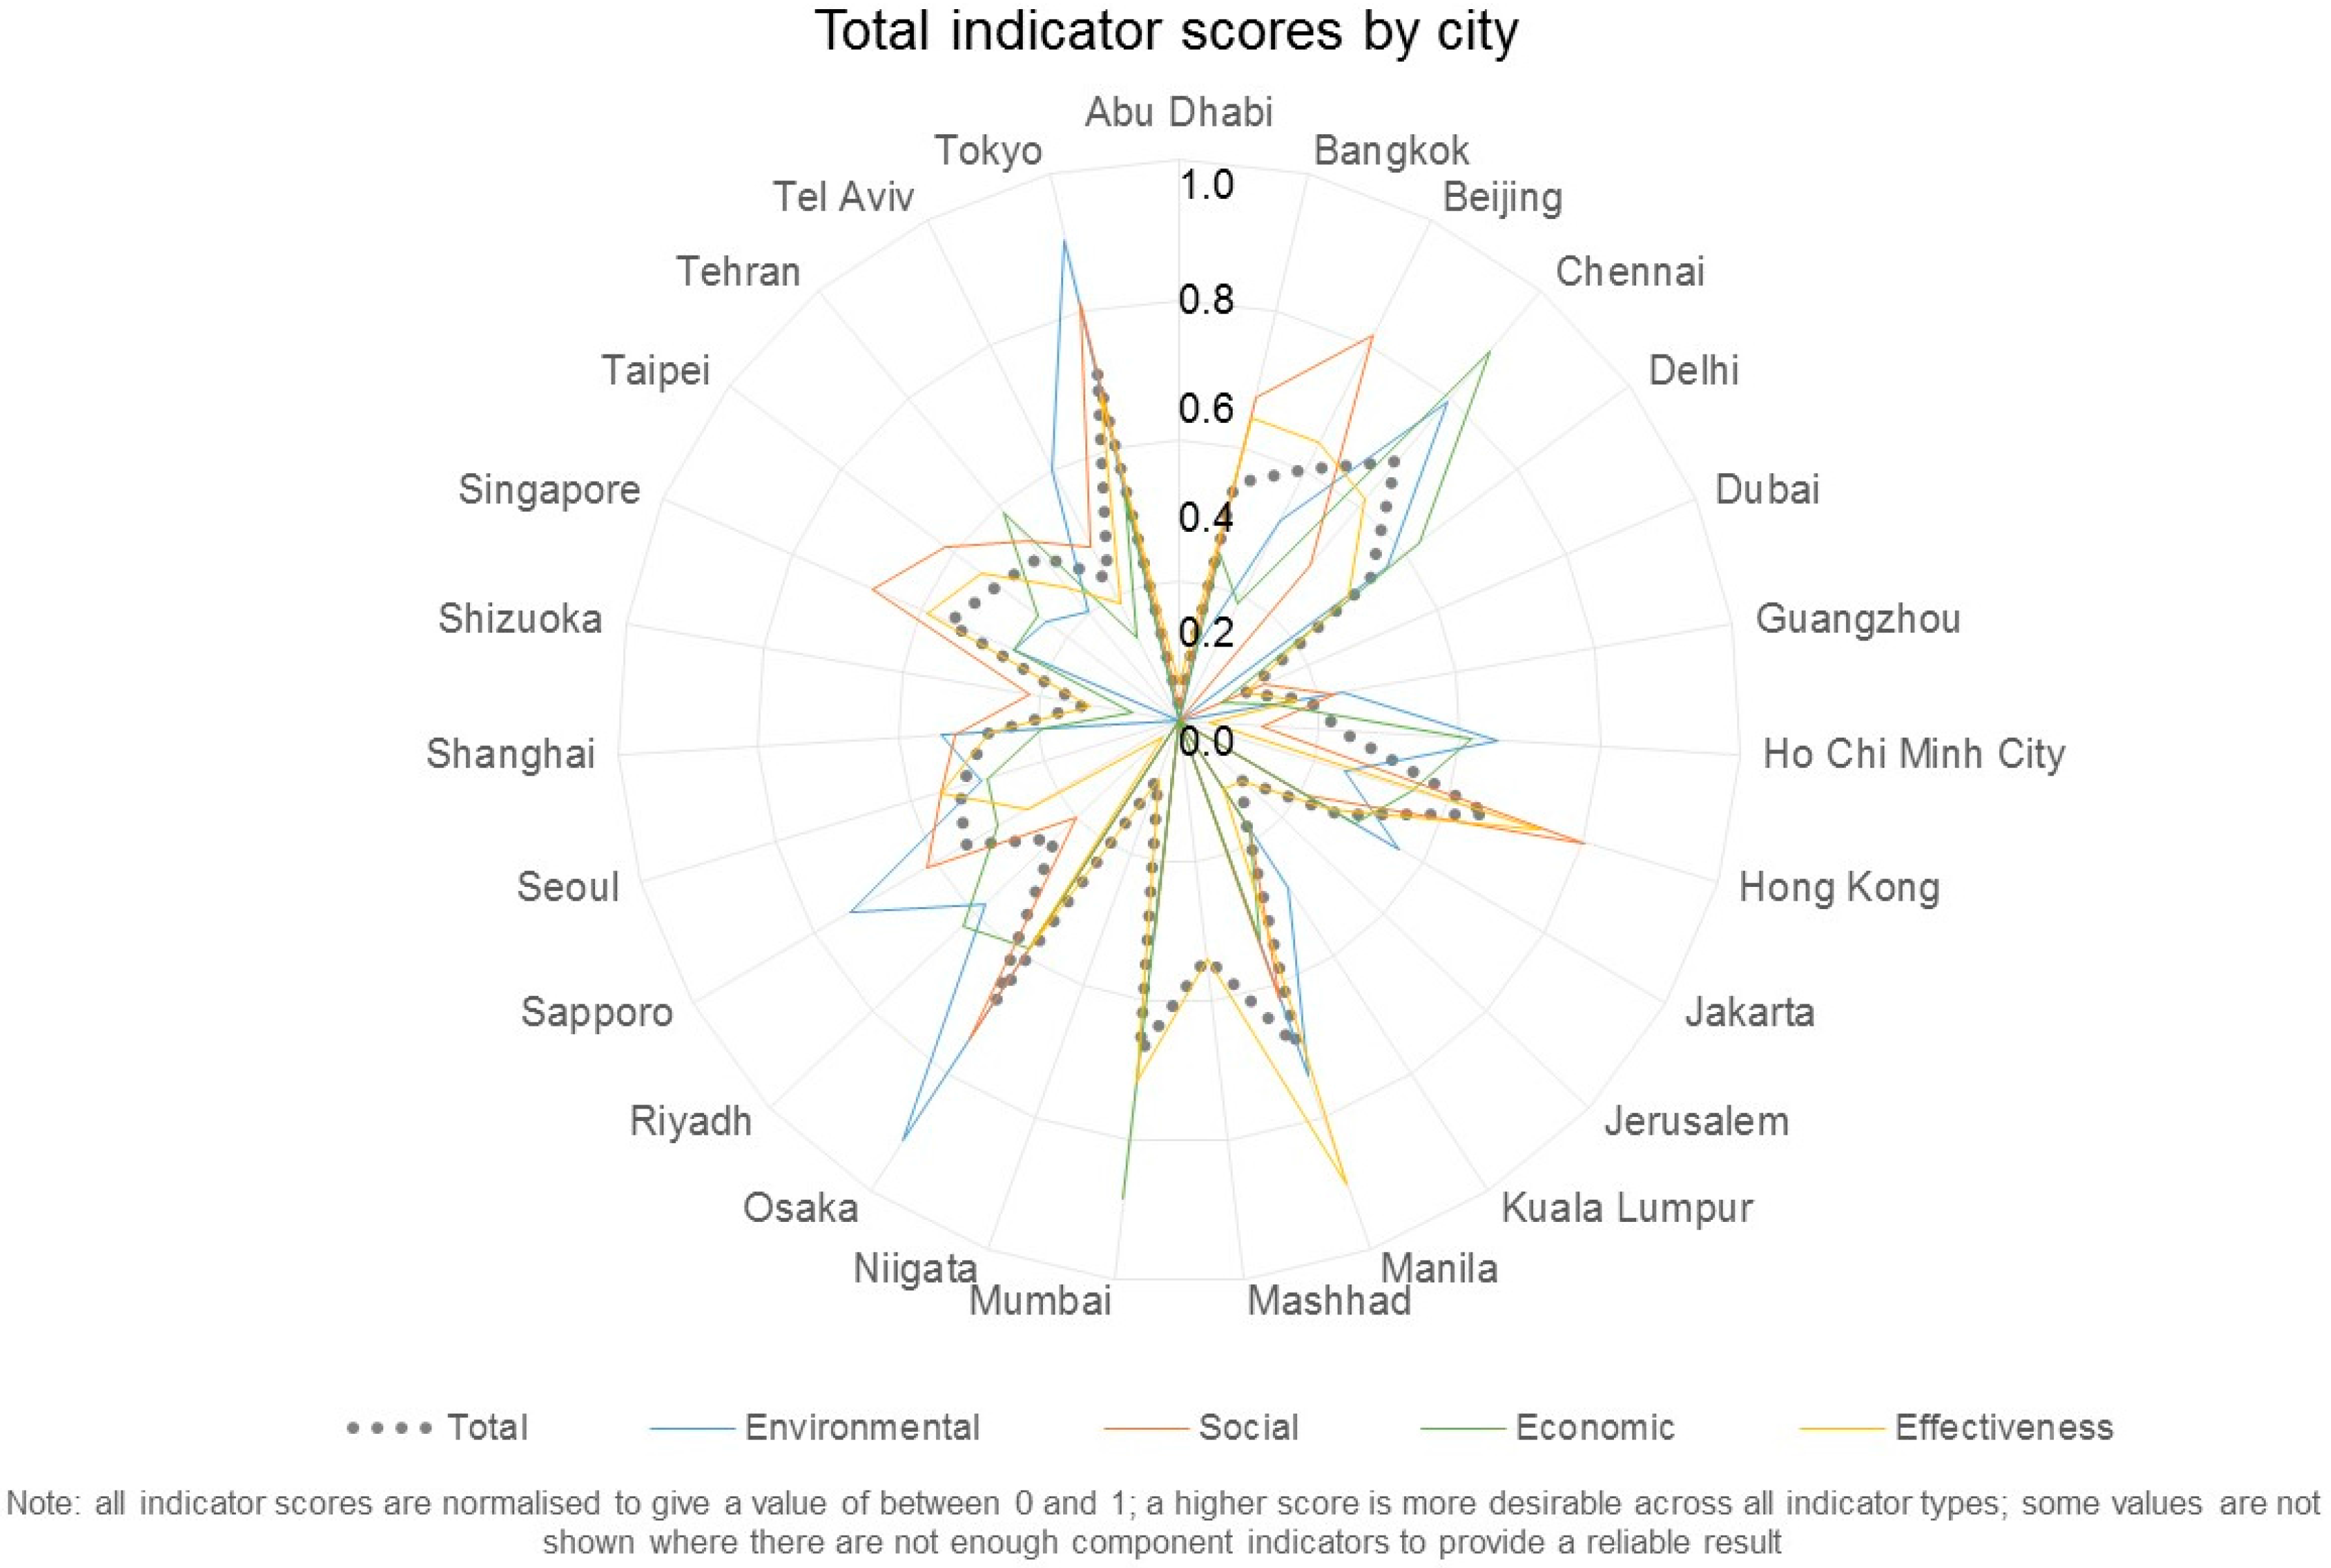
4.2. Selected Asia/Middle East City Analysis
- Out of the 26 cities studied, the top 3 cities in terms of sustainable public transport in the Asia and Middle East regions are: 1st, Manila (Philippines); 2nd, Tokyo (Japan); and 3rd, Chennai (India).
- Manila gets its 1st rating as a result of a 1st rating in system effectiveness (it has the highest mode split and the highest service level of all cities in the region). It also rates 6th, 8th, and 9th for environmental, social, and economic indicators.
- Tokyo rates 2nd for sustainable public transport indicators. It has a 2nd-place ranking for social indicators, a 3rd for environmental, and a 4th for system effectiveness. However, it is let down by its economic indicators, which lies 13th out of 26. The latter appears to be because it has the highest time cost per trip (61 min) of all cities analysed. It has midrange values for all other economic indicators.
- Chennai rates 3rd of the cities studied. It rates 2nd out of 26 cities for economic indicators; it has very high passenger kilometres per GDP, the lowest operating cost, and high cost recovery (134%). It also rated 4th out of 26 for environmental indicators and 9th out of 26 for system effectiveness indicators. Its social indicators were midrange.
- Dubai (United Arab Emirates (UAE), rated 26th), Shizuoka (Japan, rated 25th), and Kuala Lumpur (Malaysia, rated 24th) were the lowest-rated cities.
- Dubai has a low rating (between 21st and 24th) for all indicators. Dubai has the highest amount of land taken up by transit facilities (an amazing 37%; this is a very high number which we have checked against the source UITP database and confirmed this is the value given), low system accessibility, and very low usage.
- Shizuoka has poorer performance in some metrics—such as system effectiveness—than Dubai, but is particularly low-rated in economic indicators (it has one of the lowest values of passenger kilometres traveller per GDP).
- Kuala Lumpur rates 15th out of 26 for environmental indicators, mainly because energy consumption and pollutants are midrange in the cities. Other indicators are at the levels of Dubai and Shizuoka (i.e., very poor).
4.3. Sensitivity Tests
5. Discussion and Conclusions
Acknowledgments
Author Contributions
Conflicts of Interest
Appendix A

| World Region | Cities |
|---|---|
| Western Europe | Amsterdam, Athens, Barcelona, Berlin, Berne, Birmingham, Bologna, Brussels, Copenhagen, Dublin, Dusseldorf, Frankfurt, Geneva, Glasgow, Gothenburg, Graz, Hamburg, Helsinki, Lille, Lisbon, London, Lyon, Madrid, Manchester, Marseille, Milan, Munich, Nantes, Newcastle, Oslo, Paris, Rome, Ruhr, Stockholm, Strasbourg, Stuttgart, Turin, Vienna, Zurich |
| Eastern Europe | Ankara, Budapest, Cracow, Istanbul, Izmir, Kocaeli, Moscow, Prague, Tallinn, Warsaw |
| North America | Atlanta, Calgary, Chicago, Denver, Houston, Los Angeles, Montreal, New York, Ottawa, Phoenix, Portland, San Diego, San Francisco, Toronto, Vancouver, Washington |
| Latin America | Bogota, Brasilia, Buenos Aires, Caracas, Curitiba, Mexico City, Rio de Janeiro, Salvador, Santiago, Sao Paulo |
| Middle East | Abu Dhabi, Dubai, Jerusalem, Mashhad, Riyadh, Tehran, Tel Aviv |
| Africa | Abidjan, Addis Ababa, Cairo, Cape Town, Casablanca, Dakar, Harare, Johannesburg, Lagos, Nairobi, Tshwane, Tunis |
| Asia | Bangkok, Beijing, Chennai, Delhi, Guangzhou, Ho Chi Minh City, Hong Kong, Jakarta, Kuala Lumpur, Manila, Mumbai, Osaka, Sapporo, Seoul, Shanghai, Shizuoka, Singapore, Taipei, Tokyo |
| Oceania | Brisbane, Melbourne, Perth, Sydney, Wellington |
Appendix B. Data Results for the World Region Analysis of Public Transport Sustainability
| ID | Indicator | Units | Western Europe | Eastern Europe | North America | Latin America | Middle East | Africa | Asia | Oceania |
|---|---|---|---|---|---|---|---|---|---|---|
| A | Environmental | |||||||||
| A1 | Quantity of energy consumed | MJ/pkm | 14.67 | 11.77 | 24.86 | 15.41 | 12.20 | 14.48 | 12.59 | 14.88 |
| A3 | Mass of total pollutants emitted (e.g., NOx, VOC, CO2) | kg/ha | 5298 | 4543 | 3905 | 7368 | 15,044 | 6591 | 10,115 | 2749 |
| A5 | Land area consumed by public transport facilities | % of urban area | 18 | 11 | 17 | - | 20 | 17 | 18 | - |
| B | Social | |||||||||
| B1 | System accessibility | pkm/capita | 2134 | 2119 | 763 | 2556 | 815 | 168 | 2615 | 938 |
| B4 | Average user trip distance | km | 10.13 | 7.27 | 11.97 | 11.80 | 9.52 | 20.50 | 11.66 | 16.00 |
| B5 | Affordability | 10−4 per capita GDP/trip | 30.31 | 23.92 | 33.16 | 77.04 | 89.90 | 161.89 | 74.34 | 49.51 |
| B9 | Public transport related deaths | fatalities/billion-pkm | 9.61 | 18.07 | 7.01 | 38.93 | 18.03 | 34.35 | 26.66 | 6.81 |
| C | Economic | |||||||||
| C1 | Annual operating cost | $US/pkm | 0.28 | 0.04 | 0.29 | 0.05 | 0.10 | 0.04 | 0.05 | 0.19 |
| C4 | Cost recovery (proportion of costs recovered) | % of total costs | 59.2 | 58.2 | 41.9 | 115.6 | 108.2 | 95.6 | 122.6 | 52.7 |
| C6 | Passenger km travelled per unit GDP | pkm/$US | 0.05 | 0.06 | 0.01 | 0.13 | 0.06 | 0.01 | 0.13 | 0.02 |
| C8 | Average time per trip | min | 36 | 29 | 52 | 42 | 28 | 45 | 43 | 57 |
| D | System effectiveness | |||||||||
| D1 | Average occupancy rate of passenger vehicles | % of seated capacity | 19.77 | 30.35 | 15.62 | 24.10 | 19.58 | 26.53 | 39.97 | 16.95 |
| D3 | Annual public transport trips per capita | trips/capita | 345 | 319 | 105 | 256 | 106 | 46 | 255 | 94 |
| D4 | Public transport mode split | % of all trips | 23.69 | 21.57 | 8.88 | 41.82 | 10.06 | 25.36 | 28.30 | 6.60 |
| D5 | Public transport fleet size | vehicles/million people | 1313.9 | 1346.1 | 684.6 | 1850.7 | 1030.2 | 328.7 | 1758.4 | 1035.7 |
| E | Other | |||||||||
| E1 | Population of metropolitan area | persons | 2,736,120 | 3,108,727 | 4,040,400 | - | 3,060,600 | 7,398,800 | 13,713,540 | 3,916,667 |
| E2 | Urban population density | persons/ha | 55.7 | 47.2 | 22.3 | 89.7 | 69.7 | 101.7 | 155.0 | 12.8 |
| E3 | Metropolitan Gross Domestic Product (GDP) | $US/capita | 43,576 | 38,081 | 58,685 | 19,773 | 28,410 | 11,893 | 28,907 | 48,586 |
| ID | Indicator | Units | Western Europe | Eastern Europe | North America | Latin America | Middle East | Africa | Asia | Oceania |
|---|---|---|---|---|---|---|---|---|---|---|
| A | Environmental | |||||||||
| A1 | Quantity of energy consumed | MJ/pkm | 0.802 | 1.000 | 0.473 | 0.764 | 0.964 | 0.813 | 0.935 | 0.791 |
| A3 | Mass of total pollutants emitted (e.g., NOx, VOC, CO2) | kg/ha | 0.519 | 0.605 | 0.704 | 0.373 | 0.183 | 0.417 | 0.272 | 1.000 |
| A5 | Land area consumed by public transport facilities | % of urban area | 0.611 | 1.000 | 0.647 | 0.550 | 0.647 | 0.611 | ||
| B | Social | |||||||||
| B1 | System accessibility | pkm/capita | 0.816 | 0.810 | 0.292 | 0.978 | 0.312 | 0.064 | 1.000 | 0.359 |
| B4 | Average user trip distance | km | 0.718 | 1.000 | 0.607 | 0.616 | 0.764 | 0.355 | 0.623 | 0.454 |
| B5 | Affordability | 10−4 per capita GDP/trip | 0.789 | 1.000 | 0.721 | 0.310 | 0.266 | 0.148 | 0.322 | 0.483 |
| B9 | Public transport related deaths | fatalities/billion-pkm | 0.709 | 0.377 | 0.971 | 0.175 | 0.378 | 0.198 | 0.255 | 1.000 |
| C | Economic | |||||||||
| C1 | Annual operating cost | $US/pkm | 0.143 | 1.000 | 0.138 | 0.800 | 0.387 | 1.000 | 0.817 | 0.211 |
| C4 | Cost recovery (proportion of costs recovered) | % of total costs | 0.483 | 0.475 | 0.342 | 0.943 | 0.883 | 0.780 | 1.000 | 0.430 |
| C6 | Passenger km travelled per unit GDP | pkm/$US | 0.379 | 0.430 | 0.101 | 1.000 | 0.441 | 0.109 | 0.970 | 0.149 |
| C8 | Average time per trip | min | 0.783 | 0.972 | 0.542 | 0.671 | 1.000 | 0.627 | 0.655 | 0.495 |
| D | System effectiveness | |||||||||
| D1 | Average occupancy rate of passenger vehicles | % of seated capacity | 0.495 | 0.759 | 0.391 | 0.603 | 0.490 | 0.664 | 1.000 | 0.424 |
| D3 | Annual public transport trips per capita | trips/capita | 1.000 | 0.925 | 0.304 | 0.742 | 0.308 | 0.133 | 0.769 | 0.272 |
| D4 | Public transport mode split | % of all trips | 0.566 | 0.516 | 0.212 | 1.000 | 0.241 | 0.606 | 0.705 | 0.158 |
| D5 | Public transport fleet size | vehicles/million people | 0.710 | 0.727 | 0.370 | 1.000 | 0.557 | 0.178 | 0.950 | 0.560 |
| ID | Indicator category | |||||||||
| A | Environmental | 0.644 | 0.868 | 0.608 | 0.568 | 0.566 | 0.626 | 0.606 | 0.895 | |
| B | Social | 0.758 | 0.797 | 0.648 | 0.520 | 0.430 | 0.191 | 0.550 | 0.574 | |
| C | Economic | 0.447 | 0.719 | 0.281 | 0.854 | 0.678 | 0.629 | 0.861 | 0.321 | |
| D | System effectiveness | 0.693 | 0.732 | 0.319 | 0.836 | 0.399 | 0.395 | 0.856 | 0.353 | |
| Total | 0.635 | 0.773 | 0.454 | 0.713 | 0.515 | 0.449 | 0.726 | 0.485 |
Appendix C. Data Results for the City Analysis of Public Transport Sustainability
| ID | Abu Dhabi | Bangkok | Beijing | Chennai | Delhi | Dubai | Guangzhou | Ho Chi Minh City | Hong Kong | Jakarta | Jerusalem | Kuala Lumpur | Manila |
| A | |||||||||||||
| A1 | - | 32.19 | 9.91 | 9.94 | - | - | 13.19 | 5.72 | 16.12 | 7.78 | - | 12.75 | 4.87 |
| A3 | - | 21,515 | 9919 | 2084 | 3933 | - | 14,137 | 24,231 | 7602 | 14,558 | - | 7889 | 19,477 |
| A5 | 5 | - | 10 | - | - | 37 | - | - | - | - | 18 | - | - |
| B | |||||||||||||
| B1 | 128 | 2,799 | 2692 | 3025 | - | 789 | 1127 | 101 | 4606 | 1,389 | - | 726 | 1417 |
| B4 | 4.60 | 6.89 | 10.85 | 15.69 | 16.90 | - | 9.46 | 9.73 | 12.30 | 8.17 | 5.90 | 10.13 | 3.22 |
| B5 | - | 20.43 | 15.12 | 201.17 | - | - | 57.62 | 287.19 | 29.17 | 109.17 | - | 92.29 | 85.06 |
| B9 | - | 24.15 | 7.49 | 14.29 | - | - | 51.90 | 79.03 | 7.64 | 73.19 | - | 42.05 | 19.30 |
| C | |||||||||||||
| C1 | - | 0.02 | 0.01 | 0.00 | - | - | 0.06 | 0.01 | 0.08 | 0.02 | - | 0.06 | 0.02 |
| C4 | - | 90.0 | 21.8 | 134.2 | - | - | 26.2 | 317.1 | 136.2 | 118.3 | - | 83.7 | 219.8 |
| C6 | 0.00 | 0.14 | 0.12 | 0.47 | - | 0.03 | 0.04 | 0.01 | 0.08 | 0.14 | - | 0.03 | 0.10 |
| C8 | 17 | 49 | 51 | 50 | 40 | - | 47 | 31 | 43 | 39 | 24 | 43 | 45 |
| D | |||||||||||||
| D1 | - | 25.21 | 75.94 | 71.19 | - | - | 23.55 | 9.72 | 25.21 | 13.19 | - | 22.92 | 3.37 |
| D3 | 30 | 402 | 352 | 193 | 135 | 83 | 120 | 11 | 564 | 172 | - | 73 | 438 |
| D4 | 4.90 | 42.72 | 27.85 | 42.28 | 21.50 | 10.90 | 14.20 | 1.67 | 52.20 | 25.50 | 15.30 | 7.23 | 59.04 |
| D5 | - | 1,890.4 | 1248.3 | 539.8 | 443.9 | 790.2 | 736.9 | 671.8 | 1950.3 | 2044.6 | 1637.2 | 428.5 | 13,375.4 |
| E | |||||||||||||
| E1 | 913,000 | - | 20,693,000 | - | 16,753,000 | 2,003,000 | - | - | 7,071,000 | - | 1,130,000 | - | - |
| E2 | 5.3 | 138.7 | 164.0 | 133.2 | 238.7 | 19.6 | 119.0 | 355.7 | 255.2 | 173.4 | 88.3 | 57.9 | 206.4 |
| E3 | 61,009 | 19,705 | 23,390 | 6469 | 12,747 | 24,866 | 29,014 | 8660 | 57,244 | 9984 | 32,819 | 28,076 | 14,222 |
| ID | Mashhad | Mumbai | Osaka | Riyadh | Sapporo | Seoul | Shanghai | Shizuoka | Singapore | Taipei | Tehran | Tel Aviv | Tokyo |
| A | |||||||||||||
| A1 | - | 9.90 | 11.38 | 7.24 | 19.14 | 12.30 | 8.78 | - | 15.67 | 12.99 | 14.01 | 15.36 | 11.35 |
| A3 | - | 10,750 | 1454 | 16,664 | 1757 | 7541 | 11,703 | - | 7172 | 14,864 | 25,468 | 3001 | 1484 |
| A5 | - | - | - | - | - | 29 | - | - | 16 | 17 | - | - | - |
| B | |||||||||||||
| B1 | - | 3,312 | 6011 | 107 | 1789 | 2781 | 1872 | 1303 | 2659 | 3772 | 1648 | 1402 | 5684 |
| B4 | - | 17.08 | 21.02 | 10.35 | 9.20 | 7.60 | 10.77 | - | 10.00 | 9.28 | 12.90 | 13.84 | 21.60 |
| B5 | - | 64.15 | 71.01 | 130.85 | 56.19 | 41.30 | 30.62 | - | 24.25 | 30.95 | 43.54 | 95.32 | 48.05 |
| B9 | - | 23.71 | 6.69 | 15.22 | 7.20 | 23.05 | 30.62 | - | 10.01 | 27.61 | 27.97 | 10.89 | 5.37 |
| C | |||||||||||||
| C1 | - | 0.00 | 0.08 | 0.04 | 0.24 | 0.05 | 0.01 | - | 0.06 | 0.04 | 0.02 | 0.25 | 0.07 |
| C4 | - | 84.5 | 172.6 | 209.6 | 94.1 | 86.3 | 74.3 | - | 113.8 | 135.0 | 74.2 | 40.8 | 175.8 |
| C6 | - | 0.47 | 0.17 | 0.00 | 0.06 | 0.08 | 0.08 | 0.03 | 0.04 | 0.08 | 0.21 | 0.03 | 0.13 |
| C8 | - | 36 | 27 | 17 | 22 | 36 | 60 | - | 50 | 45 | 32 | 51 | 61 |
| D | |||||||||||||
| D1 | - | 129.27 | 56.77 | 6.35 | 30.23 | 25.94 | 60.10 | - | 28.59 | 20.02 | 24.16 | 28.22 | 58.29 |
| D3 | 191 | 194 | 285 | 10 | 192 | 307 | 175 | 73 | 422 | 458 | 221 | 102 | 477 |
| D4 | - | 45.00 | 32.13 | 1.27 | 20.48 | 36.90 | 15.10 | 7.70 | 44.00 | 32.00 | 12.70 | 15.31 | 33.00 |
| D5 | - | 349.7 | 951.1 | 466.3 | 1018.5 | 1122.3 | 738.0 | - | 868.6 | 1904.4 | 1088.7 | 1168.4 | 1368.9 |
| E | |||||||||||||
| E1 | 2,857,000 | 20,748,395 | - | - | - | 24,734,000 | - | 1,101,000 | 5,312,000 | 2,673,000 | 8,400,000 | - | 37,239,000 |
| E2 | 122.6 | 337.4 | 98.1 | 44.0 | 72.1 | 125.5 | 196.3 | 17.8 | 104.6 | 205.7 | 136.0 | 72.3 | 87.7 |
| E3 | 7711 | 7005 | 35,902 | 22,139 | 32,446 | 34,355 | 24,065 | 41,472 | 66,864 | 46,102 | 7711 | 42,614 | 43,664 |
| ID | Abu Dhabi | Bangkok | Beijing | Chennai | Delhi | Dubai | Guangzhou | Ho Chi Minh City | Hong Kong | Jakarta | Jerusalem | Kuala Lumpur | Manila |
| A | |||||||||||||
| A1 | 0.151 | 0.491 | 0.490 | 0.369 | 0.851 | 0.302 | 0.626 | 0.382 | 1.000 | ||||
| A3 | 0.068 | 0.147 | 0.698 | 0.370 | 0.103 | 0.060 | 0.191 | 0.100 | 0.184 | 0.075 | |||
| A5 | 1.000 | 0.500 | 0.135 | 0.278 | |||||||||
| B | |||||||||||||
| B1 | 0.021 | 0.466 | 0.448 | 0.503 | 0.131 | 0.188 | 0.017 | 0.766 | 0.231 | 0.121 | 0.236 | ||
| B4 | 0.700 | 0.467 | 0.297 | 0.205 | 0.191 | 0.340 | 0.331 | 0.262 | 0.394 | 0.546 | 0.318 | 1.000 | |
| B5 | 0.740 | 1.000 | 0.075 | 0.262 | 0.053 | 0.518 | 0.138 | 0.164 | 0.178 | ||||
| B9 | 0.222 | 0.717 | 0.376 | 0.103 | 0.068 | 0.703 | 0.073 | 0.128 | 0.278 | ||||
| C | |||||||||||||
| C1 | 0.050 | 0.100 | 1.000 | 0.017 | 0.100 | 0.013 | 0.050 | 0.017 | 0.050 | ||||
| C4 | 0.284 | 0.069 | 0.423 | 0.083 | 1.000 | 0.430 | 0.373 | 0.264 | 0.693 | ||||
| C6 | 0.004 | 0.300 | 0.243 | 0.989 | 0.067 | 0.082 | 0.025 | 0.170 | 0.294 | 0.055 | 0.211 | ||
| C8 | 1.000 | 0.347 | 0.333 | 0.340 | 0.425 | 0.362 | 0.548 | 0.395 | 0.436 | 0.708 | 0.395 | 0.378 | |
| D | |||||||||||||
| D1 | 0.195 | 0.587 | 0.551 | 0.182 | 0.075 | 0.195 | 0.102 | 0.177 | 0.026 | ||||
| D3 | 0.053 | 0.713 | 0.624 | 0.342 | 0.239 | 0.147 | 0.213 | 0.020 | 1.000 | 0.305 | 0.129 | 0.777 | |
| D4 | 0.083 | 0.724 | 0.472 | 0.716 | 0.364 | 0.185 | 0.241 | 0.028 | 0.884 | 0.432 | 0.259 | 0.122 | 1.000 |
| D5 | 0.141 | 0.093 | 0.040 | 0.033 | 0.059 | 0.055 | 0.050 | 0.146 | 0.153 | 0.122 | 0.032 | 1.000 | |
| ID | |||||||||||||
| A | 1.000 | 0.109 | 0.379 | 0.594 | 0.370 | 0.135 | 0.236 | 0.456 | 0.247 | 0.363 | 0.278 | 0.283 | 0.537 |
| B | 0.361 | 0.474 | 0.615 | 0.290 | 0.191 | 0.131 | 0.223 | 0.117 | 0.562 | 0.209 | 0.546 | 0.183 | 0.423 |
| C | 0.502 | 0.245 | 0.186 | 0.688 | 0.425 | 0.067 | 0.136 | 0.418 | 0.252 | 0.288 | 0.708 | 0.183 | 0.333 |
| D | 0.068 | 0.443 | 0.444 | 0.412 | 0.212 | 0.130 | 0.173 | 0.043 | 0.556 | 0.248 | 0.191 | 0.115 | 0.701 |
| Total | 0.409 | 0.348 | 0.408 | 0.482 | 0.270 | 0.121 | 0.186 | 0.230 | 0.427 | 0.265 | 0.383 | 0.178 | 0.493 |
| ID | Mashhad | Mumbai | Osaka | Riyadh | Sapporo | Seoul | Shanghai | Shizuoka | Singapore | Taipei | Tehran | Tel Aviv | Tokyo |
| A | |||||||||||||
| A1 | 0.492 | 0.428 | 0.673 | 0.254 | 0.396 | 0.555 | 0.311 | 0.375 | 0.348 | 0.317 | 0.429 | ||
| A3 | 0.135 | 1.000 | 0.087 | 0.828 | 0.193 | 0.124 | 0.203 | 0.098 | 0.057 | 0.485 | 0.980 | ||
| A5 | 0.172 | 0.313 | 0.294 | ||||||||||
| B | |||||||||||||
| B1 | 0.551 | 1.000 | 0.018 | 0.298 | 0.463 | 0.311 | 0.217 | 0.442 | 0.628 | 0.274 | 0.233 | 0.946 | |
| B4 | 0.189 | 0.153 | 0.311 | 0.350 | 0.424 | 0.299 | 0.322 | 0.347 | 0.250 | 0.233 | 0.149 | ||
| B5 | 0.236 | 0.213 | 0.116 | 0.269 | 0.366 | 0.494 | 0.624 | 0.489 | 0.347 | 0.159 | 0.315 | ||
| B9 | 0.226 | 0.803 | 0.353 | 0.746 | 0.233 | 0.175 | 0.536 | 0.194 | 0.192 | 0.493 | 1.000 | ||
| C | |||||||||||||
| C1 | 1.000 | 0.013 | 0.025 | 0.004 | 0.020 | 0.100 | 0.017 | 0.025 | 0.050 | 0.004 | 0.014 | ||
| C4 | 0.266 | 0.544 | 0.661 | 0.297 | 0.272 | 0.234 | 0.359 | 0.426 | 0.234 | 0.129 | 0.554 | ||
| C6 | 1.000 | 0.354 | 0.010 | 0.117 | 0.171 | 0.165 | 0.066 | 0.084 | 0.173 | 0.452 | 0.070 | 0.275 | |
| C8 | 0.472 | 0.630 | 1.000 | 0.773 | 0.472 | 0.283 | 0.340 | 0.378 | 0.531 | 0.333 | 0.279 | ||
| D | |||||||||||||
| D1 | 1.000 | 0.439 | 0.049 | 0.234 | 0.201 | 0.465 | 0.221 | 0.155 | 0.187 | 0.218 | 0.451 | ||
| D3 | 0.339 | 0.344 | 0.505 | 0.018 | 0.340 | 0.544 | 0.310 | 0.129 | 0.748 | 0.812 | 0.392 | 0.181 | 0.846 |
| D4 | 0.762 | 0.544 | 0.022 | 0.347 | 0.625 | 0.256 | 0.130 | 0.745 | 0.542 | 0.215 | 0.259 | 0.559 | |
| D5 | 0.026 | 0.071 | 0.035 | 0.076 | 0.084 | 0.055 | 0.065 | 0.142 | 0.081 | 0.087 | 0.102 | ||
| ID | |||||||||||||
| A | 0.314 | 0.714 | 0.380 | 0.541 | 0.254 | 0.339 | 0.275 | 0.256 | 0.202 | 0.401 | 0.705 | ||
| B | 0.300 | 0.542 | 0.199 | 0.416 | 0.371 | 0.320 | 0.217 | 0.481 | 0.414 | 0.266 | 0.279 | 0.602 | |
| C | 0.685 | 0.385 | 0.424 | 0.298 | 0.234 | 0.196 | 0.066 | 0.200 | 0.250 | 0.317 | 0.134 | 0.281 | |
| D | 0.339 | 0.533 | 0.390 | 0.031 | 0.249 | 0.363 | 0.272 | 0.130 | 0.445 | 0.413 | 0.219 | 0.186 | 0.489 |
| Total | 0.339 | 0.479 | 0.478 | 0.241 | 0.352 | 0.309 | 0.273 | 0.136 | 0.355 | 0.338 | 0.258 | 0.229 | 0.493 |
References
- United Nations. Transforming our World: The 2030 Agenda for Sustainable Development; Department of Economic and Social Affairs, United Nations: New York, NY, USA, 2015. [Google Scholar]
- Brundtland Commission. Our Common Future; World Commission on Environment and Development, Ed.; Oxford University Press: London, UK, 1987. [Google Scholar]
- Rockström, J.; Steffen, W.; Noone, K.; Persson, A.; Chapin, F.; Lambin, E.; Lenton, T.; Scheffer, M.; Folke, C.; Schellnhuber, H.; et al. A safe operating space for humanity. Nature 2009, 461, 472–475. [Google Scholar] [CrossRef] [PubMed]
- Griggs, D.; Stafford-Smith, M.; Gaffney, O.; Rockström, J.; Öhman, M.; Shyamsundar, P.; Steffen, W.; Glaser, G.; Kanie, N.; Noble, I. Sustainable development goals for people and planet. Nature 2013, 495, 305–307. [Google Scholar] [CrossRef] [PubMed]
- Loo, B.P.Y.; Banister, D. Decoupling transport from economic growth: Extending the debate to include environmental and social externalities. J. Transp. Geogr. 2016, 57, 134–144. [Google Scholar] [CrossRef]
- Currie, G. New Perspectives and Methods in Transport and Social Exclusion Research; Emerald Group Publishing Limited: Bingley, UK, 2011. [Google Scholar]
- Haghshenas, H.; Vaziri, M. Urban sustainable transportation indicators for global comparison. Ecol. Indic. 2012, 15, 115–121. [Google Scholar] [CrossRef]
- Litman, T. Sustainable Transportation Indicators: A Recommended Research Program for Developing Sustainable Transportation Indicators and Data. In Proceedings of the 88th Transportation Research Board (TRB) Annual Meeting, Washington, DC, USA, 1–15 January 2009.
- Jeon, C.M.; Amekudzi, A.; Guensler, R.L. Evaluating Plan Alternatives for Transportation System Sustainability: Altanta Metropolitan Region. Int. J. Sustain. Transp. 2010, 4, 227–247. [Google Scholar] [CrossRef]
- Barford, M.B.; Salling, K.B. A new composite decision support framework for strategic and sustainable transport appraisals. Transp. Res. Part A 2015, 72, 1–15. [Google Scholar] [Green Version]
- Castillo, H.; Pitfield, D. ELASTIC—A methodological framework for identifying and selecting sustainable transport indicators. Transp. Res. Part D 2010, 15, 179–188. [Google Scholar] [CrossRef] [Green Version]
- Jeon, C.M. Incorporating Sustainability into Transportation Planning and Decision Making: Definitions, Performance Measures, and Evaluation, in School of Civil and Environmental Engineering. Ph.D. Thesis, Georgia Institute of Technology, Atlanta, GA, USA, 2007. [Google Scholar]
- Dobranskyte-Niskota, A.; Perujo, A.; Pregl, A. Indicators to Assess Sustainability of Transport Activities, Part 1: Review of the Existing Transport Sustainability Indicators Initiatives and Development of an Indicator Set to Assess Transport Sustainability Performance; European Commission—DG Joint Research Centre Institute for Environment and Sustainability: Ispra, Italy, 2007. [Google Scholar]
- Dobranskyte-Niskota, A.; Perujo, A.; Pregl, A. Indicators to Assess Sustainability of Transport Activities, Part 2: Measurement and Evaluation of Transport Sustainability Performance in the EU27; European Commission—DG Joint Research Centre Institute for Environment and Sustainability: Ispra, Italy, 2009. [Google Scholar]
- Litman, T. Developing Indicators for Comprehensive and Sustainable Transport Planning; Victoria Transport Policy Institute (VTPI): Victoria, BC, Canada, 2011. [Google Scholar]
- Miller, P.; de Barros, A.G.; Kattan, L.; Wirasinghe, S.C. Analyzing the sustainability performance of public transit. Transp. Res. Part D 2016, 44, 177–198. [Google Scholar] [CrossRef]
- Miller, P. Sustainability and Public Transportation: Theory and Analysis; Department of Civil Engineering, University of Calgary: Calgary, AB, Canada, 2014. [Google Scholar]
- World Council on City Data (WCCD). World Council on City Data Open Data Portal; World Council on City Data: Toronto, ON, Canada, 2016. [Google Scholar]
- The World Bank. World DataBank; The World Bank: Washington, DC, USA, 2016. [Google Scholar]
- Organisation for Economic Co-Operation and Development (OECD). OECD.Stat; Organisation for Economic Co-operation and Development: Paris, France, 2016. [Google Scholar]
- Union Internationale des Transports Publies (UITP). Millenium Cities Database for Sustainable Mobility; International Association of Public Transport: Brussels, Belgique, 2001. [Google Scholar]
- Union Internationale des Transports Publies (UITP). Mobility in Cities Database 2015; International Association of Public Transport: Brussels, Belgique, 2015. [Google Scholar]
- The Brookings Institution. Global Metro Monitor 2014: An Uncertain Recovery; The Brookings Institution: Washington, DC, USA, 2016. [Google Scholar]
- Currie, G.; Delbosc, A. Variation in Perceptions of Urban Public Transport Performance between International Cities Using Spiral Plot Analysis. Transp. Res. Record J. Transp. Res. Board 2015, 2538, 54–64. [Google Scholar] [CrossRef]


| ID | Indicator | Units |
|---|---|---|
| A | ENVIRONMENTAL | |
| A1 | Quantity of energy consumed | MJ/pkm |
| A2 | Quantity of fuel consumed | L/pkm |
| A3 | Mass of pollutants emitted (e.g., NOx, VOC, CO2) | kg |
| A4 | Noise | dB |
| A5 | Land area consumed by public transport facilities | m2 |
| A6 | Ecological impacts of right of way | m |
| A7 | Mass of CO2 equivalents of pollutants emitted | kg |
| B | SOCIAL | |
| B1 | System accessibility | pkm/capita |
| B2 | Cumulative opportunity (jobs/activity centres linked by public transport) | jobs/activity centres |
| B3 | Public transport access | % |
| B4 | Average user trip distance | km |
| B5 | Affordability | fare/income per capita |
| B6 | User accessibility (% stations/vehicles accessible to all users) | % |
| B7 | Population exposed to public transport emissions | people |
| B8 | Disease burden related to public transport | deaths |
| B9 | Public transport related deaths | fatalities/pkm |
| B10 | Public transport related accidents | accidents/pkm |
| C | ECONOMIC | |
| C1 | Annual operating cost | $/pkm |
| C2 | System wide capital costs | $ |
| C3 | Individual route capital costs | $ |
| C4 | Cost recovery (% costs recovered) | % |
| C5 | Cost subsidies (% costs subsidised) | % |
| C6 | Passenger km travelled per unit GDP | pkm/$ |
| C7 | Average financial cost per trip | $ |
| C8 | Average time cost per trip | min |
| D | SYSTEM EFFECTIVENESS | |
| D1 | Average occupancy rate of passenger vehicles | % |
| D2 | Reliability | % on time |
| D3 | Annual trips per capita | trips/capita |
| D4 | Mode split | % |
| Asia | Middle East |
|---|---|
| Bangkok, Thailand | Abu Dhabi, United Arab Emirates Dubai, United Arab Emirates Jerusalem, Israel Mashhad, Iran Riyadh, Saudi Arabia Tehran, Iran Tel Aviv, Israel |
| Beijing, China | |
| Chennai, India | |
| Delhi, India | |
| Guangzhou, China | |
| Ho Chi Minh City, Vietnam | |
| Hong Kong | |
| Jakarta, Indonesia | |
| Kuala Lumpur, Malaysia | |
| Manila, Philippines | |
| Mumbai, India | |
| Osaka, Japan | |
| Sapporo, Japan | |
| Seoul, South Korea | |
| Shanghai, China | |
| Shizuoka, Japan | |
| Singapore | |
| Taipei, Taiwan | |
| Tokyo, Japan |
| ID | Indicator | Units | Desirability |
|---|---|---|---|
| A | ENVIRONMENTAL | ||
| A1 | Quantity of energy consumed | MJ/pkm | Lower is desirable |
| A3 | Mass of total pollutants emitted (e.g., NOx, VOC, CO2) | kg/ha | Lower is desirable |
| A5 | Land area consumed by public transport facilities | % of urban area | Lower is desirable |
| B | SOCIAL | ||
| B1 | System accessibility | pkm/capita | Higher is desirable |
| B4 | Average user trip distance | km | Lower is desirable |
| B5 | Affordability | 10−4 per capita GDP/trip | Lower is desirable |
| B9 | Public transport related deaths | fatalities/billion-pkm | Lower is desirable |
| C | ECONOMIC | ||
| C1 | Annual operating cost | $US/pkm | Lower is desirable |
| C4 | Cost recovery (proportion of costs recovered) | % of total costs | Higher is desirable |
| C6 | Passenger km travelled per unit GDP | pkm/$US | Higher is desirable |
| C8 | Average time per trip | min | Lower is desirable |
| D | SYSTEM EFFECTIVENESS | ||
| D1 | Average occupancy rate of passenger vehicles | % of seated capacity | Higher is desirable |
| D3 | Annual public transport trips per capita | trips/capita | Higher is desirable |
| D4 | Public transport mode split | % of all trips | Higher is desirable |
| D5 | Public transport fleet size | vehicles/million people | Higher is desirable |
| Base Results | Environmental Importance × 2 | Social Importance × 2 | Economic Importance × 2 | System Effectiveness Importance × 2 |
|---|---|---|---|---|
| WORLD REGIONS: HIGHEST TO LOWEST PERFORMANCE | ||||
| Eastern Europe | Eastern Europe | Eastern Europe | Eastern Europe | Eastern Europe |
| Asia | Asia | Asia | Asia | Asia |
| Latin America | Latin America | Latin America | Latin America | Latin America |
| Western Europe | Western Europe | Western Europe | Western Europe | Western Europe |
| Middle East | Middle East | Oceania | Middle East | Middle East |
| Oceania | Oceania | Middle East | Africa | Oceania |
| North America | North America | North America | Oceania | Africa |
| Africa | Africa | Africa | North America | North America |
| ASIA AND MIDDLE EAST: TOP THREE CITIES | ||||
| Manila | Tokyo | Tokyo | Chennai | Manila |
| Tokyo | Osaka | Osaka | Mumbai | Tokyo |
| Chennai | Manila | Manila | Osaka | Mumbai |
| ASIA AND MIDDLE EAST: LOWEST THREE CITIES | ||||
| Kuala Lumpur | Kuala Lumpur | Kuala Lumpur | Guangzhou | Kuala Lumpur |
| Shizuoka | Dubai | Shizuoka | Shizuoka | Shizuoka |
| Dubai | Shizuoka | Dubai | Dubai | Dubai |
© 2016 by the authors; licensee MDPI, Basel, Switzerland. This article is an open access article distributed under the terms and conditions of the Creative Commons Attribution (CC-BY) license (http://creativecommons.org/licenses/by/4.0/).
Share and Cite
De Gruyter, C.; Currie, G.; Rose, G. Sustainability Measures of Urban Public Transport in Cities: A World Review and Focus on the Asia/Middle East Region. Sustainability 2017, 9, 43. https://doi.org/10.3390/su9010043
De Gruyter C, Currie G, Rose G. Sustainability Measures of Urban Public Transport in Cities: A World Review and Focus on the Asia/Middle East Region. Sustainability. 2017; 9(1):43. https://doi.org/10.3390/su9010043
Chicago/Turabian StyleDe Gruyter, Chris, Graham Currie, and Geoff Rose. 2017. "Sustainability Measures of Urban Public Transport in Cities: A World Review and Focus on the Asia/Middle East Region" Sustainability 9, no. 1: 43. https://doi.org/10.3390/su9010043