
Two-Stage DEA Analysis of Water Resource Use Efficiency

Centre for Agricultural Water Research in China, China Agricultural University, Tsinghuadong Street No. 17, Beijing 10083, China
*
Author to whom correspondence should be addressed.
Sustainability 2017, 9(1), 52; https://doi.org/10.3390/su9010052
Submission received: 23 September 2016
/
Revised: 17 December 2016
/
Accepted: 22 December 2016
/
Published: 30 December 2016
Abstract
:This paper presents an extended two-stage data envelopment analysis (DEA) method for analyzing water resource use efficiency (WRUE) and related WRUE issues, which was developed by introducing regional water resource metabolic theory into the two-stage DEA method. It has the following advantages: (1) it has the ability to reflect the inner difference and connection of the regional water resource consumption process, which developed the corresponding physical model instead of making it a “black box”; (2) the built physical model for WRUE divided the main body of water resource consumption into social and economic subsystems, which can thus elaborate WRUE; (3) it can analyze not only WRUE but also related WRUE issues. The proposed method was applied to a real-case study in Gansu Province, China. Results show that decision makers can determine the comprehensive and accurate WRUE and negative factors of WRUE in Gansu Province. Moreover, the results offer recommendations for decision makers to plan for efficient use of water resources in different cities.
1. Introduction
Water is essential for human life, socioeconomic activity and environmental development. The World Water Development Report (2013) and Risk Report (World Economic Form 2014) describe that the freshwater crisis has become increasingly serious due to climate change and rapid population growth [1,2]. The shortage of water resources has become a worldwide problem and is particularly prominent in arid and semiarid areas [3,4,5]. Gansu Province is located in northwestern China, and is one of China’s most affected provinces regarding the lack of freshwater. Moreover, the water use problems in Gansu Province further aggravate the shortage of freshwater. For example, the industrial water reuse rate is only 37% and irrigated water amount per mu (an area unit widely used in China) is 562 m3 while the national levels are 45% and 128 m3, respectively [6]. A very important issue is how to coordinate socioeconomic development and reasonable water resource utilization under these limited water resource conditions. It is widely accepted that the fundamental way to solve these problems is to improve water resource use efficiency (WRUE). Hence, this paper aims to analyze WRUE by utilizing the data from a real-world case study in Gansu Province, China.
In the past, many studies have focused on improving the WRUE by optimization allocation of water resources. However, they merely aimed at maximizing the economic benefit or minimizing the cost of the studied system [7,8,9,10,11,12]. Moreover, they exclusively focused on the input-output ratio of a specific aspect (e.g., agricultural or industry) in water resources [13,14,15,16,17]. In reality, the allocation and consumption of water resources involves many aspects of a socioeconomic system, which has characteristics of multi-input, multi-output, and multi-decision. In contrast, data envelopment analysis (DEA) has obvious advantages in dealing with multi-input and multi-output problems.
DEA is an efficient evaluation method proposed by American operations researchers Charnes et al. [18] and has been used in water resource management issues in recent years. For instance, Alsharif et al. used the DEA method to assess the relative efficiencies of water supply systems and to establish benchmarks with which to measure progress in the management of water resources [19]. Romano and Guerrini compared 43 water utility companies in Italy using DEA and concluded that the size and geographical location of a company have significant influence on its operation [20]. An empirical estimation of stochastic DEA was built to analyze the efficiency of irrigation use in agricultural production systems, concluding that water demand is higher for farms at, or close to the frontier (the highest efficiency level) and lower for those with low efficiency levels [21]. Azad et al. used DEA to evaluate the economic efficiency of irrigated agricultural enterprises, and results showed that overall efficiency for the considered irrigated enterprises was quite high [22].
From the aforementioned studies, it is observed that DEA provides great advantages in analyzing the efficiency of the whole water use process over other methods. However, the traditional DEA method has been severely limited because the WRUE has only been examined when dealing with the whole water resource system. Furthermore, the WRUE’s effect on the development of socioeconomic systems has been neglected. In other words, WRUE has a direct relationship with the process of water resource consumption, and has a profound influence on the development of the socioeconomic system. For example, WRUE affects not only the total GDP in the study area, but also the growth rate of GDP (i.e., the development scale of the socioeconomic system). The two-stage DEA method has advantages when compared with the DEA method. The two-stage DEA method can obtain more reliable and detailed performance information by dividing the entire process into several sub-processes or sub-stages, while the DEA only has the ability to measure the efficiency of a specific stage. In addition, the two-stage DEA method can represent the inner connection and difference of the DMUs (decision-making unit), whereas the DEA method regards DMUs as black boxes. Therefore, this paper has selected the two-stage DEA model to comprehensively analyze the WRUE.
In addition, an important process that cannot be ignored is that the main consumption body of the water resources/socioeconomic system should be divided into a social and an economic subsystem. The chief characteristic of the former system is that it sustains residents’ life. Its WRUE strongly depends on urbanization degree, population structure and living habits. The characteristic of the latter is that it carries the economic development of the study area. Its WRUE is mainly related to industrial structure and productivity levels. Moreover, the two subsystems have a mutual effect. For instance, an industrial structure in the economic subsystem has influence over urbanization degree in the social subsystem. Therefore, a theory which can offer more details about the water resource consumption process is needed to support the study of WRUE. Ren et al. introduced material flow theory (which was used to depict the process of regional water resource flows) and metabolism theory (used to depict regional water resource input and output) into the study of water resources carrying capacity, proposing regional water resource metabolic theory [23]. The main idea of this theory is that water resource consumption is an organic process, which put water resources into the regional socioeconomic system and produced products, services and pollution. Because this theory has the ability to reflect the socioeconomic system (main consumption body of water resources), it can comprehensively deal with WRUE and contingent WRUE issues. Therefore, this paper has set up the corresponding physical model based on the regional water resource metabolic theory.
In addition to analyzing WRUE and related WRUE issues comprehensively, it will simultaneously combine regional water resource metabolic theory with two-stage DEA. The developed method has the following advantages: (1) regional water resource metabolic theory has the ability to reflect the inner differences and connection of the regional water resource consumption process, which built the corresponding physical model instead of rendering the water resource consumption process into a black box; (2) the two-stage DEA analyzes not only WRUE but also its adjacent issues; (3) it is more effective to deal with WRUE based on the physical model, which was founded on the regional water resource metabolic theory. Subsequently, the proposed method was applied to a real-world case study of Gansu Province, China. The main factors restricting the WRUEs and socioeconomic development efficiency can be identified by the results of the proposed methods. Furthermore, the relationship between the WRUEs of subsystems and socioeconomic development efficiency is also studied and analyzed. Moreover, it can offer suggestions for the decision makers to make reasonable water use plans to improve WRUE.
2. Model Building
2.1. Regional Water Resource Metabolic Theory
Regional water resource metabolic theory was proposed by Ren et al. in the study of water resources’ carrying capacity [23]. The theory combines material flow approach (depicting the process of regional water resource flowing) and metabolic theory (depicting water resource input and output) in ecology. The theory posits that water resources, in an organic process, are placed into the socioeconomic system, producing products, services and pollution. Ren et al. divided the water resource consumption process into four parts—water resource input, water resource consumption, capital accumulation and waste discharge [23]. Water resource input represents the total water amounts that are put into the sectors in the region to conduct productive activities; water resource consumption represents the allocating process among sectors in the socioeconomic system (the main body of water resource consumption) and the overall WRUE; capital accumulation represents the value produced by water resource input (i.e., positive output); waste discharge represents the waste and pollution produced during the process of water resource consumption (i.e., negative output). The waste discharge was regarded as unwanted output in the DEA model. This theory emphasizes the entire organic process of water resource input, consumption and output, especially the socioeconomic water resource consumption system. Figure 1 shows the flowchart of the regional water resource metabolic process. Because of the above characteristics, the theory has a great advantage in dealing with WRUE and related WRUE issues in the water resource carrying capacity study.
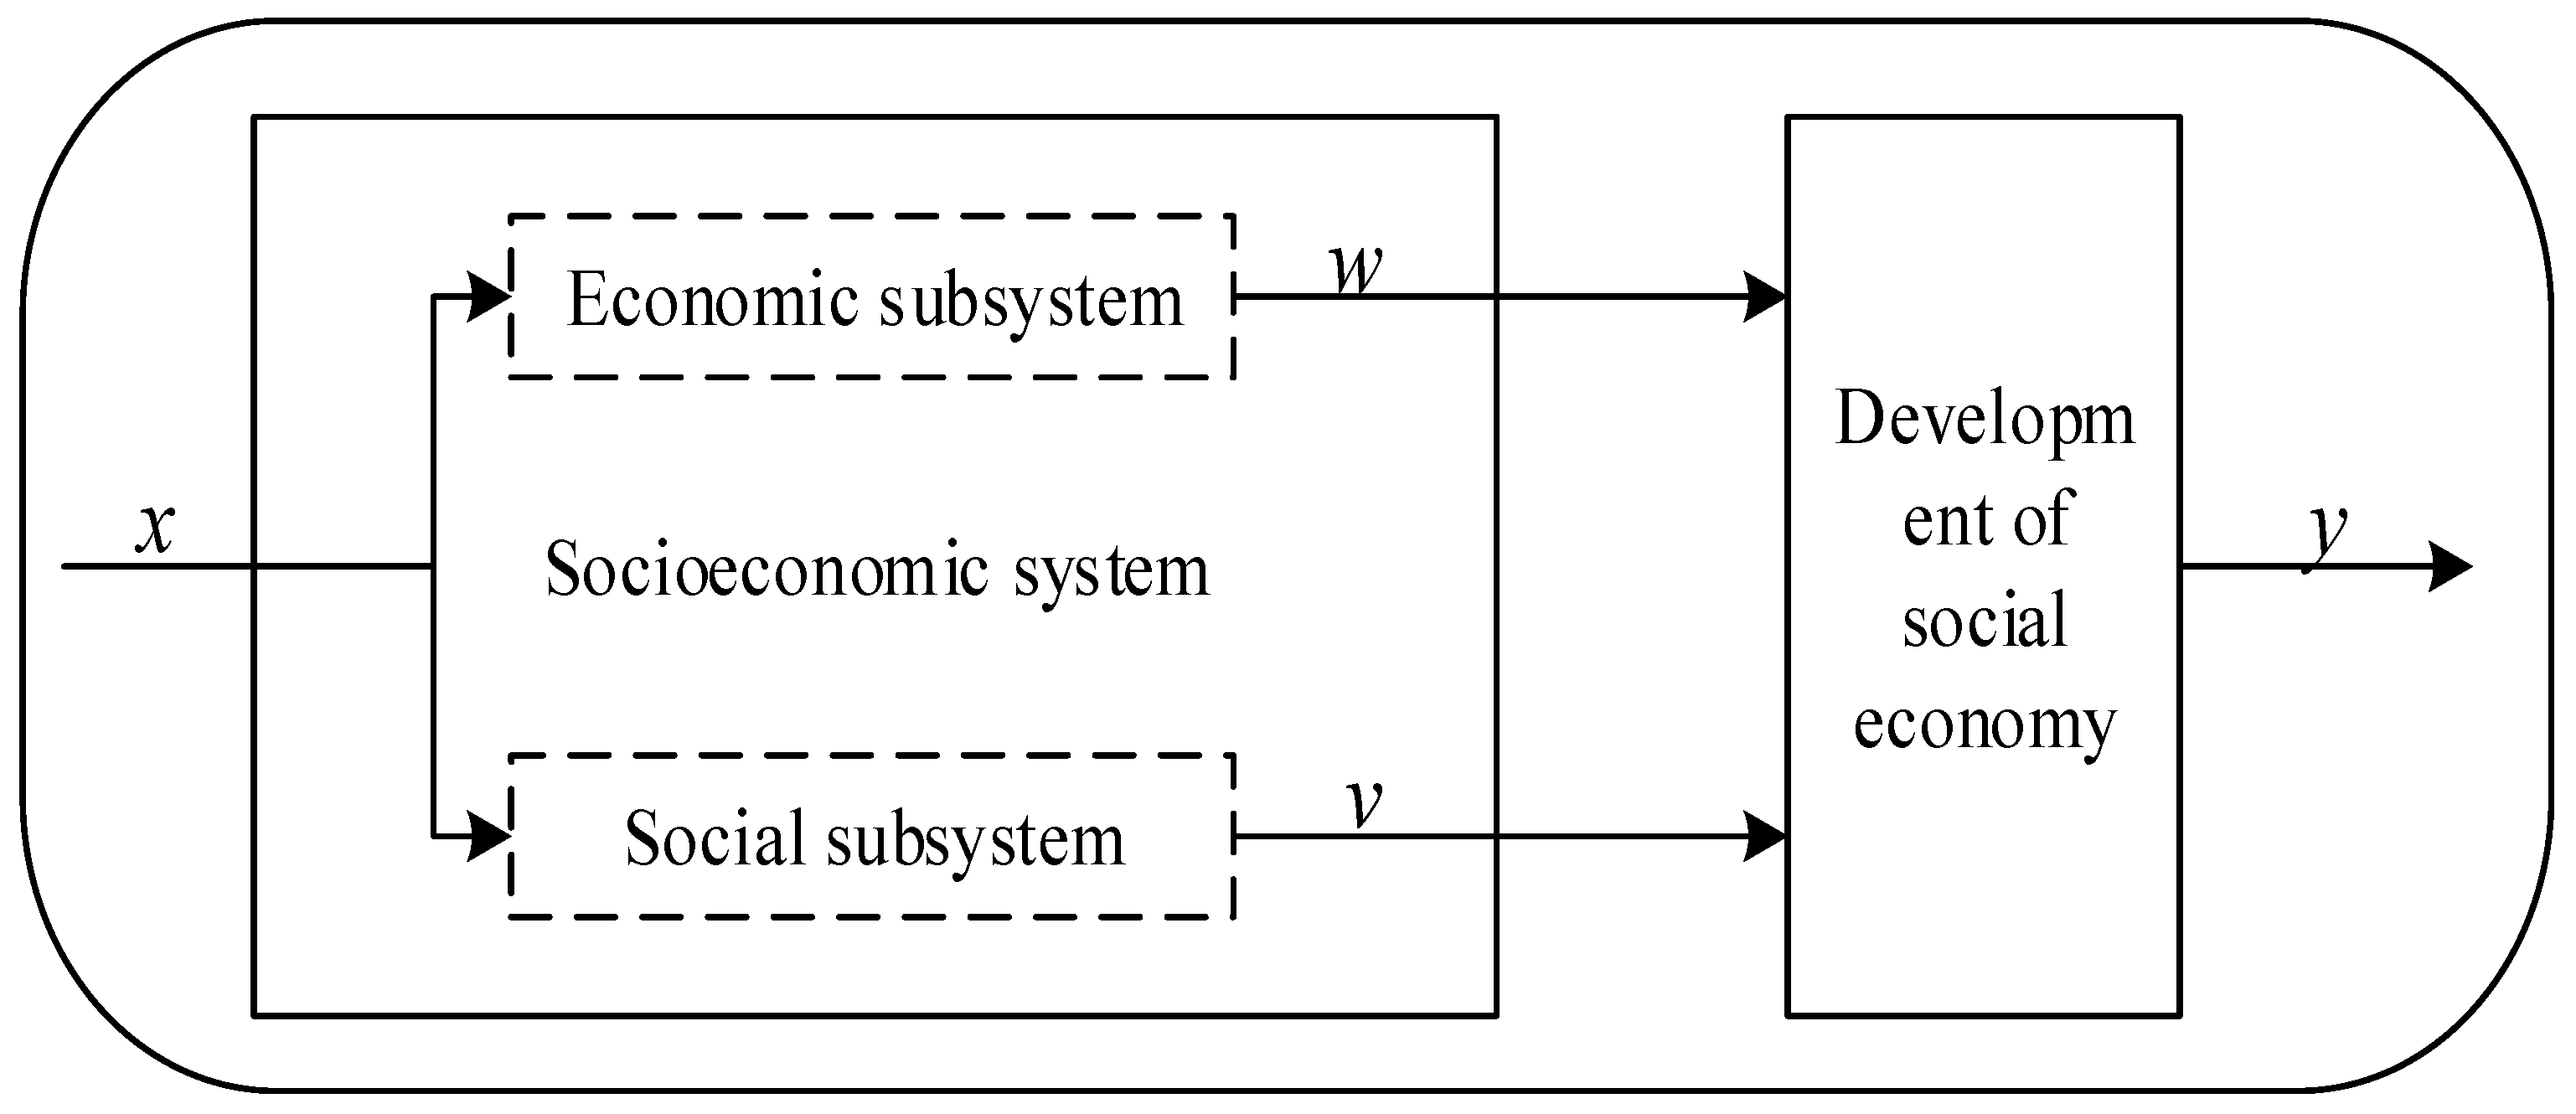
It can be found that the social and economic subsystems comprise the main body of the water resource consumption system. The subsystems support life and economic development, respectively. When building a physical model based on the regional water resource metabolic theory, it becomes clear that there exist interactions between the two subsystems. For instance, industrial structure in the economic subsystem has a great effect on urbanization degree in the social subsystem. Therefore, the effects of WRUE on the socioeconomic development scale should be taken into account when building the physical model of the water resource consumption system. Generally, according to the above analysis, the WRUE physical model based on the regional water resource metabolic theory can be built through two steps. (1) Divide the main body of water resource consumption system into two parallel subsystems—social subsystem and economic subsystem. Then analyze the WRUEs of the two subsystems; (2) Based on the results obtained in the first step, analyze and evaluate the effects of WRUE on the socioeconomic development scale. In other words, the effects of WRUE are studied for the region as a whole. The schematic of the physical water consumption model based on regional water resource metabolic theory is shown in Figure 2.
2.2. Two-Stage Data Envelopment Analysis (DEA) Model
The DEA is based on the concept of relative efficiency [18]. Each unit in the DEA is an individual DMU and needs to be evaluated separately. It can be decided whether a DMU is DEA efficient according to the calculation of relative efficiency values. Likewise, the relative efficiency value ranging in the interval (0,1), approaches 1 when the relative efficiency value of the DMU is more efficient [24,25]. The DMU with a relative efficiency of 1 is the most efficient DMU in comparison to other DMUs. Based on the comparison of relative efficiencies of DMUs, the differences among DMUs can be captured.
However, in reality, in order to obtain more reliable and detailed performance evaluation information, DMUs can be regarded as having a network structure. In addition, the complicated process of the entire production can be divided into several sub-processes or sub-stages in which some intermediate products are considered outputs of one sub-stage and are then treated as an input of another sub-stage [26]. For example, as discussed in the studies of Lewis et al., DMUs can be divided into a “two-stage structure” in which the outputs of the first sub-stage are used as inputs in the second sub-stage [27,28,29,30]. These intermediate outputs/inputs are further defined as intermediate measures [31]. However, the DEA can only measure the efficiency of a specific stage when a two-stage production process is present. Moreover, DEA treats DMUs as “black boxes”, calculating their efficiencies by considering initial inputs and final outputs. As a result, intermediate measures are also lost. Therefore, in order to solve the above problems, a two-stage DEA model was developed, which considers intermediate measures based on the previous studies [30,32,33,34]. The flowchart of the two-stage DEA model is shown in Figure 3.
Figure 3 presents a general two-stage DEA model where the first stage uses input xij (i = 1, 2, …, m) to produce outputs Zdj (d = 1, 2, …, D), and then these Zdj (d = 1, 2, …, D) are used as inputs in the second stage to produce outputs yri (r = 1, 2, …, S). It can be seen that Zdj (d = 1, 2, …, D) are outputs in the first stage and inputs in the second stage. A general two-stage DEA model is formulated as below [24]:
s.t.
(Stage 1)
(Stage 2)
where, xij is the ith input of DMUj in the first stage; Zdj is the output of the first stage and input of the second stage; yrj is the rth output of DMUj in the second stage. xijo yro is the ith input in the first stage and yrjo is the jth output of the second stage of the joth DMU (observation) under evaluation. Zdjo is the jth output in the first stage and the jth input of the second stage of the joth DMU (observation) under evaluation. α and β are the efficiencies in the first and second stage. ~ represents unknown decision variables. w1 and w2 are the weights in the two stages.
2.3. Two-Stage DEA Model Based on Water Resource Use Efficiency (WRUE) Physical Model
As is presented in Section 2.1, a physical model for analyzing WRUE has been built based on the regional water resource metabolic theory. A two-stage DEA model was subsequently presented to analyze the efficiencies in the physical model, which include the social WRUE, economic WRUE, and socioeconomic development efficiency. The limited factors, which negatively influence WRUE, can be derived based on the above analyses. However, it is observed that there is a distinct difference in the first stages of the two models when comparing Figure 2 with Figure 3. The first stage of the physical model contains two parallel sub-stages, whereas the first stage in the DEA model remains whole. Therefore, it is necessary to make the first stage of the DEA model match the first stage of the physical model. Therefore, an extended two-stage DEA model, whose first stage contains two parallel sub-stages, was developed by combining the two-stage DEA model with regional water resource metabolic theory, which is based on Chen and Zhu’s two-stage DEA model [30]. Figure 4 shows the schematic of the modified two-stage DEA model.
The modified two-stage DEA model based on WRUE physical model is formulated as below:
s.t.
Assume that stage A and stage B are the two sub-stages in the first stage, and stage C is the second stage. In the formulas, α, β, and θ are respectively the efficiencies of stages A, B and C. w1 w2 and w3 are the weights in stages A, B and C. and are the ith and eth input in stages A and B. wtj and vrj are the tth and rth output in stage A and B. Meanwhile, they are also the inputs in stage C. ysj is the sth output in stage C. In the constraints, formula α, β < 1 means the inputs do not exceed a maximum pre-specified level; formula θ > 1 means the outputs meet a minimum pre-specified level. When α = β = 1, the DMU is on the efficiency frontier in all the stages.
3. Case Study
Gansu Province ((32°31′–42°57′N, 92°13′–108°46′E), in the northwestern inland part of China, was selected as study area. It is located at the interchanges of the Loess Plateau, Inner Mongolian Plateau, and the Qinghai-Tibet Plateau, with a land area of 425,900 km2, accounting for 4.72% of China’s land area. Figure 5 shows the geographical location of Gansu Province and its 14 cities. Gansu Province, which is characterized by scarce rainfall, arid climate, and high potential evapotranspiration, is relatively lacking in water resources compared to other provinces in China. The annual per capita water resources of Gansu Province are only 1170 m3, which is only half of the quota of China and one-eighth of the world quota [35]. The degree of exploitation and utilization of water resources in Gansu Province has increased up to 42.4%. Water consumption accounts for 75.5% of the total available water resources, and agricultural water consumption accounts for 86.8% of total water resource consumption [36]. In addition, the shortage of water resources is aggravated by the rapid economic development and population growth in recent years, which need large amounts of water resources. The water supply thus cannot meet the water demand in Gansu Province. Moreover, groundwater overexploitation and ecological occupation have led to the declination of annual river recharge, the deterioration of water quality, and the expansion of land desertification [37]. In summary, the major factor restricting social and economic development in Gansu Province is the limited water resources. Therefore, in order to achieve sustainable socioeconomic development with the available water resources, policymakers should make corresponding adjustments on the basis of the WRUE.
In order to characterize the WRUE of Gansu Province, this study selects 12 cities (Jiuquan, Jiayuguan, Zhangye, Wuwei, Lanzhou, Baiyin, Dingxi, Tianshui, Pingliang, Qingyang, Longnan), and two autonomous prefectures (Linxia Autonomous Prefecture and Gannan Autonomous Prefecture) as DMUs. The choice of inputs/outputs is very important for the extended two-stage DEA model. Therefore, it should be based on the characteristics of the water resource consumption system and the characteristics of the developed modified two-stage DEA model when selecting the inputs/outputs for the modified two-stage DEA model. Water resources are considered the main input when analyzing the WRUE in the water resource consumption system. The availability of water resources has become a major limitation for the development of cities in northwestern China [14]. Moreover, this paper aims at analyzing WRUE. Therefore, the water consumption of water resources in each city is selected as an input indicator of the first stage. In terms of output indicators of the two subsystems in the first stage, water resources are mainly used to carry residents’ life in the social subsystem. In addition, the urbanization ratio has a great influence on WRUE because there are great differences between rural and urban areas in water use pattern and quantity. Thus, population and urbanization ratio are selected as output indicators in the social subsystems. In the economical subsystem, various kinds of products are produced; thus, it is more convenient to use GDP to present these products as an output indicator. Moreover, the ratio of the secondary and tertiary industries also have a great influence on WRUE because the economic development mode largely decides the WRUE of the economic subsystem. In terms of the second stage of two-stage DEA, development efficiency of the whole system is the focus. Moreover, the availability of data, typicality of the indicator, and the characteristics of the socioeconomic system should be taken into account. Growth rate of population, urban population, and GDP are selected as outputs of the second stage. Table 1 shows the input, intermediate, and output indicators of the extended two-stage DEA model. Raw data of the aforementioned indicators from 2003 to 2013 of these cities are obtained from the Water Resources Bulletin of Gansu Province (Supplementary Materials give the data of the selected indicators of the extended two-stage DEA model).
4. Results and Discussion
Table 2 presents the results of the extended two-stage DEA model from 2003 to 2013. In addition, α, β, and θ represent the relative WRUE of the social subsystem, economic subsystem, and the relative development efficiency of the socioeconomic system. It means that WRUE of a city is the most efficient among all cities when the relative WRUE equals 1. On the contrary, the WRUE is increasingly inefficient compared to other cities when the relative WRUE decreases gradually.
From Table 2, it is clearly observed that Gannan city has almost been on the efficiency frontier (α = β = θ = 1) in the past years, except for the relative WRUE of the social system in 2013 which was a little less than 1 (α = 0.9310 while β = θ = 1). Therefore, Gannan city has the highest WRUE in the past ten years. In addition, Lanzhou city is also on the efficiency frontier at the halfway point (in 2007, 2010, 2011, 2012 and 2013, α = β = θ = 1). In addition, over the last few years, the economic subsystem and the second stage have been on the efficiency frontier (β = θ = 1) except for 2006 and 2008. Moreover, the social subsystem of Jiayuguan (α = 1) and the economic subsystem in Qingyang (β = 1) are both on the efficiency frontier. In terms of the second stage, most of the cities are on the efficiency frontier (θ = 1). For instance, all 14 cities (regions) were on the efficiency frontier in 2007 (θ = 1). Generally, it indicates that the development efficiency of all the cities were on the efficiency frontier in 2007.
In contrast, Linxia autonomous region is not on the efficiency frontier, neither in the social or economic subsystems, nor in the second stage (α, β, θ < 1). In general, there is a distinct difference in WRUE between social and economic subsystems among cities. For instance, the value of α almost varies from 0.1 to 1 (Lanzhou’s value in 2006 and 2007 was 0.07), and the values of β vary from 0.032 to 1. Moreover, it can be found that the WRUE of social subsystems is closer to the efficiency frontier than the economic subsystem when compared to the mean value of α and β of 14 cities (regions) every year. It also indicates that the difference of WRUE in the economic subsystem is more obvious than that in the social subsystem.
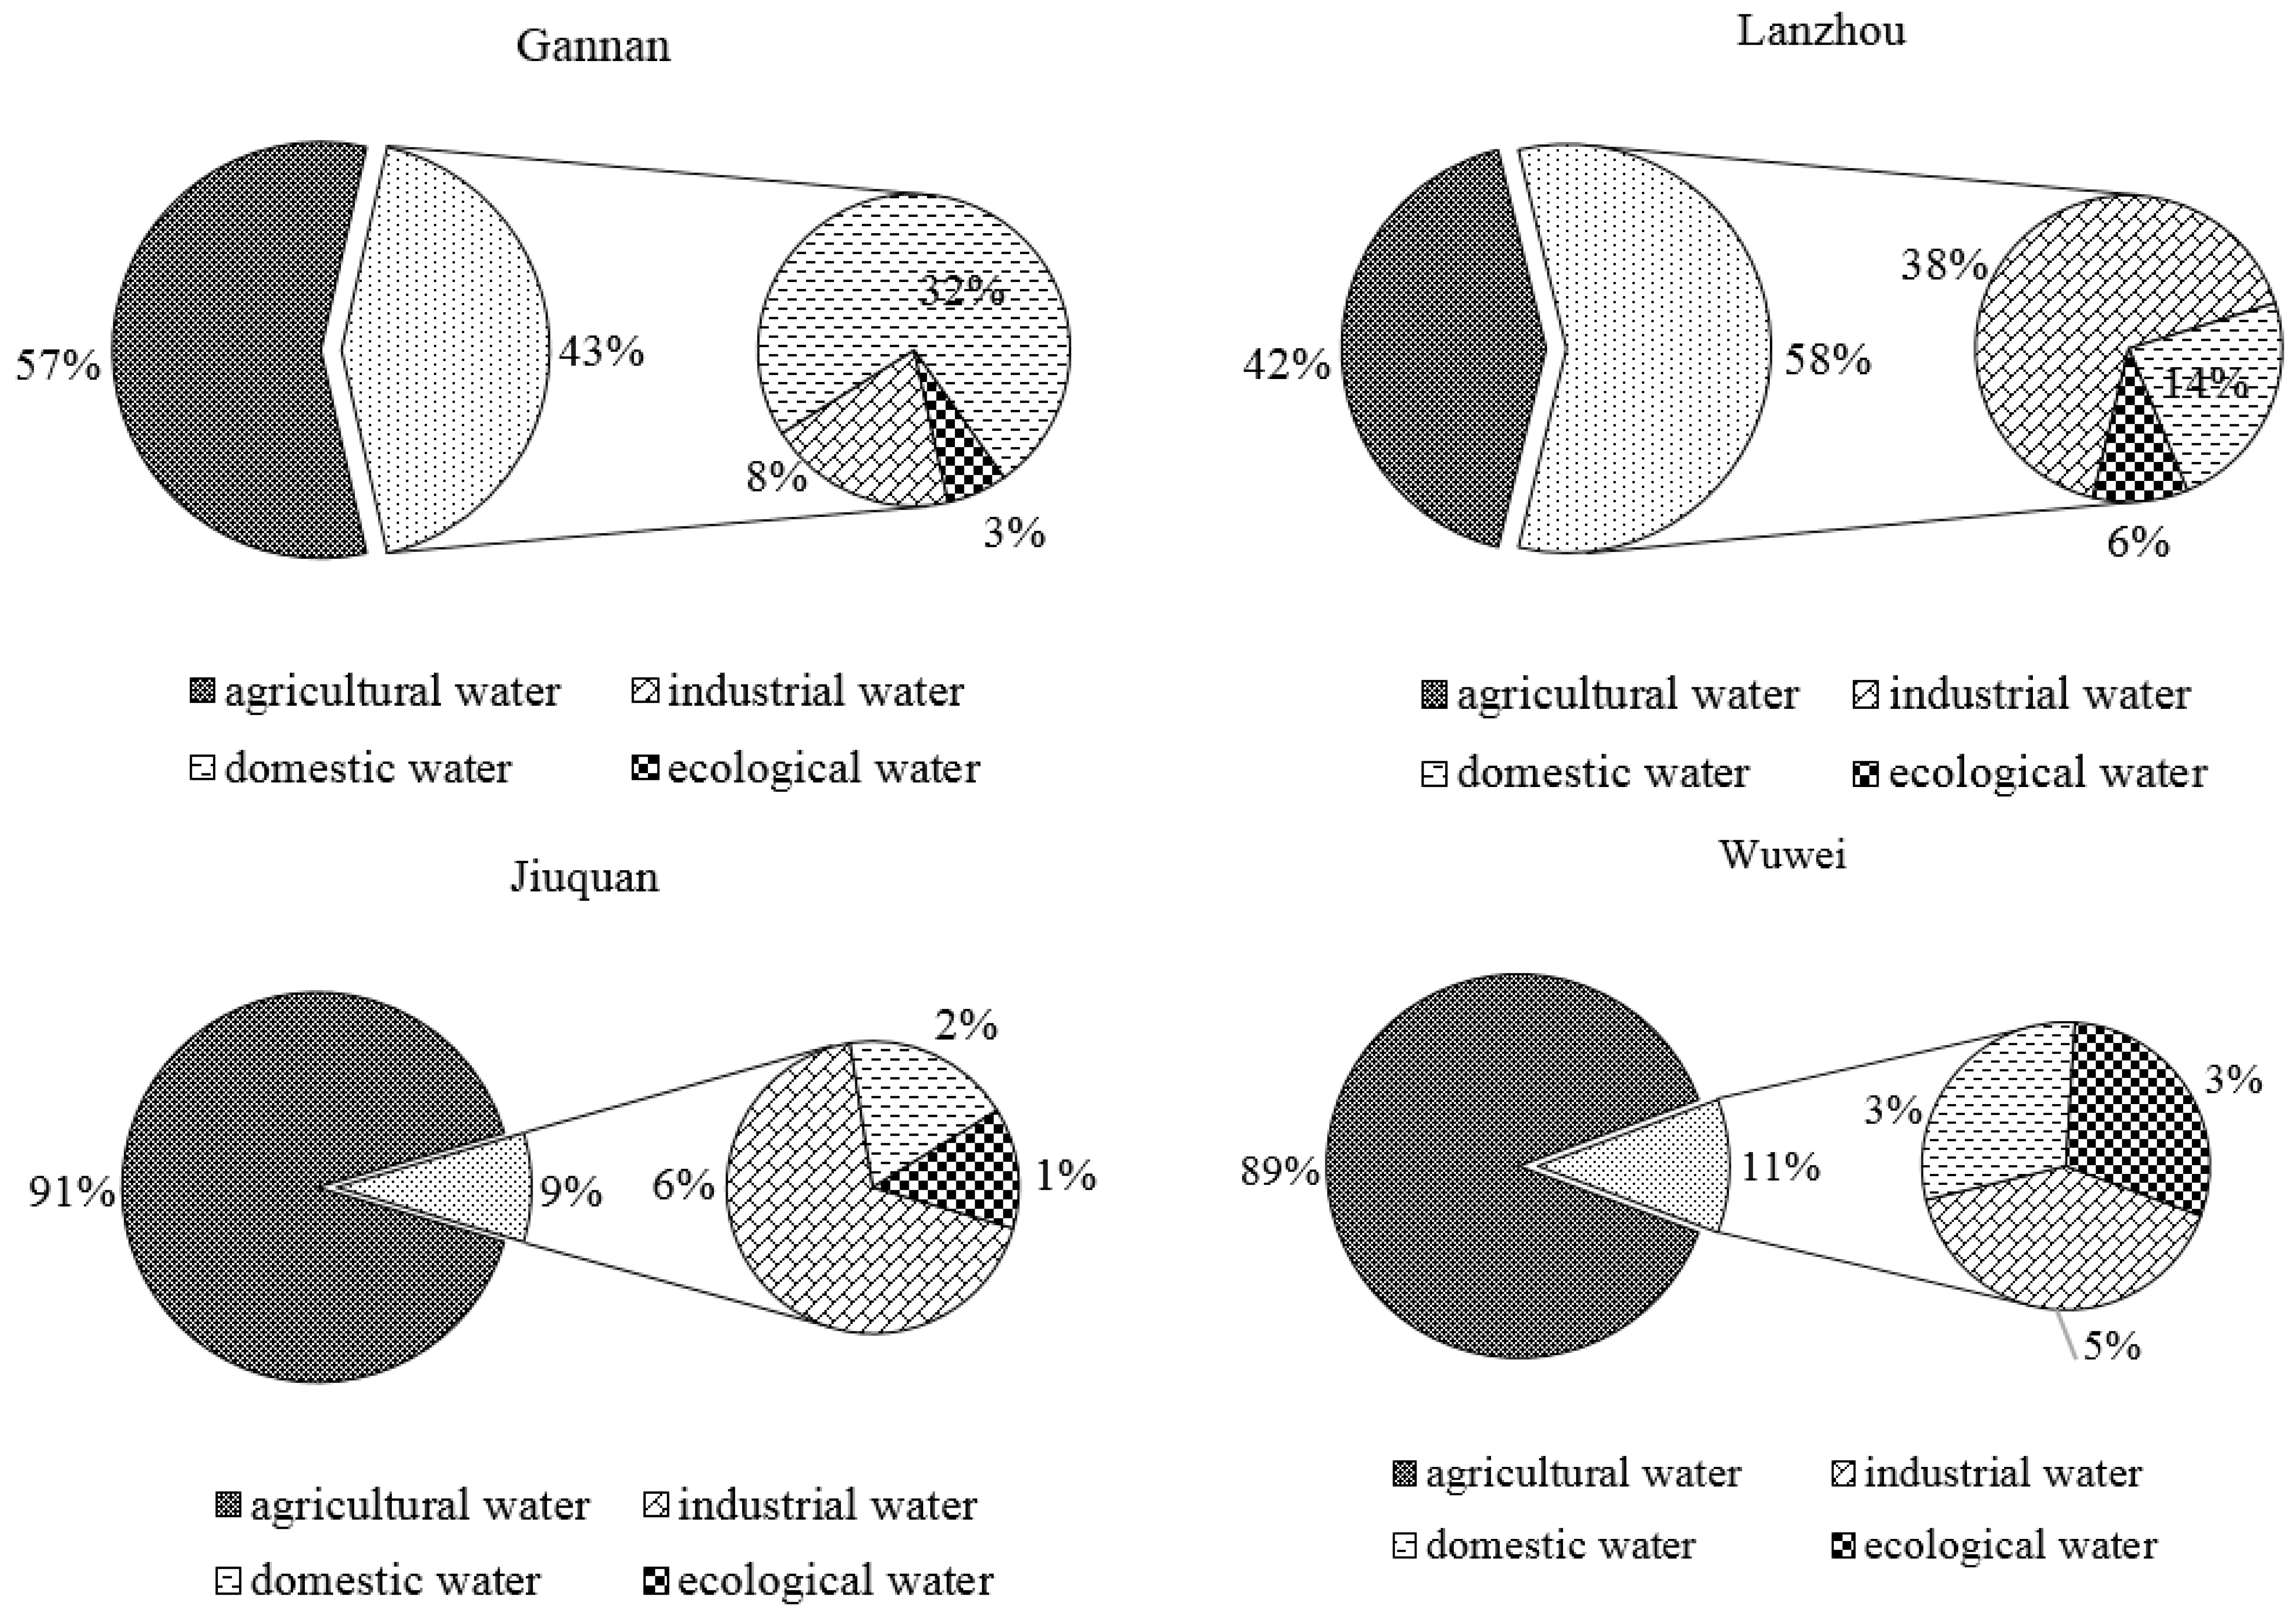
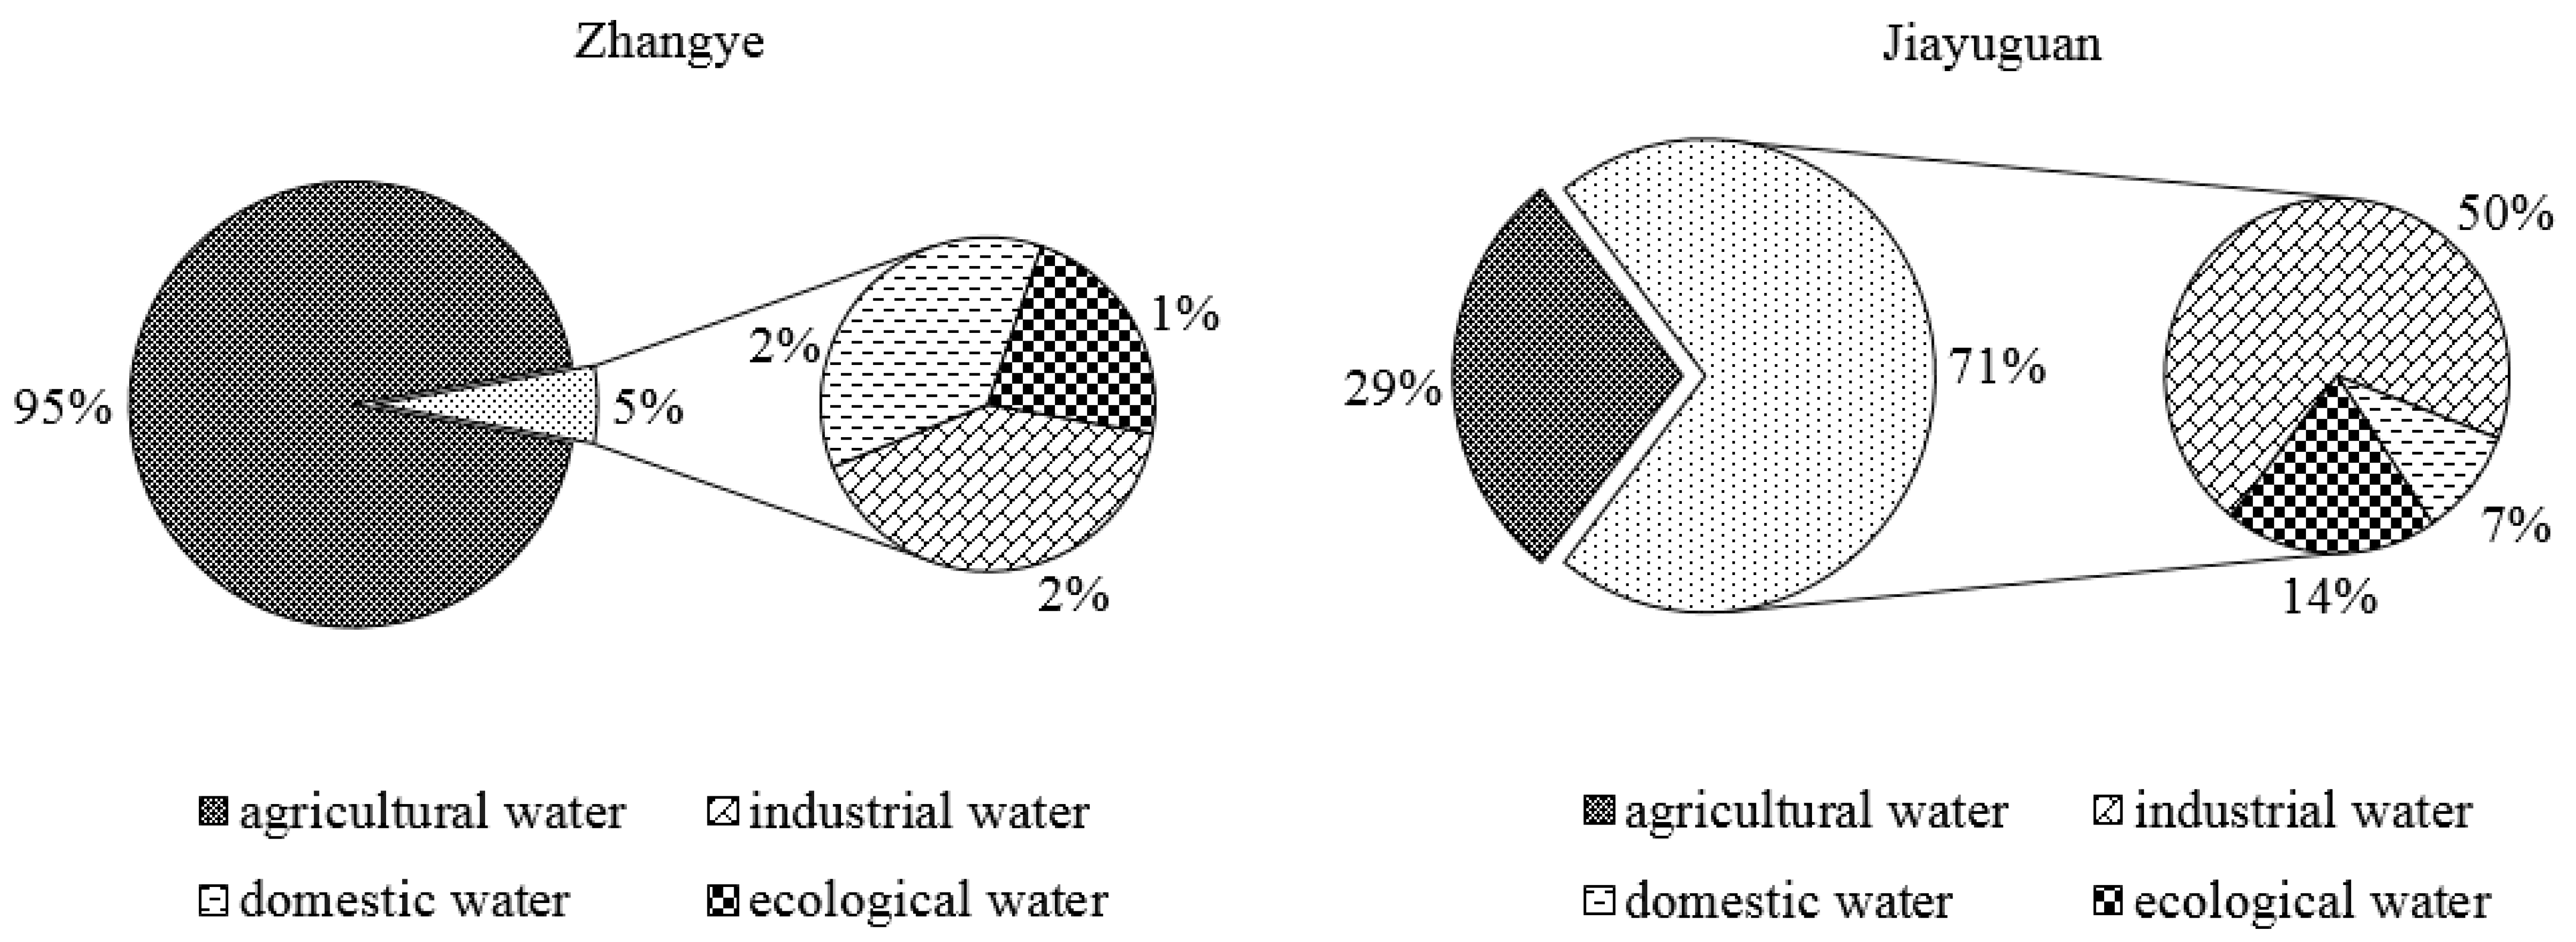
From the above analysis, great differences in WRUE among 14 cities (regions) are presented. Improving WRUE is a basic way to achieve the sustainable development of water resource utilization in Gansu Province, which suffers from severe shortages of water resources. In order to find the reason behind the discrepancies in WRUE, the years 2009 to 2013, and the cities of Gannan, Lanzhou, Jiayuguan, Jiuquan, Wuwei and Zhangye were selected representatively. By analyzing and comparing the WRUE and water resource consumption structure of representative cities in representative years, the main factors which affect WRUE can be deduced. In addition, the shortage of water resources has negatively influenced the sustainable development of the socioeconomic system in Gansu. Therefore, WRUE has a distinct influence on the socioeconomic development scale. Moreover, the socioeconomic system also has influence on the WRUE. Therefore, the relationship between WRUE and socioeconomic development efficiency can be ascertained based on the analyses of WRUE in the social and economic subsystems.
Figure 6 shows the water resource consumption structures of the six representative cities. From the figure, it can be observed that Gannan and Linzhou have a high WRUE in their economic subsystems, while Jiuquan, Wuwei and Zhangye’s WRUE in economic subsystems are low. On the basis of comparison and analysis of water resources consumption structures and WRUE of the above cities, the factors that affect WRUE are as follows. First, the economic development pattern is the main factor causing the difference of WRUE in economic subsystems. For example, it is clearly observed that Gannan and Lanzhou are headed by an industrial economy, whereas Jiuquan, Wuwei and Zhangye are guided by an agricultural economy. It is well known that an agriculture-dominated economy requires larger water consumption, has a lower GDP and lower WRUE. Secondly, an industrial structure can also lead to the difference of WRUE in the economic subsystem. Take Wuwei as an example: the industrial structure is 24.56:42.33:33.11 (primary industry: secondary industry: tertiary industry) while the average levels of China and the world are 15:52:33 and 5:31:64, respectively. Therefore, the WRUE of the economic subsystem is low when it is characterized by a high ratio of primary industry and low ratio industry. Even worse, water resource consumption of the primary industry has reached 1,075,590,000 m3, which accounts for 89% of total water resource consumption. Thirdly, water consumption of per unit GDP is too high. For instance, the water consumption of per unit GDP is 628 m3 in Wuwei, while the average value is 129 m3 for all of China. Moreover, the water use quota of industry in general is far too excessive. For instance, Wuwei city’s average industry water use quota is 141 m3, which is almost twice as much as the national quota (78 m3).
From the aforementioned analysis, the measures which can improve the WRUE of economic subsystem effectively can be gleaned. Firstly, a potential way to improve the WRUE is by changing the economic development pattern. For example, the agriculture-dominated pattern can be transformed into an industry-dominated pattern. Moreover, the focus can be on developing ecological agriculture instead of traditional agriculture because it is not easy for the cities to transform to an economic development pattern. Secondly, the WRUE of an economic subsystem can be improved by adjusting the industrial structure and reducing the proportion of the primary industry. For instance, the grape-planting industry is prosperous in Wuwei city, where grape quality is excellent. Therefore, a potential way to improve the WRUE of the economic subsystem is by developing a grape processing industry, such as the production of grape wine and grape juice. Thirdly, it can save a lot of water resources by reducing water consumption per unit GDP. For example, it is necessary to replace traditional irrigation with drip irrigation and sprinkle irrigation which are characterized by high water use efficiency. Moreover, in order to improve WRUE, the equipment and management should be upgraded in the secondary industry.
In terms of WRUE in the social subsystem, Jiayugyan for the selected years was always on the efficiency frontier. The factors which have great influence on the WRUE in the social subsystem can be derived from the analysis of water consumption structures and social and economic indicators in Appendix A. Firstly, the economic development pattern also greatly influenced the WRUE in the social subsystem. The WRUE in industry-dominated cities is higher than that in agricultural-dominated cities because the urbanization degree of the former is higher than the latter. It means that there is a large proportion of water reuse in the whole water resource consumption system. Secondly, the scale of cities also has a great influence on WRUE in the social subsystem. For example, the WRUE in the subsystem of Jiayuguan and Gannan are persistently on the efficiency frontier. Although Lanzhou is also on the efficiency frontier, it cannot be considered here because it is the capital city of Gansu Province, which has priority in resource allocation. It can be concluded that small- and medium-scale cities (respectively defined as population not greater than half a million; population between half a million and a million) reach the efficiency frontier in WRUE of the social subsystem more easily.
From the above analysis, the suggestions about improving WRUE in the social subsystem are as follows. Firstly, a potential way to improve WRUE in the social subsystem is by transforming the economic development pattern. Secondly, the water reuse ratio in water resource consumption can be improved by increasing the ratio of sewage treatment in domestic and industry usages, which currently reach only 55% and 66%, respectively. In addition, the scale of cities should be controlled. Many large-scale cities were built during the rapid urbanization process in China, which was characterized by a low level of sewage treatment. Therefore, a simple way to improve WRUE in the social subsystem is by maintaining a reasonable economic development pattern and reasonable scale in cities.
In addition, most of the cities are on the efficiency frontier in the second stage of the extended two-stage DEA model, which means a high socioeconomic development efficiency. It also indicates that the scales of the socioeconomic system are expanding constantly. According to the socioeconomic indicators in Appendix A, rapid growth of GDP and urbanization degree leading to high socioeconomic development efficiency in most cities can be observed. For instance, the average growth rates of GDP and urban population in Gansu Province were 18.85% and 16.34% in 2007, respectively; in 2010, the growth rates were 16.8% and 9.7%, respectively. In order to find the relationship between WRUE in the first stage and the socioeconomic development efficiency in the second stage, the Malmquist index (MI) is adopted to describe the temporal variation of WRUE in Gansu province from 2004 to 2013. If the MI of WRUE is greater than 1, the WRUE increases over time. In Table 3, the MIs of WRUEs for different cities are given. From Table 3, it can be clearly observed that the MIs are almost greater than 1 from 2004 to 2013 in different cities. This result indicates that the WRUE of the socioeconomic system has constantly improved over the past 10 years. In addition, both the annual mean MI and the mean MI of different cities are greater than 1. This result also shows that the mean WRUE in Gansu Province is increasing, despite great discrepancies of WRUE in the social subsystem, economic subsystem, and different cities. Furthermore, it can also be clearly observed that there is a common tendency between WRUE and development efficiency in the socioeconomic system based on Table 3. In general, the WRUE has a decisive influence on the development efficiency in the socioeconomic system. Conversely, the scale of the socioeconomic system also has an influence on the WRUE of the socioeconomic system, especially on the WRUE of social subsystem.
From the above analysis, although there exist discrepancies of WRUE in the social subsystem, economic subsystem, and different cities, the WRUE in Gansu Province has consistently improved over time. In general, economic development pattern, industrial structure, high water consumption of per unit GDP, and high water use quota of industry are the main reasons for the significant difference of WRUE in the economical subsystem among cities. Moreover, economic development pattern, water reuse ratio, and scale of cities are responsibility for the distinct differences in WRUE of the social subsystem. Meanwhile, the WRUE of the social subsystem is closer to the efficiency frontier than the economic subsystem. Furthermore, WRUE has a decisive influence on the development efficiency of the socioeconomic system, whereas the socioeconomic system scale also has significant impact on the WRUE of the socioeconomic system, especially on the WRUE of the social subsystem.
5. Conclusions
In this paper, water resource use efficiency (WRUE) and adjacent WRUE issues were analyzed by using the extended two-stage data envelopment analysis (DEA) model, which was developed by introducing regional water resource metabolic theory into the two-stage DEA model. Compared to previous studies on WRUE, this study has the following advantages: (1) regional water resource metabolic theory has the ability to reflect the inner differences and connections of the regional water resource consumption process, which built the corresponding physical model instead of making water resource consumption processes appear as a black box; (2) the two-stage DEA analyzes not only WRUE but also all connected WRUE issues; (3) it is more effective to deal with WRUE based on the physical model, which divides the main body of water resource consumption into two parallel subsystems—the social and economic subsystems; (4) it presents the relationship between WRUE and development efficiency within the socioeconomic system; and (5) the presented method can also provide recommendations to decision makers about how to improve WRUE.
Time-series data from a real-world case study in Gansu Province, China, from 2004 to 2013, is employed to evaluate the performance of the proposed WRUE analysis framework. Based on the results and analyses, the following conclusions can be drawn: (1) it is of great urgency to solve WRUE issues in Gansu Province; (2) the regional differences of WRUE are obvious; (3) the WRUE in Gansu Province has consistently increased over the past 11 years; (4) in the future, decision makers can make an efficient water resource plan based on the goals of improving WRUE and eliminating differences among cities.
In addition, uncertainties are inherent to water resource and socioeconomic systems. In the future, researchers should thus address the uncertainties in the DEA model. Furthermore, the choice of input/output indicators is also an important point for the DEA model.
Supplementary Materials
It gives the data of the selected indicators of the extended two-stage DEA model. The following are available online at www.mdpi.com/2071-1050/9/1/52/s1, Table S1: The parameters of two-stage DEA model in 2004, Table S2: The parameters of two-stage DEA model in 2005, Table S3: The parameters of two-stage DEA model in 2006, Table S4: The parameters of two-stage DEA model in 2007, Table S5: The parameters of two-stage DEA model in 2008, Table S6: The parameters of two-stage DEA model in 2009, Table S7: The parameters of two-stage DEA model in 2010, Table S8: The parameters of two-stage DEA model in 2011, Table S9: The parameters of two-stage DEA model in 2012, Table S10: The parameters of two-stage DEA model in 2013.
Acknowledgments
This research was supported by the National Natural Science Foundation of China (No. 51439006; 91425302; 51321001).
Author Contributions
Chongfeng Ren performed research, analyzed the data, and wrote the manuscript; Ping Guo guided the research scope, methodology, and research processes and provided final review suggestions of the manuscript; Ruihuan Li contributed to field data collection and played an important role in translation.
Conflicts of Interest
The authors declare no conflict of interest.
References
- United Nations Education and Scientific and Cultural Organization. World Water Development Report; United Nations: Marseille, France, 2013. [Google Scholar]
- World Economic Forum. Global Risks Report, 9th ed.; World Economic Forum: Davos, Switzerland, 2014. [Google Scholar]
- Soltanjalili, M.; Bozorg-Haddad, O.; Marino, M.A. Operating water distribution networks during water shortage conditions using hedging and intermittent water supply concepts. J. Water Resour. Plan. Manag. 2013, 139, 644–659. [Google Scholar] [CrossRef]
- Han, M.; Ren, Q.; Wang, Y.; Du, J.; Hao, Z.; Sun, F.; Cheng, L.; Qi, S.; Li, D. Integrated approach to water allocation in river basins. J. Water Resour. Plan. Manag. 2013, 139, 159–165. [Google Scholar] [CrossRef]
- Medrano, H.; Tomas, M.; Martorell, S.; Escalona, J.; Pou, A.; Fuentes, S.; Flexas, J.; Bota, J. Improving water use efficiency of vineyards in semi-arid regions. A review. Agron. Sustain. Dev. 2015, 35, 499–517. [Google Scholar] [CrossRef]
- Ren, C.F.; Guo, P.; Yang, G.Q. Spatial and temporal analyses of water resources use efficiency based on data envelope analysis and Malmquist Index: Case study in Gansu province, China. J. Water Resour. Plan. Manag. 2016, 142, 04016066. [Google Scholar] [CrossRef]
- Tsakiris, G.; Spiliotis, M. Cropping pattern planning under water supply from multiple sources. Irrig. Drain. Syst. 2006, 20, 57–68. [Google Scholar] [CrossRef]
- Kilic, M.; Anac, S. Multi-Objective planning model for large scale irrigation systems: Method and application. Water Resour. Manag. 2010, 24, 3173–3194. [Google Scholar] [CrossRef]
- Chen, C.; Wei, C.; Liu, H.; Hsu, N. Application of neural networks and optimization model in conjunctive use of surface water and groundwater. Water Resour. Manag. 2014, 28, 2813–2832. [Google Scholar] [CrossRef]
- Davijani, M.H.; Banihabib, M.E.; Anvar, A.N.; Hashemi, S.R. Multi-Objective optimization model for the allocation of water resources in arid regions based on the maximization of socioeconomic efficiency. Water Resour. Manag. 2016, 30, 927–946. [Google Scholar] [CrossRef]
- Singh, A. Optimal allocation of resources for increasing farm revenue under hydrological uncertainty. Water Resour. Manag. 2016, 30, 2569–2580. [Google Scholar] [CrossRef]
- Mirajkar, A.B.; Patel, P.L. Multiobjective Two-Phase fuzzy optimization approaches in management of water resources. J. Water Resour. Plan. Manag. 2016, 142, 04016046. [Google Scholar] [CrossRef]
- Fasakhodi, A.A.; Nouri, S.H.; Amini, M. Water resources sustainability and optimal cropping pattern in farming systems; A Multi-Objective fractional goal programming approach. Water Resour. Manag. 2010, 24, 4639–4657. [Google Scholar] [CrossRef]
- Ren, C.F.; Guo, P.; Li, M.; Gu, J.J. Optimization of industrial structure considering the uncertainty of water resources. Water Resour. Manag. 2013, 27, 3885–3898. [Google Scholar] [CrossRef]
- Li, M.; Guo, P.; Ren, C.F. Water Resources Management Models Based on Two-Level Linear Fractional Programming Method under Uncertainty. J. Water Resour. Plan. Manag. 2015, 141, 5015001–5015009. [Google Scholar] [CrossRef]
- Ren, C.F.; Li, R.H.; Zhang, L.D.; Guo, P. Multiobjective stochastic fractional goal programming model for water resources optimal allocation among industries. J. Water Resour. Plan. Manag. 2016, 142, 04016036. [Google Scholar] [CrossRef]
- Mani, A.; Tsai, F.T.C.; Kao, S.; Naz, B.S.; Ashfaq, M.; Rastogi, D. Conjunctive management of surface and groundwater resources under projected future climate change scenarios. J. Hydrol. 2016, 540, 397–411. [Google Scholar] [CrossRef]
- Charnes, A.; Cooper, W.W.; Rhodes, E. Measuring efficiency of decision-making units. Eur. J. Oper. Res. 1978, 2, 429–444. [Google Scholar] [CrossRef]
- Alsharif, K.; Feroz, E.H.; Klemer, A.; Raab, R. Governance of water supply systems in the Palestinian Territories: A data envelopment analysis approach to the management of water resources. J. Environ. Manag. 2008, 87, 80–94. [Google Scholar] [CrossRef] [PubMed]
- Romano, G.; Guerrini, A. Measuring and comparing the efficiency of water utility companies: A data envelopment analysis approach. Util. Policy 2011, 19, 202–209. [Google Scholar] [CrossRef]
- Veettil, P.C.; Speelman, S.; Van, H.G. Estimating the impact of water pricing on water use efficiency in semi-arid cropping system: An application of probabilistically constrained nonparametric efficiency analysis. Water Resour. Manag. 2013, 27, 55–73. [Google Scholar] [CrossRef]
- Azad, M.A.S.; Ancev, T.; Hernandez-Sancho, F. Efficient water use for sustainable irrigation industry. Water Resour. Manag. 2015, 29, 1683–1696. [Google Scholar] [CrossRef]
- Ren, C.F.; Guo, P.; Li, M.; Li, R.H. An innovative method for water resources carrying capacity research—Metabolic theory of regional water resources. J. Environ. Manag. 2016, 167, 139–146. [Google Scholar] [CrossRef] [PubMed]
- Fare, R.; Grosskopf, S. Measuring output efficiency. Eur. J. Oper. Res. 1983, 13, 173–179. [Google Scholar] [CrossRef]
- Huppes, G.; Ishikawa, M. A Framework for Quantified Eco-efficiency Analysis. J. Ind. Ecol. 2005, 9, 25–41. [Google Scholar] [CrossRef]
- Ke, W.; Wei, H.; Jie, W.; Ying-Nan, L. Efficiency measures of the Chinese commercial banking system using an additive two-stage DEA. Omega 2014, 44, 5–20. [Google Scholar]
- Lewis, H.F.; Mallikarjun, S.; Sexton, T.R. Unoriented two-stage DEA: The case of the oscillating intermediate products. Eur. J. Oper. Res. 2013, 229, 529–539. [Google Scholar] [CrossRef]
- Chen, Y.; Liang, L.; Yang, F.; Zhu, J. Evaluation of information technology investment: A data envelopment analysis approach. Comput. Oper. Res. 2006, 33, 1368–1379. [Google Scholar] [CrossRef]
- Kao, C. Efficiency decomposition in network data envelopment analysis: A relational model. Eur. J. Oper. Res. 2009, 192, 949–962. [Google Scholar] [CrossRef]
- Chen, Y.; Zhu, J. Measuring information technology’s indirect impact on firm performance. Inf. Technol. Manag. 2004, 5, 9–22. [Google Scholar] [CrossRef]
- Chen, Y.; Lin, Y. Controlling the movement of crowds in computer graphics by using the mechanism of particle swarm optimization. Appl. Soft Comput. 2009, 9, 1170–1176. [Google Scholar] [CrossRef]
- Yang, Z.J. A two-stage DEA model to evaluate the overall performance of Canadian life and health insurance companies. Math. Comput. Model. 2006, 43, 910–919. [Google Scholar] [CrossRef]
- Chen, Y.; Cook, W.D.; Li, N.; Zhu, J. Additive efficiency decomposition in two-stage DEA. Eur. J. Oper. Res. 2009, 196, 1170–1176. [Google Scholar] [CrossRef]
- Johnson, A.L.; Kuosmanen, T. One-stage and two-stage DEA estimation of the effects of contextual variables. Eur. J. Oper. Res. 2012, 220, 559–570. [Google Scholar] [CrossRef]
- Cai, Z.; Shen, L.; Liu, J. Applying input-output analysis method for calculation of water footprint and virtual water trade in Gansu Province. Acta Ecol. Sin. 2012, 32, 6481–6488. [Google Scholar]
- Huang, Y.; Li, Y.P.; Chen, X.; Ma, Y.G. Optimization of the irrigation water resources for agricultural sustainability in Tarim River Basin, China. Agric. Water Manag. 2012, 107, 74–85. [Google Scholar] [CrossRef]
- Wang, G. The utilization of water resource and its influence on eco environment in the northwest arid area of china. J. Nat. Resour. 1999, 43, 121–131. [Google Scholar]
Figure 1.
Flowchart of regional water resource metabolic process.
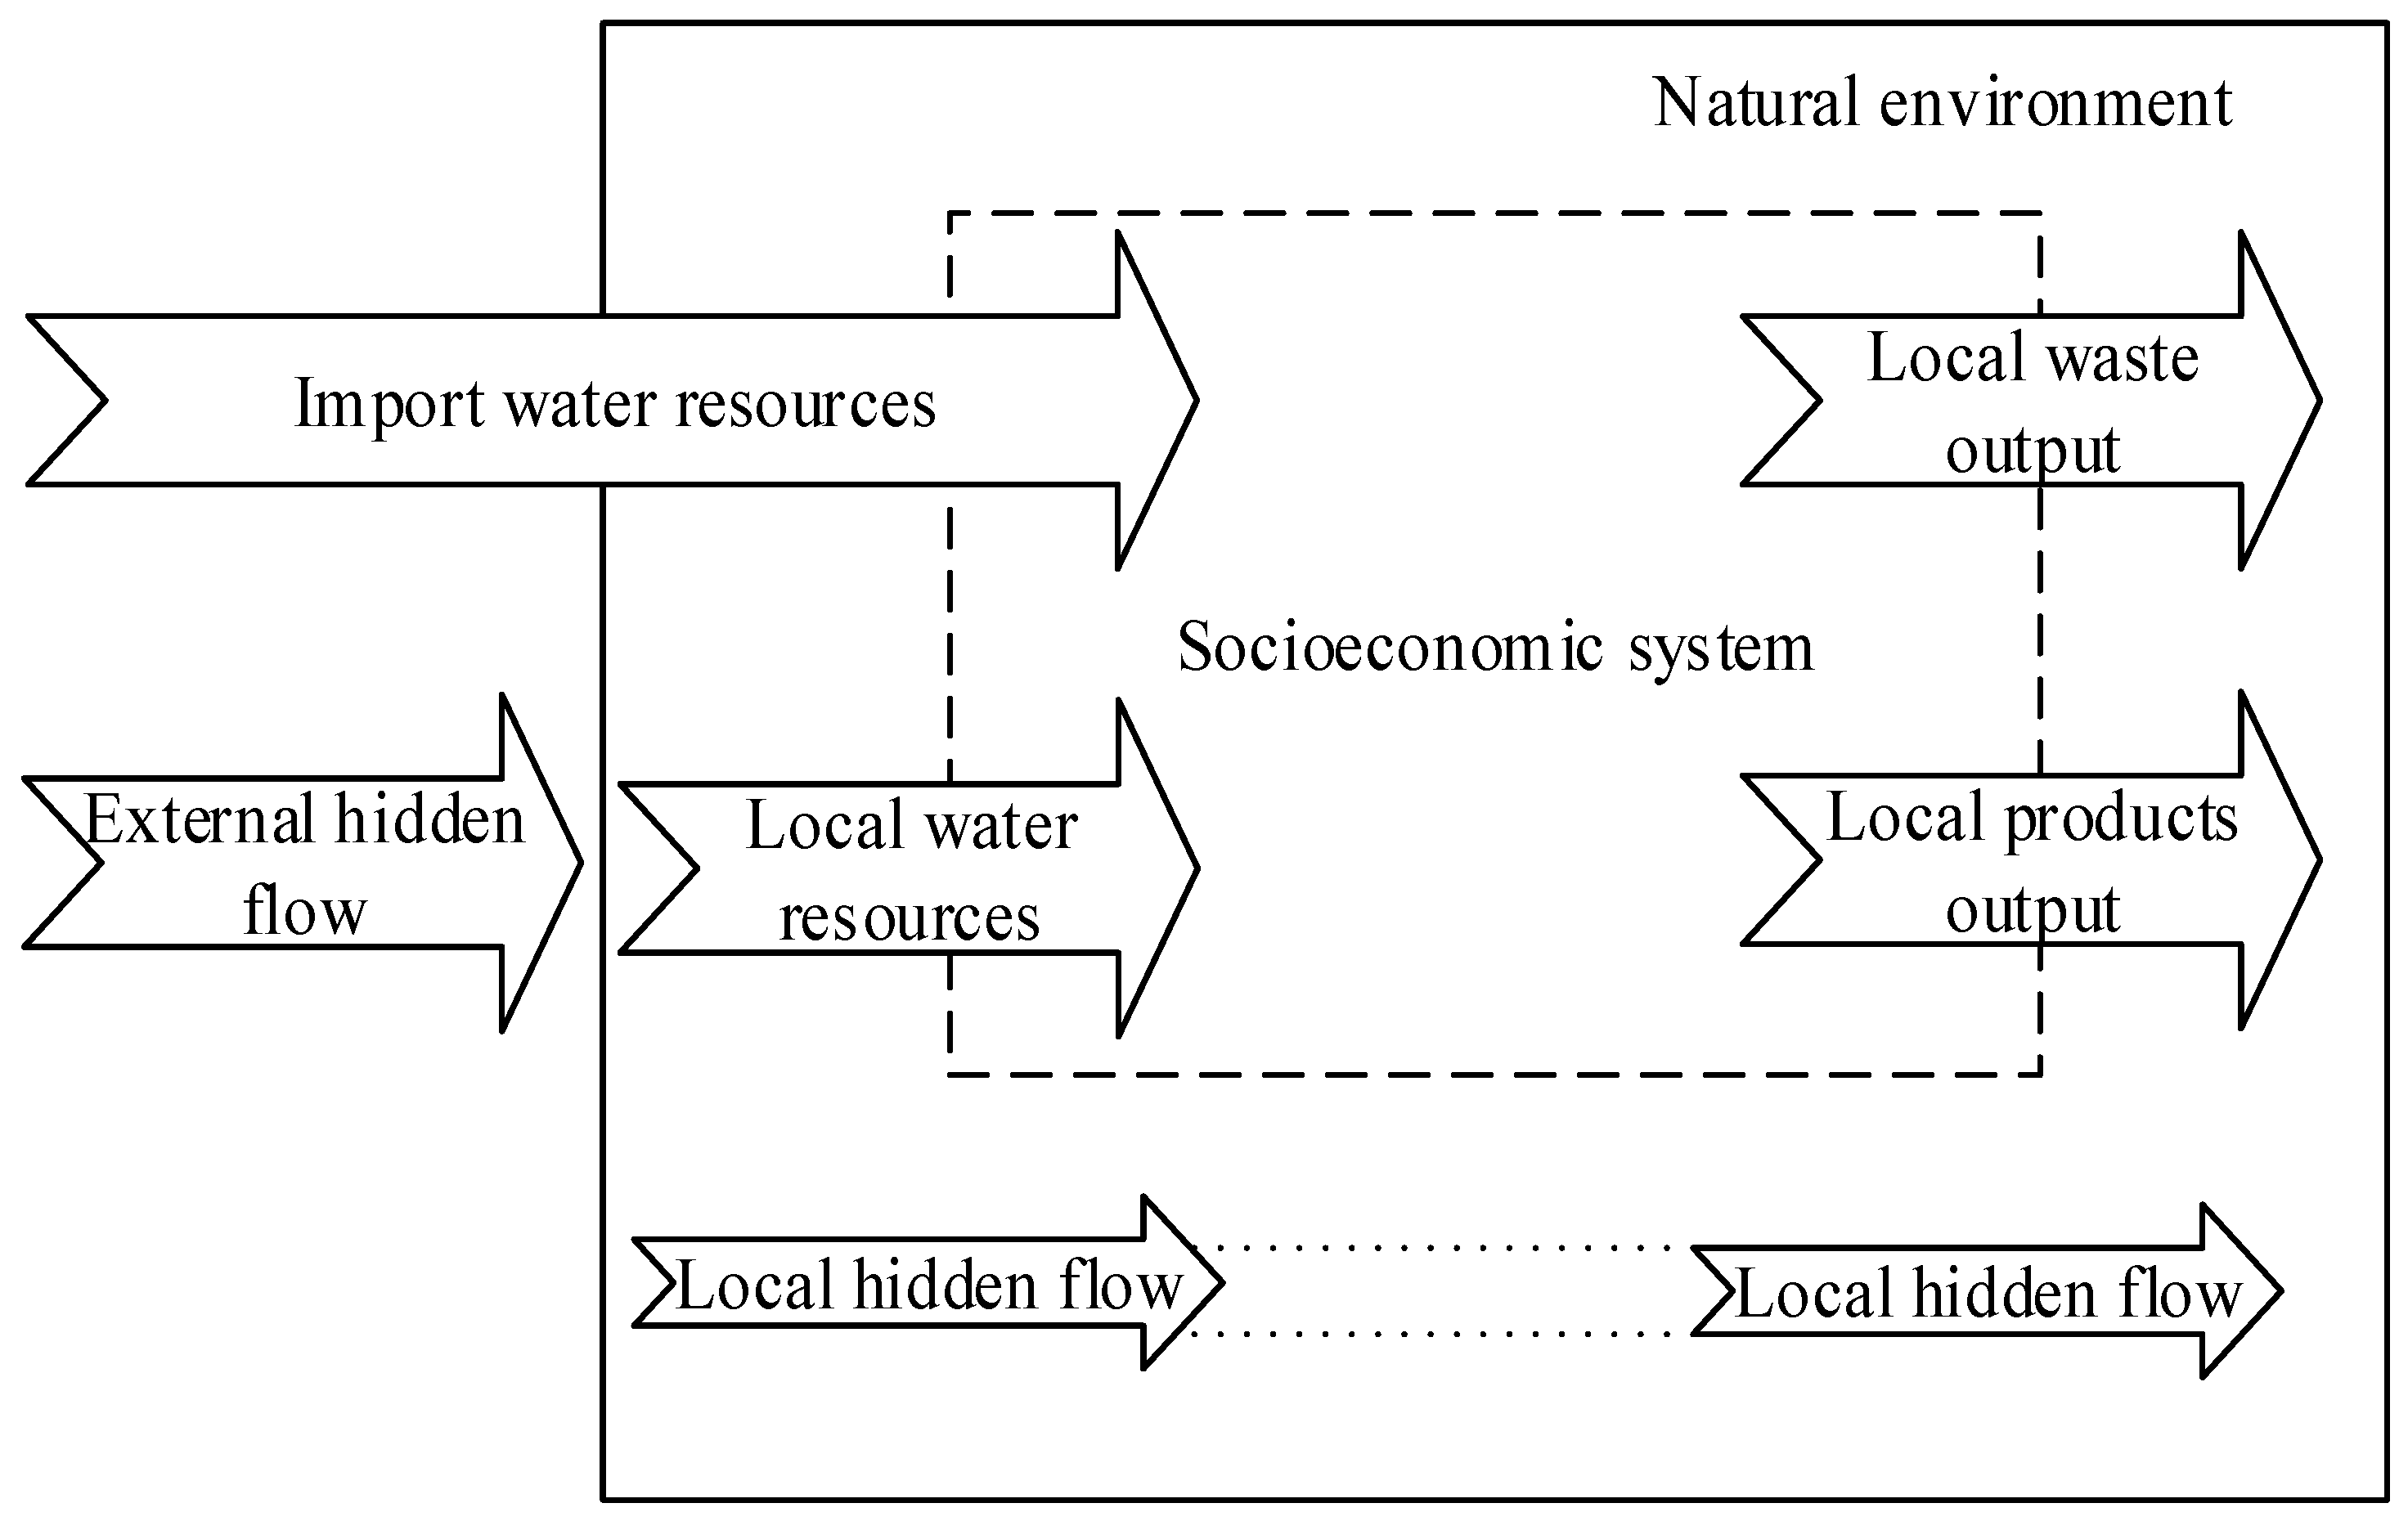
Figure 2.
Schematic of the physical water consumption model. x: water resources input; w: output of economic subsystem and input of development of social economy; v: output of social subsystem and input of development of social economy; y: output of development of social economy.
Figure 2.
Schematic of the physical water consumption model. x: water resources input; w: output of economic subsystem and input of development of social economy; v: output of social subsystem and input of development of social economy; y: output of development of social economy.

Figure 3.
Flowchart of two-stage DEA model.
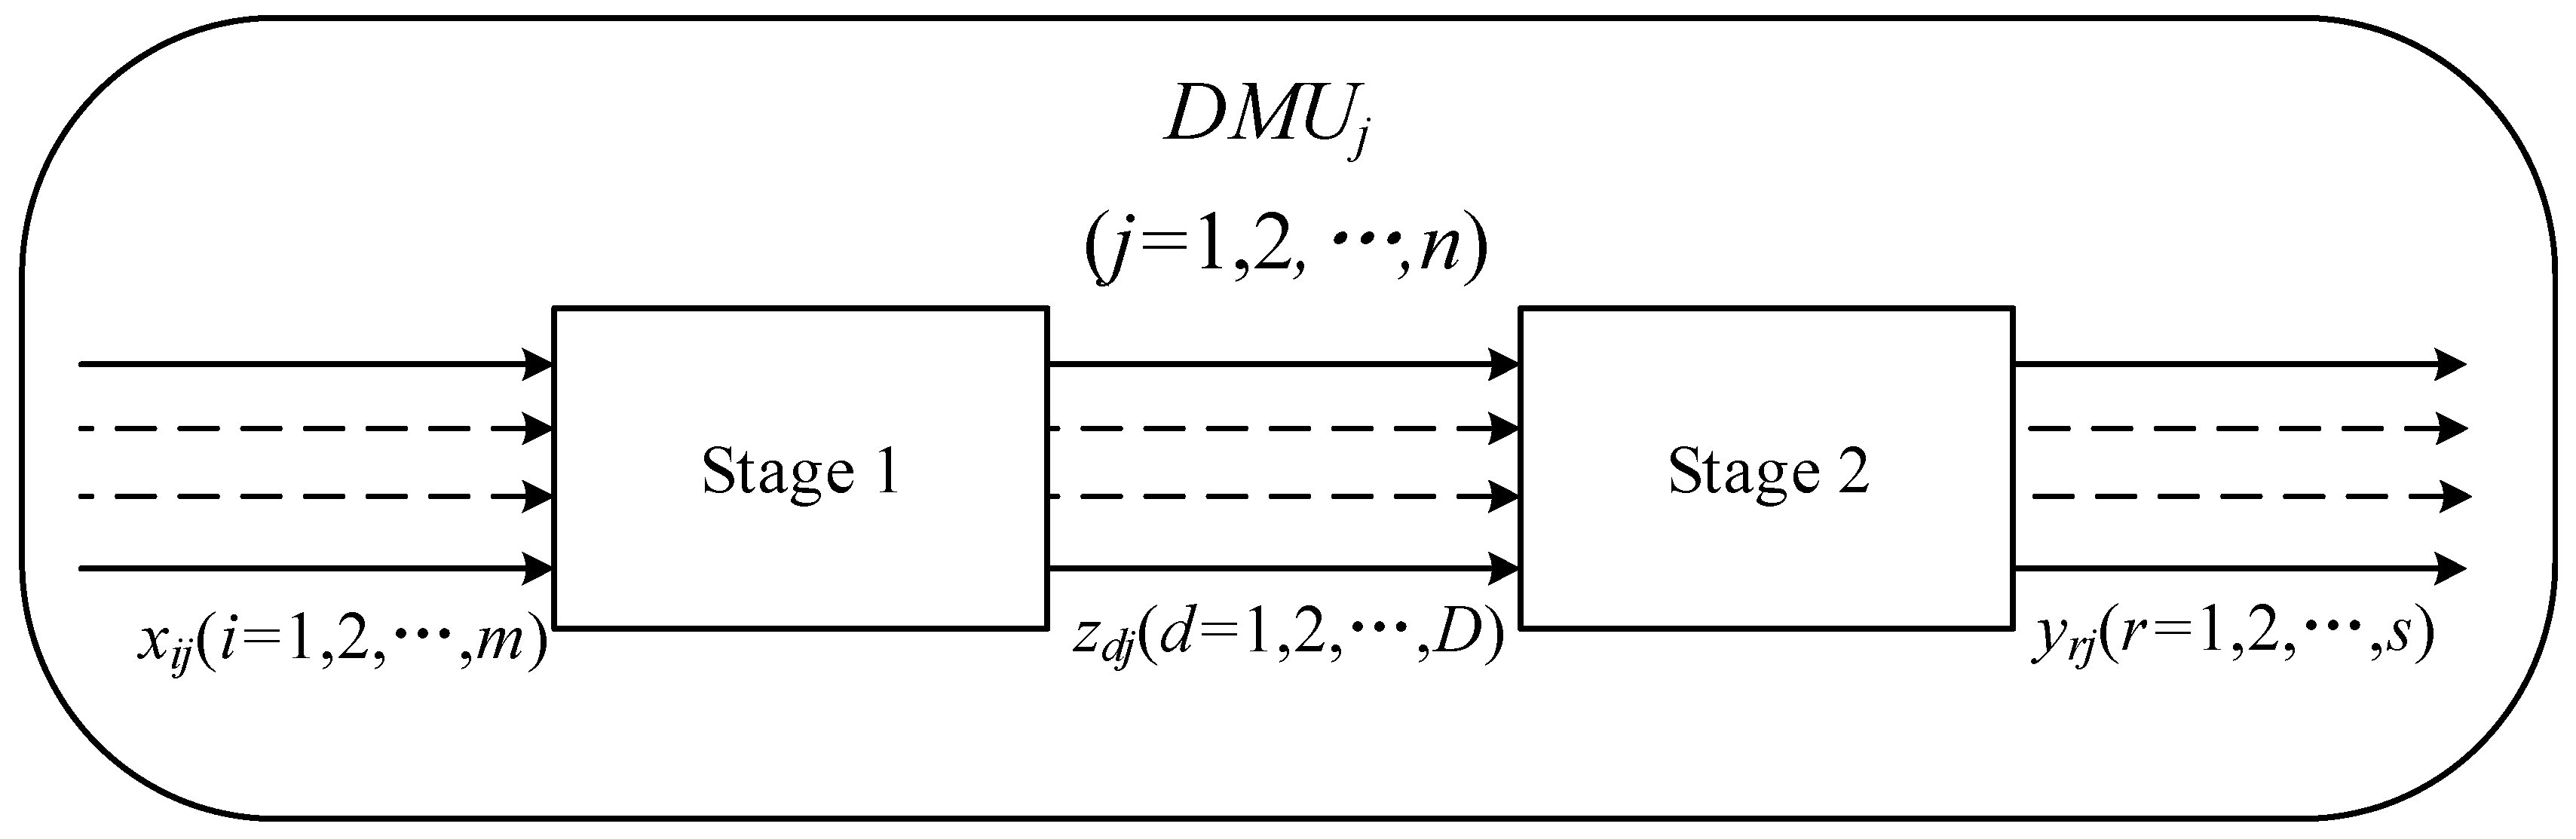
Figure 4.
Schematic of the modified two-stage DEA model. x1: water resources input of Sub-DMU 1; x2: water resources input of Sub-DMU 2; w: output of Sub-DMU 1 and input of Sub-DMU 3; v: output of Sub-DMU 2 and input of Sub-DMU 3; y: output of Sub-DMU 3.
Figure 4.
Schematic of the modified two-stage DEA model. x1: water resources input of Sub-DMU 1; x2: water resources input of Sub-DMU 2; w: output of Sub-DMU 1 and input of Sub-DMU 3; v: output of Sub-DMU 2 and input of Sub-DMU 3; y: output of Sub-DMU 3.
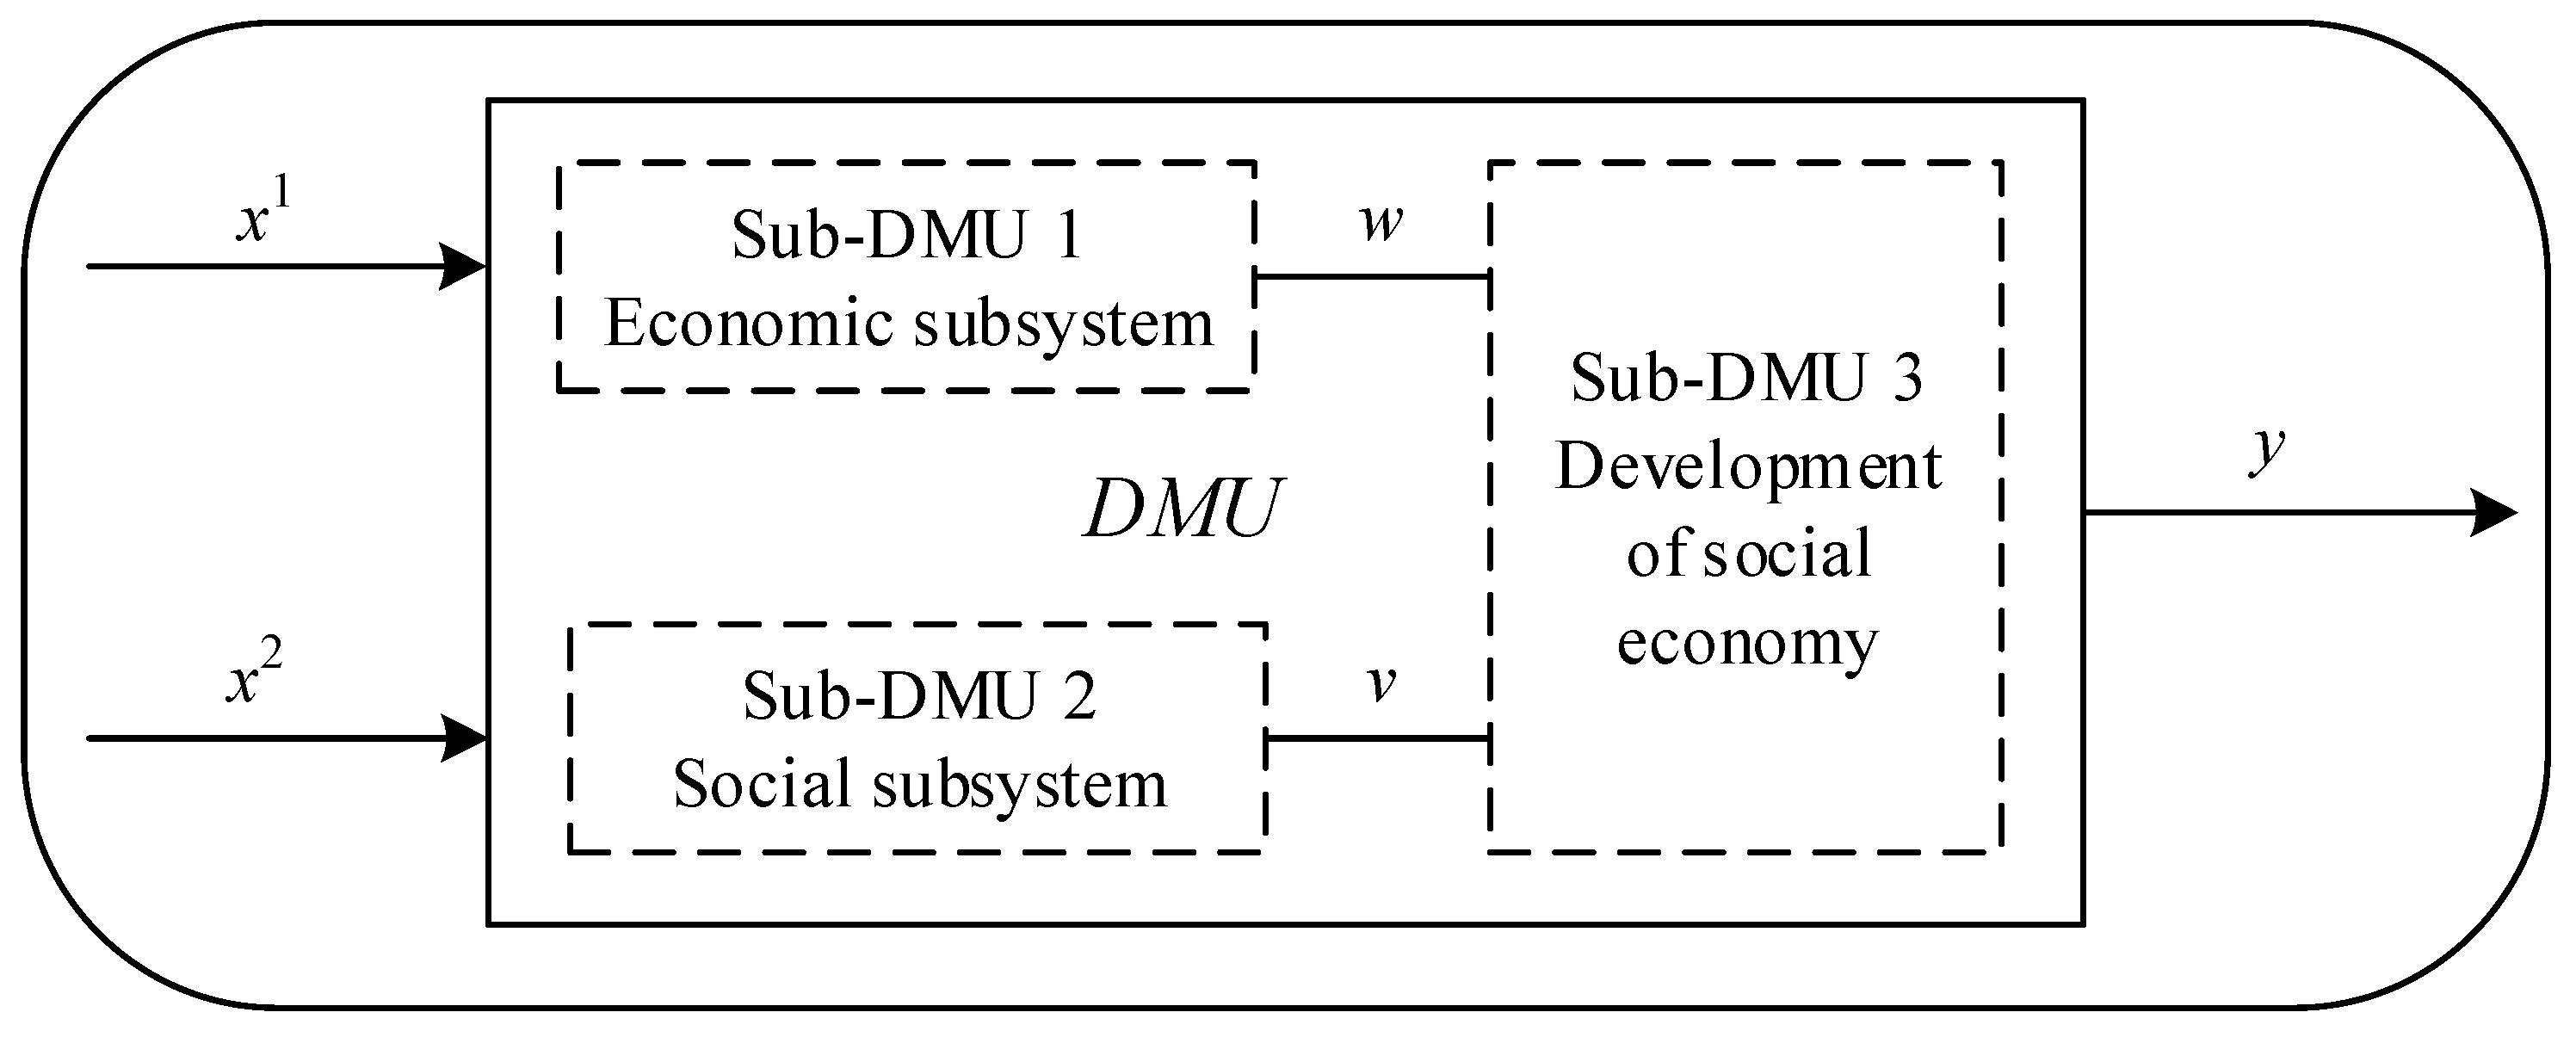
Figure 5.
Geographical locations of Gansu Province and its 14 cities (regions).
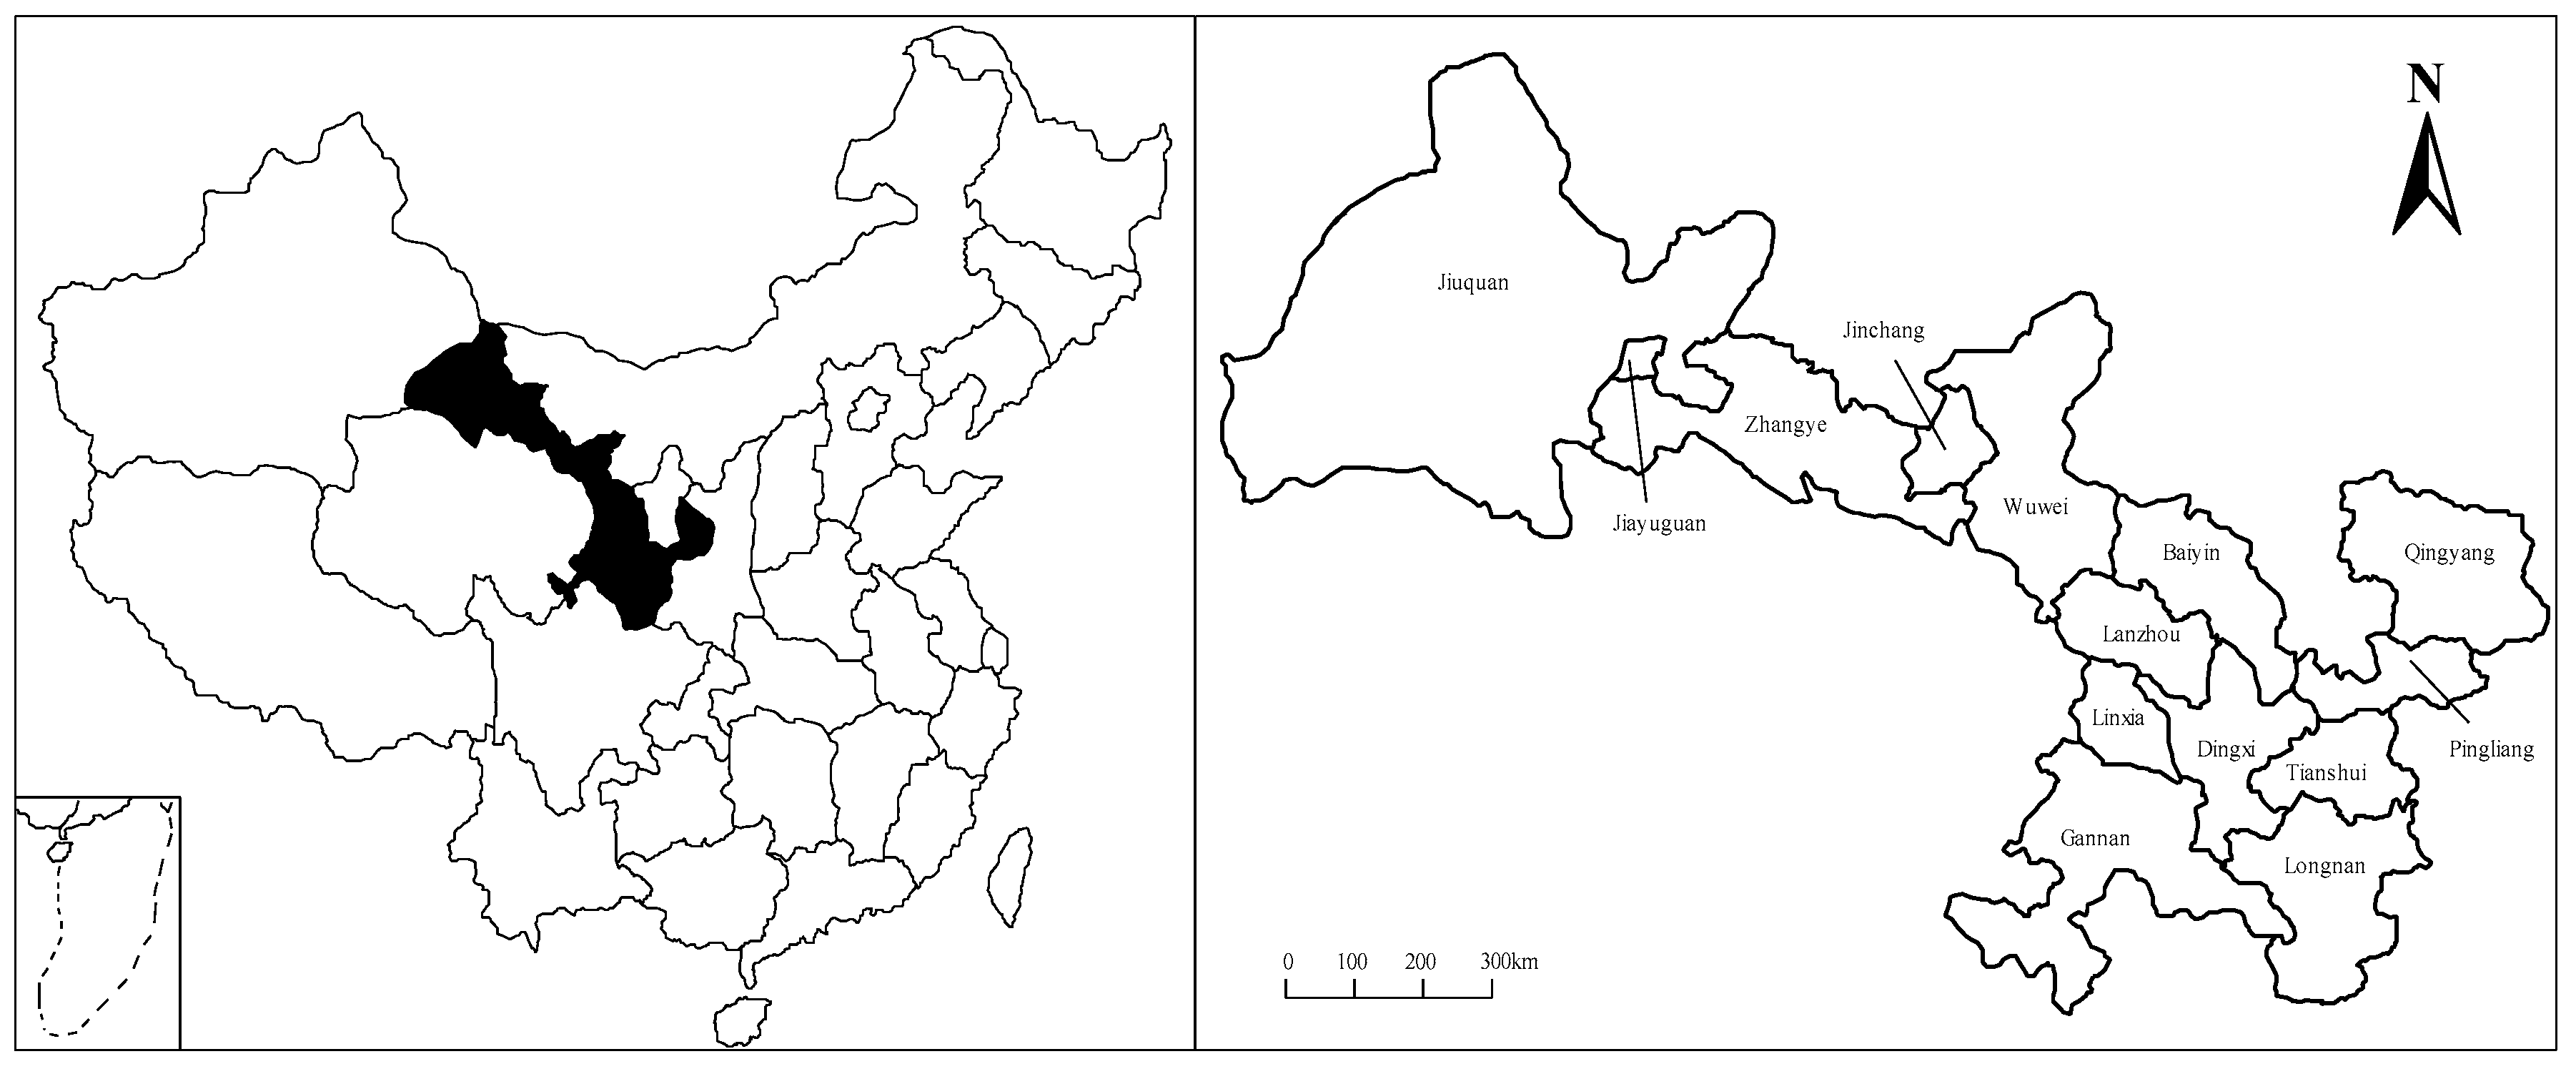
Figure 6.
Water consumption structures of the six representative cities.

| Different Substages | Input/Output Indicators |
|---|---|
| Sub-stage 1.1 social subsystem inputs | Water resources (108 m3) |
| Sub-stage 1.2 economic subsystem inputs | Water resources (108 m3) |
| Intermediate measures (stage 1 outputs and stage2 inputs) | Population (104 p) |
| Urban population proportion (%) | |
| GDP (108 yuan) | |
| Proportion of secondary, tertiary industry (%) | |
| Stage 2 outputs | Growth rate of population (%) |
| Growth rate of urban population (%) | |
| Growth rate of GDP (%) | |
| Growth rate of secondary, tertiary industry (%) |
| 2004 | 2005 | 2006 | 2007 | 2008 | |||||||||||
| α | β | θ | α | β | θ | α | β | θ | α | β | θ | α | β | θ | |
| Baiyin | 0.6878 | 0.2331 | 1 | 0.4038 | 0.0899 | 1 | 0.2901 | 0.0768 | 1.0432 | 0.4917 | 0.1070 | 1 | 0.2545 | 0.0614 | 1.1258 |
| Dingxi | 0.4136 | 0.7198 | 1.5290 | 0.3611 | 0.0537 | 1.0011 | 0.6275 | 0.1482 | 1.3699 | 1 | 0.1101 | 1 | 0.3590 | 0.1350 | 1.5474 |
| Gannan | 1 | 1 | 1 | 1 | 1 | 1 | 1 | 1 | 1 | 1 | 1 | 1 | 1 | 1 | 1 |
| Jiayuguan | 1 | 0.5955 | 1 | 0.8125 | 0.2456 | 1 | 0.8750 | 0.3519 | 1 | 0.8750 | 0.3669 | 1 | 0.7778 | 0.3584 | 1 |
| Jinchang | 0.7005 | 0.2492 | 1 | 0.8125 | 0.0530 | 1.0180 | 0.8235 | 0.1125 | 1 | 0.6667 | 0.1706 | 1 | 0.6364 | 0.0825 | 1.0404 |
| Jiuquan | 0.3663 | 0.0528 | 1.1939 | 0.2496 | 0.0313 | 1 | 0.2295 | 0.0316 | 1.1801 | 0.2874 | 0.0375 | 1 | 0.2563 | 0.0355 | 1 |
| Lanzhou | 0.3789 | 1 | 1 | 0.2433 | 1 | 1 | 0.0749 | 0.0436 | 1.0039 | 1 | 1 | 1 | 0.0707 | 0.0380 | 1.0221 |
| Linxia | 0.3236 | 0.3262 | 1.4379 | 0.2889 | 0.0737 | 1 | 0.3523 | 0.2198 | 1.2151 | 0.5963 | 0.1138 | 1 | 0.2917 | 0.1699 | 1.2965 |
| Longnan | 0.2363 | 0.6063 | 1.4128 | 0.2889 | 0.1038 | 1 | 0.734 | 0.2299 | 1 | 0.7432 | 0.2324 | 1 | 0.5 | 0.3004 | 1.3973 |
| Pingliang | 0.2555 | 0.5628 | 1.2554 | 0.3286 | 0.1414 | 1 | 0.4498 | 0.2163 | 1.0607 | 0.5428 | 0.2292 | 1 | 0.2414 | 0.1356 | 1.0609 |
| Qingyang | 0.3649 | 0.9306 | 1.1467 | 0.2817 | 0.4040 | 1 | 0.6021 | 0.8450 | 1 | 0.6357 | 0.9603 | 1 | 0.5354 | 1 | 1 |
| Tianshui | 0.1362 | 0.5376 | 1.1356 | 1 | 0.1414 | 1 | 1 | 0.2418 | 1 | 1 | 0.1931 | 1 | 0.1474 | 0.1599 | 1.2152 |
| Wuwei | 0.8108 | 0.0913 | 1 | 0.1327 | 0.0127 | 1.0047 | 0.2922 | 0.0387 | 1.1503 | 0.2700 | 0.0392 | 1 | 0.1333 | 0.0274 | 1.2892 |
| Zhangye | 0.4129 | 0.0889 | 1.4024 | 0.2889 | 0.0118 | 1.0076 | 0.3617 | 0.0302 | 1.2744 | 0.4419 | 0.0266 | 1 | 0.2857 | 0.0241 | 1.3173 |
| Average | 0.6747 | 0.5029 | 1.0988 | 0.5471 | 0.3179 | 1.001 | 0.5796 | 0.2561 | 1.0662 | 0.6858 | 0.3336 | 1 | 0.4572 | 0.2602 | 1.0641 |
| 2009 | 2010 | 2011 | 2012 | 2013 | |||||||||||
| α | β | θ | α | β | θ | α | β | θ | α | β | θ | α | β | θ | |
| Baiyin | 0.2244 | 0.0799 | 1.023 | 0.5439 | 0.1737 | 1 | 0.2462 | 0.0861 | 1 | 0.2852 | 0.0847 | 1.0361 | 0.6950 | 0.1297 | 1 |
| Dingxi | 0.2228 | 0.1152 | 1.1519 | 0.6532 | 0.4352 | 1 | 0.2112 | 0.1985 | 1.2530 | 0.3112 | 0.1250 | 1 | 0.4580 | 0.2811 | 1.0832 |
| Gannan | 1 | 1 | 1 | 1 | 1 | 1 | 1 | 1 | 1 | 1 | 1 | 1 | 0.9310 | 1 | 1 |
| Jiayuguan | 1 | 0.7566 | 1 | 1 | 0.8537 | 1 | 1 | 0.7839 | 1 | 1 | 0.5111 | 1 | 1 | 0.4581 | 1 |
| Jinchang | 0.5455 | 0.1480 | 1.0477 | 0.6756 | 0.2015 | 1 | 0.6763 | 0.1686 | 1 | 0.6475 | 0.1160 | 1 | 0.8439 | 0.1165 | 1 |
| Jiuquan | 0.5733 | 0.0878 | 1 | 0.6384 | 0.1082 | 1 | 0.3023 | 0.0345 | 1.0942 | 0.5403 | 0.0300 | 1 | 0.4957 | 0.0578 | 1 |
| Lanzhou | 0.5360 | 1 | 1 | 1 | 1 | 1 | 1 | 1 | 1 | 1 | 1 | 1 | 1 | 1 | 1 |
| Linxia | 0.2690 | 0.2026 | 1.1261 | 0.3773 | 0.2179 | 1.0567 | 0.2500 | 0.3287 | 1.2485 | 0.3268 | 0.1314 | 1.0191 | 0.3744 | 0.1648 | 1.0165 |
| Longnan | 0.2326 | 0.2595 | 1.1047 | 0.6315 | 0.4874 | 1 | 1 | 0.4870 | 1 | 0.3268 | 0.3973 | 1.1727 | 0.3843 | 0.5596 | 1.0913 |
| Pingliang | 0.2351 | 0.2268 | 1.1091 | 0.6660 | 0.5517 | 1 | 0.2154 | 0.3591 | 1.2238 | 0.4398 | 0.2759 | 1.1025 | 0.2605 | 0.3622 | 1.1462 |
| Qingyang | 0.9381 | 1 | 1 | 0.8810 | 1 | 1 | 0.8914 | 1 | 1 | 0.8627 | 1 | 1 | 0.8554 | 1 | 1 |
| Tianshui | 1 | 0.4576 | 1 | 0.2938 | 0.5559 | 1 | 0.1167 | 0.3159 | 1.1598 | 0.1254 | 0.2724 | 1.0657 | 0.3253 | 0.2309 | 1 |
| Wuwei | 0.2072 | 0.0468 | 1.3364 | 0.6761 | 0.0880 | 1 | 0.2546 | 0.0456 | 1.1901 | 0.7934 | 0.0596 | 1 | 0.7426 | 0.0703 | 1 |
| Zhangye | 0.2899 | 0.0320 | 1.2812 | 0.6694 | 0.0536 | 1 | 0.2766 | 0.0452 | 1.3593 | 0.4608 | 0.0367 | 1.2557 | 0.5635 | 0.0438 | 1 |
| Average | 0.6300 | 0.3922 | 1.0607 | 0.7020 | 0.4788 | 1.0015 | 0.8561 | 0.4321 | 1.1092 | 0.6933 | 0.3723 | 1.0382 | 0.7129 | 0.4048 | 1.0241 |
Note: α: relative use efficiency of social subsystem; β: relative water use efficiency of economic subsystem; θ: relative development efficiency of socioeconomic system.
| 2004–2005 | 2005–2006 | 2006–2007 | 2007–2008 | 2008–2009 | 2009–2010 | 2010–2011 | 2011–2012 | 2012–2013 | MEAN | |
|---|---|---|---|---|---|---|---|---|---|---|
| Baiyin | 1.291 | 1.159 | 1.178 | 1.228 | 1.0689 | 1.164 | 1.207 | 1.129 | 0.977 | 1.156 |
| Dingxi | 0.690 | 0.993 | 0.971 | 1.085 | 0.958 | 0.916 | 1.005 | 1.083 | 1.083 | 0.976 |
| Gannan | 2.098 | 1.025 | 1.041 | 0.868 | 0.956 | 1.068 | 1.107 | 0.938 | 0.754 | 1.095 |
| Jianyuguan | 0.935 | 1.011 | 1.022 | 0.936 | 1.054 | 1.042 | 1.171 | 1.022 | 0.928 | 1.013 |
| Jinchang | 1.031 | 1.371 | 1.331 | 0.952 | 1.071 | 1.071 | 1.109 | 0.971 | 0.915 | 1.091 |
| Jiuquan | 1.392 | 1.171 | 1.155 | 1.257 | 1.172 | 1.114 | 1.139 | 1.145 | 1.003 | 1.172 |
| Lanzhou | 1.082 | 1.010 | 1.152 | 1.139 | 1.142 | 1.184 | 1.233 | 1.243 | 1.282 | 1.163 |
| Linxia | 1.283 | 1.004 | 0.983 | 1.042 | 0.979 | 0.990 | 1.013 | 1.007 | 0.875 | 1.020 |
| Longnan | 1.141 | 0.967 | 0.981 | 1.323 | 0.827 | 0.977 | 1.004 | 0.968 | 1.303 | 1.055 |
| Pingliang | 1.069 | 1.023 | 1.020 | 1.069 | 1.005 | 1.067 | 1.139 | 0.975 | 1.395 | 1.085 |
| Qingyang | 2.037 | 1.118 | 1.070 | 1.120 | 0.678 | 0.998 | 1.308 | 1.432 | 1.113 | 1.208 |
| Tianshui | 0.924 | 0.979 | 1.009 | 1.00 | 0.978 | 1.047 | 1.066 | 0.957 | 1.155 | 1.013 |
| Wuwei | 1.159 | 1.244 | 1.164 | 1.209 | 0.956 | 1.258 | 1.197 | 1.163 | 1.128 | 1.164 |
| Zhangye | 0.906 | 1.074 | 1.140 | 1.146 | 1.093 | 1.120 | 1.215 | 1.095 | 1.129 | 1.102 |
© 2016 by the authors; licensee MDPI, Basel, Switzerland. This article is an open access article distributed under the terms and conditions of the Creative Commons Attribution (CC-BY) license (http://creativecommons.org/licenses/by/4.0/).
Share and Cite
MDPI and ACS Style
Ren, C.; Li, R.; Guo, P. Two-Stage DEA Analysis of Water Resource Use Efficiency. Sustainability 2017, 9, 52. https://doi.org/10.3390/su9010052
AMA Style
Ren C, Li R, Guo P. Two-Stage DEA Analysis of Water Resource Use Efficiency. Sustainability. 2017; 9(1):52. https://doi.org/10.3390/su9010052
Chicago/Turabian StyleRen, Chongfeng, Ruihuan Li, and Ping Guo. 2017. "Two-Stage DEA Analysis of Water Resource Use Efficiency" Sustainability 9, no. 1: 52. https://doi.org/10.3390/su9010052
Note that from the first issue of 2016, this journal uses article numbers instead of page numbers. See further details here.