Article

The Economic Efficiency of Urban Land Use with a Sequential Slack-Based Model in Korea

Global E-governance Program, Inha University, Inharo100, Nam-gu, Incheon 402-751, Korea
*
Author to whom correspondence should be addressed.
Sustainability 2017, 9(1), 79; https://doi.org/10.3390/su9010079
Submission received: 31 October 2016 / Revised: 24 December 2016 / Accepted: 4 January 2017 / Published: 9 January 2017

Abstract

:
Since the inauguration of the government-led five year economic plans in the 1960s, Korea has achieved remarkable economic development. Korea’s economic strategy, known as ‘The Miracle on the Han River’, focused on heavy and chemical industries such as ship building and petrochemicals and was based on resource intensive urbanization. This rapid urban development caused a series of problems, such as over-development in urban areas, bottlenecks in utilities, and environmental degradation. Nevertheless, the Korean government has recently moved toward deregulation of the greenbelts of major city areas. Since very few studies have analyzed the urban land use economic efficiency (ULUEE) in Korea, this paper assesses the feasibility of recent deregulation policy concerning the greenbelts utilizing the sequential slack-based measure (SSBM) model under environmental constraints across 16 South Korean cities from 2006 to 2013. Our research makes three significant contributions to urbanization research. First, this paper uses an SSBM model to analyze the dynamic changes of urban land use economic efficiency in Korea at the regional level; Second, this paper analyzes factors influencing ULUEE in Korea, and the feasibility of the deregulation policies on the greenbelts; Third, this paper suggests more performance-oriented policy alternatives to improve the ULUEE and implement sustainable greenbelt management.

1. Introduction

1.1. Background of the Research

A common phenomenon in developing countries is unplanned, and thus unexpected, urbanization mishaps. In most urbanized countries, opening of natural or agricultural land into built-up land is one of the major features of land use changes, predominantly in developing countries [1,2]. As urbanization proceeds rapidly in most developing countries, the selective concentration policies in strategic areas create excess demand for land due to the complex yet unexpected expansion of the urbanization process. Unfortunately, this unbalanced urbanization may create great inefficiency in land use [3,4]. Due to this fact, the Korean government uses the greenbelts of the city boundaries to accommodate the excess demand for land use. However, when the green, natural land is transformed during the urbanization process, achieving future sustainability is a daunting challenge, and there is often irreversible loss for future generations. Therefore, urban expansion should be carefully and efficiently implemented, with complete sustainability prioritized in deregulation policies to increase the land for apartments in urban areas as well as to boost the regional economy in rural areas. The Korean government has taken measures to transform the greenbelt regions into built-up land.
In general, inefficient land use shapes are connected with rapid population growth inside and outside of suburbs [5]. Unexpected rapid urbanization has resulted in the rapid loss of arable land for many areas [6,7,8]. The rapidly expanding built-up land and associated land use have resulted in countless undesirable environmental and social effects [9,10,11], such as traffic jams, resource shortages, housing shortages, loss or reduction of biodiversity, and pollution [12,13,14,15]. The threatening factors of greenfield transformation by urban extension are best understood in relation to their various and substantial ecological effects resulting from complicated yet increased disturbance of the natural environment [16,17,18,19,20].
It is not easy to expand the city borders to alleviate urbanization issues, because once land is developed, it is irreversible [20], creating more severe urbanization problems due to the larger scale of urbanization, and it requires large amounts of time and money to recover the natural environment. Prior to implementation of deregulation policies, the promotion of increasingly efficient practices for existing urban land will be extremely important for the sustainable development of the city, because the transformation of land use may result in enormous costs, and most of these costs are irreversible when the environmental demand is higher than its urbanization use [21].
From an economic standpoint, land supply is inelastic. Raising land use efficiency allows for the same economic output while slowing the land transformation for economic activities. This implies that improving the urban land use economic efficiency (ULUEE) is an effective method for alleviating diverse urbanization problems and realizing sustainable urban management [1].
Due to the increased population coupled with the average household down-sizing in recent years, South Korea has converted increasing amounts of greenbelt for metropolitan development. Many metropolitan cities such as Seoul and Incheon have met with urbanization problems in the urban expansion mode [22]. Bhatta et al. [23] emphasized “general consensus that urban sprawl is characterized by unplanned and uneven pattern of growth, driven by multitude of processes and leading to inefficient resource utilization.” Because of the negative effects such as loss of natural space and damage to the natural habitat, extensive urban growth is generally considered undesirable.
Against this backdrop, many regulatory policies have been planned and applied. Therefore, to preserve farmland, urban containment policies have emerged as a popular method [24], including the management of greenbelts for conserved lands around cities. The Korean greenbelt system was promulgated in 1971. It became the legal platform for anyone to utilize land on this restricted development zone [24].
Greenbelts in South Korea can be considered one of the successful environmental-friendly regulations in Asian countries [25], due to effective preservation of nature surrounding the cities, as well as restraining extensive development. However, Korean greenbelt policies have been deregulated in recent years in response to urban expansion demand for sustainable new town development. The planning agendas such as smart growth and the compact city are all explicit or implicit responses to excessive urban extension [26]. Due to this urgent demand, the greenbelt of Korea has been experiencing adjustment and partial removal since its inauguration in 1971. Since the year 2001, 3862 square kilometers of the Korean greenbelts, meaning 3.9% of the total land area has been transformed into built-up land [27].
On 26 April 2016, however, the Korean government introduced the Urban Master Plan to set the direction of long-term economic development and the future image of cities, featuring deregulation adjustment for sustainable development [24]. The Urban Master Plan sketches out the large-scale transformation of the greenbelts into land for development, adding to the conflict between companies seeking new investment opportunities and the public demanding sustainable policy. Government has made a series of regulatory policies and laws for environmental protection, including the greenhouse gas reduction (GHG) law and low-carbon green growth law, as well as commitments to save environmental resources and to promote green production and consumption [1]. Additionally, the Korean government regulated industrial emissions limits to improve environment-friendly efficiency in industries. In order to enhance the citizens’ life quality, environment-friendly policies should extend to land transformation as well.
Unfortunately, the current economic downturn forced the Korean government to deregulate the greenbelts in order to boost regional economies. Due to the strict regulation, most city borders have been protected, resulting in their lower stable land price. However, due to the urgent demand on the regional development, the deregulation on the land means easier transformation of open, natural land to built-in land, resulting in huge unexpected booms on these land. There are no management strategies affecting the four elements of urban environmental conditions, meaning noise, indoor air quality, artificial lighting, and pollution, within the Urban Master Plan [24,26].
Challenges in analyzing land use efficiency, such as ULUEE, were first studied to describe the peripheral form of urban land usage [1]. Most of these studies are based on the historical urban land use experiences [28]. Subsequently, economics and econometric models are introduced to the research of urban land. The economic models argued that the regulation of the land market can achieve the optimal allocation of land resources and realize the effective utilization of land resources [1]. In addition, social behavior researchers put forward the humanistic idea in urban land use study, emphasizing the human and other related factors in the process of urban land resource allocation [29]. Researchers from political economics emphasized political power over the influence of city land utilization, focusing on the main political factors affecting the efficiency of urban land use [30,31].
In 1993, 42% of semi-agricultural and forested areas were transformed into built land areas by the Korean government. As the pace of economic development increased, huge urban extension has claimed suburban forest and natural land resources [32]. In South Korea, 5% of the people own 65.2% of private land, and thus there is great opportunity for these private land owners to realize massive profits through land speculation regarding deregulation policies. Therefore, the purpose of this study is to analyze land use efficiency to answer whether the urban land use in Korea is efficient, and whether the Korea Urban Master Plan can deliver efficiency and sustainability as an environmentally friendly initiative.

1.2. Current Situation of the Korean Greenbelt Policies

The focus of this research includes all land area of the Republic of Korea (hereafter, Korea), covering 100,560.87 km2 (Figure 1) [33]. Including the landfill expansion of the reclaimed land from 1985 to 2005, in the last 30 years Korea’s land area has risen by 1%, and the income level by 27% and population has increased by 27% times over the same period of 1985 through 2005 [34]. As population density has increased, particularly in the suburban areas of major cities, many problems have developed. To overcome these urban challenges, the Korean government has transformed the greenbelts into built-land, resulting in 16% decrease of agricultural forest with 55% increased residential area and 96% increased roads (see Table 1) [34].
Selective concentration of economic development policies in major city areas have drawn numerous migration from the country into the cities. The urbanization rate of Korea increased from 39.1% to 90.5% for a period of 1960–2008, with the rapid nationwide population increase from 25 million to 48.9 million during the same period [34]. The current population of Korea is estimated at 51,529,338 in 2015 (see Table 1), and 49.7% (25,140,000) of the population lives in Seoul, Incheon, and Gyeonggi-do. In recent years, metropolitan type of expansion has accomplished especially in Seoul and its vicinity. Approximately half of the nation’s population now lives in Seoul and its surrounding suburban areas [34]. Due to this deepening urbanization, the bipolarization of real estate prices has become more severe in Korea.
There is high demand for new houses in the southern part of Seoul, particularly in Gangnam, resulting in prices skyrocketing for apartments, while the rural areas lack government support for real estate development. This bipolarization of real estate development may result in challenges for the Korean government for their uniform measures. Contrasting with many vacant apartments in rural areas, there are also huge housing shortages in urban areas, with more than 100 people bidding for one new apartment in the Gangnam area. Due to this bipolarization within the real estate market, the Korean government has to change its policy paradigm quickly and frequently between the strengthening and weakening regulations for the real estate market. Therefore, the government has to apply deregulation policies more thoughtfully with greenbelts in order to solve apartment shortages in urban areas, and to boost investment in manufacturing facilities. The Korean government has taken measures to transform the greenbelt regions toward built-land.

2. Methodologies and Data

2.1. Sequential Slack-Based Measure (SSBM) Model

Data envelope analysis (DEA) was used to analyze the complex process of land transformation policies, because DEA can deal with multiple inputs and outputs simultaneously and does not require any prior information on the theoretical frame of the production function [1,36]. In general, DEA models assume an efficiency gap between optimal and actual resource allocation, which is called the slack variable, implying the output shortage or input surplus in the decision making unit (DMU) [1,36]. Since the traditional radial DEA models do not consider these slack variables in the objective function, it can produce inaccurate results in efficiency evaluations. In order to overcome this difficulty, a new approach called the non-radial and non-parametric slack-based measure (SBM) model has been developed [1,36], incorporating the slack variables directly into the objective function. Considering the dynamic change of production technology during the research period, the sequential slack-based measure (SSBM) model will be introduced to incorporate the concept of sequential production technology over time. This SSBM is crucial to analyze the land use efficiency over time. Based on Zhang’s and Xie’s approaches on SSBM [1,36], we try not only to consider industrial wastewater and industrial sulfur dioxide as undesirable outputs, but also to add noise status to analyzes factors influencing ULUEE in Korea, and the feasibility of the deregulation policies on the green belts. Suppose for N Decision Making Units (DMUs), every DMU demands M inputs (x) for J desirable outputs (y) with K undesirable outputs (b) as well. In our research, these will be evaluated using the vectors x R M , y R J , b R K , and our matrix X, Y, B are defined as X = [ x 11 , x M N ] R M × N , Y = [ y 11 , y M N ] R J × N , B = [ b 11 , b M N ] R K × N , X > 0, Y > 0, B > 0.
Based on these definitions, the production technology can be defined as follows:
P = {s: y, b) | x can produce (y, b), xXλ, y, b, λ ≥ 0}
where P is assumed to satisfy the theory of production function [1,37]. Production technology will change over time, and thus, the constraints of the variable returns to scale (VRS) are imposed on the objective function. Then, the optimization problem of sequential SBM (SSBM) planning will take the following form:
ρ * = min 1 1 M m = 1 M ( s m 0 x x m 0 ) 1 + 1 J + K ( j = 1 J s j 0 y y j 0 + k = 1 K s k 0 b b k 0 ) S . T . { x 0 = t = 1 T X t λ n t + s 0 x y 0 = t = 1 T Y t λ n t s 0 y b 0 = t = 1 T B t λ n t + s 0 b n = 1 N λ = 1 , s 0 x 0 , s 0 y 0 , s 0 b 0
where m, k, and j denote the indexes of inputs, desirable outputs and undesirable outputs discretely; t (t = 2003, …, 2013) denotes the year, and the subscript denotes the decision making unit’s estimation in the model; sx* denotes the slack variables of inputs, sy* and sb* denote desirable outputs and undesirable outputs respectively; and ρ and λ denote the efficiency of DMU estimation and the non-negative multiplicative vector respectively in the model.
When ρ* = 1, the DMU is on the perfect, efficient position on the production possibility curve. When ρ* < 1, the DMU is inefficient, and thus it is necessary to modify the input-output structure. In order to increase DMU efficiency, we had better adjust the form x* = Xλ + sx*, y* = Yλ − sy*, and b* = Bλ + sb* so we can carry out the efficiency evaluations confronting with undesirable outputs by SBM model.
On the other hand, we can analyze the slack variable ratios of inputs, desirable outputs and undesirable outputs to find out how to enhance the input–output efficiency.
The ratio of input surplus is proportion of input reduction as follows:
X ¯ = 1 M m = 1 M ( s m 0 x x m 0 )
Insufficient expectation output ratio is the proportion of increased desirable output:
Y ¯ = 1 J j = 1 J ( s j y y j )
The ratio of redundant undesirable output is the proportion of undesirable output reduced:
B ¯ = 1 K k = 1 K ( s k b b k )

2.2. Selection of Input and Output Indicators

Efficiency of land use is influenced by economic, social and environmental factors [4,31,36], so we must consider both environmental and economic performance. Our research constructs an integrated indicator evaluating efficiency of land use, using input and output data described in Table 2. First, the main input factors consist of land, capital, and labor for the differentiated land use efficiency. Due to the objects of this study focused on Korean greenbelt areas, built-up area is selected as the land input, and the total investment in fixed assets is selected as capital inputs. The number of employees in the manufacturing and service industries is selected as the labor inputs.
Based on these input factors, the value added in manufacturing and service industries is selected as desirable outputs, and industrial chemical emissions, industrial wastewater and city noise as undesirable outputs. The undesirable outputs from the model are based on the three factors of chemical emissions, wastewater and industrial noise, all resulting from the transformation of natural land into built-land. The ULEE will be measured at the first stage of our research based on these input and output indicators. Based on all the outputs of DMUs, we want to find the best performance and based on that best performance, we shall measure the relative efficiency of all the inputs of DMUs.

2.3. Econometric Model and Data

This research is based on the stepwise approach to find out the sustainable factors of the greenbelt deregulation policies. The measured level of ULEE in the first stage will be used as a dependent variable to determine the sustainable factors on this ULEE by the panel data regression model in the second stage. In order to determine the external variables on the input variation, we shall draw the candidate variables from the comparative analysis on the preceding papers, and all these argued issues on the pressure for the transformation of the land use shall be used as independent variables in our model.
In general, the increased per capita GDP will enhance the input efficiency or vice versa. This is because a region with relatively high per capita GDP may have a better quality of economic development, resulting in enhanced input efficiency, such as urban land use economic efficiency [38]. Thus, we assume that there is a progressive relationship between per capita GDP and ULUEE. In addition, increase in land use efficiency will produce more economic value. Thus, we assume that there is a bidirectional relationship between ULUEE and land use intensity. As is well known, the higher urbanization rate, economic development and the production technological improvement, and land use efficiency are all interrelated each other [39]. Therefore, we assume that there is a positive relationship between ULUEE and urbanization rate. The carbon green growth law conserves water, electricity gas, and promotes green production, leading to a high efficiency of land resource use. Thus we assume that there is a positive relationship between the low carbon green growth law and ULUEE.
Based on these arguments, we introduce the multivariate linear regression model to analyze the ULUEE determinants in Korean cities as follows:
y i t = α i t + β 1 P G D P i t + β 2 L U I i t + β 3 U R B i t + β 4 L C P i t + μ i t
where i (i = 1, ..., 16) and t (t = 2006, ..., 2013) denote city and year respectively. The term αit denotes a constant, and μit is the random error term. The term yit denotes the ULUEE for the city i and PGDP denotes the GDP per capita. LUI denotes the land use intensity, with every square kilometers of land for the economic value. URB denotes the urbanization rate, referring to the urban population proportion of the total population in the city. LCP refer to the low carbon green growth law.
This paper uses data from 2006 to 2013 accessed from the Korea statistical websites [34,35]. All the data from 16 cities, accounting for all Korean cities, will be used for our empirical tests.

3. Empirical Results

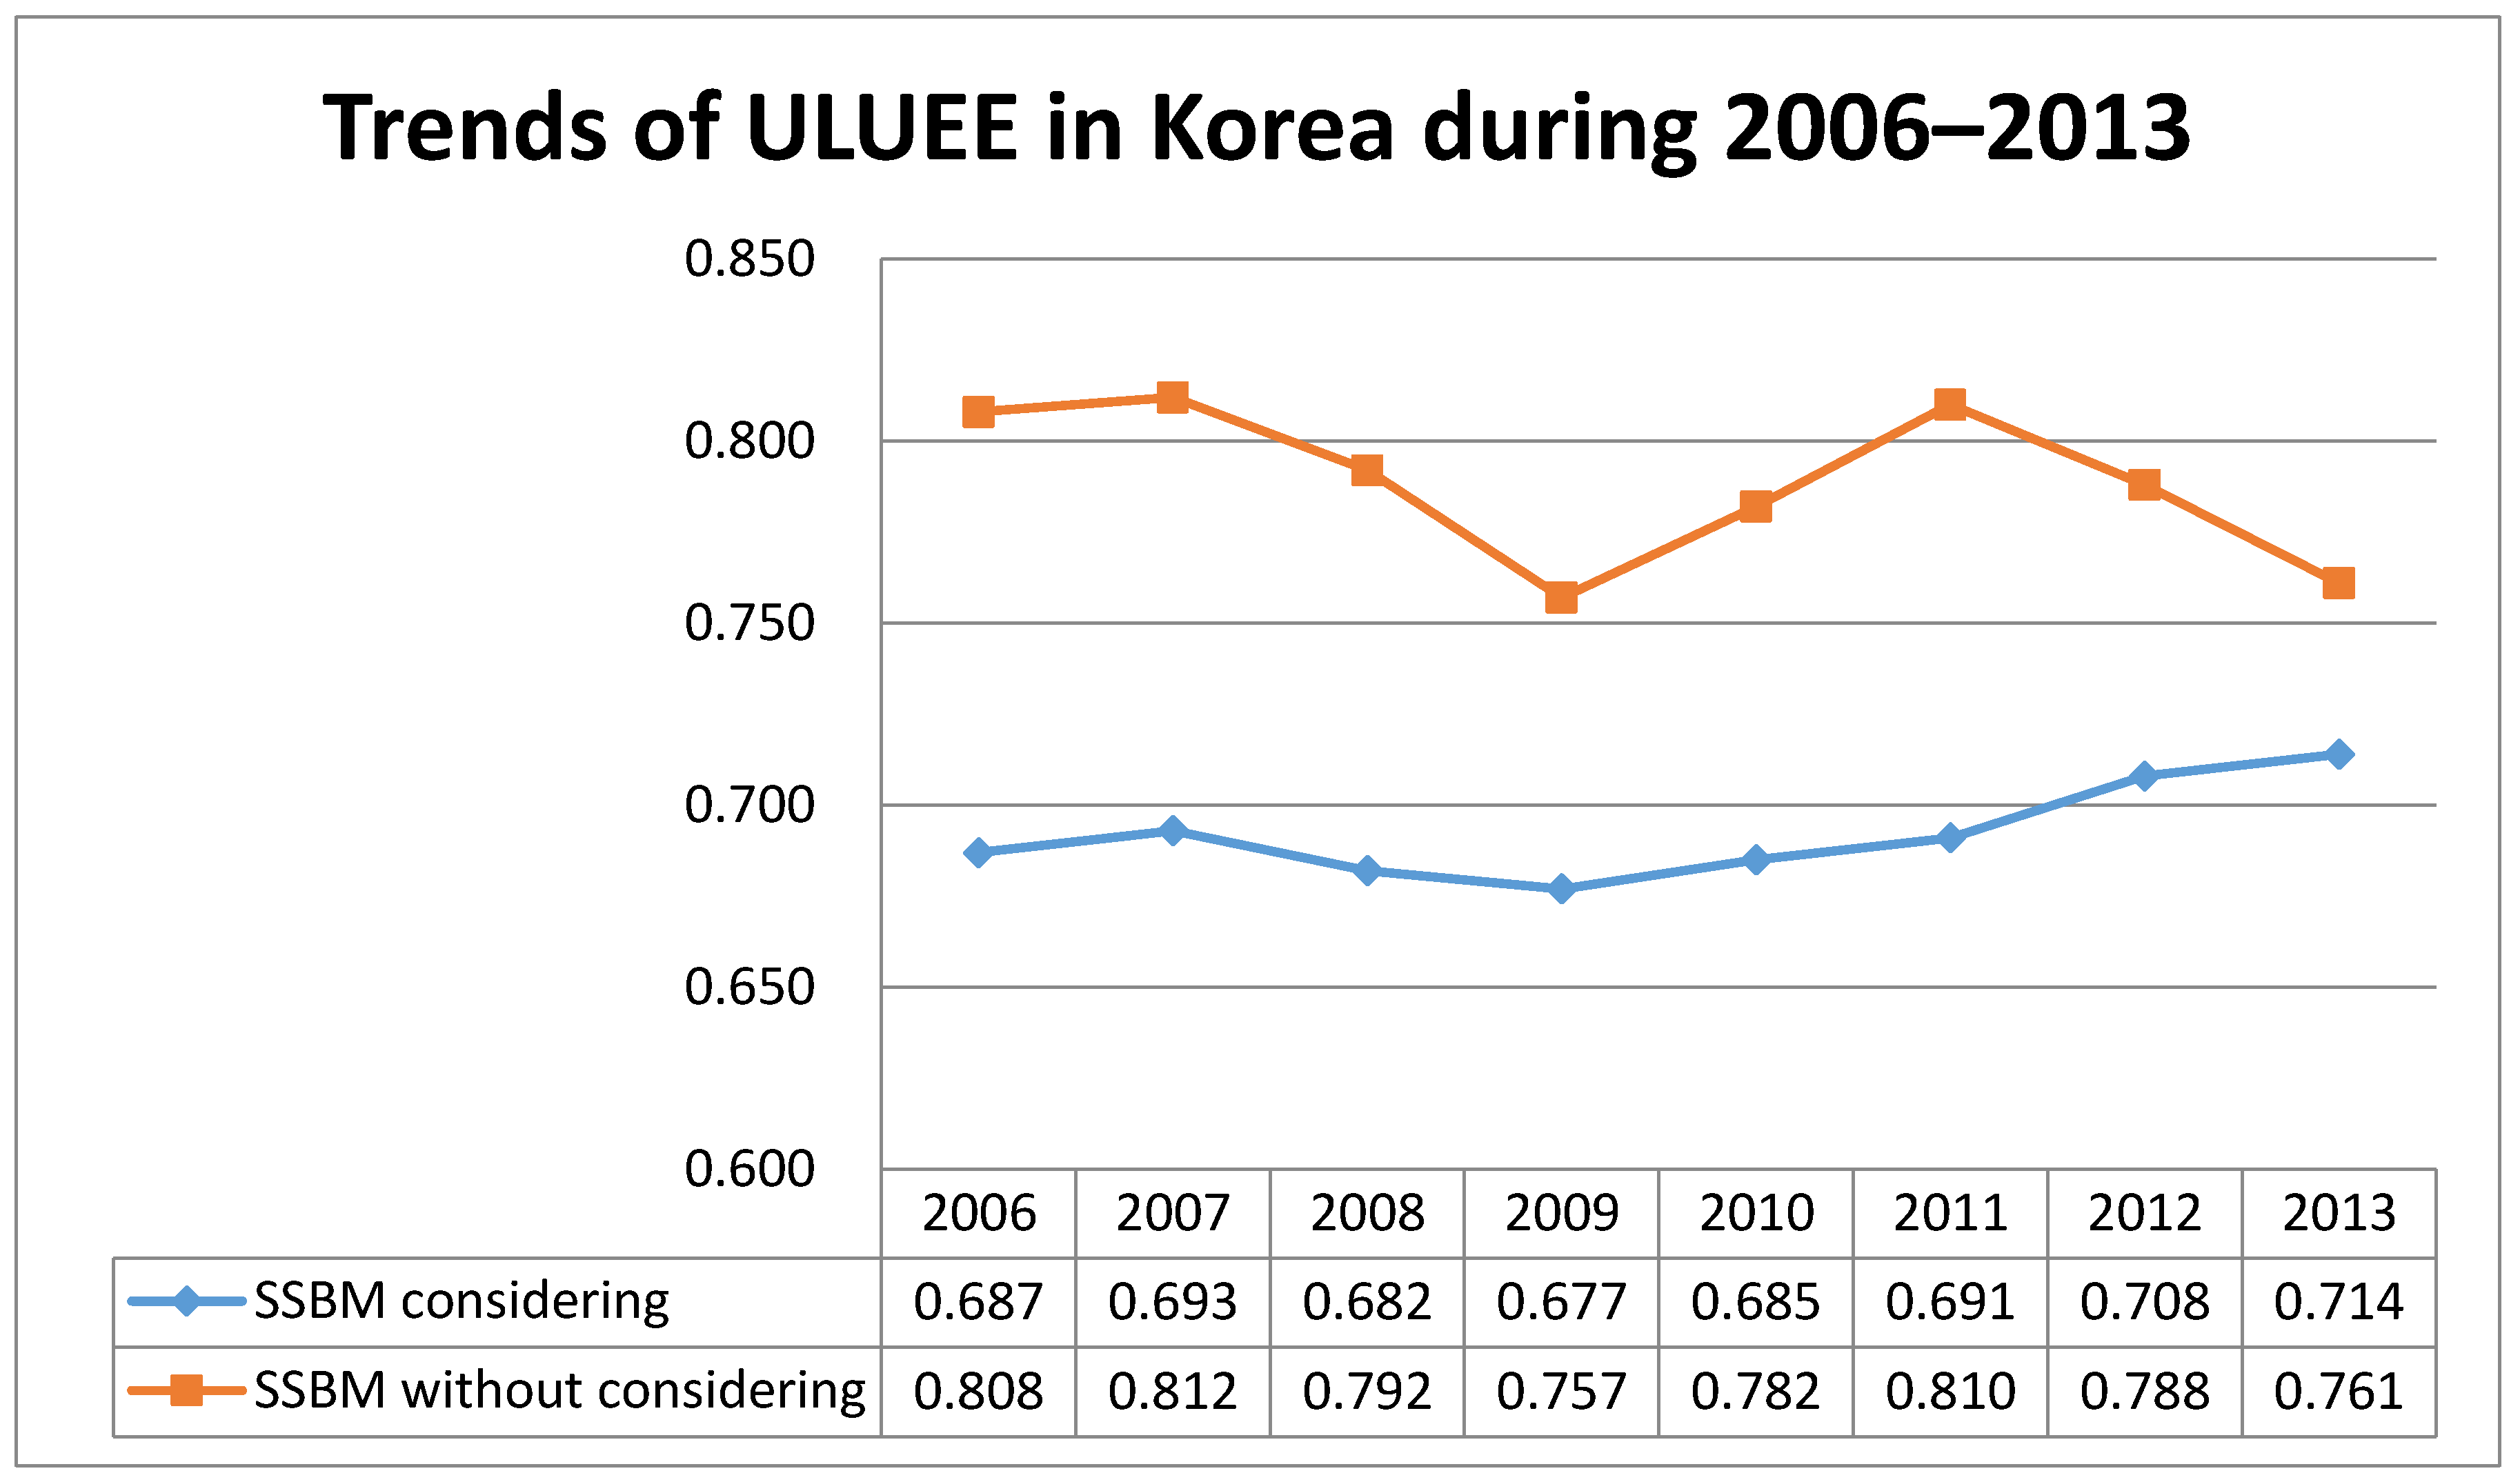
3.1. Empirical Results of Land Use Efficiency

The ULUEEs for 16 cities in Korea during 2006–2013 was computed using the SSBM model as shown in Table 3. For comparison, the ULUEE was calculated with as well as without undesirable outputs. As expected, the ULUEE values with the undesirable outputs are less than for ULUEE without considering the undesirable outputs all over the research period, with scores between 0.692 and 0.789. This implies that undesirable outputs certainly influence ULUEE. Ignoring undesirable outputs could result in overestimation of land use efficiency, and thus we will adopt land use efficiency with undesirable outputs using the SSBM model.
ULUEE in Korea was consistently low during the research period, and economic risks during 2008 resulted in its lowest point as shown in Table 3. In 2012–2013, the ULUEE values with and without considering undesirable outputs yielded similar results. This may be due to increased environmental protection laws, such as the low carbon green growth law. This implies that government regulation has significantly increased the ULUEE with undesirable outputs. Thus, Korea has made great achievements in environmental protection performance.
Seoul, Ulsan, Chungnam, and Jeju consistently feature relatively high ULUEE scores compared with Korean cities from 2006 to 2013, as shown in Figure 2. Jeju island is an underdeveloped province, with the industrial layout mostly focused on tertiary industry such as tourism, but exhibits relatively high economic output and low environmental pollution relative to other Korean cities studied. This result in Jeju may come from the intensive environmental promotion policies by the central and local governments. Incheon, Busan and Gyeonggi provinces have emphasized policies for environment-friendly sustainable development, resulting in the continuing enhancement in the land use efficiency. However, it is challenging to achieve higher urban land use efficiency in other regions due to the conflict between economic development (desirable output) and environmental pollution (undesirable output).
In summary, the regions such as Seoul and Ulsan with more advanced economies show enhanced performance in ULUEE due to the advantages of easily accessible capital and technology, which can alleviate bottleneck problems in resource allocation and utilization. This enables for equilibrium between economic development and environmental protection problems. One interesting phenomena is evident in Gyeonggi province, which featured one of the lowest ULUEE before 2008. Gyeonggi province is just located as the surrounding areas of metro Seoul area, and thus the local government has emphasized on the better quality of sustainable development, resulting in the utmost front of the land use efficiency. Recently, Gyeonggi province has experienced a large influx of immigration, with lower production costs and living expenses representing driving factors. With these driving factors, Gyeonggi province has focused on its ULUEE enhancement compared with other provinces, implying that urbanization possibly accompanies higher ULUEE.

3.2. Influencing Factors of the ULUEE

From Equation (6), we used the fixed effect model to explore the explanatory factors influencing ULUEE. In the Table 4, the results of the panel data regression are shown for 7 Korean cities and 9 provinces. Per capita GDP (PGDP), urbanization rate (URB), and land use intensity (LUI) show significantly positive impacts on ULUEE, which is consistent with our hypotheses. This implies that regional economic development, accompanied by the urbanization process, will enhance its land use efficiency and more intensive use of land will result in improved land use efficiency. Therefore, in order to enhance land use efficiency, more land-intensive economic development is required and government policies should emphasize land-saving development, by e.g., subsidizing the remodeling of existing apartments instead of rebuilding or reconstructing. This is because remodeling provides more land-intensive utilization without stimulating speculation, while rebuilding or reconstructing will result in costs skyrocketing and increased speculative competition on new apartments.
However, the low carbon green growth law (LCP) shows a significantly negative impact on ULUEE, which is inconsistent with our hypotheses. This implies that stronger regulation on green growth policies restricts the innovative use of land, and thus there is a lack of effective improvement of land efficiency resulting from strict environmental regulation. Greenbelt policies have restricted the conversion of land use, resulting in the worsening of land use efficiency. It is noteworthy that the strong greenbelt policies are not only effective at limiting urban sprawl but also deteriorate land use efficiency. It is crucial for government to persuade land owners to promote land use efficiency and, thus, regional governments face claims against the greenbelts from land owners. However, once the government allows greenbelts to be used for built-use purposes, then the price of the land will increase, resulting in speculative pressures on the government policies. It is challenging for local governments to promote low-carbon green growth policies on land use as well as avoiding worsening land use efficiency. This implies that there are new challenges in the harmonization of green growth with land use efficiency, and government should work with the private sector to improve land use efficiency.

4. Conclusions

In this study, we empirically tested the dynamic trend of urban land use economic efficiency (ULUEE) and its determinant factors with various constraints under Korean government policies, in 16 cities and provinces across the South Korean peninsula from 2006 to 2013. Since SSBM measures land use efficiency changes over time, our empirical results conclude that there has been limited improvement in land use efficiency. Nevertheless, greenbelts have been transformed into built-in land at an excessively ambitious rate for the appropriate realization of subsequent benefits, and this has resulted in problems associated with speculation. There are many companies seeking high rates of return on land investment, and thus there is a strong tendency for these companies to want additional investment in suburban areas, especially in greenbelt areas.
This paper found that economic development in Korea promoted land use efficiency from diverse perspectives. Unfortunately, this land-saving economic development should be reevaluated due to greater building susceptibility to damage from weather-related phenomena such as earthquakes, severe rainfall, and city floods. The uniformity of apartments does not improve the quality of the life for residents. With the population decreasing nationwide, these uniform apartment buildings are unlikely to promote sustainable development of land use within the traditional land-saving paradigm. Within this context, the Korean government issued a new urban development plan featuring higher flexibility for transforming the greenbelts into built-in land for regional economic recovery from the current recession and decreasing corporate investment. Many leading companies in Korea, such as Samsung, LG, and Hyundai car group, have been reducing investment due to the gloomy economic environment. Local governments want to encourage these companies to boost the local economy. This is particularly true for the construction industry, which is well known for its leading role of providing economic spillover effects. Unfortunately, building new apartment complexes may promote the speculative opportunities as well. However, economic development harmonized with land use efficiency enhancement is more effective due to the new paradigm of promoting low-carbon green growth policies. Thus, government and the private sector should cooperate to promote land-saving economic development from the city center and the remote areas, instead of easy but risky deregulation of the greenbelts.
The main conclusions from this paper include three implications and suggestions. First, for government policies to be sustainable, it is necessary to consider undesirable outputs, such as industrial chemical emission and water problems, in evaluating ULUEE. This is because undesirable outputs have negative effects on the ULUEE. Our results show that even if the overall land use efficiency has not improved, the environmental land use efficiency has significantly improved, implying that more precise regulatory measures on ULUEE are required for the sustainable performance of the greenbelt areas.
Second, regions with more developed economies such as Seoul showed better performance in urban land use resulting from the advantages of easily accessible capital, technology and other resources such as appropriate land. This highlights economic development with higher mobility of resources can effectively solve the bottleneck problems in the process of resource allocation and utilization between economic development and environmental protection. Therefore, in order to enhance the ULUEE, the government should utilize the positive influence of economic development on social and environmental performance, implying that the surrounding areas of city center development should precede opening of the greenbelt areas.
Third, even less developed provinces such as Jeju-do can achieve harmonized land use efficiency enhancement through the appropriate public private partnership (PPP). Economic development is not the only way to improve land use efficiency. Land use efficiency is enhanced when the private sector participates voluntarily in the movement toward more resilient cities, such as slow cities and/or smart cities oriented toward improving quality of life, safety, and restoration capacity. To avoid the creation of ghost towns, government needs to cooperate with the private sector to enhance environment-friendly land use efficiency, and PPP could play a significant role in addressing future sustainability challenges.
In this paper, we used a sequential slack-based measure (SSBM) model to examine the dynamic ULUEE in South Korea. For future research, we should mention our study’s limitations, such as three undesirable outputs in the form of industry chemical emissions, industrial wastewater and city noise, meaning carbon dioxide emissions and light emissions are not considered in our research due to unavailability of data, but the inclusion of more appropriate variables in our model would certainly broaden its implications for urbanization policies.

Acknowledgments

This work is supported by Inha University Research Fund.

Author Contributions

Yongrok Choi conceived and designed the experiments; Na Wang performed the experiments; Choi and Wang analyzed the dataChoi and Wang wrote the paper.

Conflicts of Interest

The authors declare no conflict of interest.

References

  1. Xie, H.; Wang, W. Exploring the Spatial-Temporal Disparities of Urban Land Use Economic Efficiency in China and Its Influencing Factors under Environmental Constraints Based on a Sequential Slacks-Based Model. Sustainability 2015, 7, 10171–10190. [Google Scholar] [CrossRef]
  2. Michael, F.L.; Noor, Z.Z.; Figueroa, M.J. Review of urban sustainability indicators assessment—Case study between Asian countries. Habitat Int. 2014, 44, 491–500. [Google Scholar] [CrossRef]
  3. La Rosa, D.; Barbarossa, L.; Privitera, R.; Martinico, F. Agriculture and the city: A method for sustainable planning of new forms of agriculture in urban contexts. Land Use Policy 2014, 41, 290–303. [Google Scholar] [CrossRef]
  4. Wang, H.; He, Q.; Liu, X.; Zhuang, Y.; Hong, S. Global urbanization research from 1991 to 2009: A systematic research review. Landsc. Urban Plan. 2012, 104, 299–309. [Google Scholar] [CrossRef]
  5. Chen, Y.; Chen, Z.; Xu, G.; Tian, Z. Built-up land efficiency in urban China: Insights from the General Land Use Plan (2006–2020). Habitat Int. 2016, 51, 31–38. [Google Scholar] [CrossRef]
  6. Koopmans, T.C.; Beckman, M.J. Assignment Problems and the Location of Economic Activities. Econometrica 1957, 25, 53–76. [Google Scholar] [CrossRef]
  7. Mariola, M.J. Losing ground: Farmland preservation, economic utilitarianism, and the erosion of the agrarian ideal. Agric. Hum. Values 2005, 22, 209–223. [Google Scholar] [CrossRef]
  8. Salvati, L. Agro-forest landscape and the ‘fringe’ city: A multivariate assessment of land-use changes in a sprawling region and implications for planning. Sci. Total Environ. 2014, 490, 715–723. [Google Scholar] [CrossRef] [PubMed]
  9. Foley, J.A.; DeFries, R.; Asner, G.P.; Barford, C.; Bonan, G.; Carpenter, S.R.; Chapin, F.S.; Coe, M.T.; Daily, G.C.; Gibbs, H.K.; et al. Global consequences of land use. Science 2005, 309, 570–574. [Google Scholar] [CrossRef] [PubMed]
  10. Ann, T.W.; Wu, Y.; Zheng, B.; Zhang, X.; Shen, L. Identifying risk factors of urban-rural conflict in urbanization: A case of China. Habitat Int. 2014, 44, 177–185. [Google Scholar]
  11. Kandziora, M.; Burkhard, B.; Mueller, F. Interactions of ecosystem properties, ecosystem integrity and ecosystem service indicators-A theoretical matrix exercise. Ecol. Indic. 2013, 28, 54–78. [Google Scholar] [CrossRef]
  12. Schetke, S.; Haase, D.; Koetter, T. Towards sustainable settlement growth: A new multi-criteria assessment for implementing environmental targets into strategic urban planning. Environ. Impact Assess. Rev. 2012, 32, 195–210. [Google Scholar] [CrossRef]
  13. Scolozzi, R.; Geneletti, D. A multi-scale qualitative approach to assess the impact of urbanization on natural habitats and their connectivity. Environ. Impact Assess. Rev. 2012, 36, 9–22. [Google Scholar] [CrossRef]
  14. Verbyla, M.E.; Oakley, S.M.; Mihelcic, J.R. Wastewater infrastructure for small cities in an urbanizing world: Integrating protection of human health and the environment with resource recovery and food security. Environ. Sci. Technol. 2013, 47, 3598–3605. [Google Scholar] [CrossRef] [PubMed]
  15. Alberti, M. Advances in Urban Ecology. Integrating Humans and Ecological Processes in Urban Ecosystems; Springer: Berlin, Germany, 2009. [Google Scholar]
  16. Haase, D.; Nuissl, H. Does urban sprawl drive changes in the water balance and policy? The case of Leipzig (Germany) 1870–2003. Landsc. Urban Plan. 2007, 80, 1–13. [Google Scholar] [CrossRef]
  17. Krampulz, S. Quartalsberichte zur Landesentwicklung: Flächeninanspruchnahme; Institut für Landes-und Stadtentwicklungsforschung und Bauwesen des Landes Nordrhein-Westfalen (ILS NRW): Dortmund, Germany, 2005. [Google Scholar]
  18. Marzluff, J.; Shulenberger, E.; Endlicher, W.; Alberti, M.; Bradley, G.; Ryan, C.; ZumBrunnen, C.; Simon, U. Urban Ecology: An International Perspective on the Interaction between Humans and Nature; Springer: New Yok, NY, USA, 2008. [Google Scholar]
  19. Siedentop, S. Urban sprawl—Verstehen, messen, steuern. DISP 2005, 160, 23–35. [Google Scholar] [CrossRef]
  20. Platt, R.H. Land Use and Society: Geography, Law, and Public Policy; Island Press: Washington, DC, USA, 1996. [Google Scholar]
  21. Halleux, J.M.; Marcinczak, S.; Krabben, E. The adaptive efficiency of land use planning measured by the control of urban sprawl. The cases of the Netherlands, Belgium and Poland. Land Use Policy 2012, 29, 887–898. [Google Scholar] [CrossRef]
  22. Bengston, D.N.; Fletcher, J.; Nelson, K. Public policies for managing urban growth and protecting open space: Policy instruments and lessons learned in the United States. Landsc. Urban Plan. 2004, 69, 271–286. [Google Scholar] [CrossRef]
  23. Bhatta, B.; Saraswati, S.; Bandyopadhyay, D. Urban sprawl measurement from remote sensing data. Appl. Geogr. 2010, 30, 731–740. [Google Scholar] [CrossRef]
  24. Dawkins, C.J.; Nelson, A.C. Urban containment policies and housing prices: An international comparison with implications for future research. Land Use Policy 2002, 19, 1–12. [Google Scholar] [CrossRef]
  25. Kim, J.; Soyoung, P. Simulating the Impacts of the Greenbelt Policy Reform on Sustainable Urban Growth: The Case of Busan Metropolitan Area. J. Korean Soc. Surv. Geodsy Photogramm. Cartogr. 2015, 33, 193–202. [Google Scholar] [CrossRef]
  26. Yokohari, M.; Takeuchi, K.; Watanabe, T.; Yokota, S. Beyond greenbelts and zoning: A new planning concept for the environment of Asian mega-cities. Landsc. Urban Plan. 2000, 47, 159–171. [Google Scholar] [CrossRef]
  27. Korean Wikipidia, 그린벨트 (Greenbelt in Korean). Available online: https://namu.wiki/w/그린벨트 (accessed on 7 January 2017).
  28. Chapin, F.S.; Kaiser, E.J. Urban Land Use Planning, 3rd ed.; University of Illinois Press: Champaign, IL, USA, 1967. [Google Scholar]
  29. Webber, M.M. Explorations into Urban Structure; Philadelphia University Press: Philadelphia, PA, USA, 1964. [Google Scholar]
  30. Harvey, D. The Urban Process under Capitalism. Int. J. Urban Reg. Res. 1978, 2, 101–131. [Google Scholar] [CrossRef]
  31. Färe, R.; Grosskopf, S.; Fukuyama, H. New Directions: Efficiency and Productivity; Springer: New York, NY, USA, 2005. [Google Scholar]
  32. OECD. Environmental Indicators for Agriculture: Volume 3 Methods and Results; OECD PublIcations Service: Paris, France, 2001. [Google Scholar]
  33. Park, S.Y.; Jin, C.G.; Choi, C.L.; Antonino, M. Predicting soil erosion under land-cover area and climate changes using the revised universal soil loss equation. Remote Sens. Agric. Ecosyst. Hydrol. XIII 2011. [Google Scholar] [CrossRef]
  34. Park, S.Y.; Jeon, S.W.; Kim, S.Y.; Choi, C.L. Prediction and comparison of urban growth by land suitability index mapping using GIS and RS in South Korea. Landsc. Urban Plan. 2011, 99, 104–114. [Google Scholar] [CrossRef]
  35. Statistics Korea (Korean Government Official Statistics Sites). Available online: http://kostat.go.kr/portal/eng/index.action/ (accessed on 28 June 2016).
  36. Zhang, N.; Kim, J.D. Measuring sustainability by Energy Efficiency Analysis for Korean Power Companies: A Sequential Slacks-Based Efficiency Measure. Sustainability 2014, 6, 1414–1426. [Google Scholar] [CrossRef]
  37. Kaoru, T. A slacks-based measure of efficiency in data envelopment analysis. Eur. J. Oper. Res. 2001, 130, 498–509. [Google Scholar]
  38. Wang, Q.; Zhao, Z.; Shen, N.; Liu, T. Have Chinese cities achieved the win–win between environmental protection and economic development? From the perspective of environmental efficiency. Ecol. Indic. 2015, 51, 151–158. [Google Scholar] [CrossRef]
  39. Wang, K.; Zhang, P. The Research on Impact Factors and Characteristic of Cultivated Land Resources Use Efficiency-take Henan Province, China as a Case Study. IERI Procedia 2013, 5, 2–9. [Google Scholar] [CrossRef]
Figure 1. The research area in this study: (a) location of South Korea and (b) map of South Korea [34].
Sustainability 09 00079 g001
Figure 2. Trends of ULUEE in Korea during 2006–2013.
Sustainability 09 00079 g002
Table 1. Demographic characteristics of South Korea.
Area
(km2)
Population
(1000 Person)
Population
Growth Rate
(%)
Growth Domestic
Product (100,000 USD)
Farmland Growth Rate (%)Building
Site Growth
Rate (%)
Road Growth Rate (%)
198099,01138,1241.57387,749100100100
199098,73042,8690.991,866,90994113129
200099,46147,0080.846,514,15387137159
200899,82848,6070.3110,239,37784155196
Source: Growth rate of population, GDP, and roads from 1985 to 2008, Statistics Korea [34,35].
Table 2. Descriptive statistics.
VariablesVariable NotationMeasure DescriptionUnits
InputAREABuilt-up aream2
FIXTotal investment in fixed assets103
EM23Number of manufacturing and service industry employees103 Persons
Desirable outputP23Value added in manufacturing industry and service industry107
Undesirable outputCEIndustry chemical emissionsKg/year
WAIndustrial wastewaterTon/Year
CNCities degree of Noise StatusLeq dB (A)
Table 3. Score of ULUEE in Korean cities during 2006–2013.
Citys20062007200820092010201120122013
Seoul1.0000.8971.0001.0001.0001.0001.0001.000
Busan0.4250.4330.4300.4250.4330.4300.4270.418
Daegu0.4720.5050.4990.4850.4960.4970.5020.495
Incheon0.7211.0000.6380.5600.6150.7410.8040.745
Gwangju0.5960.5990.6630.6430.6310.6310.6430.605
Daejeon0.6770.8901.0001.0001.0000.9820.9951.000
Ulsan1.0001.0001.0001.0000.8800.8370.8461.000
Gyeonggi0.3660.4340.4950.5890.6990.8021.0001.000
Gangwon0.6200.6090.5680.5770.5930.5730.5600.587
Chungbuk0.6600.6540.6440.5720.5480.5480.5820.651
Chungnam1.0001.0000.9111.0001.0001.0000.9851.000
Jeonbuk0.5520.5570.5260.5120.5230.4990.4800.470
Jeonnam1.0000.5720.5900.5100.5580.5440.5540.543
Gyeongbuk0.5410.5610.5850.5920.5960.5940.5610.533
Gyeongnam0.3630.3700.3610.3690.3880.3840.3860.383
Jeju1.0001.0001.0001.0001.0001.0001.0001.000
Table 4. Results of the panel data regression for Korean cities.
VariableCoefficientStd. Errort-StatisticProb.
PGDP0.057240.011504.9774370
URB0.0044040.00041210.690890
LCP−0.0678870.016836−4.032180.0001
LUI0.0661110.0095336.935130
Weighted Statistics
R-squared0.939236Mean dependent var1.026964
Adjusted R-squared0.937766S.D. dependent var0.701334
S.E. of regression0.17496Sum squared resid3.795766
Prob(F-statistic)0
Unweighted Statistics
R-squared0.385459Mean dependent var0.692132
Sum squared resid3.919573

