Testing Consumers’ Preferences for Environmental Attributes of Pasta. Insights from an ABR Approach
by
 ,
,
Edi Defrancesco
1,* ,
,
Maria Angela Perito
2,
Irene Bozzolan
1,
Leonardo Cei
3 and
Gianluca Stefani
3 1
Department TESAF, University of Padova, 35020 Legnaro, Italy
2
Faculty of Bioscience and Agro-Food and Environmental Technology, University of Teramo and ALISS, UR1303, INRA, F-94205 Ivry-sur-Seine, France
3
Department DISEI, University of Firenze, 50127 Firenze, Italy
*
Author to whom correspondence should be addressed.
Sustainability 2017, 9(10), 1701; https://doi.org/10.3390/su9101701
Submission received: 28 August 2017
/
Revised: 18 September 2017
/
Accepted: 21 September 2017
/
Published: 22 September 2017
(This article belongs to the Section Economic and Business Aspects of Sustainability)
Abstract
:Consumer appreciation for food environmental attributes has recently gained in importance. The health-related attributes have received less attention in the literature, if organic farming products are excluded. We measure the consumer willingness to pay (WTP) for a traditional Italian product, pasta, when environmental and healthy attributes are added to it in turn. Relying on the prospect theory and on the bundling/unbundling debate, attributes cannot be perceived by consumers in absolute values. Accordingly, we assess if the way in which attributes are presented to consumers influences their WTP by comparing an “unbundling” approach—informing consumers of all product attributes and then subtracting one of them, to a “bundling” approach, progressively adding further attributes to the product’s description. To do this, we administered a questionnaire to a sample of households in North-Central Italy. WTP is elicited using an attribute based referenda format, slightly modified in accordance with our research objectives. The results show that Italian consumers, with the exception of specific subgroups, tend to prefer a traditional pasta product, probably because of both their taste preferences and eating habits. Some evidence emerged of an endowment effect, consumers valuing environmental attributes more when they feel themselves entitled to them.
1. Introduction
In developed countries, food is becoming an ever more complex good in which consumers are looking not only for nutritional characteristics but also for new attributes that define its perceived quality. Among these, two specific categories can be identified, health-related and environmental attributes. Health-related attributes include all those product features perceived by consumers as capable of increasing or safeguarding their health. Environmental attributes refer to product characteristics leading to a lower impact on the environment, for example, through the use of sustainable production processes. Although attempts have been made in the literature to understand the response of consumers to these attributes, authors primarily focus on organic products, while fewer studies consider other food environmental characteristics.
The growing importance of health-related attributes is highlighted by the numerous health claims made by the food industry to increase the perceived healthiness of products [1,2,3]. The level to which consumers attach value to these claims depends on both product attributes and consumer characteristics. For example, on the product side, when it already has a healthy image, healthy claims are usually more readily accepted by consumers [4,5,6]. With respect to consumer characteristics, the groups showing the highest preference for health claims are women [7], especially those with children [8], elderly people [9,10] and well-educated households [11]. Attention paid to health claims varies among countries [2,12], while the influence of consumer income is not univocally ascertained. Despite the overall growing appreciation for healthy products, some barriers still limit consumer preference for these food attributes, i.e., price [8,13], taste and prevailing habits. According to the literature, only the most health-conscious consumer is usually willing to compromise on taste in exchange for healthiness [14]. Moreover, consumers are reluctant to alter their deep-rooted eating habits even when they know of future possible detrimental effects on their health status [15].
As previously mentioned, when exploring consumer appreciation for food environmental attributes, much of the literature focuses on organic farming products [16,17]. Several studies report that consumers often perceive organic food healthier than conventional food [16,18,19], thus linking their higher WTP more for health-related attributes rather than environmental ones [20]. The importance attached to the latter, as already highlighted for the former, varies among consumer groups: it is well recognized that women are more ecologically aware of food products than men [21,22]; a higher income level [23,24,25,26] and education [21,23,26] also raise the likelihood of purchasing environment-friendly food products. There is less agreement in drawing conclusions about the effect of age: some studies report a higher WTP for environmentally friendly products by young people [21,24,25,27,28], while others observe higher WTP levels in older consumers [22,29]. However, despite a certain interest of some consumer subgroups in environmental and ecological topics, leading them to attach a higher value to products presenting such attributes, Lusk et al. [30] emphasise that consumers, overall, do not value environmental outcome enough to justify a price premium, except for organic products. Indeed, it is widely recognized that consumers express more interest in nutritional and healthy food characteristics than in environmental ones [16,18]. This behaviour is probably linked to the intrinsic nature of the two attributes: the former addresses individual and utilitarian needs, while the latter concerns altruistic and society wide issues. Indeed, the former seems to influence consumer decisions about food to a greater extent [20,31].
Strictly correlated with consumer decision-making is the information provided, on which he/she can rely when valuing the single attributes or the product as a whole. It has been found that receiving information about environmental attributes of food products positively affects WTP [32]. However, a recent study conducted by Costanigro et al. [33] reveals that while additional information made available to consumers about health and nutritional characteristics changed their valuation, this does not happen when the product’s environmental impact is considered. Nonetheless, when studying consumer choices, along with the amount of information, the ways in which this is provided could also have a role to play. Drawing on the Lancaster consumer theory [34], which considers economic goods as bundles of attributes, and on Kahneman and Tversky’s prospect theory [35], consumers appreciate products’ attributes not as absolute values, but as gains and losses. In other words, the bundling and unbundling of products and attributes within a product influence consumers’ attitudes towards the value assigned to a bundled good. Specifically, if attributes are perceived as gains, they will have a higher value when considered individually than when bundled. Conversely, losses are less salient when bundled. This has further implications since consumers could react differently depending on whether they feel themselves “entitled” to a certain attribute or characteristic, a phenomenon referred to as “endowment effect” [36], and they might also respond differently to marketing strategies, such as bundling or unbundling of product attributes [37]. This paper aims to analyse consumers’ WTP for both food environmental attributes and health-related ones. To reach this goal, the paper uses a modified version of the attribute-based referenda (ABR) model [38], which has not so far been widely adopted in the literature. In contrast to the traditional experimental design of conditional logit models, in ABR, the bid levels are selected according to common practices used in dichotomous choice contingent valuation formats, which do not necessarily rely on having just a few levels for price attributes in the experimental design. Our case study focuses on pasta, a key food in the Italian diet, and more specifically on the whole-wheat product. The latter is bought by a limited number of consumers (approximately 7%) given that it is less associated with traditional Italian eating habits and many consumers perceive it as having less flavour than traditional pasta [39]. The whole-wheat pasta attributes we considered are health-related, i.e., a positive impact on the glycaemic index and an environmental characteristic linked to an environmentally friendly production method, i.e., optimal site-specific nitrogen fertilisation to reduce water pollution. The research questions we aim to address are the following:
- WTP for environmental attributes
- (a)
- Are consumers willing to pay a price premium for pasta obtained with sustainable production methods?
- (b)
- Is there a difference in WTP between the health-related attribute and the environmental one for the same product?
- Information provision
- (a)
- Does consumer WTP vary depending on the way in which the food attributes are presented to them?
- (b)
- Does any difference exist in the response of consumers to information provided for environmental and healthy attributes?
2. Materials and Methods
In order to elicit WTP, questionnaires were administered by telephone to a random sample of households in the North-Eastern and Central regions of Italy (June–December 2013). Sample selection was done through a two-stage procedure. First, a random set of municipalities was selected in each region. Second, for each municipality, a sample of households was randomly extracted from the telephone directory. During this second stage, in selecting the number of households to include in the sample, the size of the municipality population was taken into account using a proportionality criterion. The questionnaire was administered to 1.566 respondents. The person mainly responsible for food purchase decisions in their family was interviewed (arranging an appointment, when necessary). A pre-test was conducted on 150 households.
The questionnaire was split into 3 sections. The first and the third sections collected information on pasta-eating habits and on family structure, socio-economic characteristics and household attitude towards health and environmental protection. In the second section, two different pasta attributes were described: (i) a health-related attribute—pasta obtained from whole-wheat, which has a lower glycaemic index than refined wheat pasta as it releases glucose more slowly and gradually into the bloodstream and (ii) a pasta attribute linked to public good provision—an environmentally friendly production method based on conservative tillage and precision agriculture (variable nitrogen rate application based on prescription maps and real-time, on-the-go sensors mounted on tractors), which optimises nitrogen fertilization and reduces water pollution. This section aimed to elicit consumer WTP. According to our research goals, we administered a sequence of two different dichotomous choice contingent valuation questions for one or two attributes to four different, randomly selected, subsamples of respondents. The sequence of the two questions varied across the subsamples, according to the elicitation design, which is described later in this section.
The format chosen for WTP elicitation was based on the attribute-based referenda (ABR) model, although some changes were made. The classic ABR format, which is used to elicit WTP for a non-market good, is based on a sequence of dichotomous choices between the status quo and one of several alternatives, defined as a bundle of attributes (Table 1). Each alternative is associated with a bid attribute, whose levels are selected according to common practices in use in dichotomous choice formats. The attributes are given a certain number of levels, which vary according to the experimental design. In Table 1, each alternative would represent a type of product offered to the respondent. The attributes are the environmental and the healthy ones, having two levels each: “present” or “absent” according to their presence in the product alternative. With respect to traditional designs for conditional logit models, ABR experimental design does not necessarily rely on having just a few levels for the price attributes [38].
Following [38], the indirect utility (V) of non-market good j for individual i is a function of a vector of good attributes (Zj) and the price attribute or bid amount (tj):
where β is a vector of preference parameters, λ is the marginal utility of money and eij is a stochastic error. When utility is a linear function of good attributes and e is assumed as normally distributed, we can refer to the standard assumption underpinning the probit estimates for the classical dichotomous choice format. The probability of a Yes answer in a dichotomous choice question between the status quo and the proposed alternative is then given by:
where is the standardised cumulative normal distribution, while b and z are elements of β and Z, respectively. The standard deviation of the error is given by , also defined as the inverse of the scale parameter (μ) of the utility function. Without loss of generality, the utility of the status quo may be set to zero, which leaves us with the probability of Yes responses being a function only of the alternative attributes (and price) levels.
The model may be further complicated by taking into account each respondent’s profile through the introduction of interaction terms between attributes of the good and characteristics of the respondents (W), as is common practice in conditional logit models.
In order to answer to research questions 2a and 2b, i.e., to estimate the impact of the way in which consumers receive information, the full factorial design described in Table 1 was slightly modified. Specifically, we structured the four alternative questionnaires, referring to two different treatments: an adding and a subtracting one.
As shown in Table 2, all questionnaires imply two sequential choices: in the adding treatment, only one attribute was considered (healthy or environmental) while both attributes were proposed simultaneously in the second choice. In the subtracting treatment, both attributes were taken into account in the first choice while the attribute was reduced to just one in the second question. Each choice was associated with a bid representing an offer that the respondent could accept (YES answer) or refuse (NO answer). Bids, with a price premium ranging from 0.10 € to 1.30 € for a 500 g format—the average retail price being 0.80 € for traditional pasta, were randomly assigned to the choice options. Thus, in the adding treatment, the bid level usually increases in the second choice while it is lower in the subtracting one.
For example, in Questionnaire 1 the following questions were asked to the respondent, after having described the two product attributes:
- (1)
- “Are you willing to pay X cents more than the average price of conventional pasta (80 cent for a 500 g format) for whole-wheat pasta showing the above-mentioned beneficial effect on the glycaemic index, if available in the retail shop where you usually buy food?”
- (2)
- “When available, a pasta format characterised by both the healthy attribute and the environmental one—i.e., pasta obtained with a production method which reduces the fertilisers’ water pollution—are you willing to pay Y cents more than the conventional pasta to buy it?”
The sequential choice could lead to a setting in which a certain degree of context dependence emerges naturally. This structure allows us to explore the differences in results, if they exist, switching from a single attribute to a complete version of the product and on the reverse path, thus taking into account the bundling-unbundling debate [37].
Data have a panel structure, with two choices (j = 1, 2) for each respondent i, and are analysed through a random effect probit model (We estimated a random effect probit to avoid the issue of incidental parameters whereby estimation of fixed effects along with explanatory variable parameters leads to inconsistent estimates of the parameters of explanatory variables [40] (p. 612)), estimated both on the entire dataset and separately for the two treatments. Unlike the cross sectional homologous model, the random effect model specifies the error term, eij, of Equation (1) as:
with the assumption that u is normally distributed and uncorrelated with the independent variables (X = [Z,t,W]). If we set to unit as in the classical probit models, then the correlation between the error terms of the same individual is given by:
Conditioned on the common ui, the errors eij are independent, and the contribution to the likelihood of the observed choices by the individual i is given by:
where y is equal to 1 when the answer to the referendum question is YES and equal to zero otherwise.
In our model specification, three covariates have been included: (i) “whole-wheat”, expressing the household’s whole-wheat consumption habit, (1 = frequent or occasional consumer, 0 otherwise); (ii) “environmental”, expressing household’s environmental attitude; (iii) subjective wellbeing to assess the second she/he was asked to answer a set of nine questions on environmental issues. The environmental attitude of each respondent is expressed by the sum of his/her rating of the statements, adapting the approach proposed by Grunert and Juhl [41]; subjective wellbeing (“wealthy”) is considered a proxy of the family income level. Due to the high percentage of refusal to answer a direct question about family income during the pre-test survey, the respondent was asked to classify the household income as “above average”, “normal” or “below average”, as suggested in the literature [42].
To consider possible inequality in covariate effects and heteroskedasticity across the adding and subtracting treatments, a sequential test on the joint hypothesis of equality of parameters and error variance was performed following the rescaling approach proposed by Haab, Huang and Whitehead [43].
As we are particularly interested in the possible difference between the two treatments, the null hypothesis is equality of both regression parameters and standard deviation for the two conditions, H0:
Since the scale parameters are unidentifiable under the two different conditions, a sequential testing procedure is adopted following Swait and Louviere [44] and Haab, Huang and Whitehead [43]. First, the equality of the regression parameter is tested, allowing standard deviation to differ:
If the previous test fails to be rejected, we proceed with testing the equality of standard deviations:
H0A implies that the standard deviation parameters σa and σs can assume any value. To address inequality in these parameters, σa is normalised to 1, and a relative scale factor µ is defined as the ratio of the standard deviation parameter for the adding treatment on the scale parameter for the subtracting treatment data (µ = σa/σs). The relative scale factor is estimated using a one-dimensional grid search over possible values of µ to maximise the likelihood of the probit on the data matrix (under the H0A hypothesis):
Once a value for µ is obtained, estimation under H1A is achieved by estimating a probit on the data matrix scaled by the µ, which maximises the likelihood. The alternative of inequality of parameters with no restriction on scale is estimated by running an independent probit on the adding and subtracting treatment data. A standard likelihood ratio test is then used to test the hypothesis. If H0A is rejected, then H0 is also rejected, and the procedure stops. If H0A cannot be rejected, we proceed to testing H0B by comparing the original (un-scaled) model with the rescaled model both estimated on the whole sample. We also considered the issue of possible correlation between the ui and the independent variables estimating a Chamberlain type random effect model [40] (p. 616) whereby the random effects are allowed to be linearly dependent on the group means of the independent variables . The single individual contribution to the likelihood now becomes:
which can be estimated simply by adding the group (in our case respondent) means of the X variables among the regressors. A Wald test on the joint hypothesis that the are zero can be performed to test the absence of correlation between random effect and explanatory variables.
Finally, the assumption of normality of random effects can be relaxed following the approach of Heckman and Singer [45] that approximates the distribution of u with a discrete multinomial distribution with Q points of support:
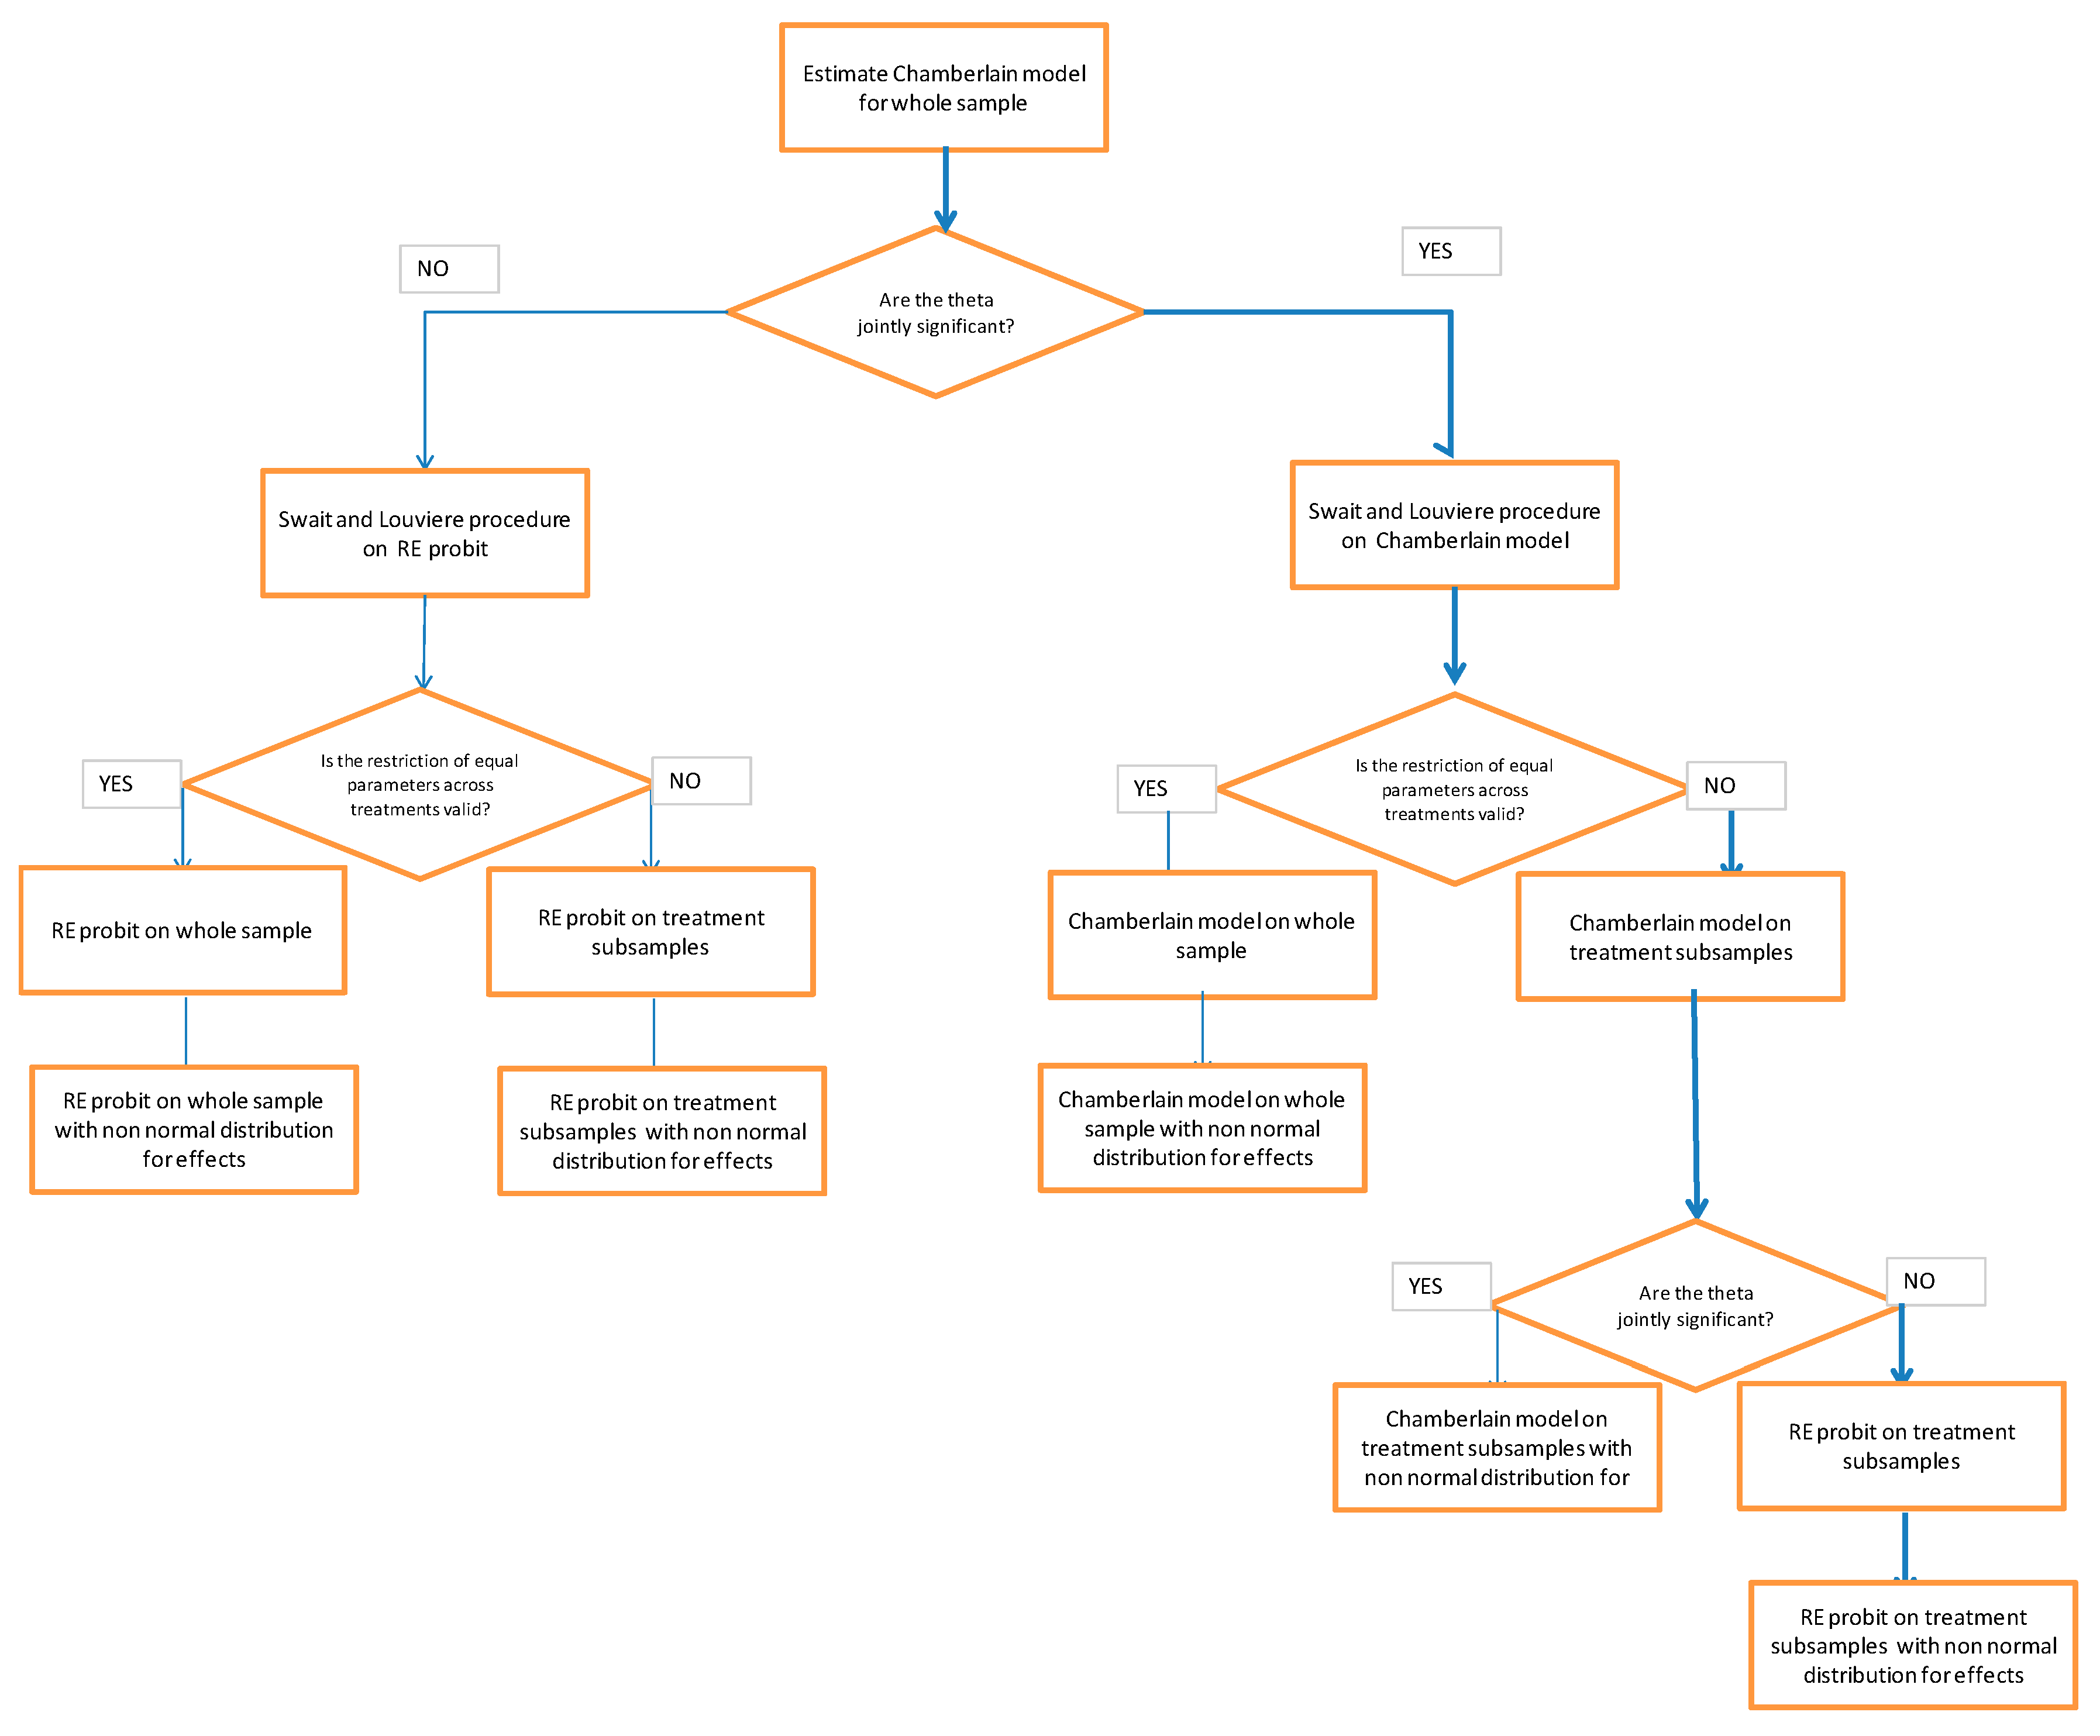
with 0 Pq ≤ 1, , q = 1, 2, …, Q. The parameters of such distribution (Pq and Uq) can be estimated with a non parametric maximum likelihood estimator [46]. Summing up, the overall estimation strategy we followed is illustrated in Figure 1 below:
Pr(u = Uq) = Pq
3. Results
Overall, the main person responsible for food purchase decisions is female (77.5%) and 58 years old, on average. Of the respondents, 37% have a high school diploma and 14.8% have a university degree. The mean family size is 2.7. Household income is evaluated as “above average” or “normal” by 45.9% (the “wealthy” variable in the model). As expected, pasta is eaten at home at least three times per week in 93.9% of families.
However, only a small proportion of families (6.7%) are frequent consumers of whole-wheat pasta, an additional 24% eat it occasionally, while the majority of households do not buy this format as they consider it to have less flavour than traditional pasta. The “environmental attitude” of each individual, expressed as the sum of his/her ratings for the statements, is 30.9 on average (standard deviation 5.89, min 11, max 44). Overall, the share of positive answers is 35% for the first proposed bid, 29% for the second, and is higher in the adding than in the subtracting treatment. Table 3 shows some descriptive statistics for each sub-sample.
Table 4 presents the results for the random effect and Chamberlain type probit models estimated based on the whole sample. Noticeably, the beta coefficient of the two models is not comparable since in the first case we estimate the effects of changing xijt on Vij but holding the time average fixed while in the latter we are estimating the overall impact of xijt.
The joint Wald test of equality to zero of all theta parameters rejects the null hypothesis, so we maintain the Chamberlain model for the subsequent test of the Sawait and Louviere procedure. The Likelihood ratio test of H0A strongly rejects the hypothesis of equality of parameters across “adding” and “subtracting” treatments. Therefore, we separately analyse the two treatments after having checked again for the correlation of the random effects with the explanatory variables (Table 5).
This time the test indicates that we cannot reject the hypothesis that the u is uncorrelated with the explanatory variables. Thus, we retain the classic RE probit for each treatment subsample as working model. The results of these models with either normal or non-normal distribution (NPLM estimator) for the random effects are presented in Table 6. Overall, no major differences are observed between the two estimators. However, the NPLM shows higher Log Likelihood and the discrete distribution, and the ui appears quite asymmetric.
As far as the interpretation of results is concerned, some common features emerge across treatment. The bid coefficient is, as expected, negative, suggesting the usual inverse relationship between price and consumer demand. The environmental attribute shows a negative significant coefficient as does the healthy attribute. Overall, consumers are not only unwilling to pay more for pasta products with beneficial environmental attributes and, to a lesser degree, health effects, but, as the negative coefficients suggest, they firmly prefer the traditional pasta.
As stated by some respondents, whole-wheat pasta, which has a lower glycaemic index than traditional pasta, is often perceived as tasteless when compared to the latter. However, a high positive coefficient is observed for the interaction term between the healthy attribute and the whole-wheat pasta consumption habit (Here, we are interested in the impact of attributes and respondents characteristics on the latent variable underlying the observed choices (the indirect utility) ceteris paribus. Thus, the overall impact of the healthy attribute for a consumer of whole wheat pasta is given by 1.67 = −1.44 + 3.11 [47] (p. 60)); while the effect of consolidated eating habits prevail across the entire sample, whole-wheat pasta consumers express a positive WTP for the healthy attribute, the loss of taste being far less important to them. Similarly, the environmental attribute is only valued among some consumer sub-groups: people who already eat whole-wheat pasta, wealthier families and, as expected, consumers showing a greater awareness of environmental protection.
Several differences are also observable between the two treatment probit. While in the “adding” treatment, the model intercept is positive, the reverse holds for the subtracting one. This is the result of a higher share of NO answers in the “subtracting” treatment, i.e., of a greater consumer refusal to accept the proposed bid. The substantive difference is for the healthy attribute, whose coefficient passes from a negative to a still negative, but with a lower value or even no longer significant according to the RE model, signalling a higher value attached to this product characteristic when it is offered in the first choice and then excluded in the second. For the environmental attribute, while only very small and not conclusive differences are observed between the two treatments—both in the overall coefficient and in the one for wealthy consumers—the environmentally aware consumer coefficient nearly doubles passing from the “adding” to “subtracting” model. As in the case of the healthy attribute, consumers seem to attach more value to the environmentally friendly method of wheat production when this attribute characterizes pasta in the first proposed choice, whereas it is removed from the second. The opposite is observed for the interaction coefficient between the environmental attribute and the whole-wheat pasta consumers’ subgroup, which loses its statistical significance in the subtracting treatment.
Table 7 reports the estimated mean WTP in different consumer sub-groups for both models. WTP is calculated as the ratio of derivatives of the attribute of interest (possibly including interaction term) over the derivative of the cost, that is the BID variable [47] (p. 379). Estimates based on both RE probit and the NPLM estimator are reported revealing no major differences between the two. We used the delta method [46] (p. 1083) to estimate the standard error and identify statistical significance at 5%. The results confirm the prevailing role played by taste and eating habits in WTP for both attributes expressed by the average consumer. Only specific segments of consumers (whole wheat pasta) are willing to pay positive amounts for proposed pasta and only for the healthy format. It is noteworthy how information provided influences the WTP with the unbundling framing triggering higher WTP for this attribute.
4. Discussion
This study addresses the issue of introducing environmental attributes in food products by offering households a specific type of pasta, a traditional, deep-rooted, Italian product. The aims are highlighted by the four research questions presented in the introduction section, referring to our two main objectives. First, the estimation of consumer willingness to pay a price premium for the environmental attribute, comparing it to his/her WTP for the health-related one. Second, the role played by the “unbundling or bundling” approach to information provision in consumer WTP for food attributes. The former informs consumers of all product attributes and then subtracts one of these, while the latter progressively adds further attributes to the description of the product.
Overall, households are not willing to spend more for products presenting positive environmental characteristics as well as healthy attributes. This general consumer reluctance to change eating habits in favour of innovative products can be explained by two reasons. For the environmental attribute, the average consumer is unwilling to pay for environmental public good provision through higher food prices. When health-related attributes are considered, taste and deep-rooted eating habits are the main factors leading to traditional pasta being preferred to the whole-wheat format. These findings are in line with papers highlighting the prevailing influence of hedonic factors, with respect to other food characteristics, in driving consumer decisions [1,13,14,15].
However, positive attitudes can nonetheless be observed for specific subgroups of consumers. Wealthy consumers, as found in other recent studies [23,24,25,26], appreciate the use of sustainable production methods when they make their food choices. Similarly, respondents already eating whole-wheat pasta appreciate the healthy attribute. The latter has probably already passed the hedonic factors barrier, linked to taste and habits, which constitute, along with price, the major limit to the diffusion of innovative food attributes. In light of these results, moving a wider share of consumers to a more environmentally friendly and healthier diet, at least when considering basic foodstuffs, will require a major effort in terms of marketing campaigns and awareness arising mechanisms.
Addressing the second focus area questions, the use of the modified ABR model, introducing an “adding” and a “subtracting” treatment, allows us to draw some conclusions on how a difference in the presentation of attributes modifies consumer WTP. Consistent with the prospect theory, our findings suggest that the approach used when providing information—i.e., unbundling (beginning by bidding on a complete good with both attributes) or single-attribute—influences consumer WTP for food attributes. In other words, when faced with new product attributes, consumers appear to evaluate each of them individually, and they appear to place a higher value on an attribute when the information is given within an attribute-subtracting context than in an attribute-adding one. This result is remarkable among environmentally aware consumers valuing the environmental attribute, when, in a subtracting context, they perceive the change in the second choice as a loss from their reference position (the first option) incurring some degree of endowment effect.
This suggests that the evaluation of consumer WTP depends on the context, so the decision to use an “adding” or a “subtracting” treatment as the “right” method for measuring has to be made taking the context into account. Evidence of an endowment effect is observed even for the healthy attribute, which passes, when switching from the adding to the subtracting treatment, from a negative coefficient to a non-significant one. Moreover, the higher percentage of NO answers observed in the subtracting treatment confirms the propensity of consumers not to accept a loss in some attributes in the second choice.
The difference between the two treatments does not always occur in the other variables or, when it does, it is not sufficient to draw stable conclusions. Further studies shedding a clearer light on the topic would thus be desirable since the implications of the presence of such effects could be important in several fields, such as research, marketing and policy. In fact, if our evidence of an endowment effect is confirmed, concerns would arise about which of the suggested methods (the adding or subtracting one) gives the “right” WTP measure. Indeed, for both policymakers and food companies, understanding the level of consumers’ anchoring to their perceived reference point/product would be extremely useful in designing policies as well as marketing strategies.
Acknowledgments
This research was carried out as part of a multidisciplinary project AGER_GRANO DURO, grant n. 2010-0278.
Author Contributions
Edi Defrancesco and Maria Angela Perito conceived and designed the survey; Maria Angela Perito and Irene Bozzolan performed the telephone survey; Gianluca Stefani and Irene Bozzolan analysed the data; Edi Defrancesco, Maria Angela Perito, Gianluca Stefani and Leonardo Cei wrote the paper.
Conflicts of Interest
The authors declare no conflict of interest.
References
- Lily, M.; Roininen, K.; Honkapaa, K. Factors influencing consumers’ willingness to use beverages and ready-to-eat frozen soups containing oat beta-glucan in Finland, France and Sweden. Food Qual. Preference 2007, 18, 242–255. [Google Scholar] [CrossRef]
- Saba, A.; Vassallo, M.; Sheperd, R. Country-wise differences in perception of health-related messages in cereal-based food products. Food Qual. Preference 2010, 21, 385–393. [Google Scholar] [CrossRef]
- Van Trijp, H.C.M.; van der Lans, I.A. Consumer perceptions of nutrition and health claims. Appetite 2007, 48, 305–324. [Google Scholar] [CrossRef] [PubMed]
- Bech-Larsen, T.; Grunert, K.G. The perceived healthiness of functional foods: A conjoint study of Danish, Finnish and American consumers’ perception of functional foods. Appetite 2003, 40, 9–14. [Google Scholar] [CrossRef]
- Dean, M.; Shepherd, R.; Arvola, A. Consumer perception of healthy cereal products and production methods. J. Cereal Sci. 2007, 46, 188–196. [Google Scholar] [CrossRef]
- Siegrist, M.; Stampfli, N.; Kastenholz, H. Consumers’ willingness to buy functional foods. The influence of carrier, benefit and trust. Appetite 2008, 51, 526–529. [Google Scholar] [CrossRef] [PubMed]
- Grunert, K.G.; Lähteenmaki, L.; Boztug, Y.; Martinsdóttir, E.; Øydis, U.; Åström, A.; Lampila, P. Perception of health claims among Nordic consumers. J. Consum. Policy 2009, 32, 269–287. [Google Scholar] [CrossRef]
- Lalor, F.; Madden, C.; McKenzie, K.; Wall, P.G. Health claims on foodstuffs: A focus group study of consumer attitudes. J. Funct. Foods 2011, 3, 56–59. [Google Scholar] [CrossRef]
- Honkanen, P.; Frewer, L. Russian consumers’ motives for food choice. Appetite 2009, 52, 363–371. [Google Scholar] [CrossRef] [PubMed]
- Ginon, E.; Lohèac, Y.; Martin, C.; Combris, P.; Issanchou, S. Effect of fibre information on consumer willingness to pay for French baguettes. Food Qual. Preference 2009, 20, 343–352. [Google Scholar] [CrossRef]
- Roosen, J.; Marette, S.; Blanchemanche, S.; Vereger, P. Does health information matter for modifying consumption? A field experiment measuring the impact of risk information on fish consumption. Rev. Agric. Econ. 2009, 31, 2–20. [Google Scholar] [CrossRef]
- Van Wezemael, L.; Caputo, V.; Nayga, R.M.; Chryssochoidis, G.; Verbeke, W. European consumer preferences for beef with nutrition and health claims: A multi-country investigation using discrete choice experiments. Food Policy 2014, 44, 167–176. [Google Scholar] [CrossRef]
- Carillo, E.; Varela, P.; Salvado, A.; Fiszman, S. Main factors underlying consumers’ food choice: A first step for the understanding of attitudes toward “healthy eating”. J. Sens. Stud. 2011, 26, 85–95. [Google Scholar] [CrossRef]
- Sabbe, S.; Verbeke, W.; Deliza, R.; Matta, V.; Van Damme, P. Effect of a health claim and personal characteristics on consumer acceptance of fruit juices with different concentrations of açaì (Euterpe oleracea Mart.). Appetite 2009, 53, 84–92. [Google Scholar] [CrossRef] [PubMed]
- Williamson, A.R.; Hunt, A.E.; Pope, J.F.; Tolman, N.M. Recommendations of dieticians for overcoming barriers to dietary adherence in individuals with diabetes. Diabetes Educ. 2000, 26, 272–278. [Google Scholar] [CrossRef] [PubMed]
- Grankvist, G.; Biel, A. The importance of beliefs and purchase criteria in the choice of eco-labeled food products. J. Environ. Psychol. 2001, 21, 405–410. [Google Scholar] [CrossRef]
- Yue, C.; Campbell, B.; Hall, C.; Behe, B.; Dennis, J.; Khachatryan, H. Consumer preference for sustainable attributes in plants: Evidence for experimental auctions. Agribus. Int. J. 2016, 32, 222–235. [Google Scholar] [CrossRef]
- Magnusson, M.K.; Arvola, A.; Koivisto Hursti, U.K.; Åberg, L.; Sjoden, P.O. Choice of organic foods is related to perceived consequences for human health and to environmentally friendly behaviour. Appetite 2003, 40, 109–117. [Google Scholar] [CrossRef]
- Hughner, R.S.; McDonagh, P.; Prothero, A.; Shultz, C.J., II; Stanton, J. Who are organic food consumers? A complication and review of why people purchase organic food. J. Consum. Behav. 2007, 6, 94–110. [Google Scholar] [CrossRef]
- Nasir, V.A.; Karakaya, F. Underlying motivations of organic food purchase intentions. Agribus. Int. J. 2014, 30, 290–308. [Google Scholar] [CrossRef]
- Brècard, D.; Hlaimi, B.; Lucas, S.; Perraudeau, Y.; Salladarrè, F. Determinants of demand for green products: An application to eco-label demand for fish in Europe. Ecol. Econ. 2009, 69, 115–125. [Google Scholar] [CrossRef]
- Cholette, S.; Özluk, Ö.; Özşen, L.; Ungson, G.R. Exploring purchasing preferences: Local and ecologically labelled foods. J. Consum. Mark. 2013, 30, 563–572. [Google Scholar] [CrossRef]
- Do Paço, A.M.F.; Barata Raposo, M.L. Green consumer market segmentation: Empirical findings from Portugal. Int. J. Consum. Stud. 2010, 34, 429–436. [Google Scholar] [CrossRef]
- Karipidis, P.; Sartzetakis, E. Firm’s decision based on consumers’ choices in ecocertified food markets. Econ. Res. Int. Spec. Issue 2013, 2013, 920164. [Google Scholar] [CrossRef]
- Yu, X.; Gao, Z.; Zeng, Y. Willingness to pay for the “Green food” in China. Food Policy 2014, 45, 80–87. [Google Scholar] [CrossRef]
- Zhu, Q.; Li, Y.; Geng, Y.; Qi, Y. Green food consumption intention, behaviors and influencing factors among Chinese consumers. Food Qual. Preference 2013, 28, 279–286. [Google Scholar] [CrossRef]
- Royne, M.B.; Levy, M.; Martinez, J. The public health implications of consumers’ environmental concern and their willingness to pay for an eco-friendly product. J. Consum. Aff. 2011, 45, 329–343. [Google Scholar] [CrossRef]
- Berghoef, N.; Dodds, R. Potential for sustainability eco-labeling in Ontario’s wine industry. Int. J. Wine Bus. Res. 2011, 23, 298–317. [Google Scholar] [CrossRef]
- Barber, N. “Green” wine packaging: Targeting environmental consumers. Int. J. Wine Bus. Res. 2010, 22, 423–444. [Google Scholar] [CrossRef]
- Lusk, J.L.; Schroeder, T.C.; Tonsor, G.T. Distinguishing beliefs from preferences in food choice. Eur. Rev. Agric. Econ. 2014, 41, 627–655. [Google Scholar] [CrossRef]
- Schmit, T.M.; Bradley, J.R.; Taber, J. Consumer valuation of environmental friendly production practices in wines, considering asymmetric information and sensory effects. J. Agric. Econ. 2013, 64, 483–504. [Google Scholar] [CrossRef]
- Marette, S.; Messèan, A.; Millet, G. Consumers’ willingness to pay for eco-friendly apples under different labels: Evidences from a lab experiment. Food Policy 2012, 37, 151–161. [Google Scholar] [CrossRef]
- Costanigro, M.; Deselnicu, O.; Kroll, S. Food beliefs: Elicitation, estimation and implication of labeling policy. J. Agric. Econ. 2015, 66, 108–128. [Google Scholar] [CrossRef]
- Lancaster, K.J. A new approach to consumer theory. J. Political Econ. 1966, 74, 132–157. [Google Scholar] [CrossRef]
- Kahneman, D.; Tversky, A. Prospect Theory: An analysis of decision under risk. Econometrica 1979, 47, 263–292. [Google Scholar] [CrossRef]
- Thaler, R. Toward a positive theory of consumers choice. J. Econ. Behav. Organ. 1980, 1, 39–60. [Google Scholar] [CrossRef]
- Johnson, M.D.; Herrmann, A.; Bauer, H.H. The effects of price bundling on consumer evaluations of product offerings. Int. J. Res. Mark. 1999, 16, 129–142. [Google Scholar] [CrossRef]
- Holmes, T.P.; Boyle, K.J. Dynamic learning and context-dependence in sequential, attribute-based, stated-preference valuation questions. Land Econ. 2005, 81, 114–126. [Google Scholar] [CrossRef]
- ISMEA. Rapporto Sui Consumi Alimentari; ISMEA: Rome, Italy, 2015. [Google Scholar]
- Wooldridge, J.M. Econometric Analysis of Cross Section and Panel Data; The MIT Press: Cambridge, MA, USA, 2010. [Google Scholar]
- Grunert, S.C.; Juhl, H.J. Values, environmental attitudes and buying of organic food. J. Econ. Psychol. 1995, 16, 39–62. [Google Scholar] [CrossRef]
- Gasiorowska, A. The relationship between objective and subjective wealth is moderated by financial control and mediated by money anxiety. J. Econ. Psychol. 2014, 43, 64–74. [Google Scholar] [CrossRef]
- Haab, T.; Huang, J.; Whitehead, J. Are hypothetical referenda incentive compatible? A comment. J. Political Econ. 1999, 107, 186–196. [Google Scholar] [CrossRef]
- Swait, J.; Louviere, J. The role of the scale parameter in the estimation and comparison of multinomial logit models. J. Mark. Res. 1993, 30, 305–314. [Google Scholar] [CrossRef]
- Heckman, J.J.B.; Singer, B. A Method for Minimizing the Impact of Distributional Assumptions in Econometric Models for Duration Data. Econometrica 1984, 52, 271–320. [Google Scholar] [CrossRef]
- Grilli, L.; Rampichini, C. A Review of Random Effects Modellingusing Gllamm in Stata; Center for Multilevel Modelling, University of Bristol: Bristol, UK, 2006. [Google Scholar]
- Greene, W.H. Econometric Analysis; Pearson: Boston, MA, USA, 2012. [Google Scholar]
Figure 1.
Estimation strategy.

Table 1.
ABR format full factorial design.
| Alternative | Environmental Attribute | Healthy Attribute |
|---|---|---|
| Status quo | Absent | Absent |
| Environmental | Present | Absent |
| Healthy | Absent | Present |
| Both | Present | Present |
Table 2.
Administered questionnaire alternatives.
| Questionnaire ID | Attribute(s) in the First Choice | Attribute(s) in the Second Choice | Treatment |
|---|---|---|---|
| 1 | Healthy | Environmental and Healthy | Adding |
| 2 | Environmental | Environmental and Healthy | Adding |
| 3 | Environmental and Healthy | Healthy | Subtracting |
| 4 | Environmental and Healthy | Environmental | Subtracting |
Table 3.
Four sub-samples descriptive statistics.
| Que ID 1 | Que ID 2 | Que ID 3 | Que ID 4 | Total | |
|---|---|---|---|---|---|
| N of respondents | 391 | 393 | 391 | 391 | 1566 |
| BID1 | |||||
| Mean | 0.58 | 0.59 | 0.78 | 0.77 | 0.68 |
| Standard dev. | 0.34 | 0.34 | 0.35 | 0.34 | 0.36 |
| % Yes | 33.6 | 42.2 | 33.5 | 30.7 | 35.1 |
| BID2 | |||||
| Mean | 0.63 | 0.65 | 0.69 | 0.67 | 0.66 |
| Standard dev. | 0.33 | 0.34 | 0.35 | 0.35 | 0.34 |
| % Yes | 31.7 | 28.5 | 29.7 | 26.9 | 29.2 |
| Whole-wheat pasta consumers (%) | 30.7 | 29.2 | 33.3 | 29.7 | 30.7 |
| Environmental attitude (1) | 30.7 | 30.8 | 31.3 | 30.9 | 30.9 |
| Wealthy households (%) | 49.6 | 44.0 | 47.5 | 42.5 | 45.9 |
(1) Environmental attitudes are based on 9 statements, each of which was rated using a five-point Likert scale ranging from “strongly disagree” to “strongly agree”.
Table 4.
Whole sample probit models.
| Variable | Chamberlain Probit | RE Probit | ||
|---|---|---|---|---|
| Coefficient | p-Value | Coefficient | p-Value | |
| beta | ||||
| BID | −22.71 | 0.000 | −2.39 | 0.000 |
| Environmental attribute | 0.13 | 0.889 | −2.51 | 0.000 |
| Healthy attribute | 2.31 | 0.016 | −1.44 | 0.001 |
| Healthy*Whole-wheat | 3.31 | 0.000 | 3.11 | 0.000 |
| Environmental*Whole-wheat | 0.00 | 0.993 | 0.85 | 0.000 |
| Environmental*Environmental attitude | 0.04 | 0.373 | 0.09 | 0.000 |
| Healthy*Environmental attitude | −0.13 | 0.002 | 0.00 | 0.945 |
| Environmental*Wealthy | 1.12 | 0.015 | 0.76 | 0.000 |
| Healthy*Wealthy | 0.25 | 0.508 | 0.16 | 0.445 |
| Constant | 0.17 | 0.466 | ||
| theta | ||||
| BID | 18.97 | 0.000 | ||
| Environmental attribute | −4.49 | 0.034 | ||
| Healthy attribute | −8.70 | 0.001 | ||
| Healthy*Whole-wheat | 4.41 | 0.002 | ||
| Environmental*Whole-wheat | 1.63 | 0.107 | ||
| Environmental*Environmental attitude | 0.09 | 0.291 | ||
| Healthy*Environmental attitude | 0.27 | 0.007 | ||
| Environmental*Wealthy | 0.77 | 0.420 | ||
| Healthy*Wealthy | −0.42 | 0.662 | ||
| Ln σ2u | 3.56 | 2.15 | ||
| Rho | 0.97 | 0.90 | ||
| Log L | −1218.59 | −1291.12 | ||
| N | 1566 | 1566 | ||
| Tests | ||||
| Random effect vs. simple probit | ||||
| LR test of rho = 0 [Chi2(1)] | 717 | p = 0.00 | 616 | p = 0.00 |
| u uncorrelated with X | ||||
| Wald test of joint hypothesis t = 0 [Chi2(9)] | 22.44 | p = 0.00 | ||
| Swait and Louviere procedure | ||||
| LR Test of H0A (scale factor 0.81) [Chi2(19)] | 54 | p = 0.00 | ||
Table 5.
Specification test for probit over treatment subsamples.
| Statistic | Adding Treatment | Subtracting Treatment | ||
|---|---|---|---|---|
| Chamberlain Probit | RE Probit | Chamberlain Probit | RE Probit | |
| Ln σ2u | 3.74 | 2.24 | 4.12 | 2.58 |
| Rho | 0.98 | 0.9 | 0.98 | 0.93 |
| Log L | −593.1 | −641.2 | −588.7 | −621.7 |
| N | 784 | 782 | ||
| Test | ||||
| u uncorrelated with X | ||||
| Wald test of joint hypothesis θ = 0 [Chi2(9)] | 12.18 | p = 0.20 | 5.95 | p = 0.74 |
Table 6.
Sub-sample probit.
| Variable | Adding Treatment | Subtracting Treatment | ||||||
|---|---|---|---|---|---|---|---|---|
| NPLM | RE Probit | NPLM | RE Probit | |||||
| Coeff | p-Value | Coeff | p-Value | Coeff | p-value | Coeff | p-Value | |
| BID | −2.35 | 0.000 | −2.50 | 0.000 | −2.18 | 0.000 | −2.93 | 0.000 |
| Environmental attribute | −2.60 | 0.000 | −2.54 | 0.000 | −2.57 | 0.001 | −2.90 | 0.000 |
| Healthy attribute | −2.28 | 0.000 | −2.25 | 0.001 | −1.41 | 0.023 | −0.79 | 0.259 |
| Healthy*Whole-wheat | 3.22 | 0.000 | 3.39 | 0.000 | 3.26 | 0.000 | 3.61 | 0.000 |
| Environmental*Whole-wheat | 1.22 | 0.000 | 1.05 | 0.001 | 0.67 | 0.043 | 0.79 | 0.029 |
| Environmental*Environmental attitude | 0.06 | 0.005 | 0.07 | 0.017 | 0.11 | 0.001 | 0.13 | 0.000 |
| Healthy*Environmental attitude | −0.01 | 0.787 | −0.01 | 0.779 | 0.04 | 0.131 | 0.00 | 0.872 |
| Environmental*Wealthy | 0.73 | 0.004 | 0.91 | 0.003 | 0.93 | 0.001 | 0.83 | 0.017 |
| Healthy*Wealthy | −0.03 | 0.891 | 0.10 | 0.760 | −0.07 | 0.812 | 0.27 | 0.438 |
| Constant | 1.64 | 0.000 | 1.18 | 0.001 | −1.02 | 0.021 | −0.97 | 0.018 |
| Mass points of ui distribution | ||||||||
| U1 | −2.75 | P = 0.34 | −3.64 | p = 0.34 | ||||
| U2 | −1.16 | p = 0.01 | 0.21 | p = 0.26 | ||||
| U3 | 0.41 | p = 0.17 | 1.64 | p = 0.27 | ||||
| U4 | 0.42 | p = 0.31 | 5.7 | p = 0.13 | ||||
| U5 | 4.83 | p = 0.15 | ||||||
| Ln σ2u | 2.24 | 2.58 | ||||||
| Rho | 0.90 | 0.93 | ||||||
| Log L | −628 | −641 | −610 | −622 | ||||
| N | 784 | 782 | ||||||
Table 7.
Adding and subtracting model-estimated mean WTP.
| Variable | Adding Treatment (1) | Subtracting Treatment (1) | ||||||
|---|---|---|---|---|---|---|---|---|
| NPLM | p-Value | RE Probit | p-Value | NPLM | p-Value | RE Probit | p-Value | |
| Environmental attribute | −1.11 | 0.000 | −1.02 | 0.002 | −1.18 | 0.000 | −0.99 | 0.001 |
| Healthy attribute | −0.97 | 0.000 | −0.9 | 0.005 | −0.65 | 0.032 | −0.27 | 0.266 |
| Environmental*Whole-wheat | −0.59 | 0.023 | −0.6 | 0.053 | −0.87 | 0.005 | −0.72 | 0.011 |
| Healthy*Whole-wheat | 0.40 | 0.120 | 0.49 | 0.124 | 0.85 | 0.013 | 1.06 | 0.002 |
| Environmental*Wealthy | −0.80 | 0.003 | −0.65 | 0.031 | −0.75 | 0.012 | −0.71 | 0.013 |
| Healthy*Wealthy | −0.66 | 0.012 | −0.54 | 0.090 | −0.22 | 0.479 | −0.18 | 0.954 |
(1) Significant WTP at 5% level in bold.
© 2017 by the authors. Licensee MDPI, Basel, Switzerland. This article is an open access article distributed under the terms and conditions of the Creative Commons Attribution (CC BY) license (http://creativecommons.org/licenses/by/4.0/).
Share and Cite
MDPI and ACS Style
Defrancesco, E.; Perito, M.A.; Bozzolan, I.; Cei, L.; Stefani, G. Testing Consumers’ Preferences for Environmental Attributes of Pasta. Insights from an ABR Approach. Sustainability 2017, 9, 1701. https://doi.org/10.3390/su9101701
AMA Style
Defrancesco E, Perito MA, Bozzolan I, Cei L, Stefani G. Testing Consumers’ Preferences for Environmental Attributes of Pasta. Insights from an ABR Approach. Sustainability. 2017; 9(10):1701. https://doi.org/10.3390/su9101701
Chicago/Turabian StyleDefrancesco, Edi, Maria Angela Perito, Irene Bozzolan, Leonardo Cei, and Gianluca Stefani. 2017. "Testing Consumers’ Preferences for Environmental Attributes of Pasta. Insights from an ABR Approach" Sustainability 9, no. 10: 1701. https://doi.org/10.3390/su9101701
Note that from the first issue of 2016, this journal uses article numbers instead of page numbers. See further details here.